
Examination of Concrete Canvas under Quasi-Realistic Loading by Computed Tomography
 , , , and
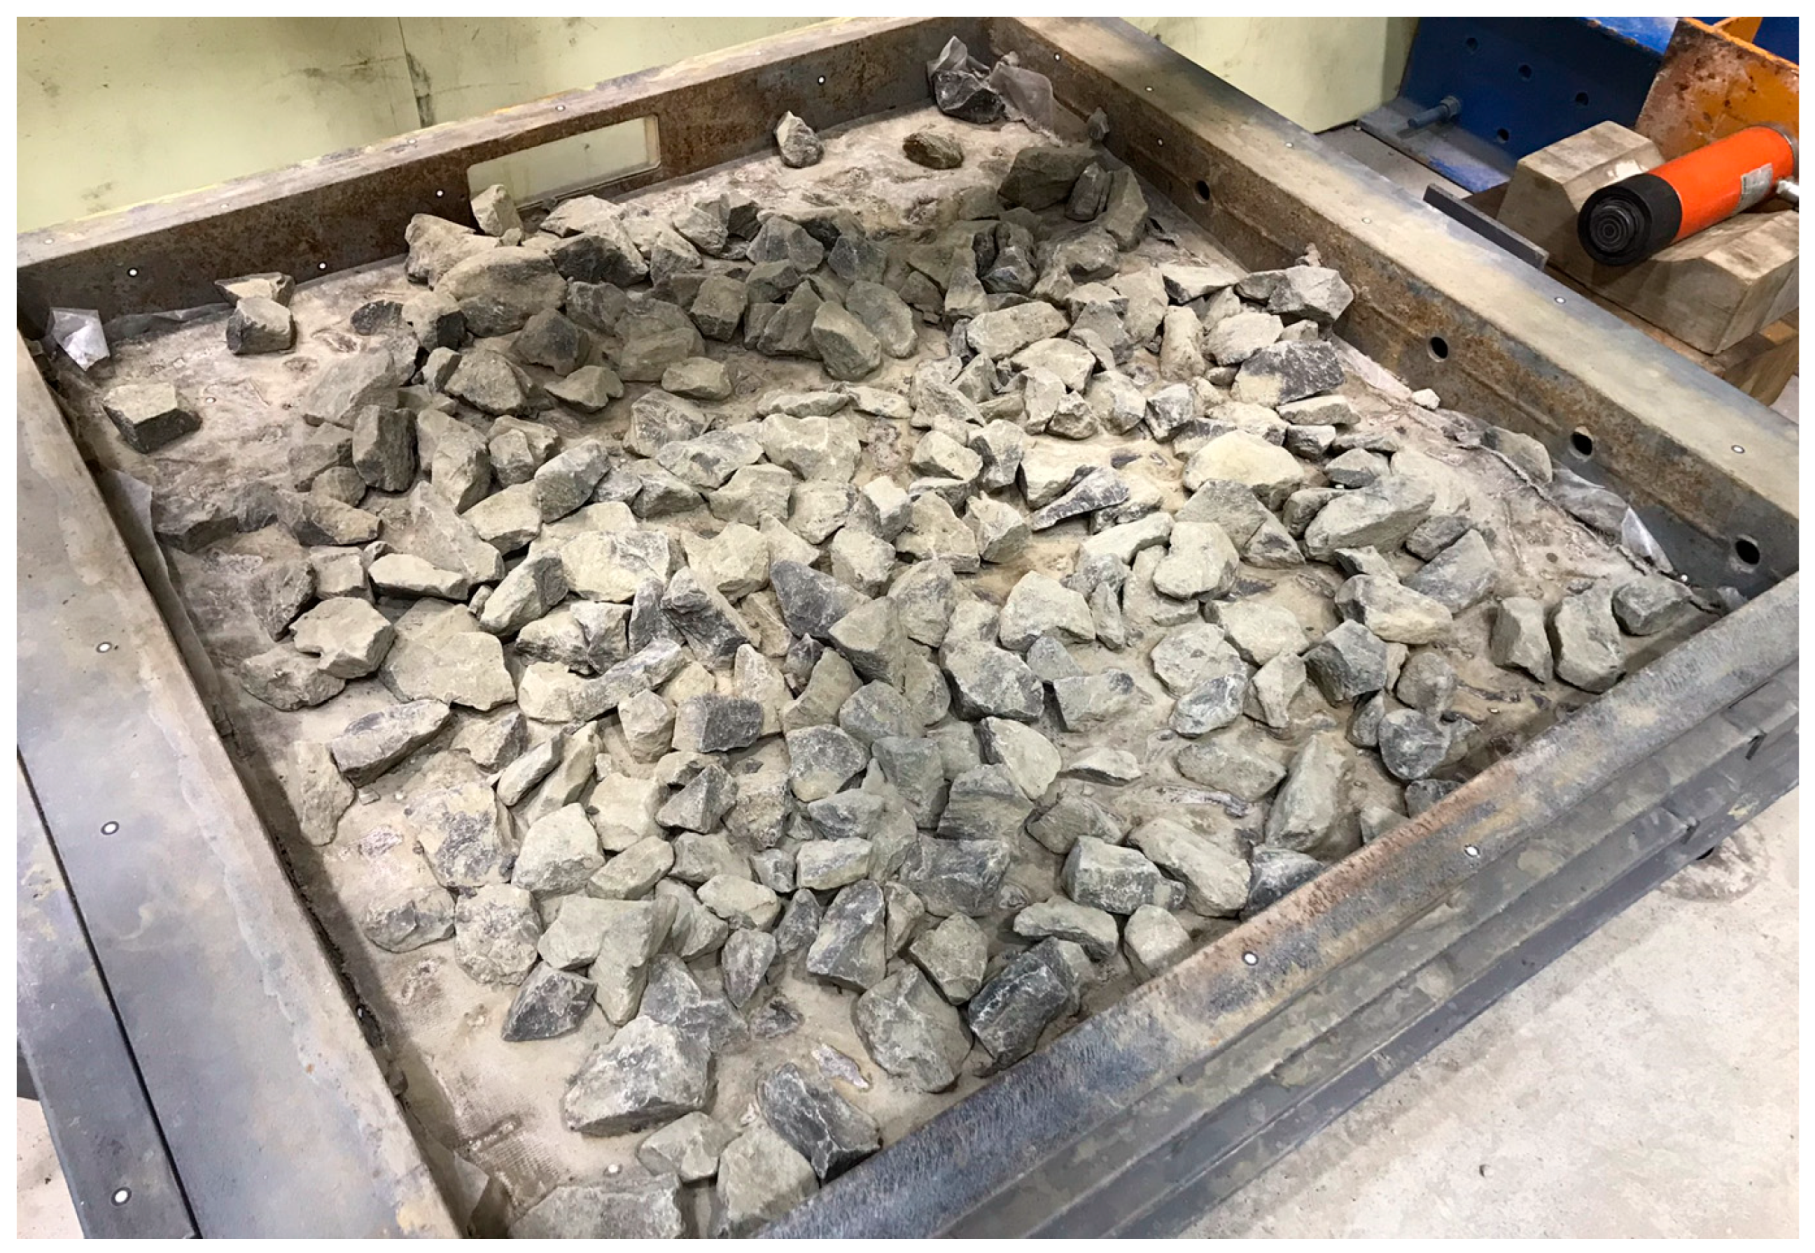
Abstract
:1. Introduction
2. Laboratory Measurements
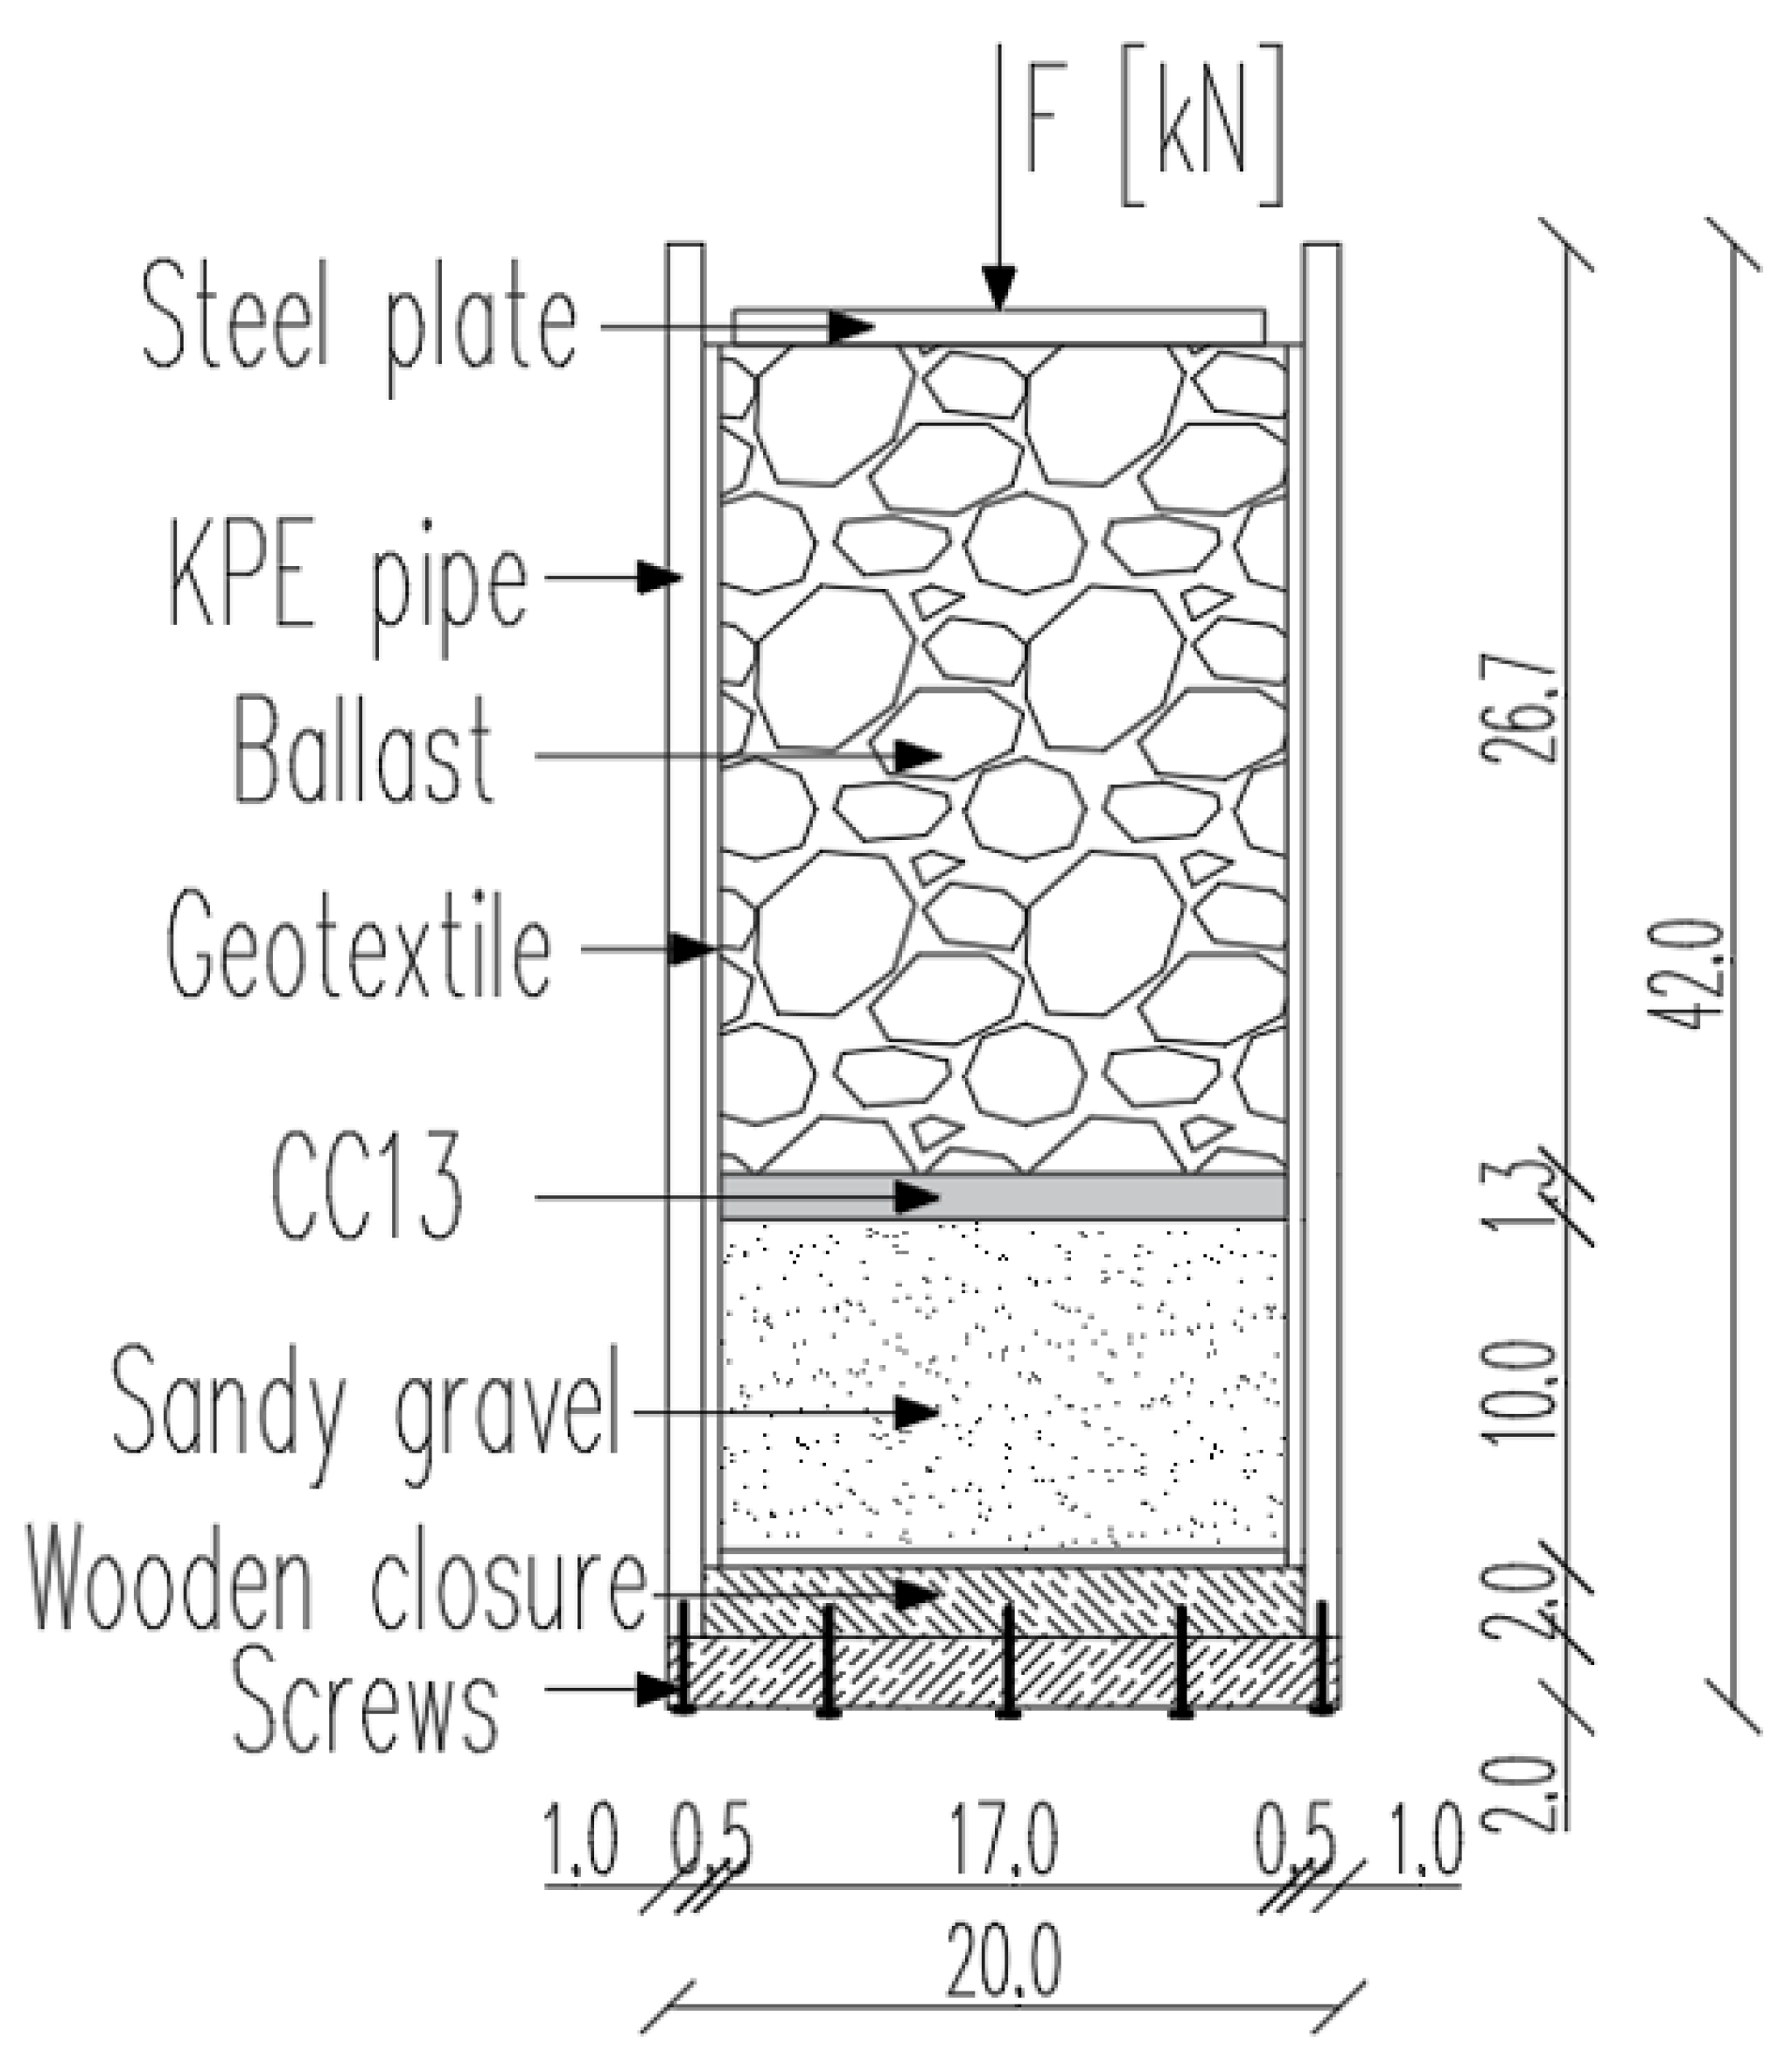
2.1. Set-Up of the Measurements
- After the specimen’s assembly, conduct the first recording of the initial state of the specimen (via CT equipment);
- Hydrate the specimens with CC;
- Let the specimens with CC stand for 60 min;
- Load with ZD-40 machine until 100 kPa is reached—hold for 5 min;
- Conduct the second recording using CT equipment;
- Let the specimens with CC stand for seven days;
- Load with ZD-40 machine until 200 kPa is reached—hold for 1 min;
- Conduct the third recording using CT equipment;
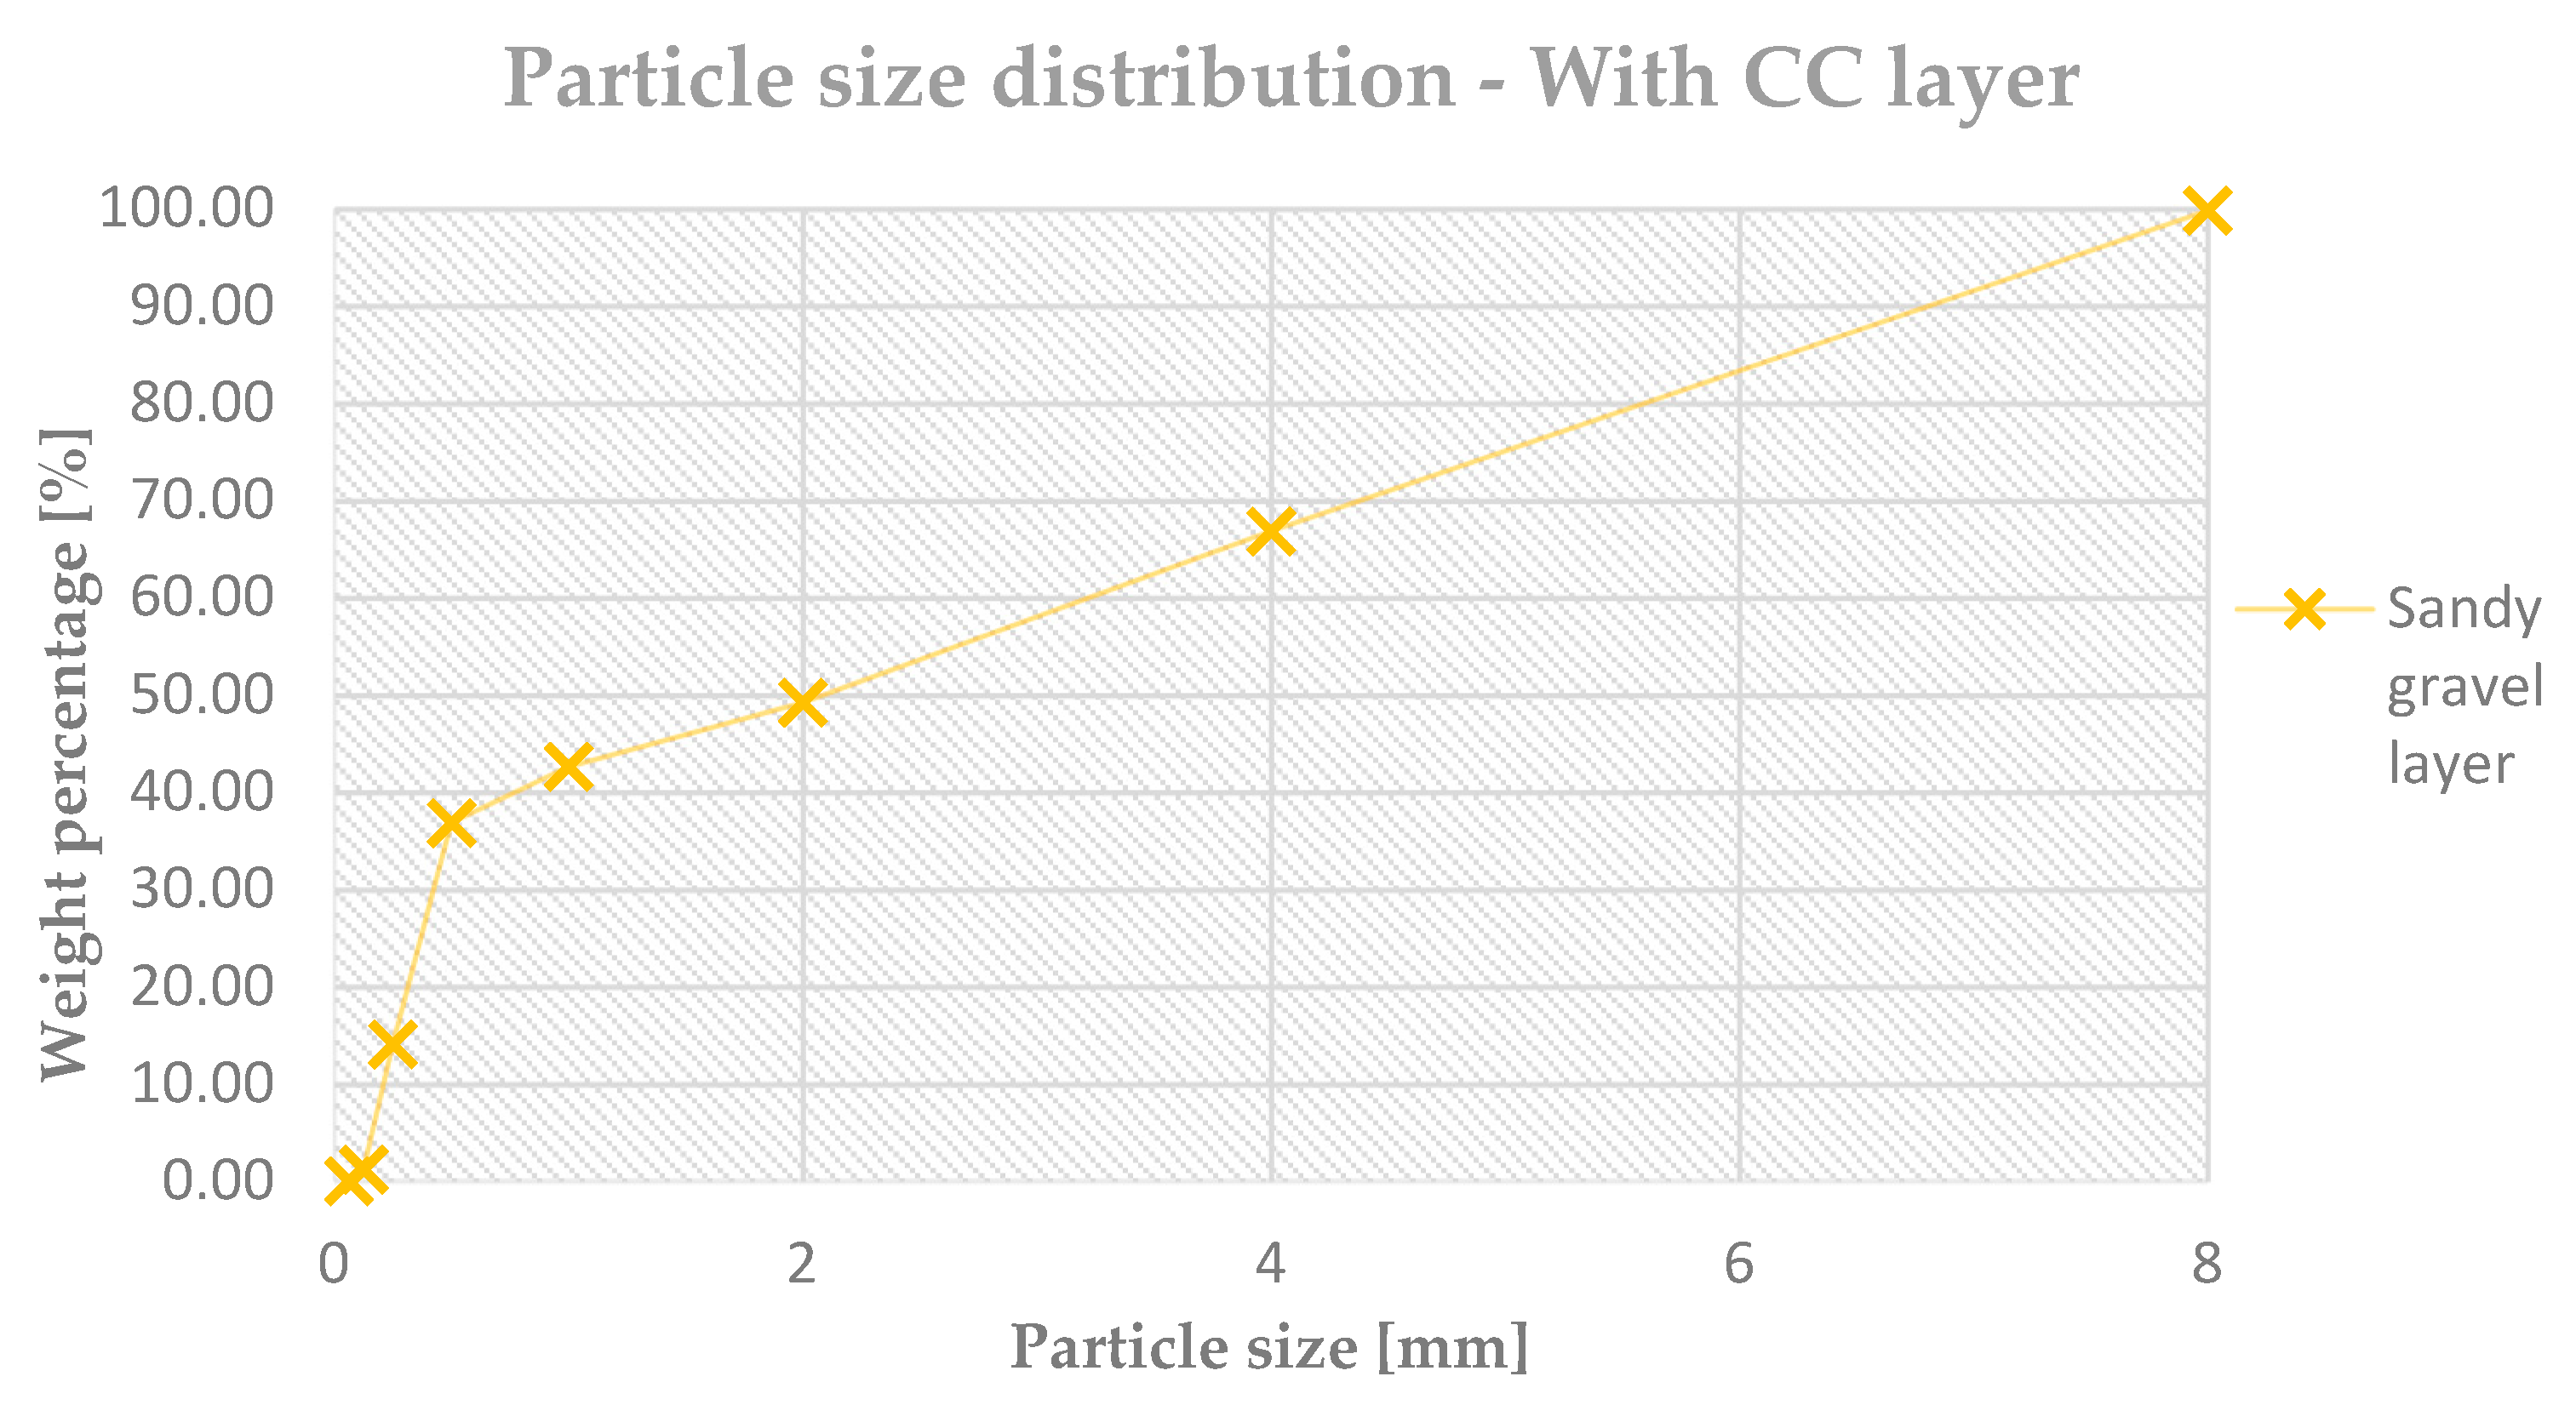
- Measure the weight and construct the new particle size distribution graph.
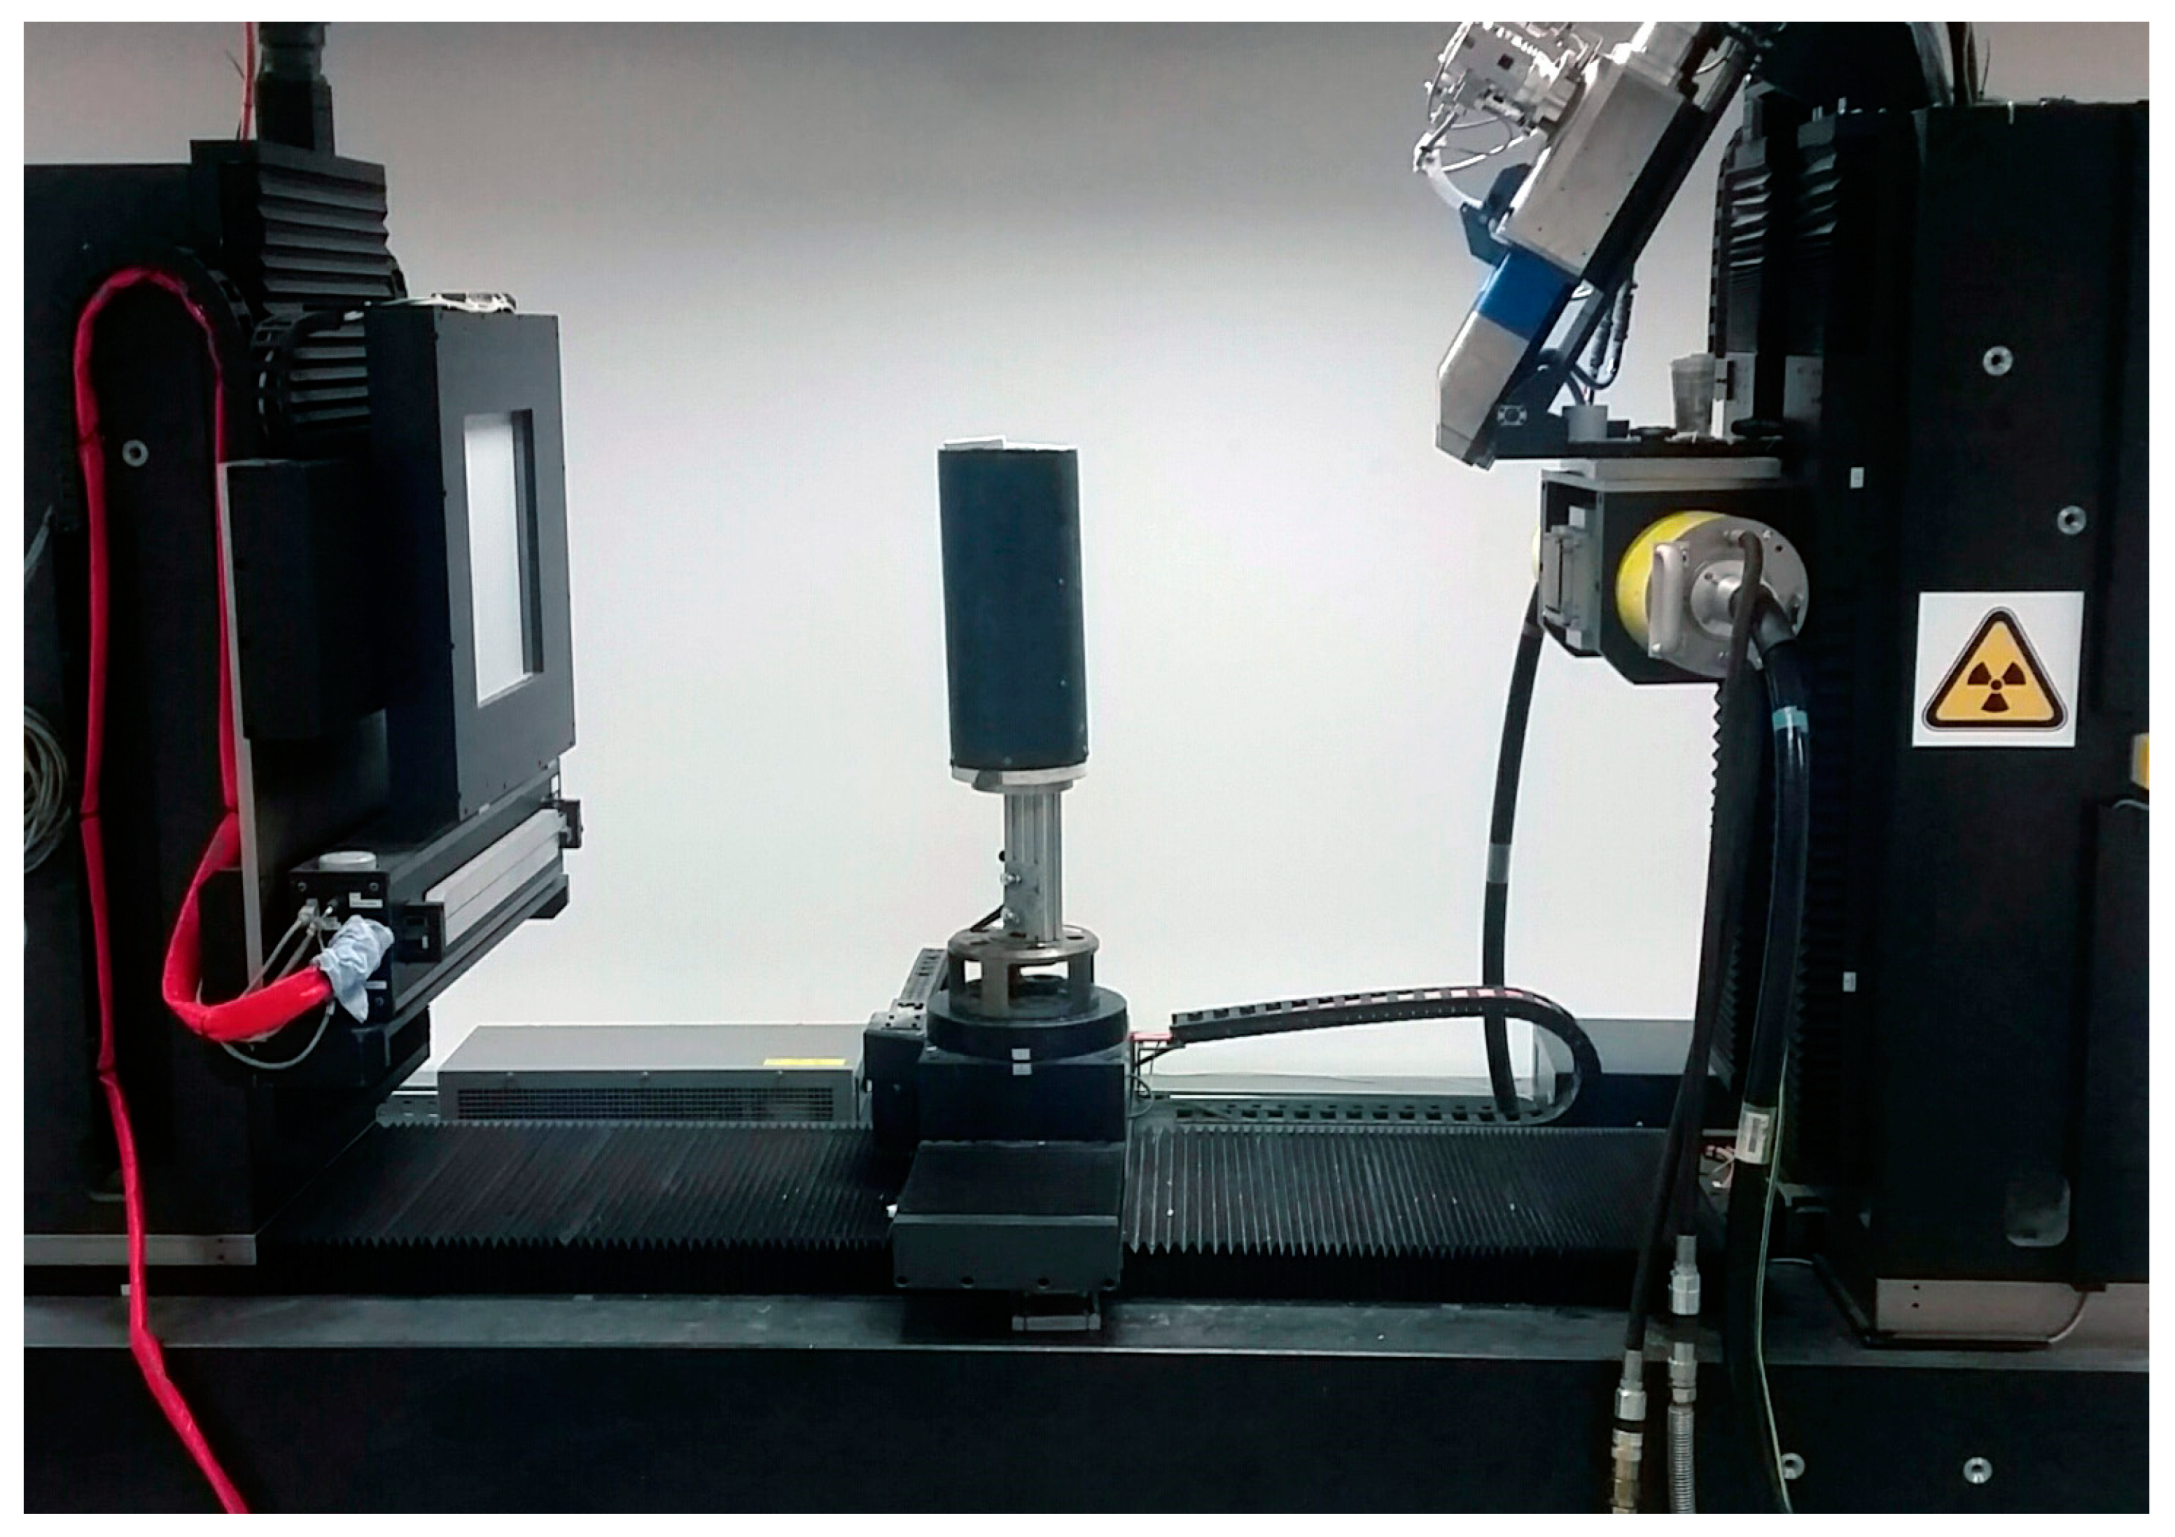
2.2. Computed Tomography Examination
- A 360° rotation produces 1260 projections (CT images);
- The number of lines is 104;
- In the case of multi-slice, the distance between two slices is 210 mm;
- The number of pixels is 2048 × 2048 (used: 1024 × 1024);
- 2D-pixel size: 0.19124188 mm;
- 3D-XY-pixel size: 0.18966927 mm (the edge length of 1 spatial pixel, the so-called ‘voxel’);
- 3D-Z-pixel size: 0.1896692 mm;
- X-ray tube: Y.TU 450-D09;
- Tube voltage: 0…450 kV (used 210 kV);
- Current: 2.60 mA (this is paired with 210 kV, e.g., 1.213 mA for 450 kV);
- Focus: small;
- Filter:
- ○
- Al—0.00 mm;
- ○
- Cu—1.50 mm;
- ○
- Sn—0.00 mm;
- ○
- Pb—0.00 mm.
3. Results
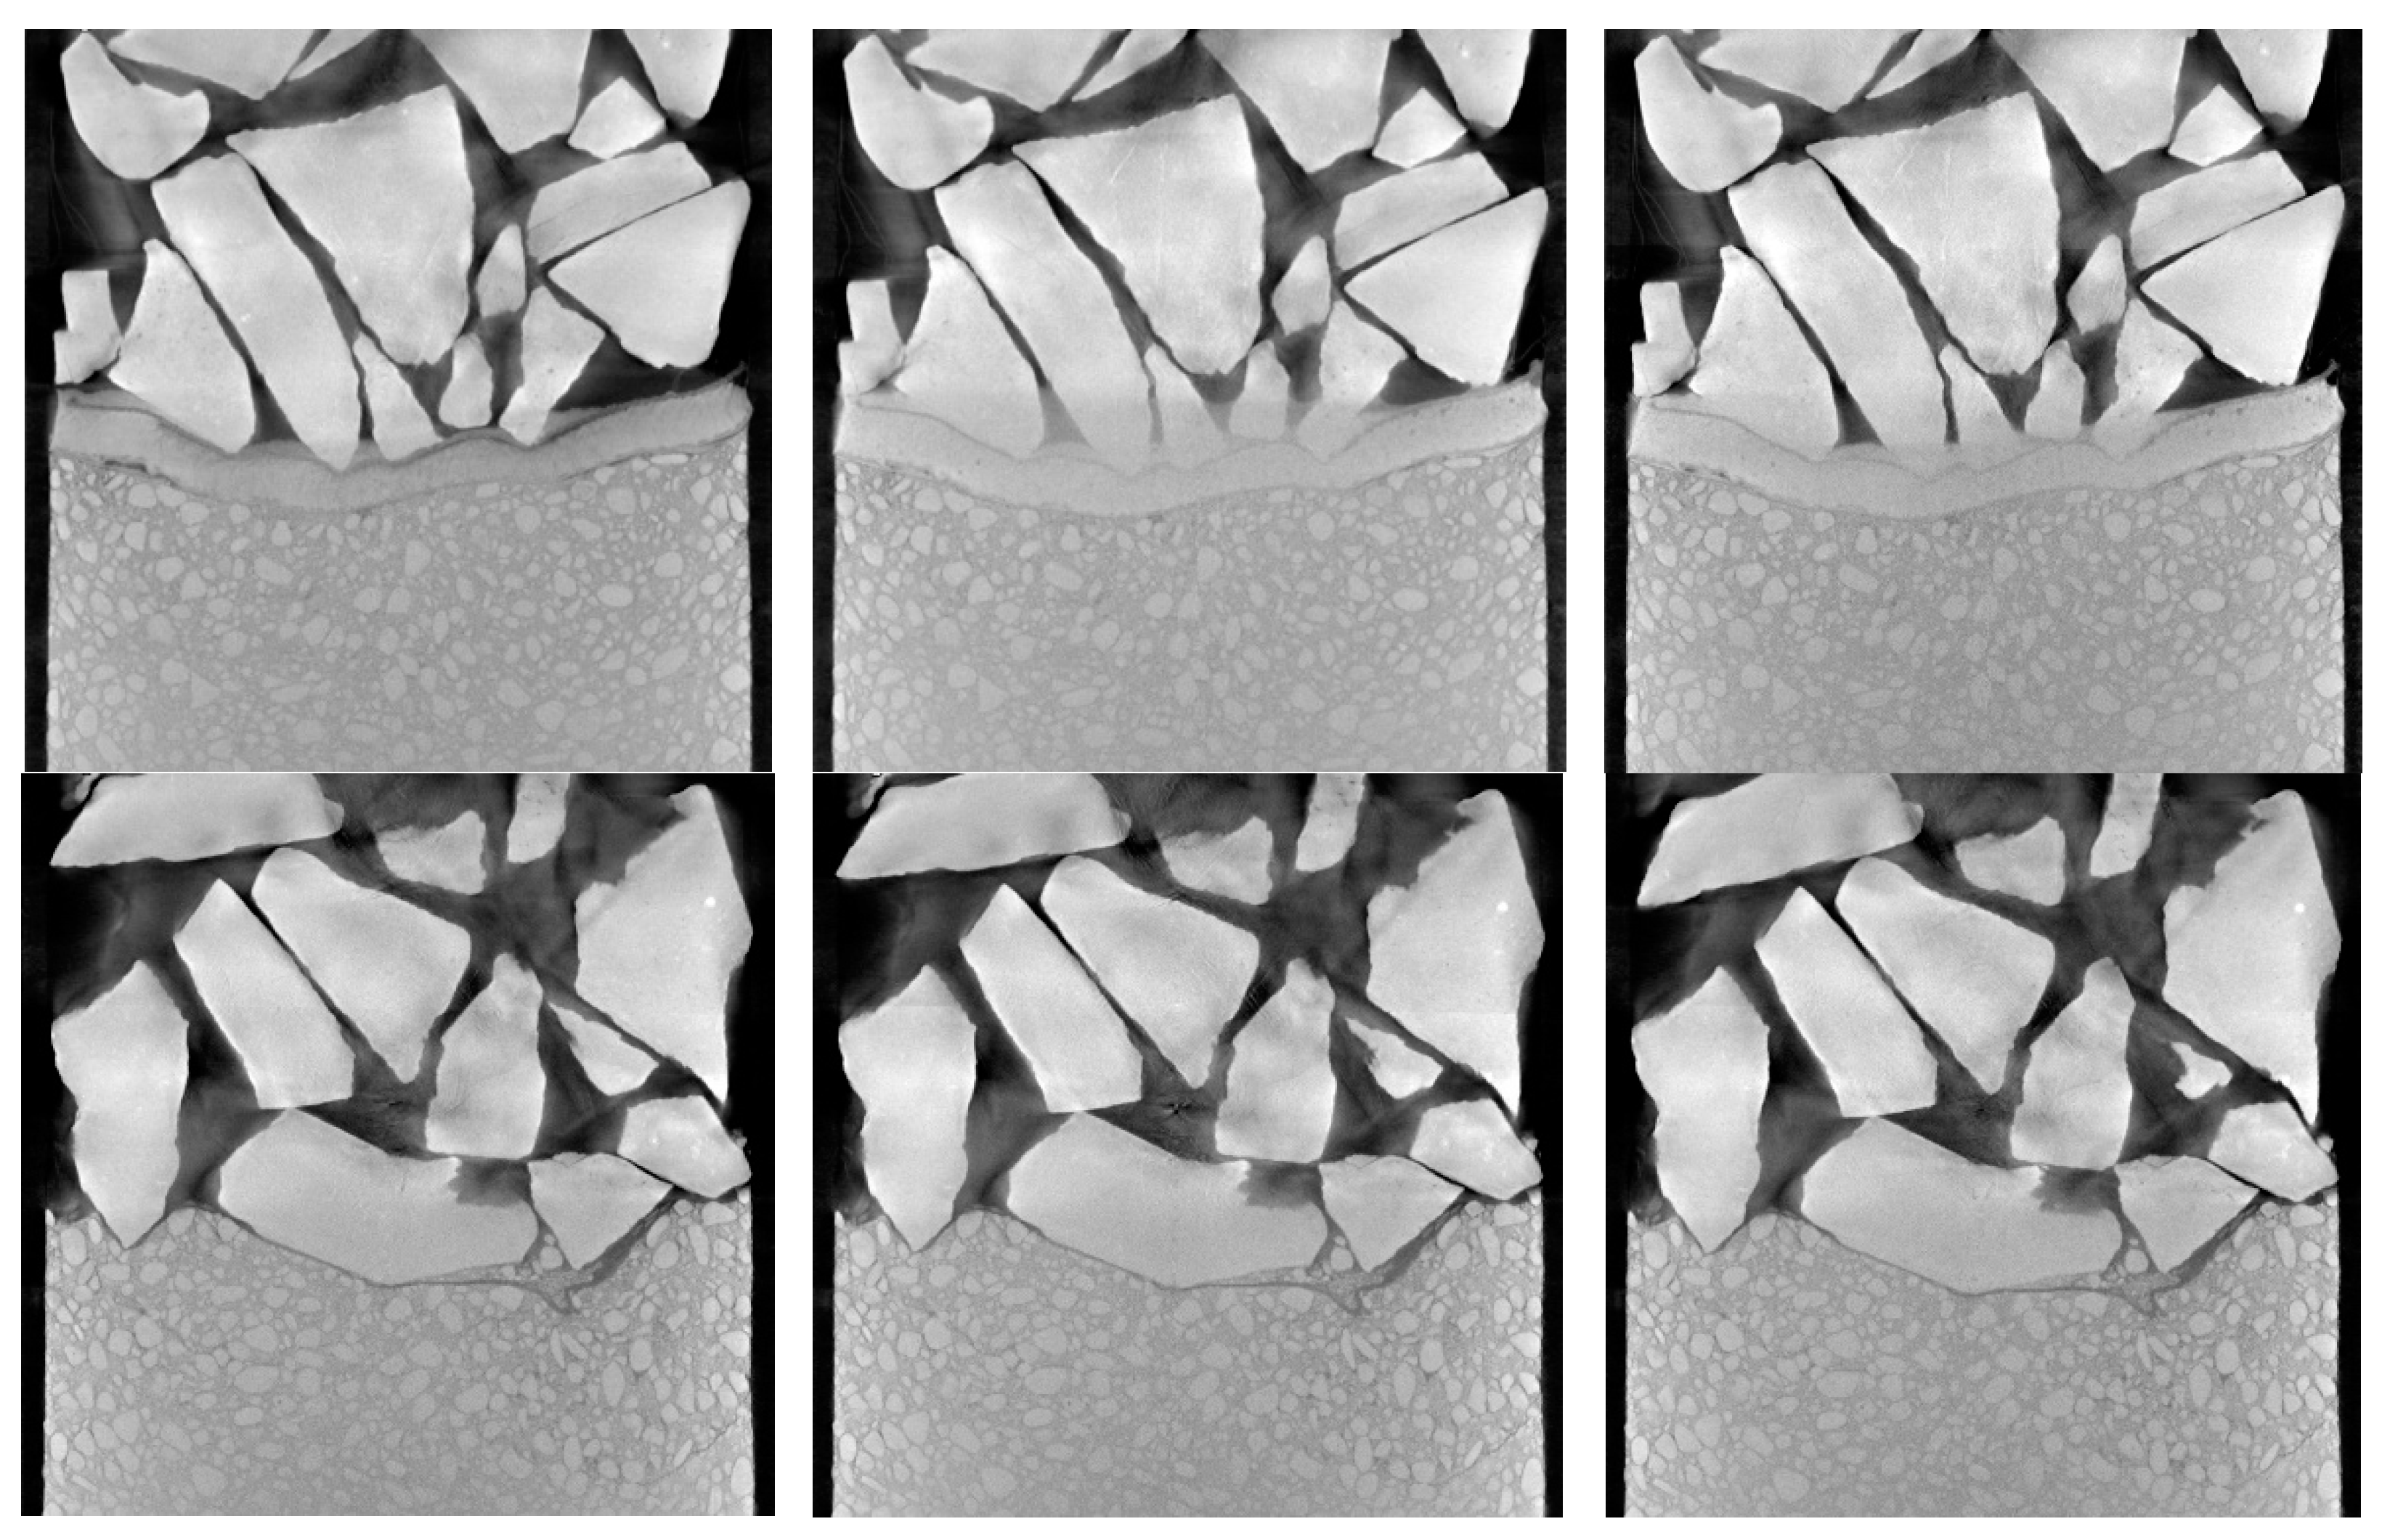
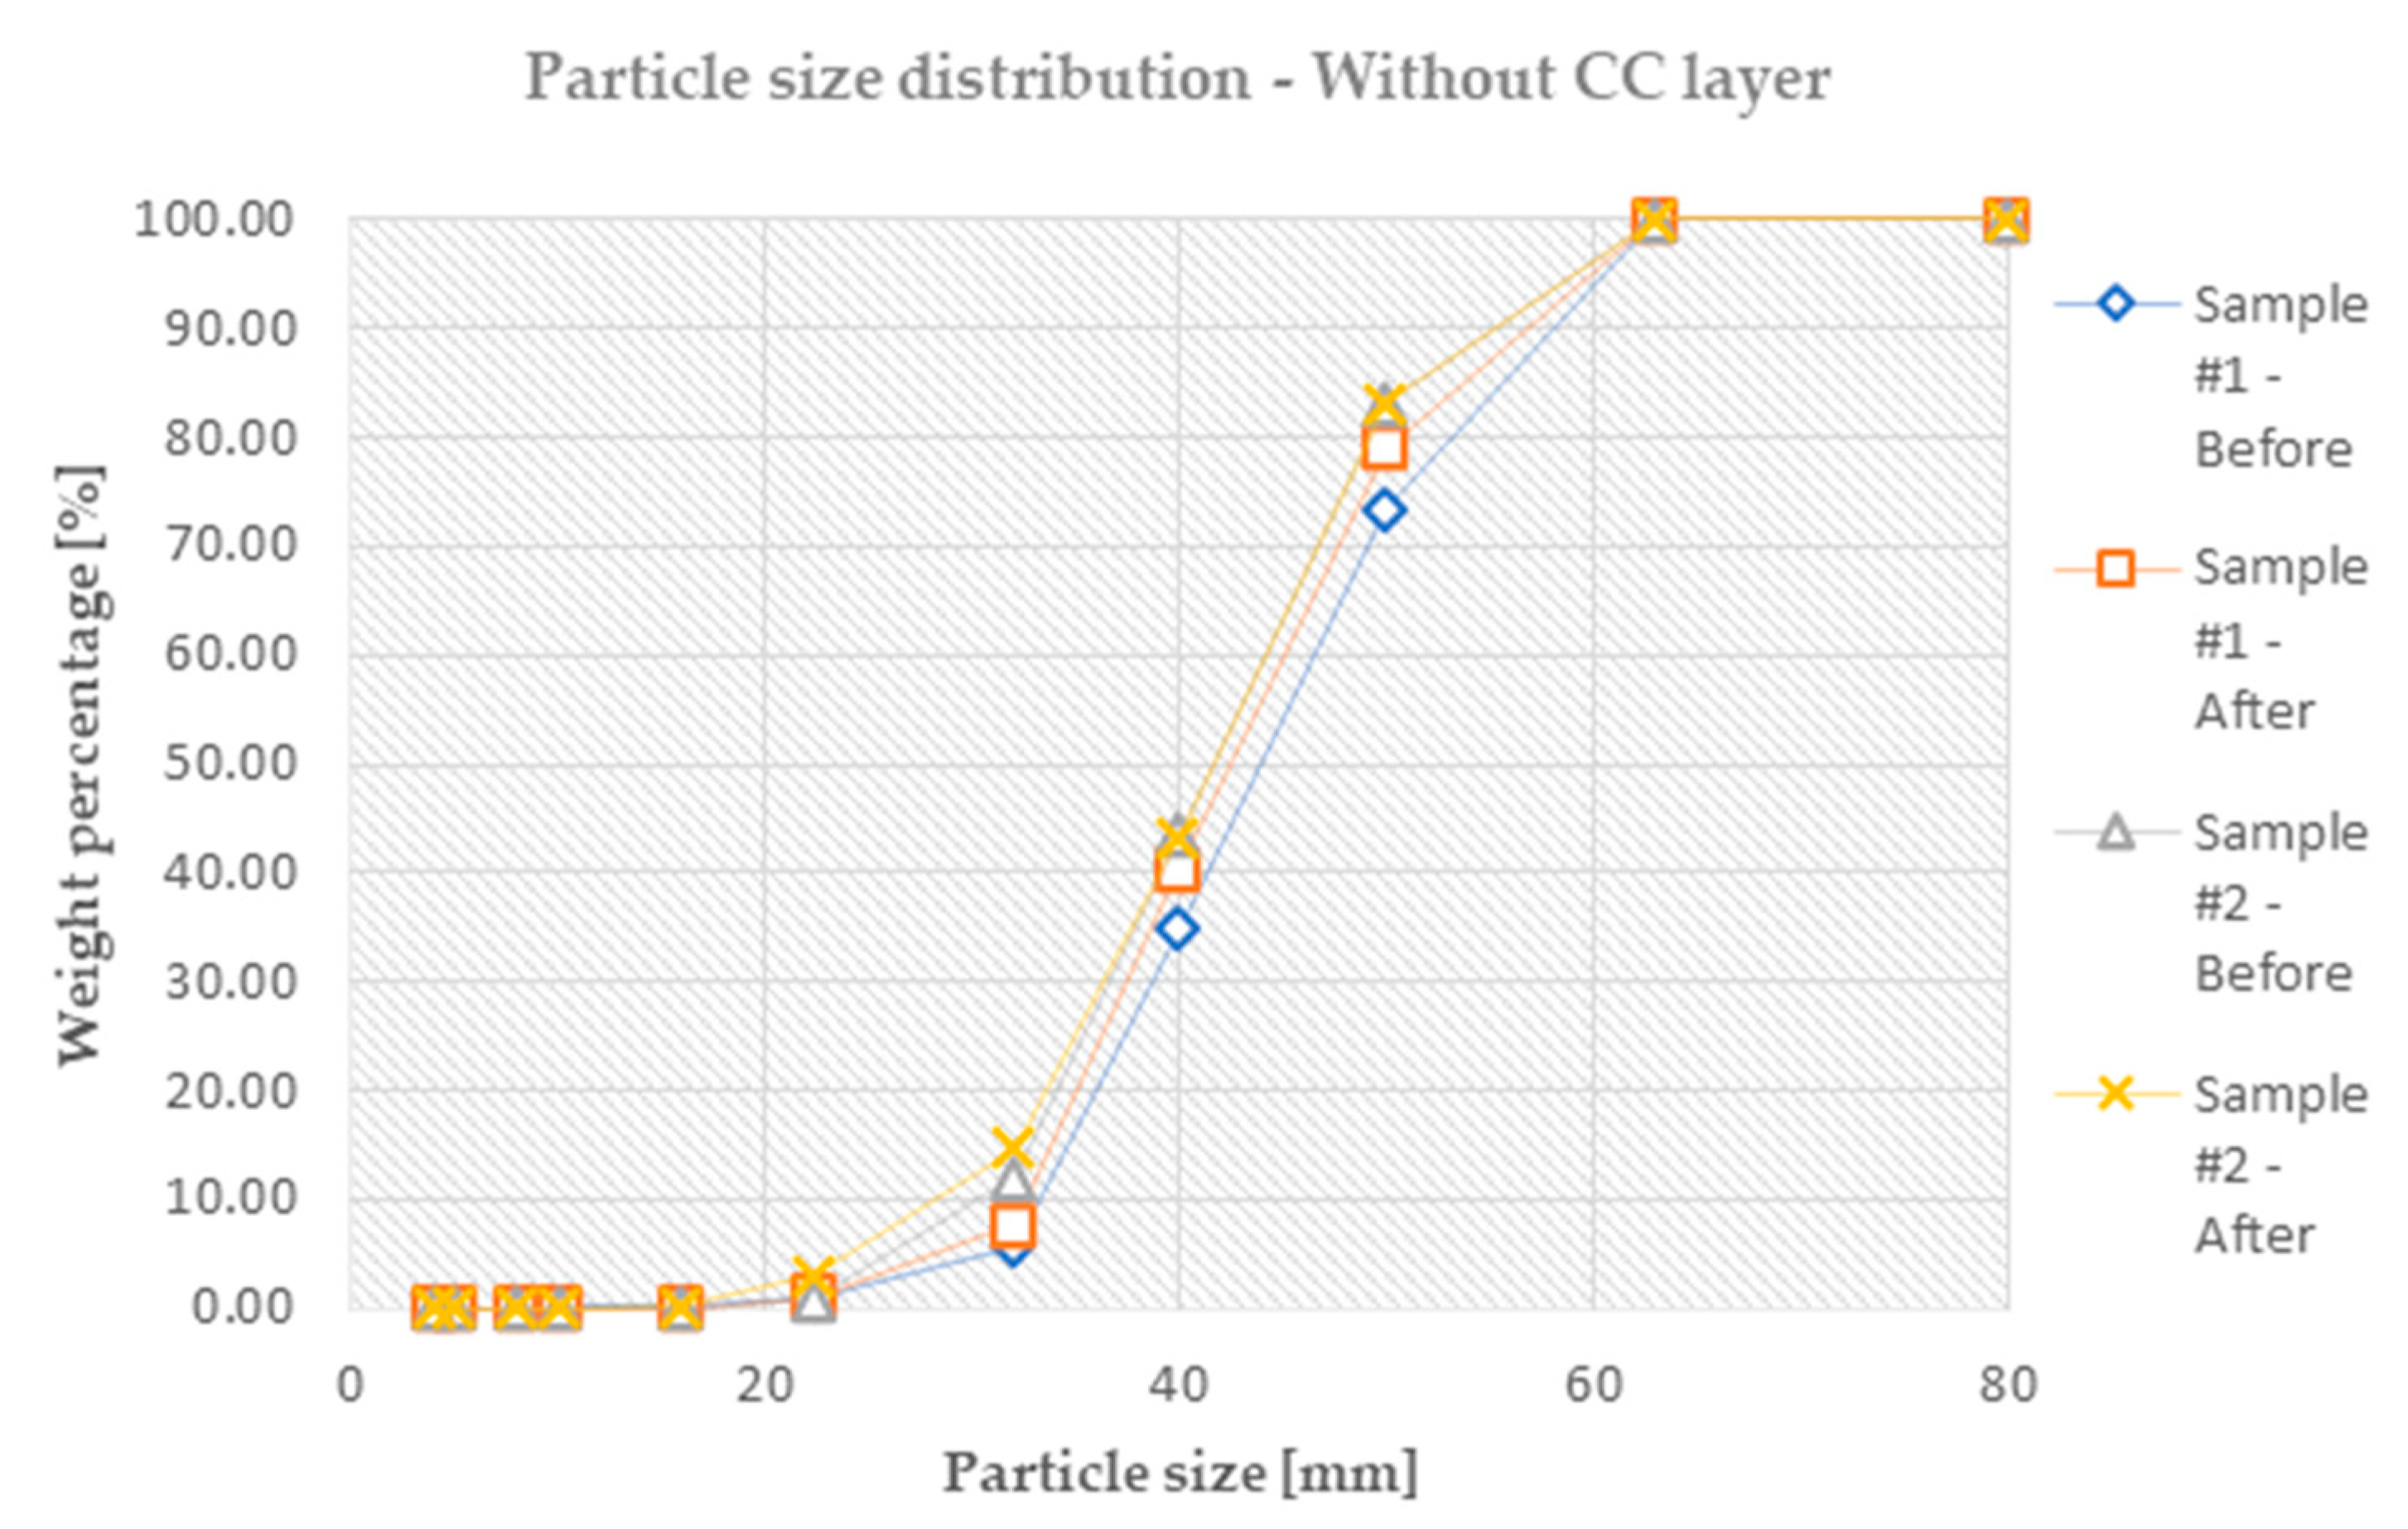
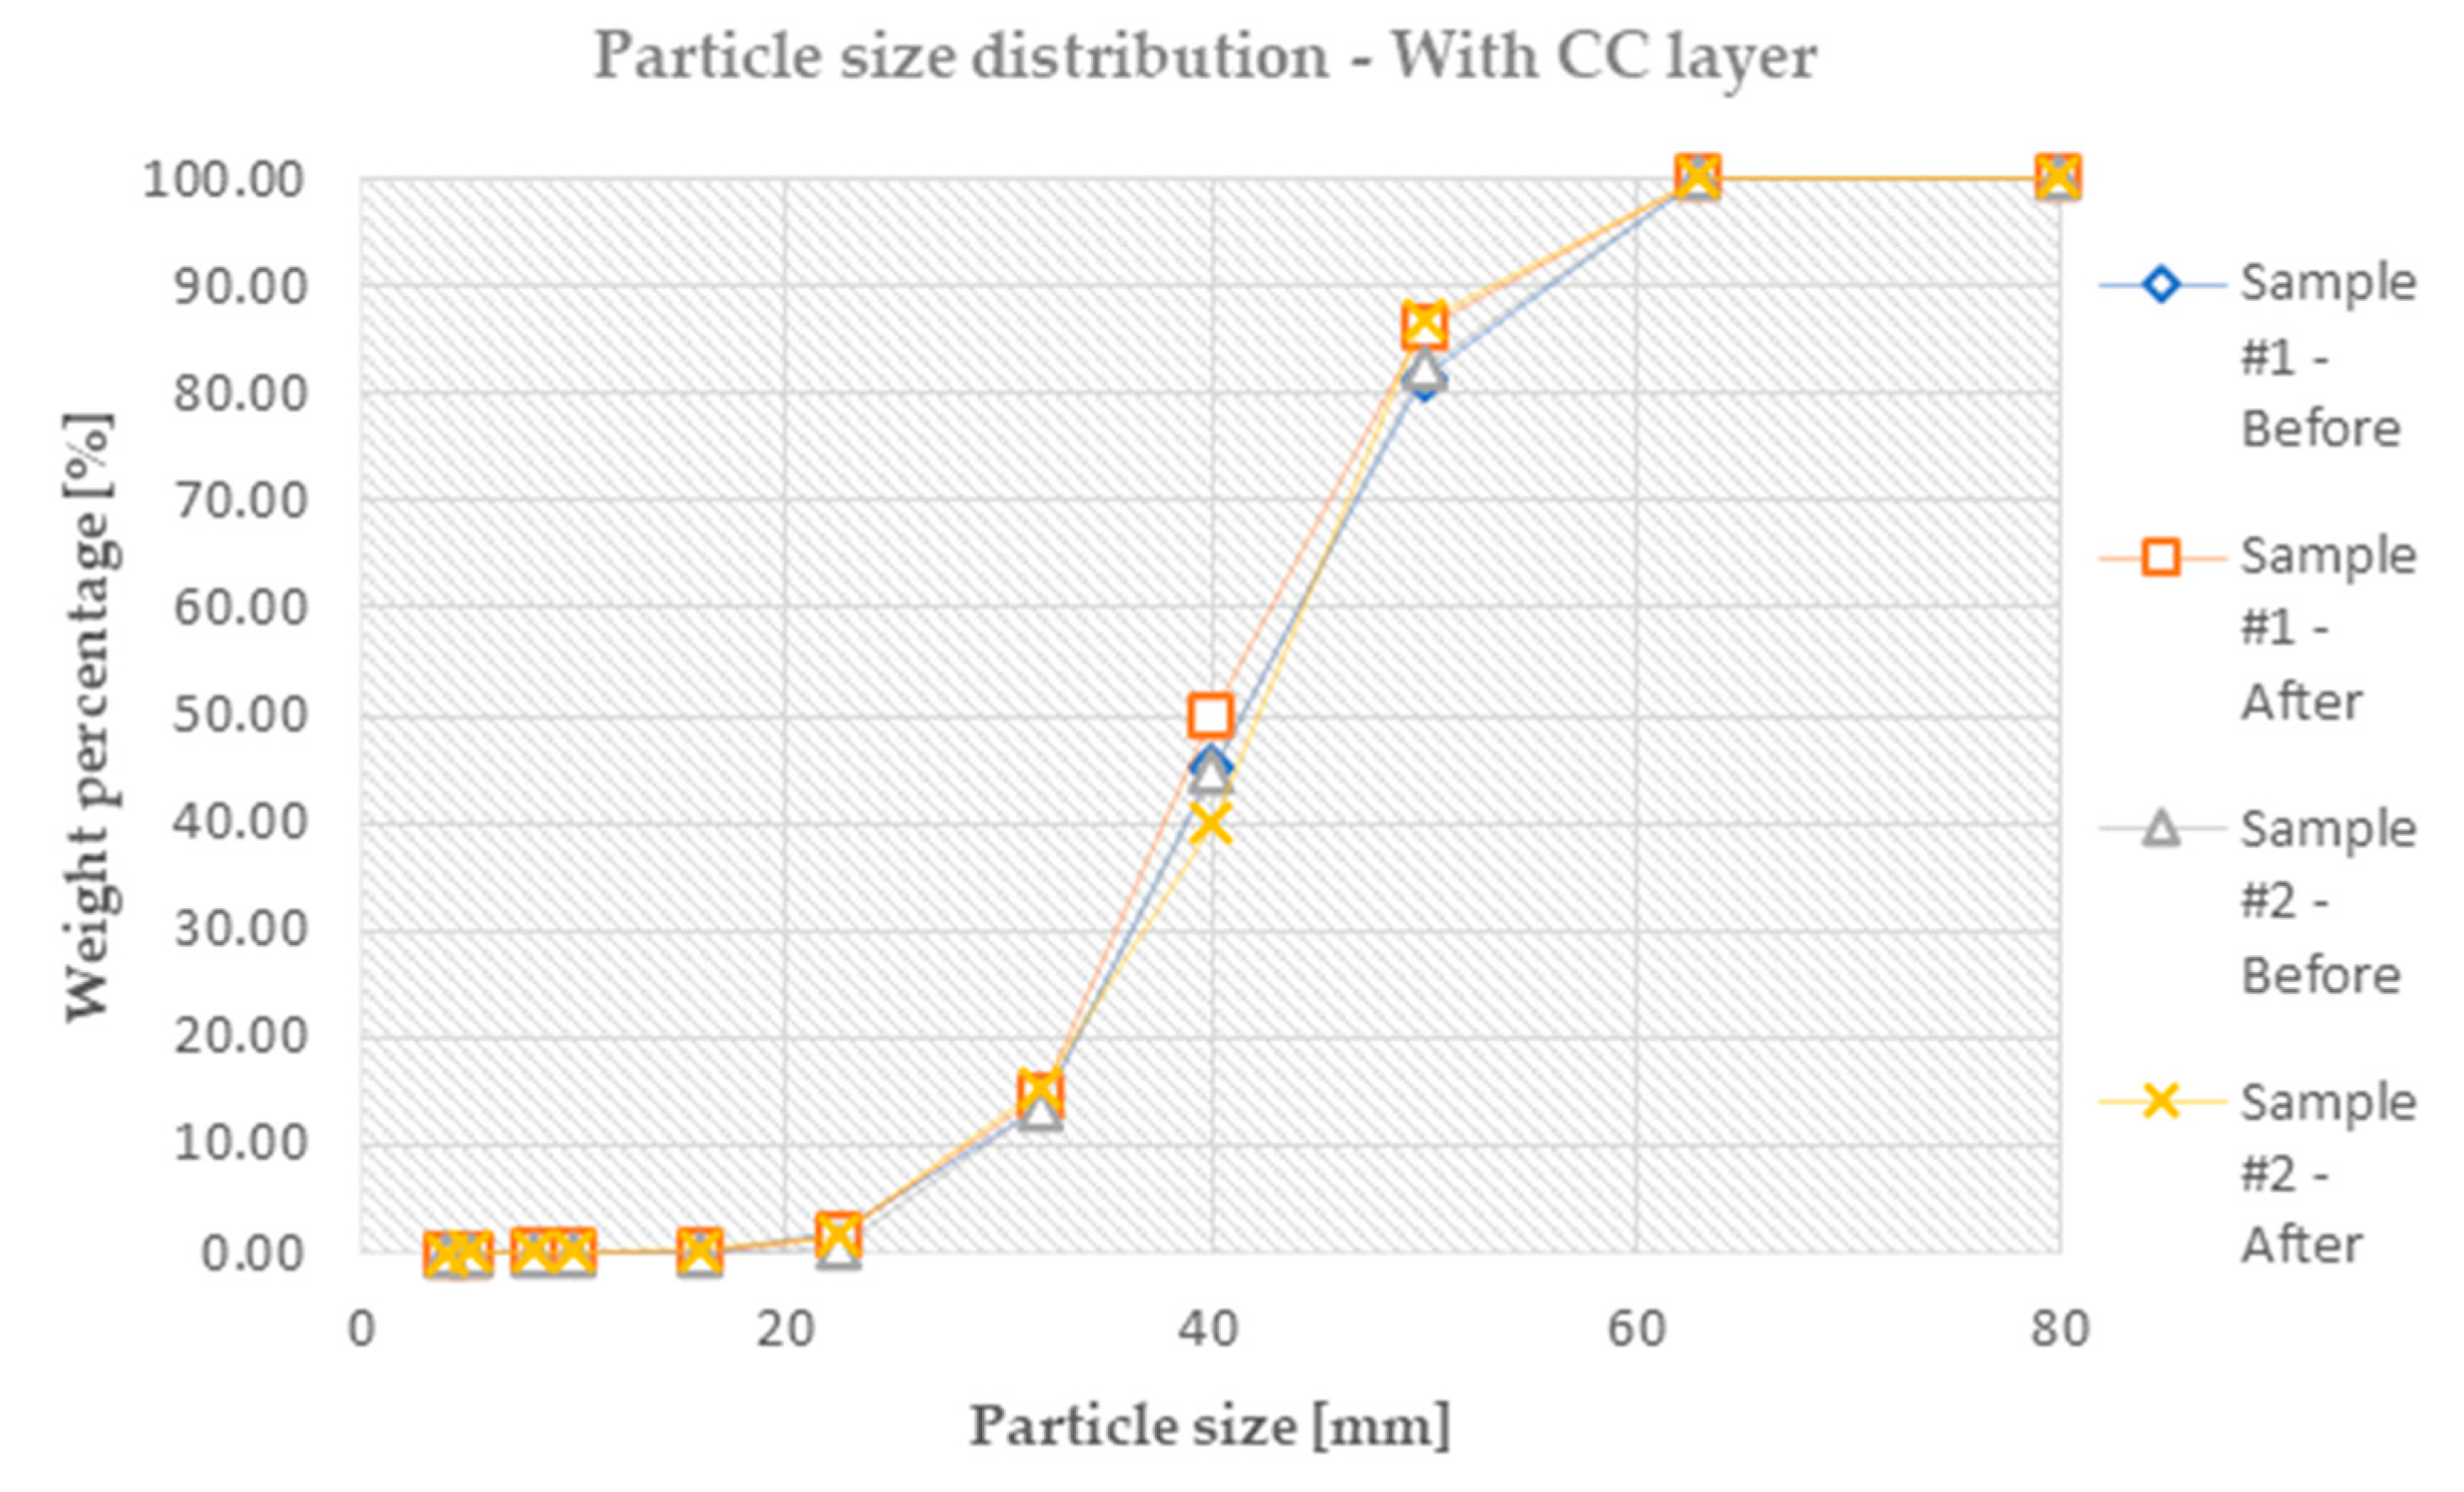
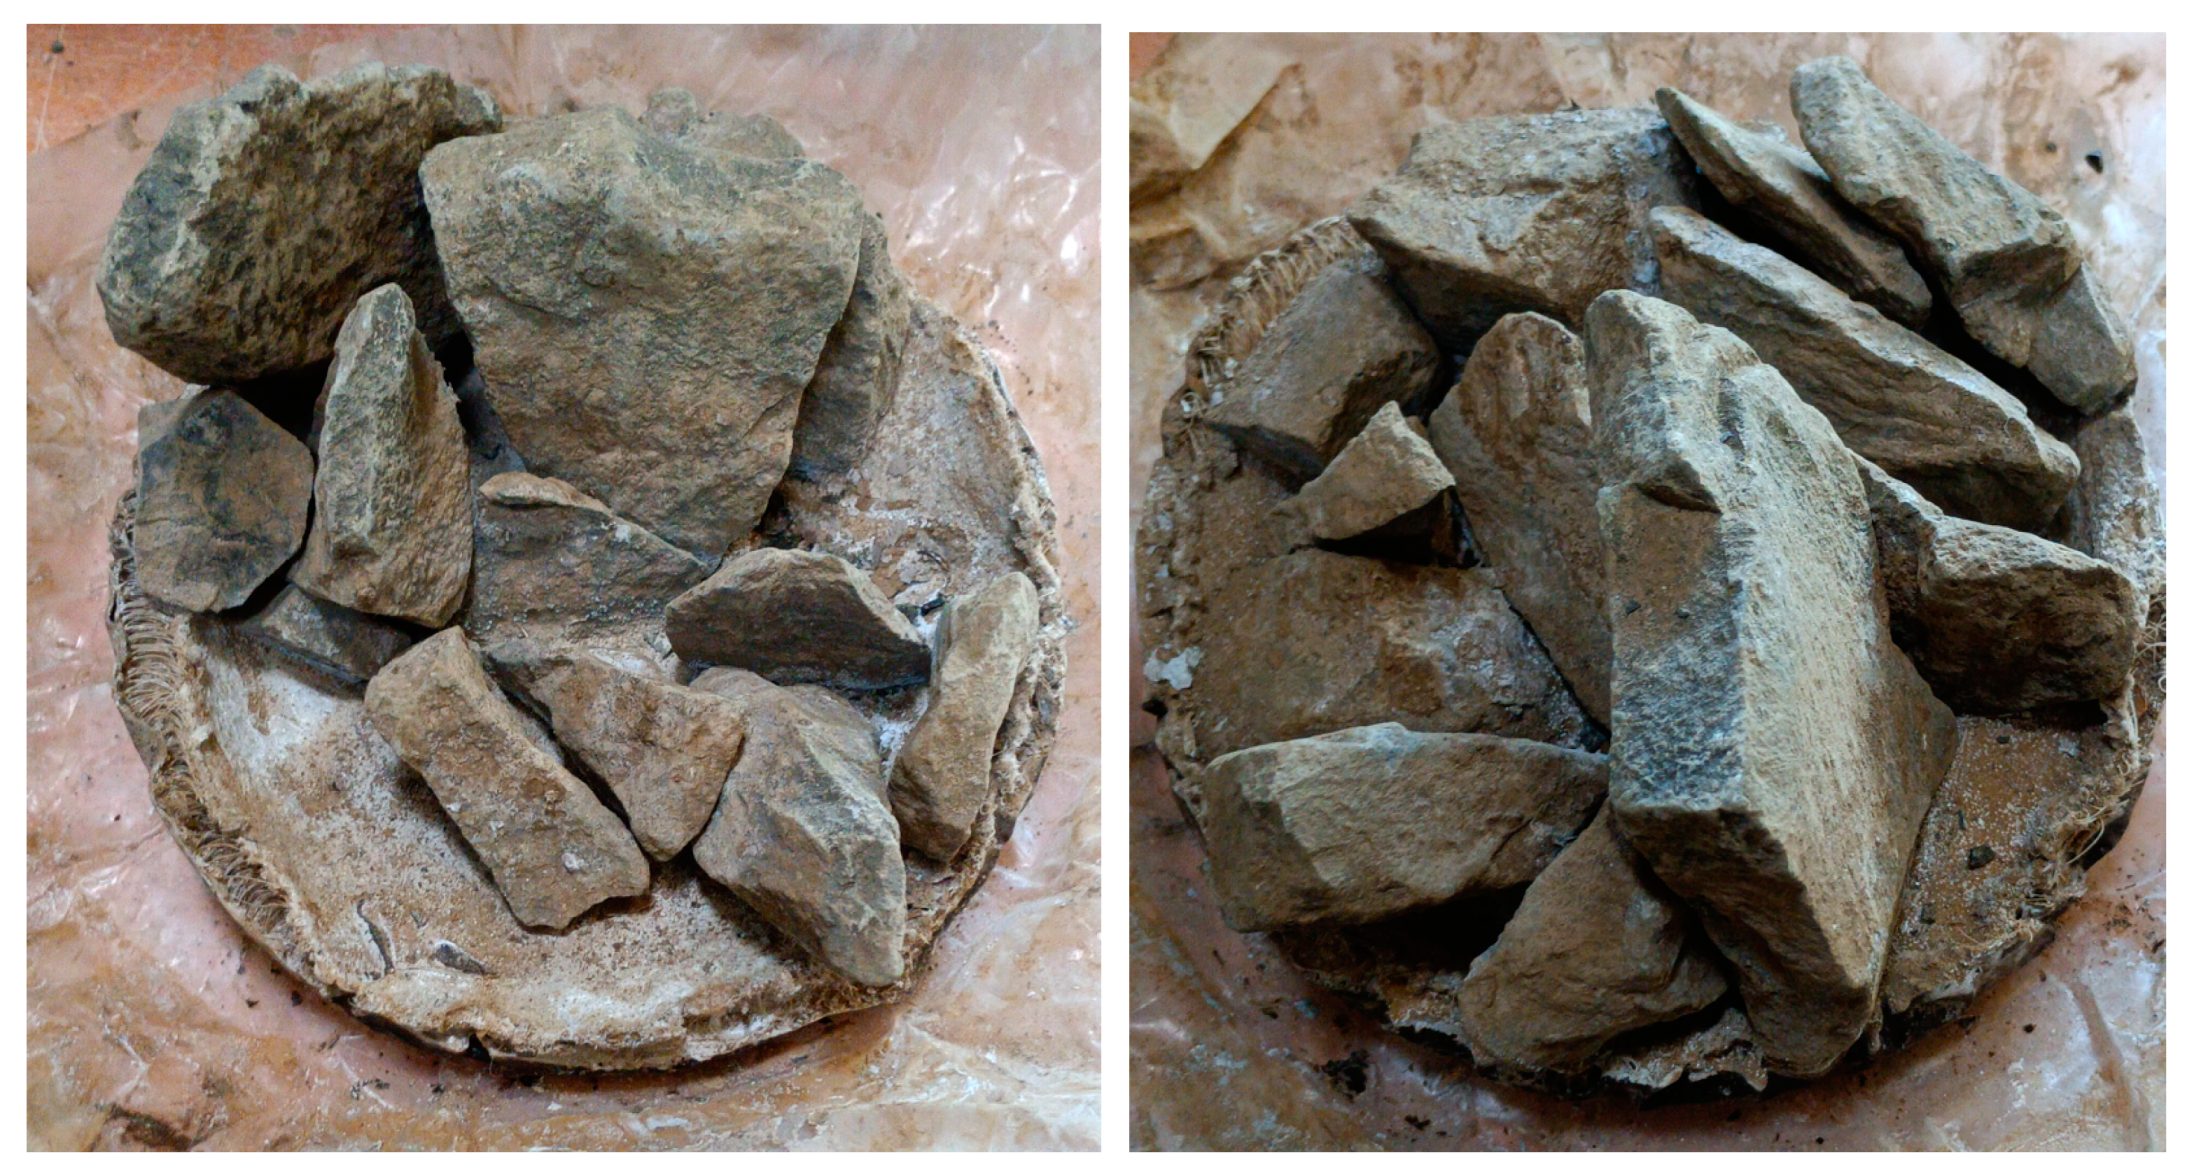
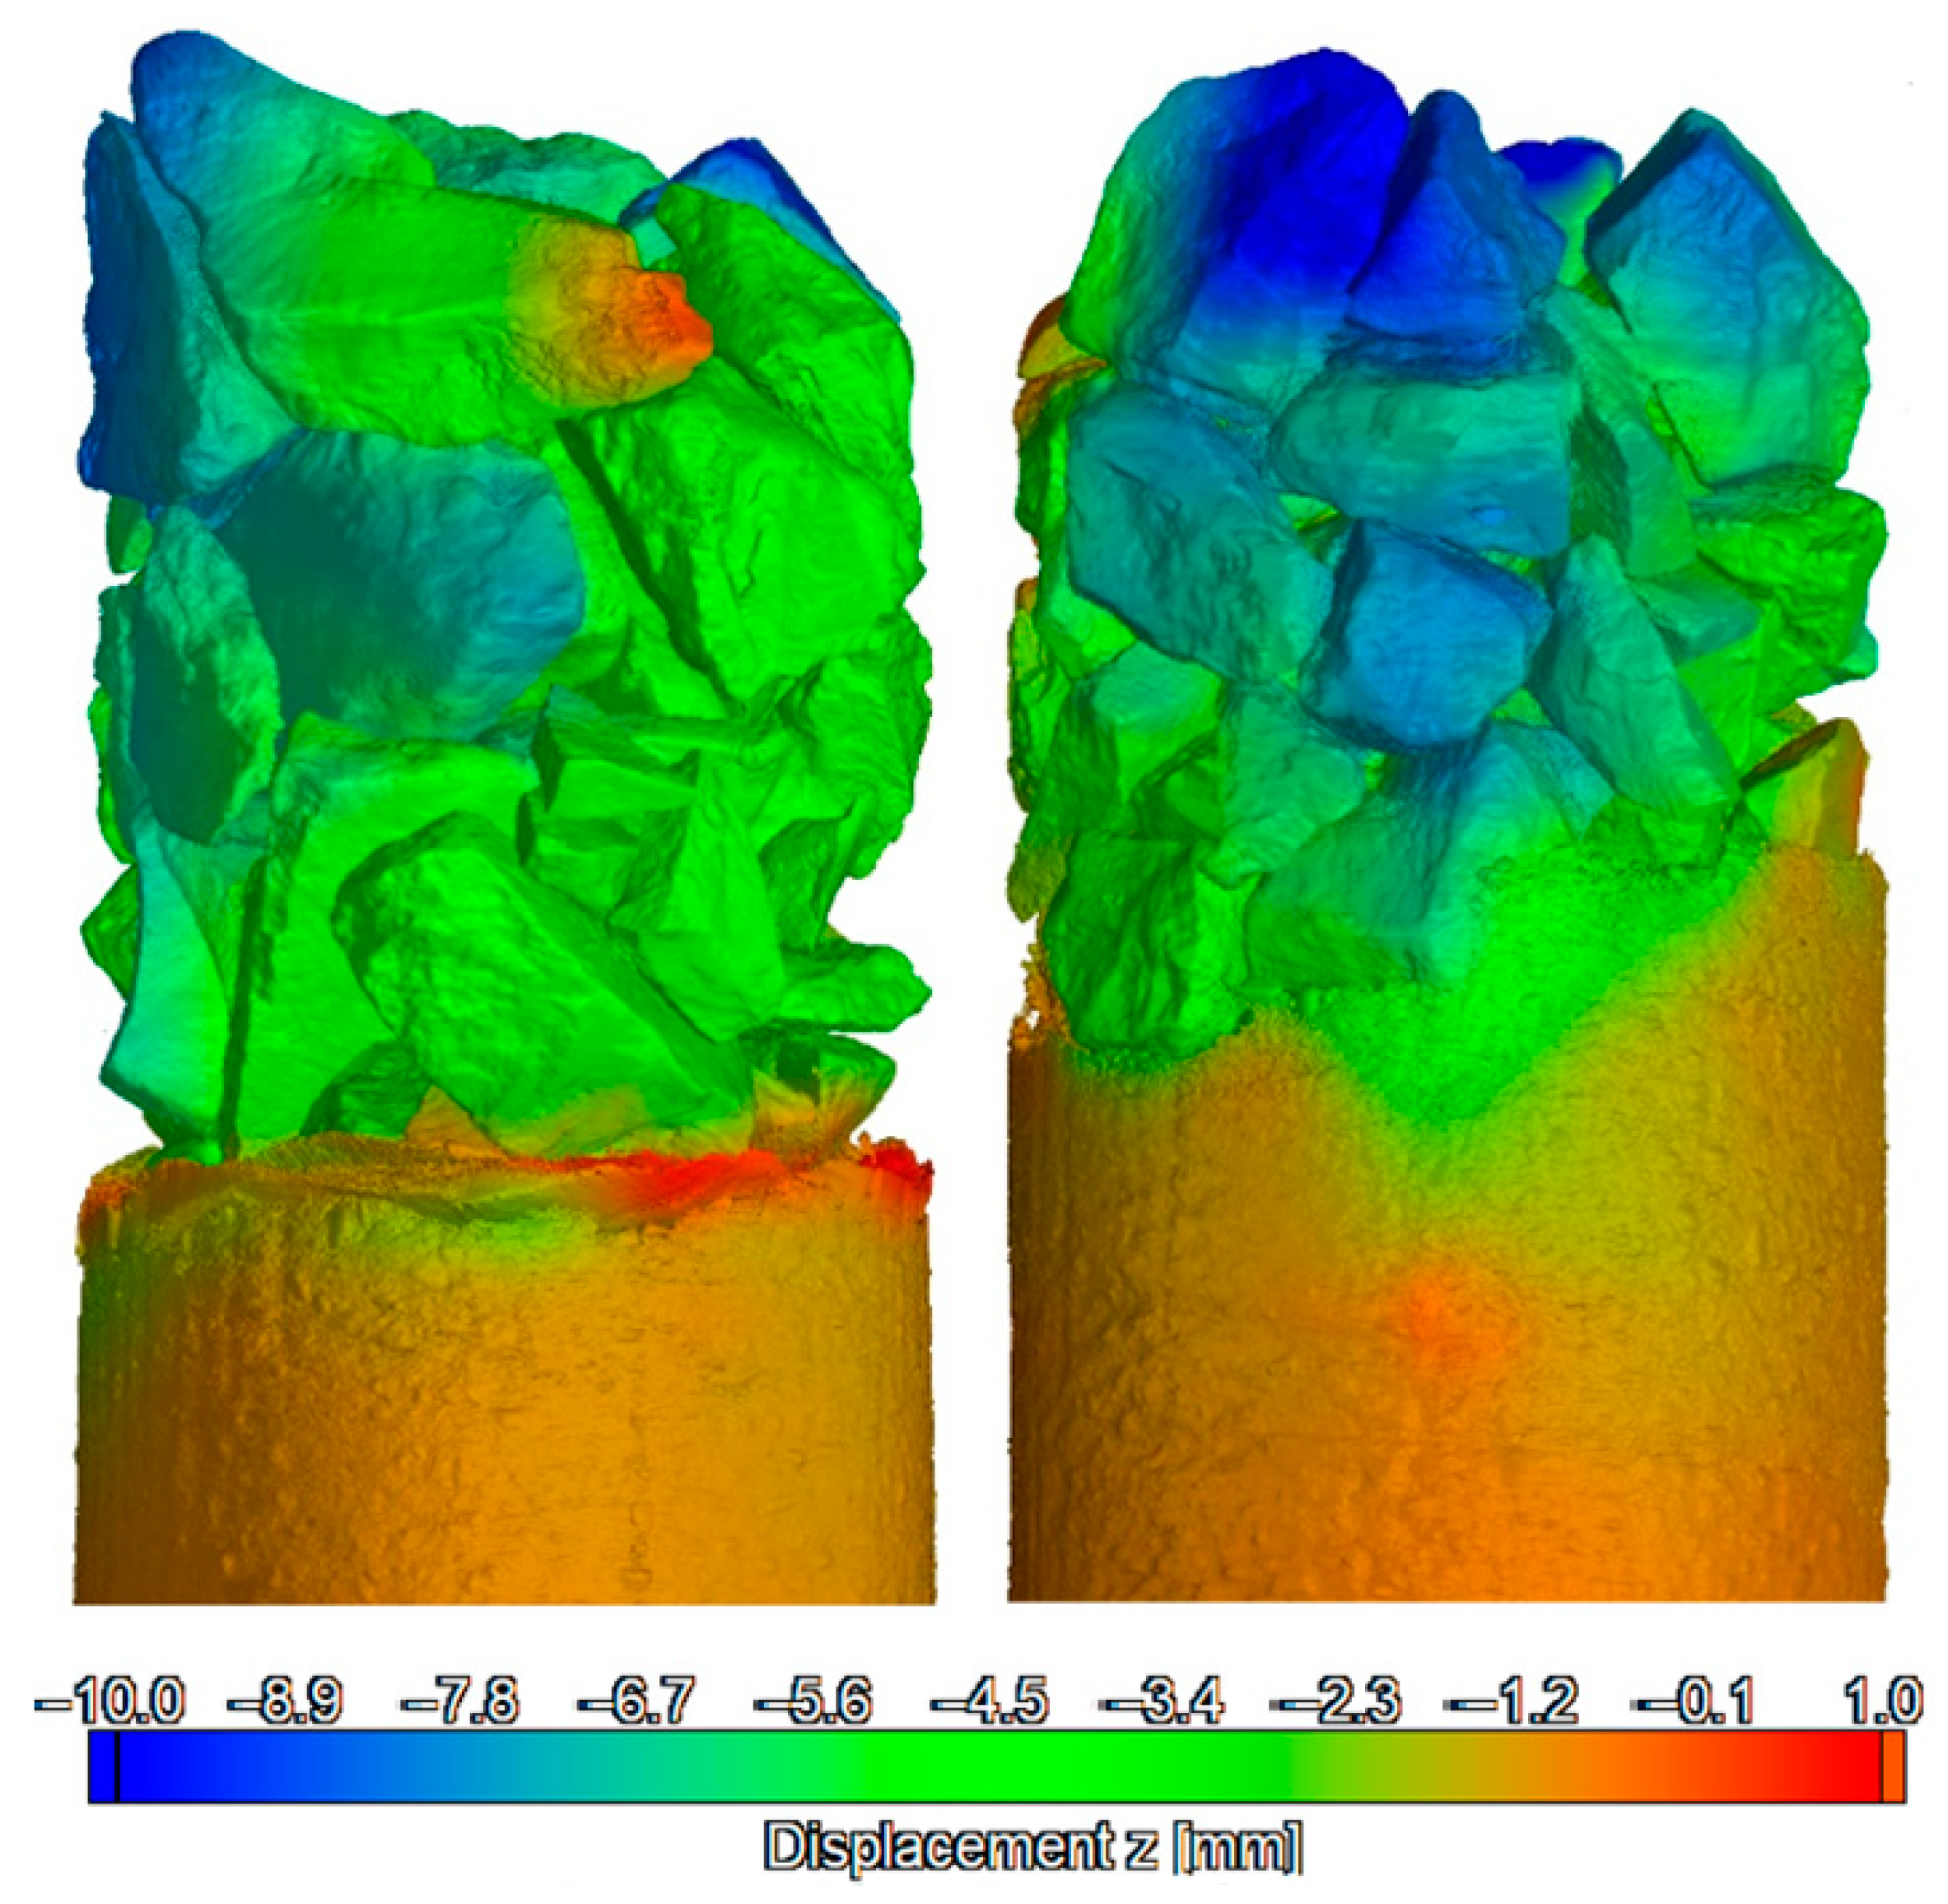
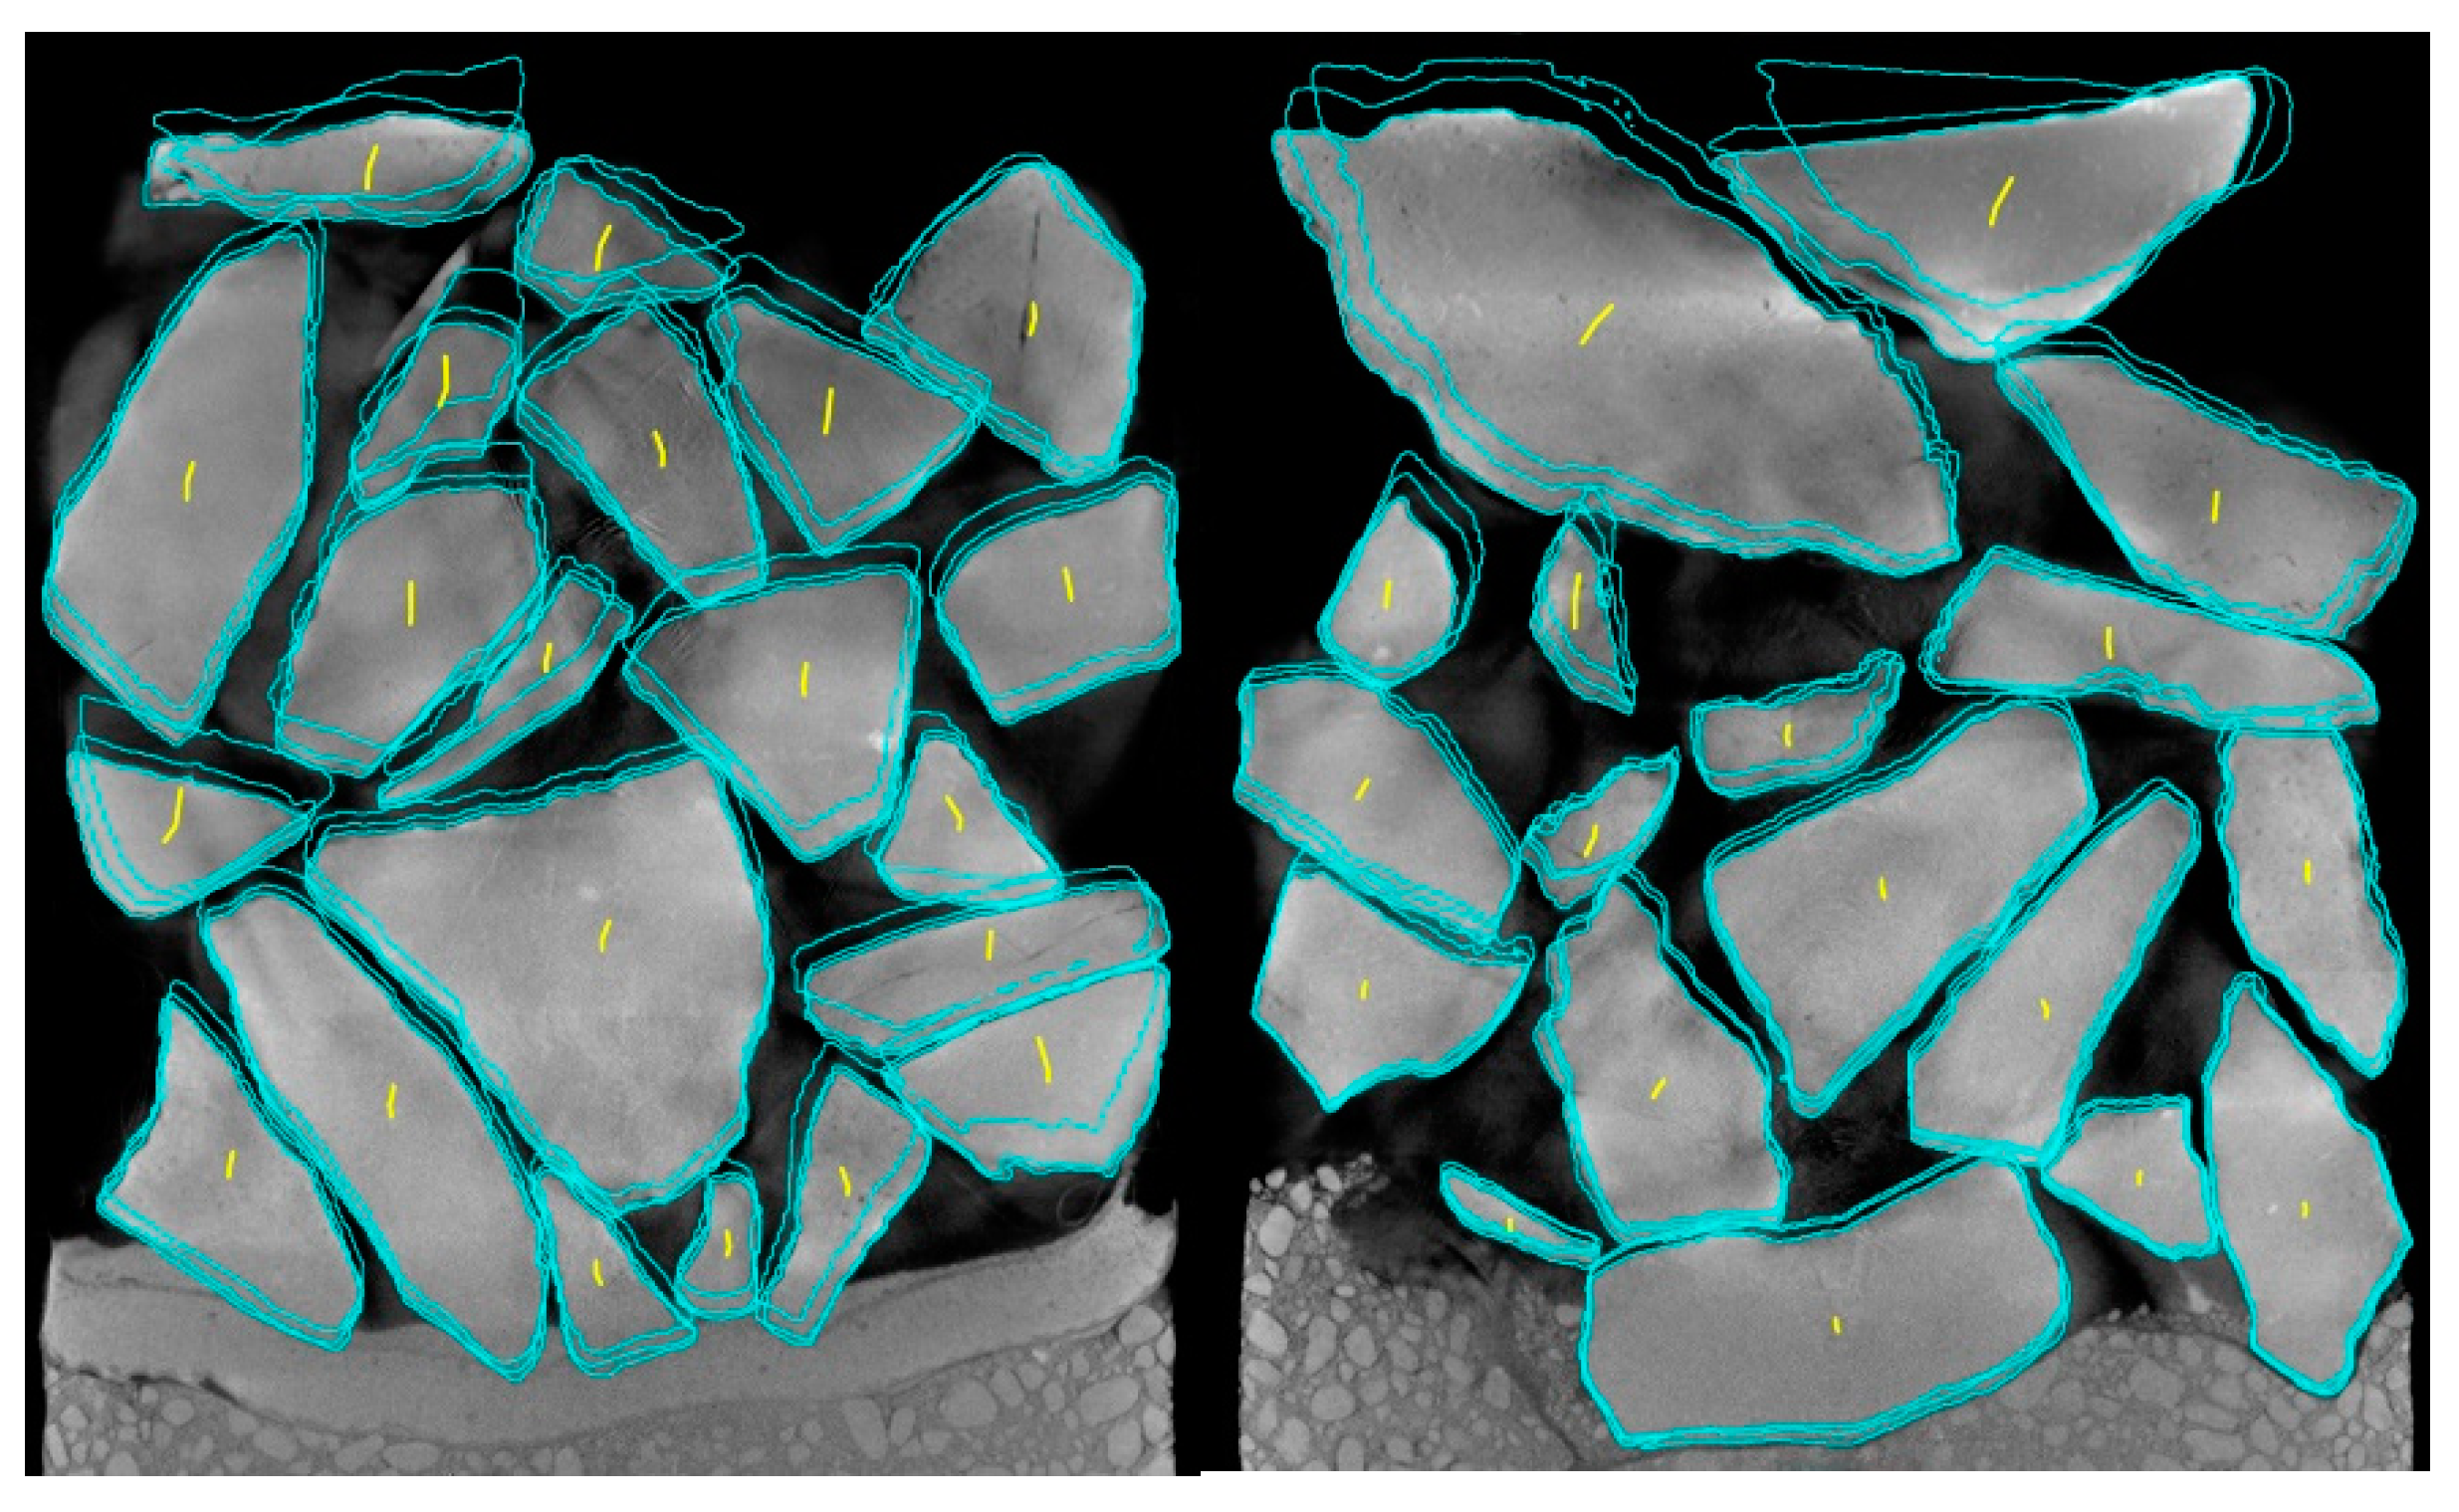
3.1. Abrasion and Breakage of the Ballast Material
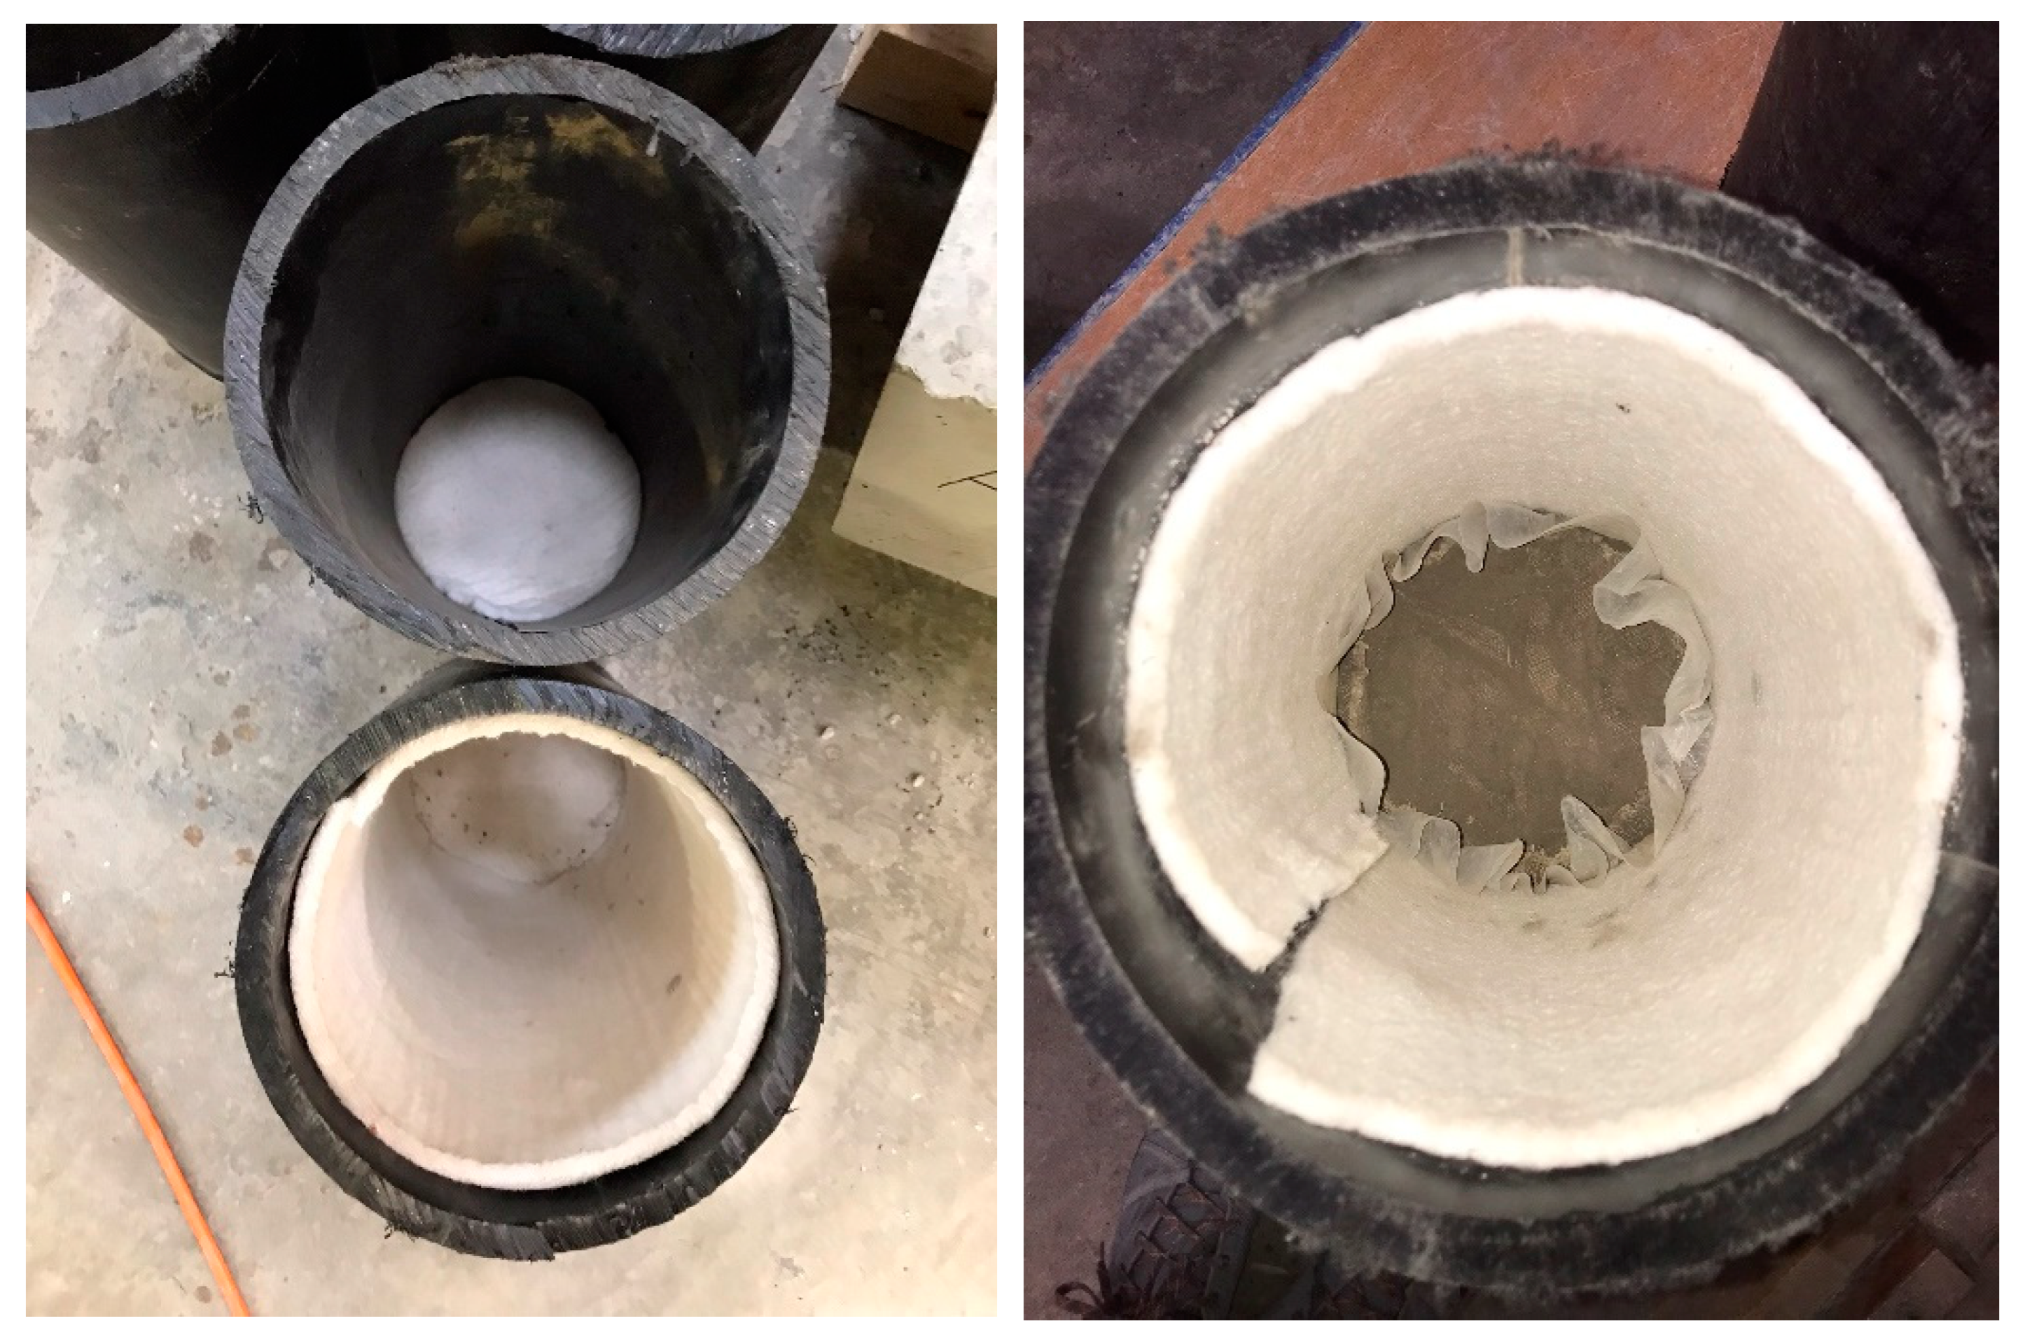
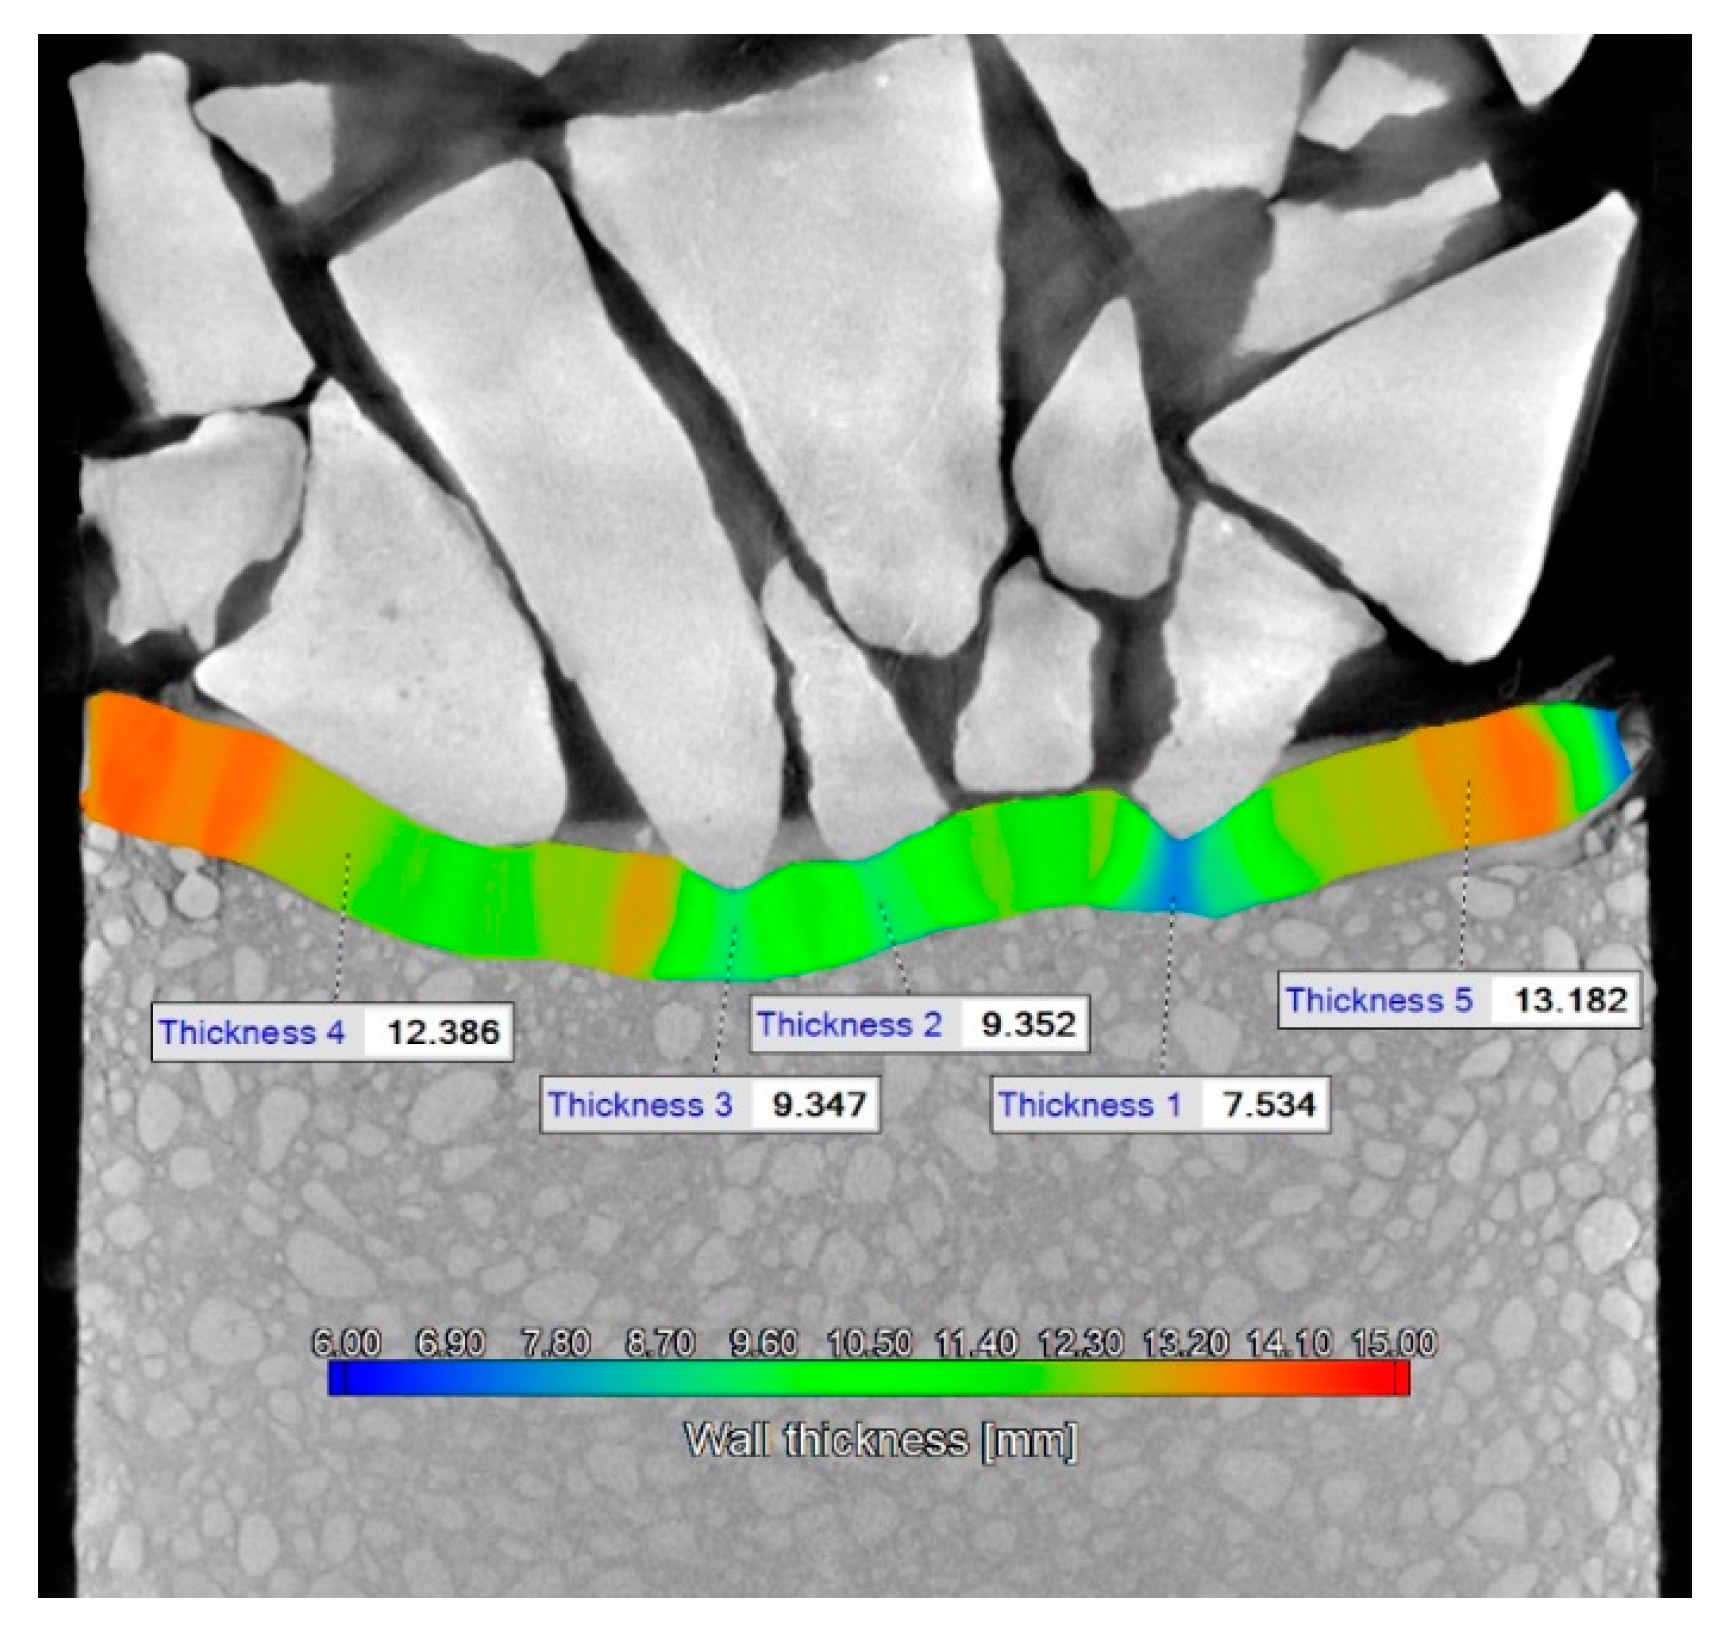
3.2. Thinning of the CC under Pressure
4. Discussion
5. Conclusions
- The rigidity of the Concrete Canvas does not increase abrasion under high static loads.
- The thickness of the CC layer decreased if the ballast particles penetrated it, but the layer was not perforated. If there is support (for example, the sandy gravel layer) under the CC layer, it takes the shape of the developed crown plate.
- The laboratory tests showed the same results as in the shear box tests. One hour after hydration, the Concrete Canvas was applied with 100 kPa for 5 min. Consequently, the ballast particles bonded in the canvas. After this, this the CC layer and the bound crushed stone particles formed one layer and worked together under loading.
Author Contributions
Funding
Data Availability Statement
Acknowledgments
Conflicts of Interest
Abbreviations
| 2D | two dimensions or two-dimensional |
| 3D | three dimensions or three-dimensional |
| CC | Concrete Canvas |
| CT | computed tomography |
| DVC | digital volume correlation |
| GCCM | geosynthetic cementitious composite mat |
| HDPE | high-density polyethylene |
| PSC | Proctor soil compactor |
| PSD | particle size distribution |
| PVC | polyvinyl-chloride |
| ROI | region of interest |
| UBM | under ballast mat |
| USP | under sleeper pad |
| XR | X-ray |
References
- Naldini, F.; Pellegrini, P.; Rodriguez, J. Real-Time Optimization of Energy Consumption in Railway Networks. Transp. Res. Procedia 2022, 62, 35–42. [Google Scholar] [CrossRef]
- Fischer, S.; Kocsis Szürke, S. Detection Process of Energy Loss in Electric Railway Vehicles. Facta Univ. Ser. Mech. Eng. 2023, 11368. [Google Scholar] [CrossRef]
- Fischer, S. Traction Energy Consumption of Electric Locomotives and Electric Multiple Units at Speed Restrictions. Acta Tech. Jaurinensis 2015, 8, 240–256. [Google Scholar] [CrossRef]
- Halkos, G.E.; Gkampoura, E.C. Evaluating the Effect of Economic Crisis on Energy Poverty in Europe. Renew. Sustain. Energy Rev. 2021, 144, 11098. [Google Scholar] [CrossRef]
- Benatia, D. Ring the Alarm! Electricity Markets, Renewables, and the Pandemic. Energy Econ. 2022, 106, 105755. [Google Scholar] [CrossRef]
- Bijnens, G.; Konings, J.; Vanormelingen, S. The Impact of Electricity Prices on European Manufacturing Jobs. Appl. Econ. 2022, 54, 38–56. [Google Scholar] [CrossRef]
- Gabrielli, P.; Wüthrich, M.; Blume, S.; Sansavini, G. Data-Driven Modeling for Long-Term Electricity Price Forecasting. Energy 2022, 244, 123107. [Google Scholar] [CrossRef]
- Yang, H.; Schell, K.R. GHTnet: Tri-Branch Deep Learning Network for Real-Time Electricity Price Forecasting. Energy 2022, 238, 122052. [Google Scholar] [CrossRef]
- Kurhan, D.; Kurhan, M.; Hmelevska, N. Development of the High-Speed Running of Trains in Ukraine for Integration with the International Railway Network. Acta Polytech. Hung. 2022, 19, 207–218. [Google Scholar] [CrossRef]
- Kurhan, M.; Kurhan, D.; Husak, M.; Hmelevska, N. Increasing the Efficiency of the Railway Operation in the Specialization of Directions for Freight and Passenger Transportation. Acta Polytech. Hung. 2022, 19, 231–244. [Google Scholar] [CrossRef]
- Kurhan, D.; Fischer, S. Modeling of the Dynamic Rail Deflection Using Elastic Wave Propagation. J. Appl. Comput. Mech. 2022, 8, 379–387. [Google Scholar] [CrossRef]
- Ahac, M.; Lakusic, S. Tram Track Maintenance-Planning by Gauge Degradation Modelling. Transport 2015, 30, 430–436. [Google Scholar] [CrossRef]
- Szalai, S.; Eller, B.; Juhász, E.; Movahedi, R.M.; Németh, A.; Harrach, D.; Baranyai, G.; Fischer, S. Investigation of Deformations of Ballasted Railway Track during Collapse Using the Digital Image Correlation Method (DICM). Rep. Mech. Eng. 2022, 3, 258–282. [Google Scholar] [CrossRef]
- Sysyn, M.; Nabochenko, O.; Kovalchuk, V.; Przybyłowicz Michałand Fischer, S. Investigation of Interlocking Effect of Crushed Stone Ballast during Dynamic Loading. Rep. Mech. Eng. 2021, 2, 65–76. [Google Scholar] [CrossRef]
- Šestáková, J.; Matejov, A.; Pultznerová, A. Rehabilitation of Railway Track Quality in Relation to Diagnostic Data. In Lecture Notes in Civil Engineering; Springer: Cham, Switzerland, 2022; Volume 189. [Google Scholar]
- József, P.; Lakatos, I. István Efficiency Optimization of Electric Permanent Magnet Motor Driven Vehicle. Mach. Des. 2015, 7, 11–14. [Google Scholar]
- Pup, D.; Szakallas, G.; Polák, J. Research of Vehicle Parameter and Sensor Systems Necessary to Control Autonomous Vehicles. In Proceedings of the 2018 14th IEEE/ASME International Conference on Mechatronic and Embedded Systems and Applications, MESA 2018, Oulu, Finland, 2–4 July 2018; p. 8449146. [Google Scholar] [CrossRef]
- European Commission Mobility and Transport. Available online: https://transport.ec.europa.eu/transport-themes/infrastructure-and-investment_en (accessed on 15 January 2023).
- Eller, B.; Fischer, S. Review of the modern ballasted railway tracks’ substructure and further investigations. Sci. Transp. Progress. Bull. Dnipropetr. Natl. Univ. Railw. Transp. 2019, 84, 72–85. [Google Scholar] [CrossRef]
- Eller, B.; Fischer, S. Tutorial on the Emergence of Local Substructure Failures in the Railway Track Structure and Their Renewal with Existing and New Methodologies. Acta Tech. Jaurinensis 2021, 14, 80–103. [Google Scholar] [CrossRef]
- Jover, V.; Fischer, S. Statistical analysis of track geometry parameters on tramway line no. 1 in budapest. Balt. J. Road Bridge Eng. 2022, 17, 75–106. [Google Scholar] [CrossRef]
- Jover, V.; Gaspar, L.; Fischer, S. Investigation of Tramway Line No. 1, in Budapest, Based on Dynamic Measurements. Acta Polytech. Hung. 2022, 19, 65–76. [Google Scholar] [CrossRef]
- Czinder, B.; Török, Á. Strength and Abrasive Properties of Andesite: Relationships between Strength Parameters Measured on Cylindrical Test Specimens and Micro-Deval Values—A Tool for Durability Assessment. Bull. Eng. Geol. Environ. 2021, 80, 8871–8889. [Google Scholar] [CrossRef]
- Czinder, B.; Vásárhelyi, B.; Török, Á. Long-Term Abrasion of Rocks Assessed by Micro-Deval Tests and Estimation of the Abrasion Process of Rock Types Based on Strength Parameters. Eng. Geol. 2021, 282, 105996. [Google Scholar] [CrossRef]
- Orosz, Á.; Angelidakis, V.; Bagi, K. Surface Orientation Tensor to Predict Preferred Contact Orientation and Characterise the Form of Individual Particles. Powder Technol. 2021, 394, 312–325. [Google Scholar] [CrossRef]
- Orosz, Á.; Tamás, K.; Rádics, J.P.; Gálos, M. Studying the Behaviour of Crushed Stone Railway Ballast Subjected to Periodic Load. In Proceedings of the European Council for Modelling and Simulation, ECMS, Caserta, Italy, 11–14 June 2019; Volume 33, pp. 1–5. [Google Scholar]
- Yang, Z.; Ren, W.; Sharma, R.; McDonald, S.; Mostafavi, M.; Vertyagina, Y.; Marrow, T.J. In-Situ X-Ray Computed Tomography Characterisation of 3D Fracture Evolution and Image-Based Numerical Homogenisation of Concrete. Cem. Concr. Compos. 2017, 75, 74–83. [Google Scholar] [CrossRef]
- Yang, Z.J.; Li, B.B.; Wu, J.Y. X-ray Computed Tomography Images Based Phase-Field Modeling of Mesoscopic Failure in Concrete. Eng. Fract. Mech. 2019, 208, 151–170. [Google Scholar] [CrossRef]
- Ying, J.; Tian, J.; Xiao, J.; Tan, Z. Identification and Reconstruction of Concrete Mesostructure Based on Deep Learning in Artificial Intelligence. Constr. Build Mater. 2022, 352, 129018. [Google Scholar] [CrossRef]
- Kraśkiewicz, C.; Zbiciak, A.; al Sabouni-Zawadzka, A.; Marczak, M. Analysis of the Influence of Fatigue Strength of Prototype under Ballast Mats (Ubms) on the Effectiveness of Protection against Vibration Caused by Railway Traffic. Materials 2021, 14, 2125. [Google Scholar] [CrossRef]
- de Lima, A.O.; Dersch, M.S.; Qian, Y.; Tutumluer, E.; Edwards, J.R. Laboratory Fatigue Performance of Under-Ballast Mats under Varying Loads and Support Conditions. Proc. Inst. Mech. Eng. F J. Rail. Rapid. Transit. 2019, 233, 606–613. [Google Scholar] [CrossRef]
- Concrete Canvas Concrete Canvas Official Webpage. Available online: https://www.concretecanvas.com (accessed on 15 January 2023).
- Eller, B.; Majid, M.R.; Fischer, S. Laboratory Tests and FE Modeling of the Concrete Canvas, for Infrastructure Applications. Acta Polytech. Hung. 2022, 19, 9–20. [Google Scholar] [CrossRef]
- Jongvivatsakul, P.; Ramdit, T.; Ngo, T.P.; Likitlersuang, S. Experimental Investigation on Mechanical Properties of Geosynthetic Cementitious Composite Mat (GCCM). Constr. Build. Mater. 2018, 166, 956–965. [Google Scholar] [CrossRef]
- Lakusic, S.; Kecur, R. The Impact of the Geometry of Rail Welds on Noise Level in Urban Environments. In Proceedings of the Annual Conference of the Australian Acoustical Society 2005, Acoustics 2005: Acoustics in a Changing Environment, Busselton, Australia, 9–11 November 2005; pp. 247–251. [Google Scholar]
- Haladin, I.; Bogut, M.; Lakušić, S. Analysis of Tram Traffic-Induced Vibration Influence on Earthquake Damaged Buildings. Buildings 2021, 11, 590. [Google Scholar] [CrossRef]
- Haladin, I.; Vranešić, K.; Ivančev, M.; Lakušić, S. Influence of Tram Vibrations on Earthquake Damaged Buildings. In Proceedings of the 1st Croatian Conference on Earthquake Engineering 1CroCEE, Zabreg, Croatia, 22–24 March 2021; pp. 1583–1593. [Google Scholar]
- Abadi, T.; le Pen, L.; Zervos, A.; Powrie, W. Effect of Sleeper Interventions on Railway Track Performance. J. Geotech. Geoenvironmental Eng. 2019, 145, 04019009. [Google Scholar] [CrossRef]
- Kuchak, A.; Marinkovic, D.; Zehn, M. Parametric Investigation of a Rail Damper Design Based on a Lab-Scaled Model. J. Vib. Eng. Technol. 2021, 9, 51–60. [Google Scholar] [CrossRef]
- Kuchak, A.; Marinkovic, D.; Zehn, M. Finite Element Model Updating—Case Study of a Rail Damper. Struct. Eng. Mech. 2020, 73, 27–35. [Google Scholar] [CrossRef]
- Fischer, S.; Horvát, F. Superstructure stabilization of ballast bedded railway tracks with geogrids. Hung. J. Ind. Chem. 2011, 39, 101–106. [Google Scholar]
- Horvát, F.; Fischer, S.; Major, Z. Evaluation of Railway Track Geometry Stabilisation Effect of Geogrid Layers under Ballast on the Basis of Laboratory Multi-Level Shear Box Tests. Acta Tech. Jaurinensis 2013, 6, 21–44. [Google Scholar]
- Fischer, S. Geogrid Reinforcement of Ballasted Railway Superstructure for Stabilization of the Railway Track Geometry—A Case Study. Geotext. Geomembr. 2022, 50, 1036–1051. [Google Scholar] [CrossRef]
- Eller, B.; Szalai, S.; Sysyn, M.; Harrach, D.; Liu, J.; Fischer, S. Investigation of concrete canvas in multi-level shear box. Nauk. Visnyk Natsionalnoho Hirnychoho Universytetu, 2023; submitted. [Google Scholar]
- MSZ EN 13450:2003; Aggregates for Railway Ballast. European Committee for Standardization: Brussels, Belgium, 2003; pp. 1–33.
- Juhasz, E.; Fischer, S. Specific evaluation methodology of railway ballast particles’ degradation. Sci. Transp. Progress. Bull. Dnipropetr. Natl. Univ. Railw. Transp. 2019, 81, 96–109. [Google Scholar] [CrossRef]
- Auenhammer, R.M.; Mikkelsen, L.P.; Asp, L.E.; Blinzler, B.J. Automated X-Ray Computer Tomography Segmentation Method for Finite Element Analysis of Non-Crimp Fabric Reinforced Composites. Compos. Struct. 2021, 256, 113136. [Google Scholar] [CrossRef]
- Kozma, I.; Halbritter, E. Measurement of the Diameter of the Imprint Based on Image Processing Using MathCAD and the Avaluation Software of an Industrial CT. Acta Tech. Jaurinensis 2013, 6, 42–58. [Google Scholar]
- Kozma, I.; Zsoldos, I.; Dorogi, G.; Papp, S. Computer Tomography Based Reconstruction of Metal Matrix Syntactic Foams. Period. Polytech. Mech. Eng. 2014, 58, 87–91. [Google Scholar] [CrossRef] [Green Version]


Disclaimer/Publisher’s Note: The statements, opinions and data contained in all publications are solely those of the individual author(s) and contributor(s) and not of MDPI and/or the editor(s). MDPI and/or the editor(s) disclaim responsibility for any injury to people or property resulting from any ideas, methods, instructions or products referred to in the content. |
© 2023 by the authors. Licensee MDPI, Basel, Switzerland. This article is an open access article distributed under the terms and conditions of the Creative Commons Attribution (CC BY) license (https://creativecommons.org/licenses/by/4.0/).
Share and Cite
Eller, B.; Movahedi Rad, M.; Fekete, I.; Szalai, S.; Harrach, D.; Baranyai, G.; Kurhan, D.; Sysyn, M.; Fischer, S. Examination of Concrete Canvas under Quasi-Realistic Loading by Computed Tomography. Infrastructures 2023, 8, 23. https://0-doi-org.brum.beds.ac.uk/10.3390/infrastructures8020023
Eller B, Movahedi Rad M, Fekete I, Szalai S, Harrach D, Baranyai G, Kurhan D, Sysyn M, Fischer S. Examination of Concrete Canvas under Quasi-Realistic Loading by Computed Tomography. Infrastructures. 2023; 8(2):23. https://0-doi-org.brum.beds.ac.uk/10.3390/infrastructures8020023
Chicago/Turabian StyleEller, Balázs, Majid Movahedi Rad, Imre Fekete, Szabolcs Szalai, Dániel Harrach, Gusztáv Baranyai, Dmytro Kurhan, Mykola Sysyn, and Szabolcs Fischer. 2023. "Examination of Concrete Canvas under Quasi-Realistic Loading by Computed Tomography" Infrastructures 8, no. 2: 23. https://0-doi-org.brum.beds.ac.uk/10.3390/infrastructures8020023