Article

Vibration Diagnostic Methods of Automatic Transmission Service Requirement Prediction

1
Central Campus Győr, Széchenyi István University, H-9026 Győr, Hungary
2
Department of Transport Infrastructure, Ukrainian State University of Science and Technologies, UA-49005 Dnipro, Ukraine
3
Department of Planning and Design of Railway Infrastructure, Technical University Dresden, D-01069 Dresden, Germany
*
Authors to whom correspondence should be addressed.
Submission received: 14 January 2023 / Revised: 5 February 2023 / Accepted: 9 February 2023 / Published: 10 February 2023
(This article belongs to the Special Issue Land Transport, Vehicle and Railway Engineering)

Abstract

:
Automatic transmission is a key factor for autonomous driving. The transmission condition is highly affected by the quality and quantity of transmission oil in the system. However, the oil condition is not monitored in the system, and the oil change interval and method are still a subject of discussion. This paper analyzes the effects of oil changes in automatic transmissions. The measurements were carried out before and after the oil change with the same external conditions. With the vibration measurement method, data can be collected without disassembling the parts and during operational conditions. Furthermore, time- and frequency-based analyses were conducted to compare different transmissions’ operations. The results have shown that the effect of oil degradation is measurable on the amplitude of the signals and, therefore, predictable with vibration diagnostics. During the evaluation, the maximum values were compared on measurements with at least a 2-s length.

1. Introduction

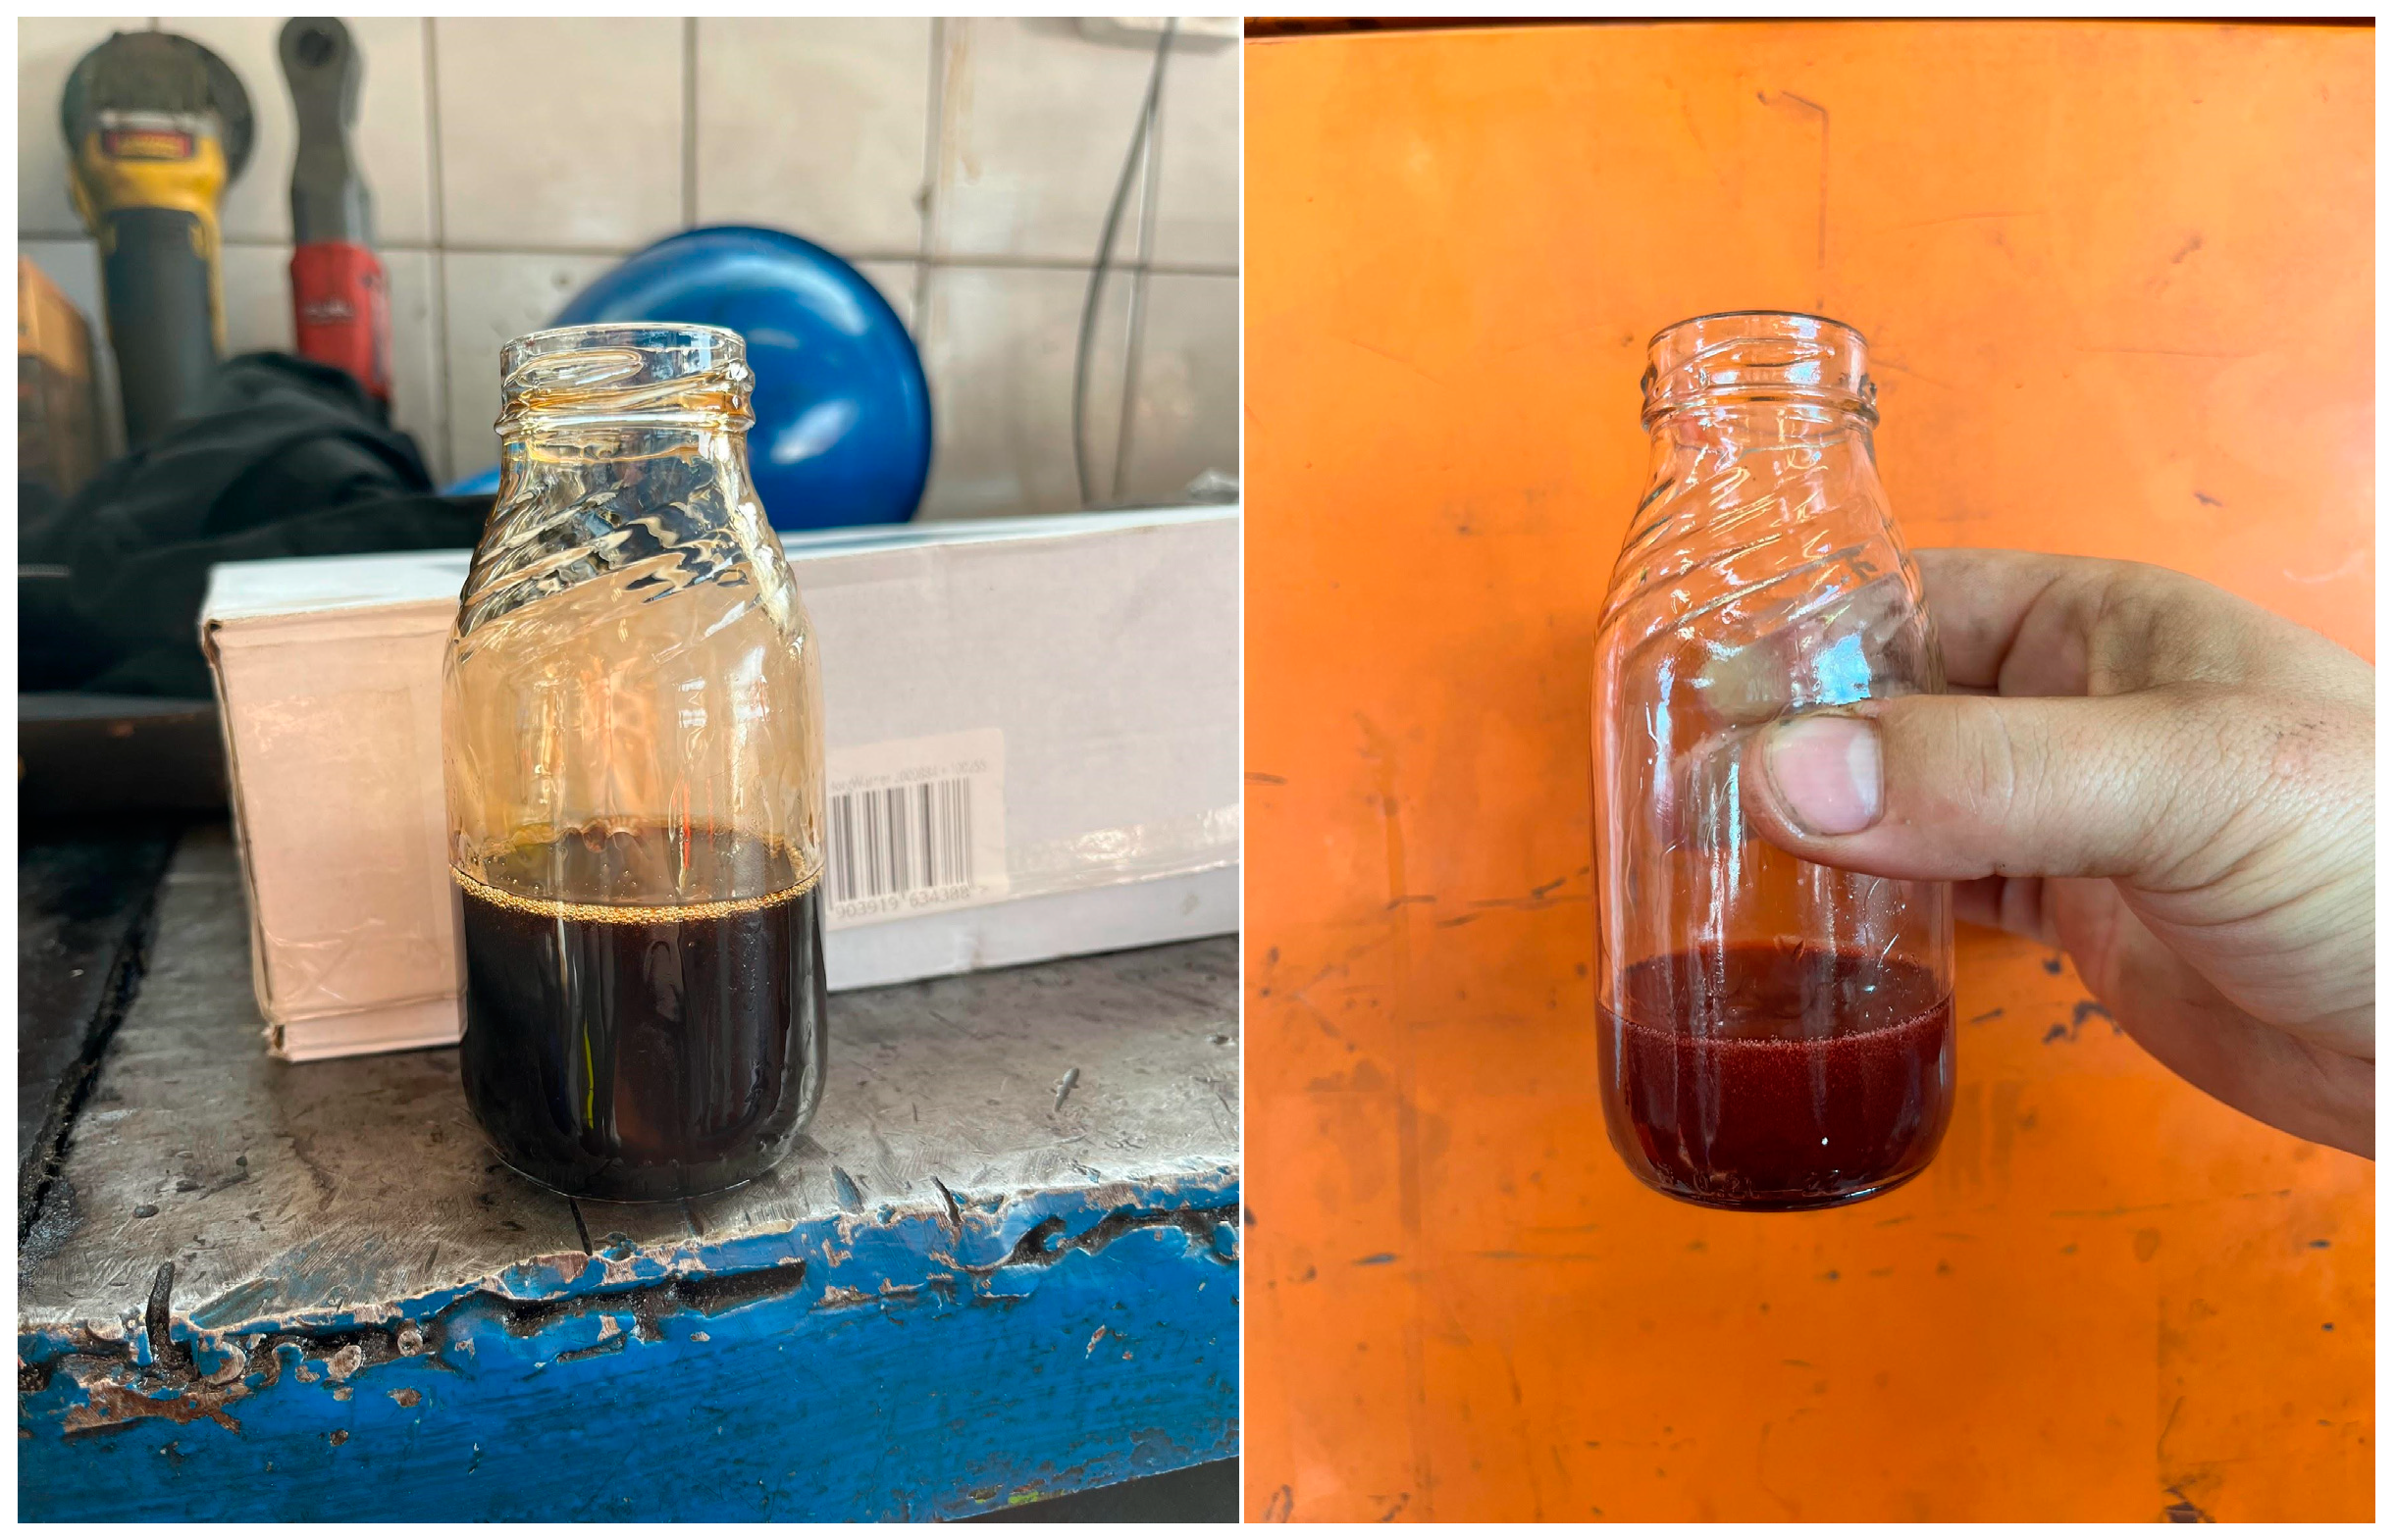
1.1. Automatic Transmissions in Cars, Focusing on Oil Degradation

Nowadays, most new cars are equipped with automatic transmissions, so it is important to deal with the transmissions’ condition, which is highly affected by the quality and quantity of transmission oil in the system. Although the oil condition is not monitored, some manufacturers recommend no oil change during the lifetime of the transmission unit, but others recommend a maximum of 100,000 km service intervals. Therefore, the oil change interval and the method are still being discussed.
Oil degradation occurs even if the manufacturer does not require the oil to be changed in some automatic transmissions. Several studies performed different measurements on oil pressure, and different oil quality tests have been conducted [1,2,3,4,5]. However, all these papers agree that the degradation in oil quality affects the operation of the machine—for example, the automatic transmission.
The degradation can be caused by different factors [6,7]. There can be metal or water contamination, which affects the control parts and even the clutches and brakes of the transmission [8]. In the new generation of automatic transmissions, the heat exchanger for the automatic transmission fluid (ATF) is usually cooled by the engine’s cooling system. This means that if there is a failure in the heat exchanger, cooling fluid can enter the transmission and can cause different faults.
Overheating can also be an effect that speeds up oil degradation [9]. Overheating can be caused by extreme conditions or low ATF levels. The transmission controller usually evaluates the ATF temperature to prevent damage to the unit. As the transmissions’ emission control units (ECUs) are now placed in the transmission housing and in contact with oil, it is easier to include some sensors inside the housing. Pressure sensors, for example, are now implemented for some necessary clutches or pressure accumulators, so they can also be used for self-diagnosis, and there is no need to attach external pressure gauges.
Rotation sensors are already part of automatic transmission, as the ECU needs input data to control them properly. In addition, the rotation speeds of different shafts in the transmission can also give information about the malfunction.
Oil degradation means not only contamination but also the change in significant friction and flow properties [10,11,12]. These changes are proven in some previous articles dealing with ATF degradation. In addition, if the oil’s viscosity changes, the flow properties will also change, which can occur in the transmission behavior [13,14]. Oil pressure tests have already shown this effect [15].
Vibration analysis is a well-known method in the maintenance of manufacturing machines and is nowadays used on more and more occasions in railway and automotive diagnostics [16,17,18,19,20]. In some cases, automotive parts are tested with an accelerometer during manufacturing or at the end of the line test, but these sensors are usually applied to the part once they are manufactured, and the next time a failure occurs [21]. Long-term analysis or self-diagnostic functions are not implemented in the automotive industry [22].
Previously published oil tests were based on oil samples evaluated in laboratories [23,24,25,26]. It requires dismantling the system and taking samples; the results cannot be evaluated inside the vehicle. Vibration measurement, on the other hand, allows on-board measurement and evaluation. Vibration measurement was previously used mainly to look for bearing and gear failures.

1.2. General Studies about Transmissions and Their Oils

The authors aimed to collect other promising and significant studies on the topic of automatic transmissions and their oils. The following paragraphs deal with the up-to-date literature.
Tang et al. [27] analyzed the improvement of the shift quality of automatic transmissions. The modeling and simulation capability provided by the ITI-SimulationX software was used to analyze the oil pressure shift rule. The study aimed at the optimized design of the clutch based on MATLAB and fuzzy theory. The paper dealt with the wet multi-plate clutch in detail. Using the constructed computer model, the changes in the relative thermal index were traced after optimization, and the operating characteristics of the clutch were increased.
Dong et al. [28] examined the oil pressure characteristics in the transmission control unit of the automatic transmission of a truck. The simulation model of the control unit was implemented in the same software as in [27]. The model has been validated on a bench test. Based on the optimization performed, the study concluded that two main factors were the cause of early failures: (i) collisions between hydraulic control units during shifting and (ii) extended periods of sliding friction. With the simulation and optimization model, early failures could be eliminated.
Kučera et al. [29] investigated different types of transmission oils. They aimed to estimate the particle dispersion of abrasive particles in gearbox oil samples under test using the LaserNet Fines-C automatic laser particle counting and classifying system, a high-accuracy and fully automated tribo-technological diagnostic tool. The use of automated particulate counting and other techniques (atomic emission spectrometry, infrared spectrometry) is an effective means to monitor and evaluate lubricants.
Liu et al. [30] examined the electric oil pump of an eight-speed automatic transmission. The considered oil pump needed to conform with the design condition: start–stop function and efficiency improvement. The loss of power in the transmission and the leakage in the hydraulic system were computed by a composed mathematical model, which was validated by a forwarding driving simulation. The mathematical model was based on fluid mechanics. Based on the modeling results, it could be concluded that there is an optimal size of the mechanical oil pump and electric oil pump in terms of energy consumption reduction and minimization. Furthermore, the authors proposed control strategies for the electric oil pump and oncoming clutch to achieve a fast and smooth starting process in practice.
Kim et al. [31] suggested a power-based control strategy for the electric oil pump of a six-speed automatic transmission in a hybrid electric vehicle. The presented method can predict the viscosity factor without measuring the temperature of the ATF. In addition, it can control the electric oil pump on the basis of performance. The viscosity coefficient was visualized using a three-dimensional plot of the steady-state network pressure and the power and speed of the electric oil pump. Then, the viscosity factor was utilized to control the electric oil pump to achieve the target pressure in the system according to the control power and according to the 3D viscosity factor–pressure–performance map. A multi-stage control was recommended to reduce energy consumption based on low, high, and medium power according to the vehicle’s driving conditions.
Song et al. [32] dealt with an electric oil pump control algorithm for a hybrid electric vehicle assembled by an automatic transmission. The performance simulator was developed using the powertrain, hydraulic control system, and oil pumps (mechanical and electrical). Based on simulation and testing results, a viscosity index–line pressure–electric oil pump performance map is recommended to characterize the power requirements according to the viscosity index and the required line pressure. An electric oil pump controller programming scheme has been derived to implement an electric oil pump control using multi-stage power for a given viscosity index. The simulation results validated that the control algorithm of the electric oil pump fulfilled the maximum line pressure during the gear change.
Seo and Sungdo [33] conducted research on the remanufacturing process of oil pumps for automatic transmissions with seven speeds. The paper incorporates a bushing assembly procedure and a gear and housing polishing process to restore the performance of the old oil pump. The feasibility of the technology was demonstrated by comparing the volumetric efficiency of two remanufactured and two original oil pumps. The results indicated that the volumetric efficiency of the remanufactured oil pumps was more than 95% compared to the original oil pumps in the five selected rpm ranges.
Farfán-Cabrera et al. [34] investigated the frictional behavior of a wet clutch using a bio-lubricant. This lubricant was the so-called Jatropha oil. They performed laboratory experiments, i.e., a pin-on-disk test with the comparison of ATF. ATF was mixed in different ratios with Jatropha oil, and the mixtures were tested based on friction. The friction behavior obtained indicated that the mixtures exhibited anti-shock properties. Therefore, Jatropha oil can be utilized as part of an ATF mixture to improve the anti-vibration characteristics and increase the torque transfer performance of wet clutches with controlled-locking clutch systems, improving the overall economy of vehicles.
Cahyadi et al. [35] dealt with preliminary anti-wear testing for ATFs. The applied method was the so-called four-ball method, which is relatively cheap, quick, and easy. They conducted experiments on the anti-wear property of an automatic transmission lubricating oil, and they took into consideration five-month-duration tests.
Wang and Li [36] studied the poly-alpha-olefin-based ATFs. The tested lubricants were applied in buses for a sixty-thousand-kilometer test to be able to determine and check their performance changes as a function of the driven mileage. Several parameters were determined, i.e., viscosity and wear resistance under high temperatures. So-called crankcase simulation tests were executed regarding the research. As expected, the higher the driven mileage, the lower the kinematic viscosity, the viscosity index, and the maximum no-bite load values. In the end, the crankcase simulation tests were not adequate in predicting the driving tests with high accuracy.
Wu et al. [37] considered optimizing die-casting procedures for heavy-duty automatic transmission oil circuit boards. The authors analyzed the high-pressure die casting (HPDC) technology as an adequate solution to avoid molding defects. First, the injection molding tool was designed. Then, trial data from the Taguchi method orthogonal array (L25) were employed as a practice specimen, and the porosity of the injection molded part was studied as a function of the casting variable parameters. In particular, the velocity, temperature, and injection pressure were evaluated, while the mathematical modeling satisfied the accuracy test. The particle size optimization approach was used to optimize the model to achieve the minimum porosity. The experimental results demonstrated that the optimization obtained with the particle size optimization algorithm is preferable to the results achieved from the Taguchi method and offers a substantial enhancement compared to the pre-optimization ones.
The above-mentioned and cited papers, of course, do not cover all of the fields of transmissions and their applied oils; however, the authors decided to prepare a short overview from this aspect, too.

1.3. Novelty and the Structure of the Current Paper

This paper analyzes the effect of oil change in an automatic transmission that has not been required in original equipment manufacturer (OEM) applications and has not been mentioned in previous studies. The measurements were carried out before and after the oil change with the same external conditions. The vibration measurement method can collect data without disassembling the parts during operational conditions. Furthermore, time- and frequency-based analyses were conducted to compare different transmissions’ operations. This study aimed to analyze the possibility of using accelerometers to detect oil degradation in conventional automatic transmissions, not only for bench or one-piece analysis but also for self-diagnostic transmissions [11,38,39,40].
The car (BMW 225 XE) was selected to have a modern but conventional automatic transmission with a hydrodynamic torque converter. However, it was also essential to test a vehicle with an automatic gearbox that did not have a prescribed oil change interval and to ensure that the oil was genuine before the change.
The study had both short-term and long-term objectives: to measure the effect of oil degradation using the Pico NVH kit and to investigate the applicability of a new diagnostic function.
Indicating the need to change the oil in automatic transmissions or the initial failure of the transmission can increase the service life, reduce the possibility of failure, and thus reduce repair costs and material consumption.
Maintenance can be flexible and condition-dependent, which is the most reliable and environmentally friendly of all maintenance methods.
The structure of this work is as follows: Section 2 contains the Materials and Methods, Section 3 is the Results and discussion, and Section 4 is the Conclusions.

2. Materials and Methods

The measurements were executed on a BMW 225 XE vehicle assembled with a TF72-SC-type automatic transmission. However, the original ATF worked for 98,000 km (see Figure 1). This traveled distance is long enough to cause oil degradation due to an AT supplier, which recommends an ATF change every 100,000 km. In addition, although the selected vehicle is a plug-in hybrid car, the transmission’s output shaft continuously rotates when the car is running.
The oil change was done with the Launch CAT 501-S Automatic Oil Change Equipment, which allows the use of a detergent. The aim of the detergent is to flush the system and clean it as much as possible. More than 95% of the ATF can be changed with the proper equipment, which means that the oil’s properties after the change are very similar to the brand-new oil.
All the vibration measurements were performed before and after the oil change to compare the results under different external conditions.
The PicoDiagnostics NVH kit was applied to take the measurements. The first task was to place the sensors on the car. The Pico NVH kit has a 4-channel scope, which allows for recording two sensors and two directions. The first sensor was placed on the gearbox and the second sensor on the transmission mounting bracket. The x direction of the sensor on the gearbox recorded the vertical (i.e., up and down) movements (see Figure 2), while the z direction recorded the lateral (i.e., back and forth) movements (see Figure 3). The sensor on the bracket also recorded the same (i.e., the same directions of movement).
After mounting the sensors at the proper place on the vehicle, the next step was to place the sensors, the attenuators, and the scope with the computer together (see Figure 4). On the transmission, forward and backward movements were recorded by channel A (blue wire), up and down movements by channel B (red wire), and finally, on the bracket, forward and backward movements were recorded by channel C (green wire) and up and down movements by channel D (yellow wire).
The measurements were fulfilled with the following conditions:
  • idling;
  • acceleration with the gear change;
  • 50 km/h vehicle speed in 3rd gear;
  • standstill with “D” selected.
Different data evaluation methods can be used [15,40,41,42]. In this case, the Pico Diagnostics software was applied. The software can analyze in time and frequency domains with the limitation that at least 2 s of measurements must be converted to the frequency domain to ensure sufficient data for evaluation.
Table 1 contains the available parameters of the measurement device.
As the oil viscosity depends on the temperature, the measurements were done at the operating temperature (80 °C). The oil temperature was measured via the serial OBD port with the Launch Euro Tab II diagnostic tool.

3. Results and Discussion

The evaluation of the measurements was performed in the time and frequency domains. Time-based evaluation is appropriate to compare the peaks. Observation on the same scale ensures the assessment of the differences in the vibration efficiently. On the other hand, frequency-based evaluation is necessary as the transmission elements rotate, so periodic signals are generated.
This evaluation was carried out under the operating conditions previously described and, therefore, cannot be clearly extrapolated to the entire operating characteristics of the vehicle. The temperature varied slightly during the measurement. There was a load variation between the different measurement modes, resulting in a temperature variation. The applicability of the measurement was limited by the fact that only operating temperatures were measured.
During idling, the transmission oil pump is working, and the input shaft is rotating, so several vibrations can occur. In Figure 5 and Figure 6, it can be easily seen how the oil change decreased the vibrations on the transmission. Both directions show lower peaks and signals.
For further investigations with the Pico Diagnostics software, Fourier transformation was done, and 3D frequency analysis was possible, showing the vibrations in the frequency domain (see Figure 7).
Figure 8 clearly shows that the transmission vibration is lower after the oil change, barely approaching 220 mg (1.0 mg means an acceleration of 10–3 × 9.80665 m/s2). This change corresponds to a difference of around 21%, which can be considered relevant. The up and down movements on the gearbox have also been reduced to 76.5 mg, a reduction of 28%. However, it is also worth comparing them over time, as Figure 6 clearly shows that the sensor detected much less vibration on the gearbox after the oil change. The large and high-amplitude vibrations disappeared, and only small vibrations were detected in the time domain test. The idle speed measurement after the oil change showed no change, so the external conditions were the same during the two different measurements.
The sensor on the bracket shows fewer vibrations as there is no high torque, and the rubber elements decrease the vibrations. As a result, there was no significant change in the vibrations on the bracket, which means that only the sensor on the transmission could recognize the effect of the oil change.
Measurements were carried out with no constant speed (see Figure 9 and Figure 10). Due to this, it was more difficult to analyze because of the parameter change. Furthermore, carrying out the same acceleration and same gear change is impossible during a road test.
Acceleration from 0 km/h to 70 km/h was evaluated in 30-s-long measurement data to minimize the deviation caused by the different measurement conditions. To be able to carry out a proper evaluation, a longer measurement time was applied, which means that the frequency analysis contains data from different vehicle speeds. In addition, the gear changes were done manually to ensure the same engine speeds during the measurements.
Before the oil change, the highest vibration on the gearbox was 894 mg. As in the previous measurement, the highest vibration was also found in the back-and-forth movement of the gearbox. The maximum value for the up-and-down movement of the gearbox was 301 mg. The variations and the oscillation excursions were also clearly visible in the time domain.
When tested in the frequency range before the oil change, the maximum vibration in the gearbox corresponded to 894 mg (Figure 11). As in the previous measurement, the highest vibrations were found in the back-and-forth movement of the gearbox. The maximum value for the up-and-down movement of the gearbox was 301 mg. The variations and the oscillation excursions were also clearly visible in the time domain.
After the oil change (see Figure 12), the vibrations on the gearbox reached 747 mg, so there was a reduction of around 17%, which can be considered a relevant change. There was also a change in the x direction accelerations, where we measured 245 mg, a slightly higher reduction of 19%. The time domain analysis in Figure 10 also shows that although some reduction can be seen, only small vibrations were decreased.
The measurements were carried out with constant vehicle speed operation on the same good-quality road to provide as similar conditions as possible. With a 50 km/h vehicle speed, 20-s-long measurements were executed to obtain sufficient data to compare the behavior before and after the oil change was done.
At a constant speed, 654 mg was the highest value measured before the oil change, and the gearbox’s back-and-forth movement was the most significant. If we consider the condition after the oil change, we find that there is a slight change in the vibration of the gearbox, dropping to 626 mg. As with the previous measurement, the authors considered the percentage change, which was a 5% decrease. If we considered the up-and-down movement on the transmission, a value of 227 mg was measured before the oil change, and 199 mg after the oil change. This means a 13% decrease. Moreover, if we consider the time domain, it can be seen that there is a slight difference between the two graphs (Figure 13 and Figure 14).
The standstill in “D” is a measurement wherein a gear is engaged, but there is no vehicle speed, so it is better to compare the transmission’s behavior with different oil quality. In this measurement (see Figure 15 and Figure 16), before the oil change, the measurement unit recorded 297 mg as the highest acceleration amplitude for the forward and reverse movement of the gearbox, while, after the oil change, the authors measured 260 mg in the frequency domain. The acceleration in the x direction before the oil change was 122 mg, while, after the oil change, this value decreased to 108 mg, which means a 12% decrease.
When examining the time range, it can be seen that both the forward–backward and up–down movements of the transmission are much smoother than before the oil change, with both types of movement losing the small vibrations and high excursions, the latter being particularly noticeable in the up–down movement.
Table 2 contains the results as a summary based on the comparison of the maximum values of the frequency-based analysis.
The results have shown that the ATF degradation could have been detected under different operations. For example, the change in the vibration of the conventional automatic transmission can be a sign of the transmission’s service time.
As not only conventional automatic transmissions can be found on the market, it is also essential to perform similar measurements on different types of automatic transmissions, such as continuously variable transmission (CVT) or dual-clutch transmission (DCT) types. The location of the sensors can also be analyzed to identify the best place or places to install accelerometers. As the accelerometer could also be helpful in identifying different types of faults in the transmission, further analysis should be carried out with other faults.
These results can be used in manufacturer specifications and life cycle planning methods.

4. Conclusions

The authors offer the following relevant statements based on the carried out investigation:
  • Vibration measurement can be an appropriate method for detecting oil degradation.
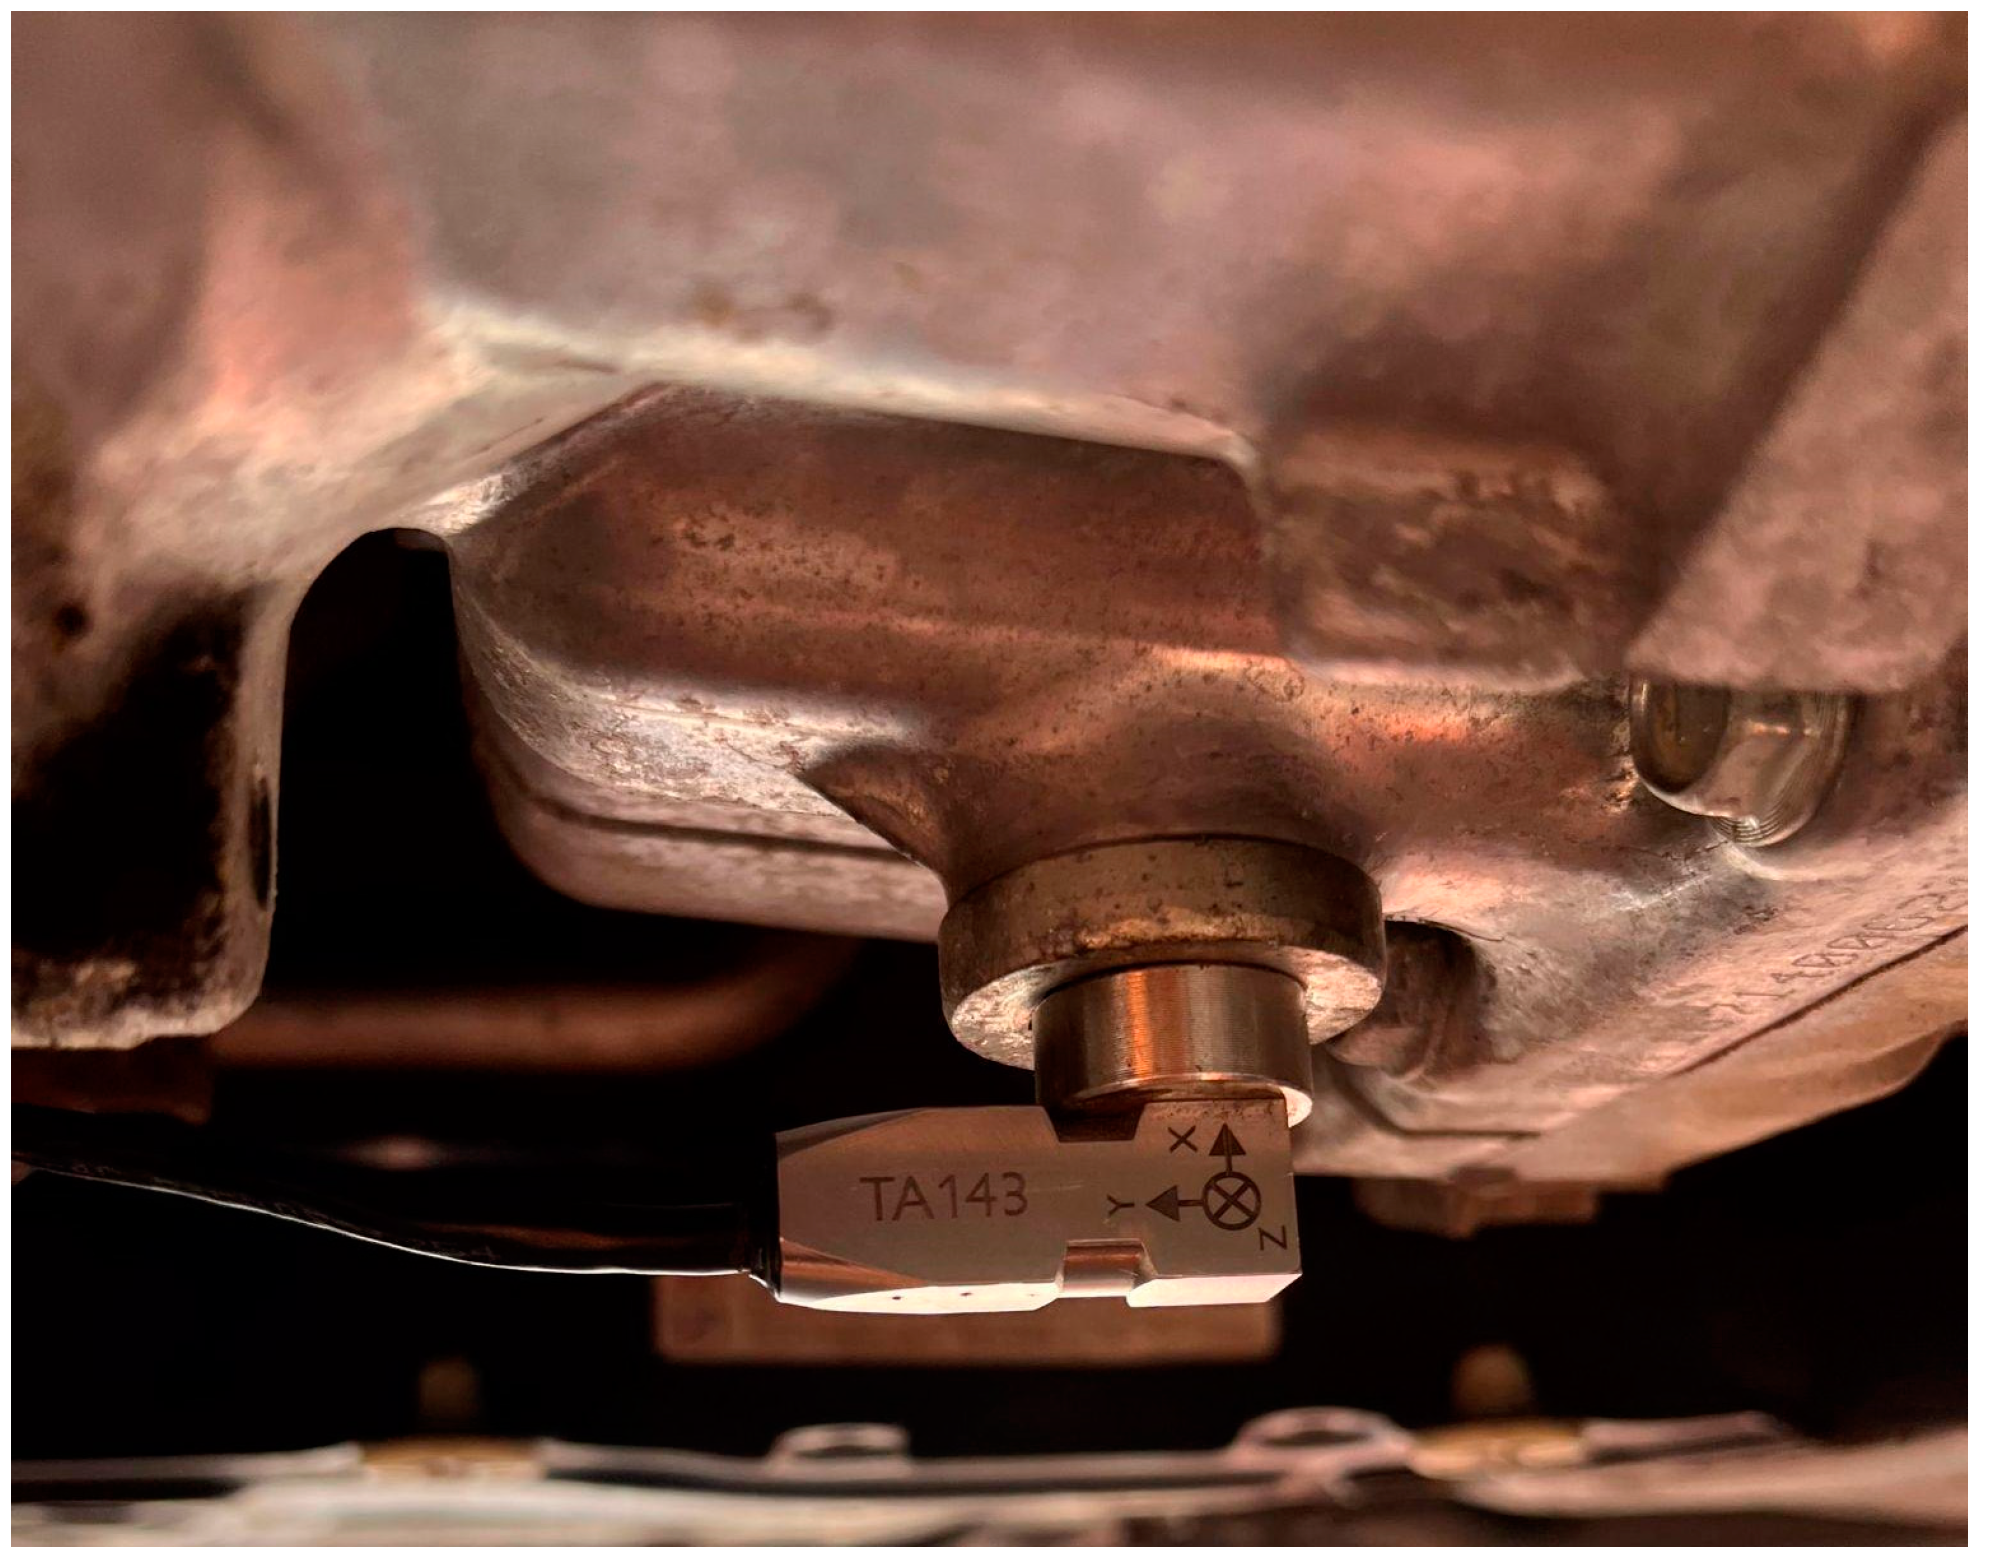
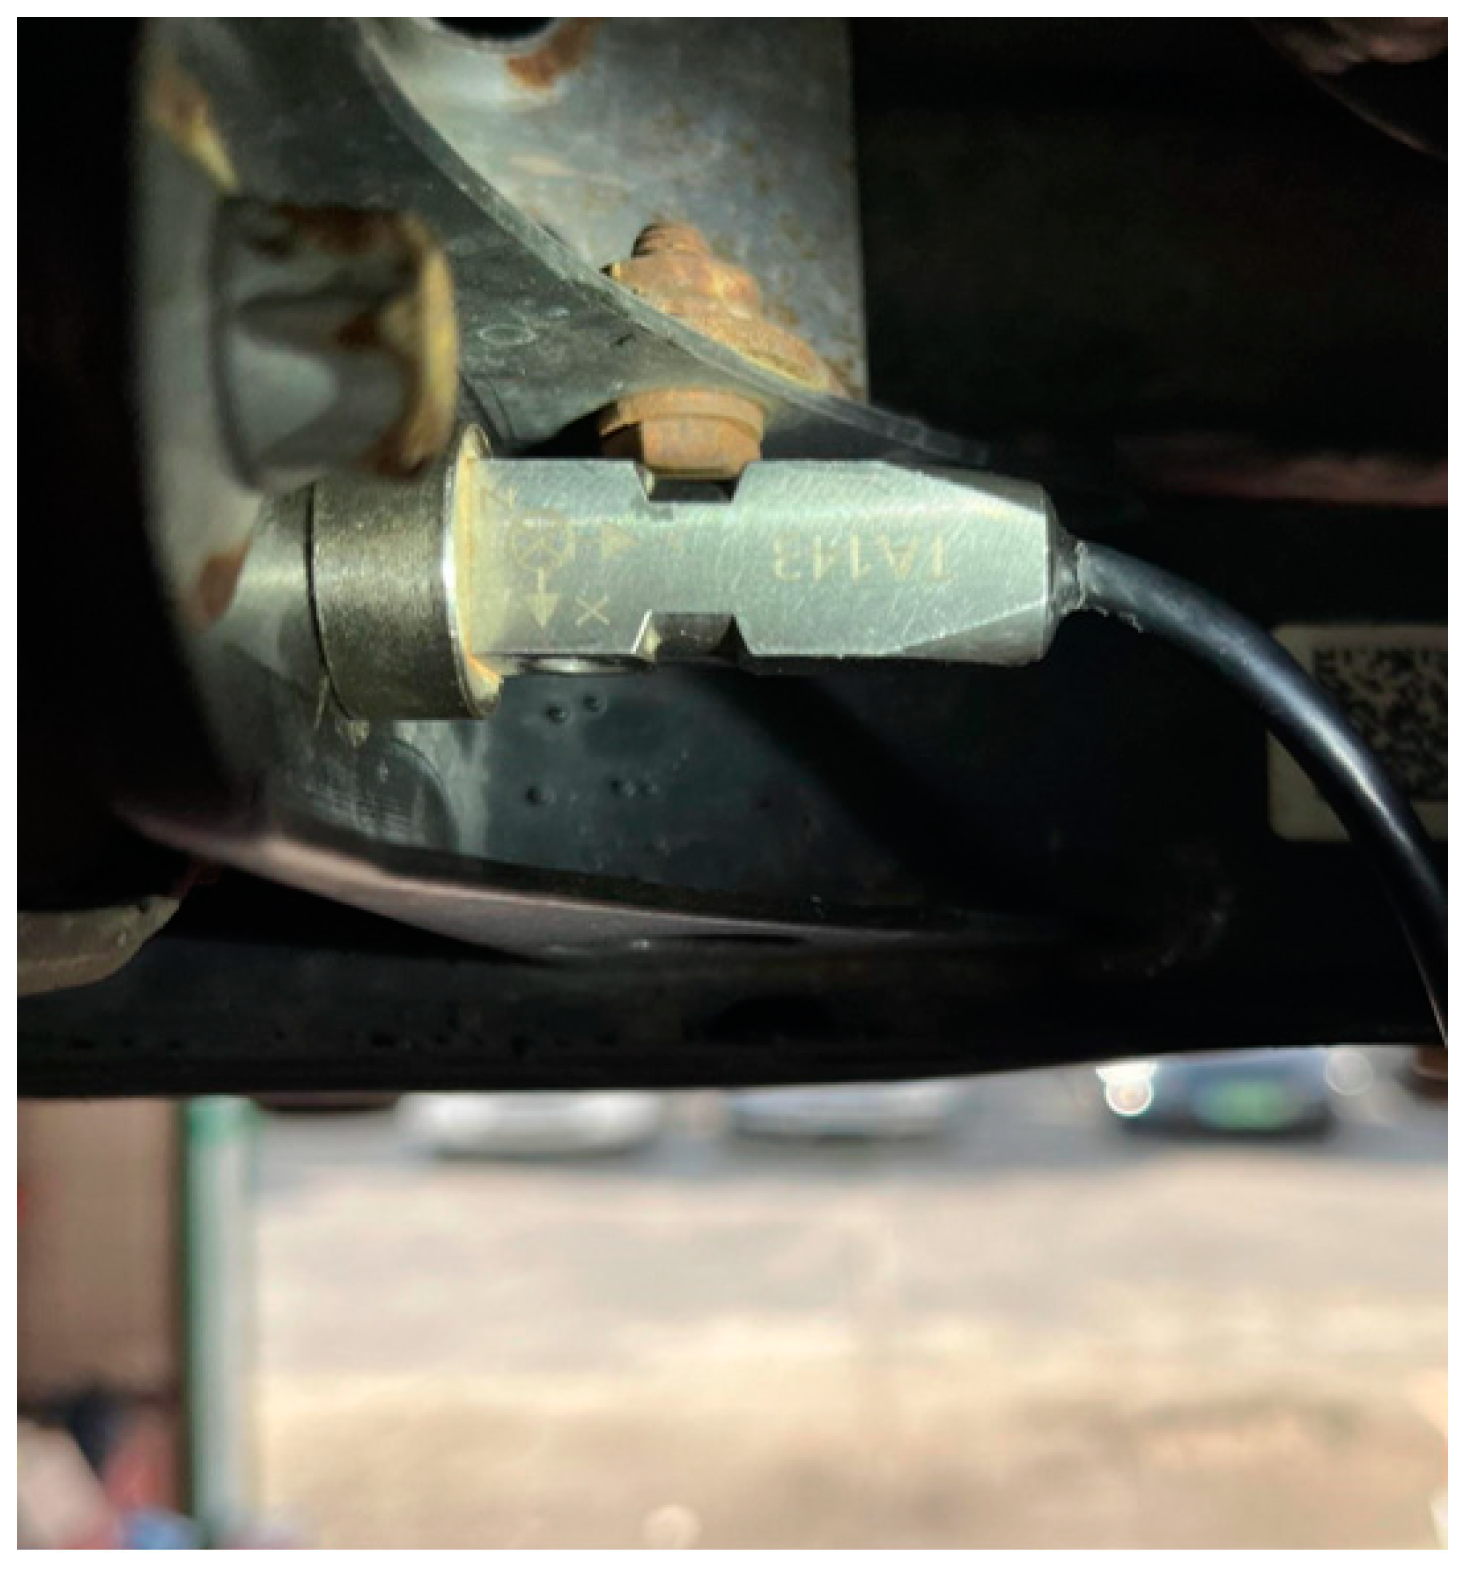
  • Accelerometers should be placed on the transmission unit itself to be able to detect the changes in the ATF properties.
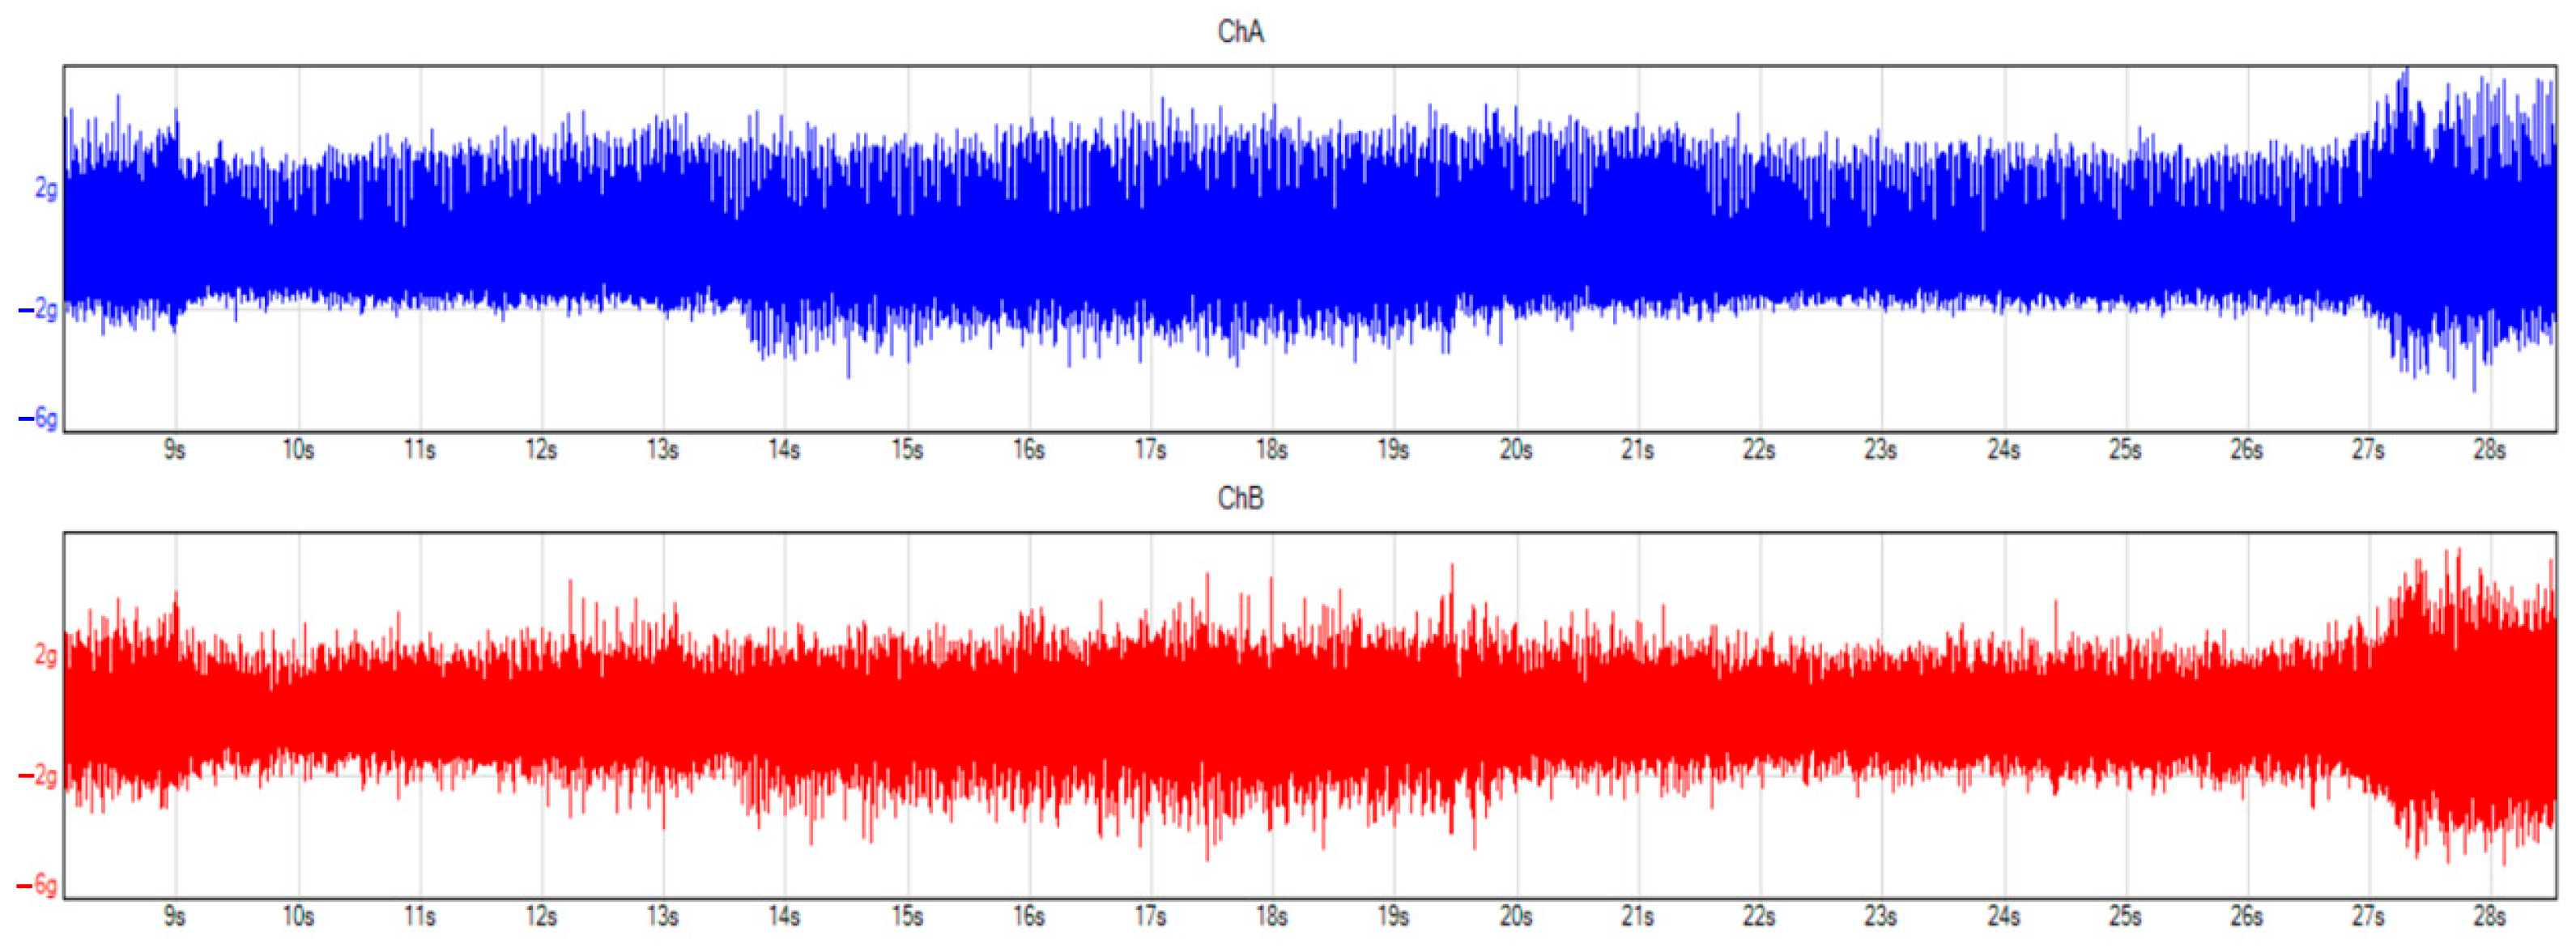
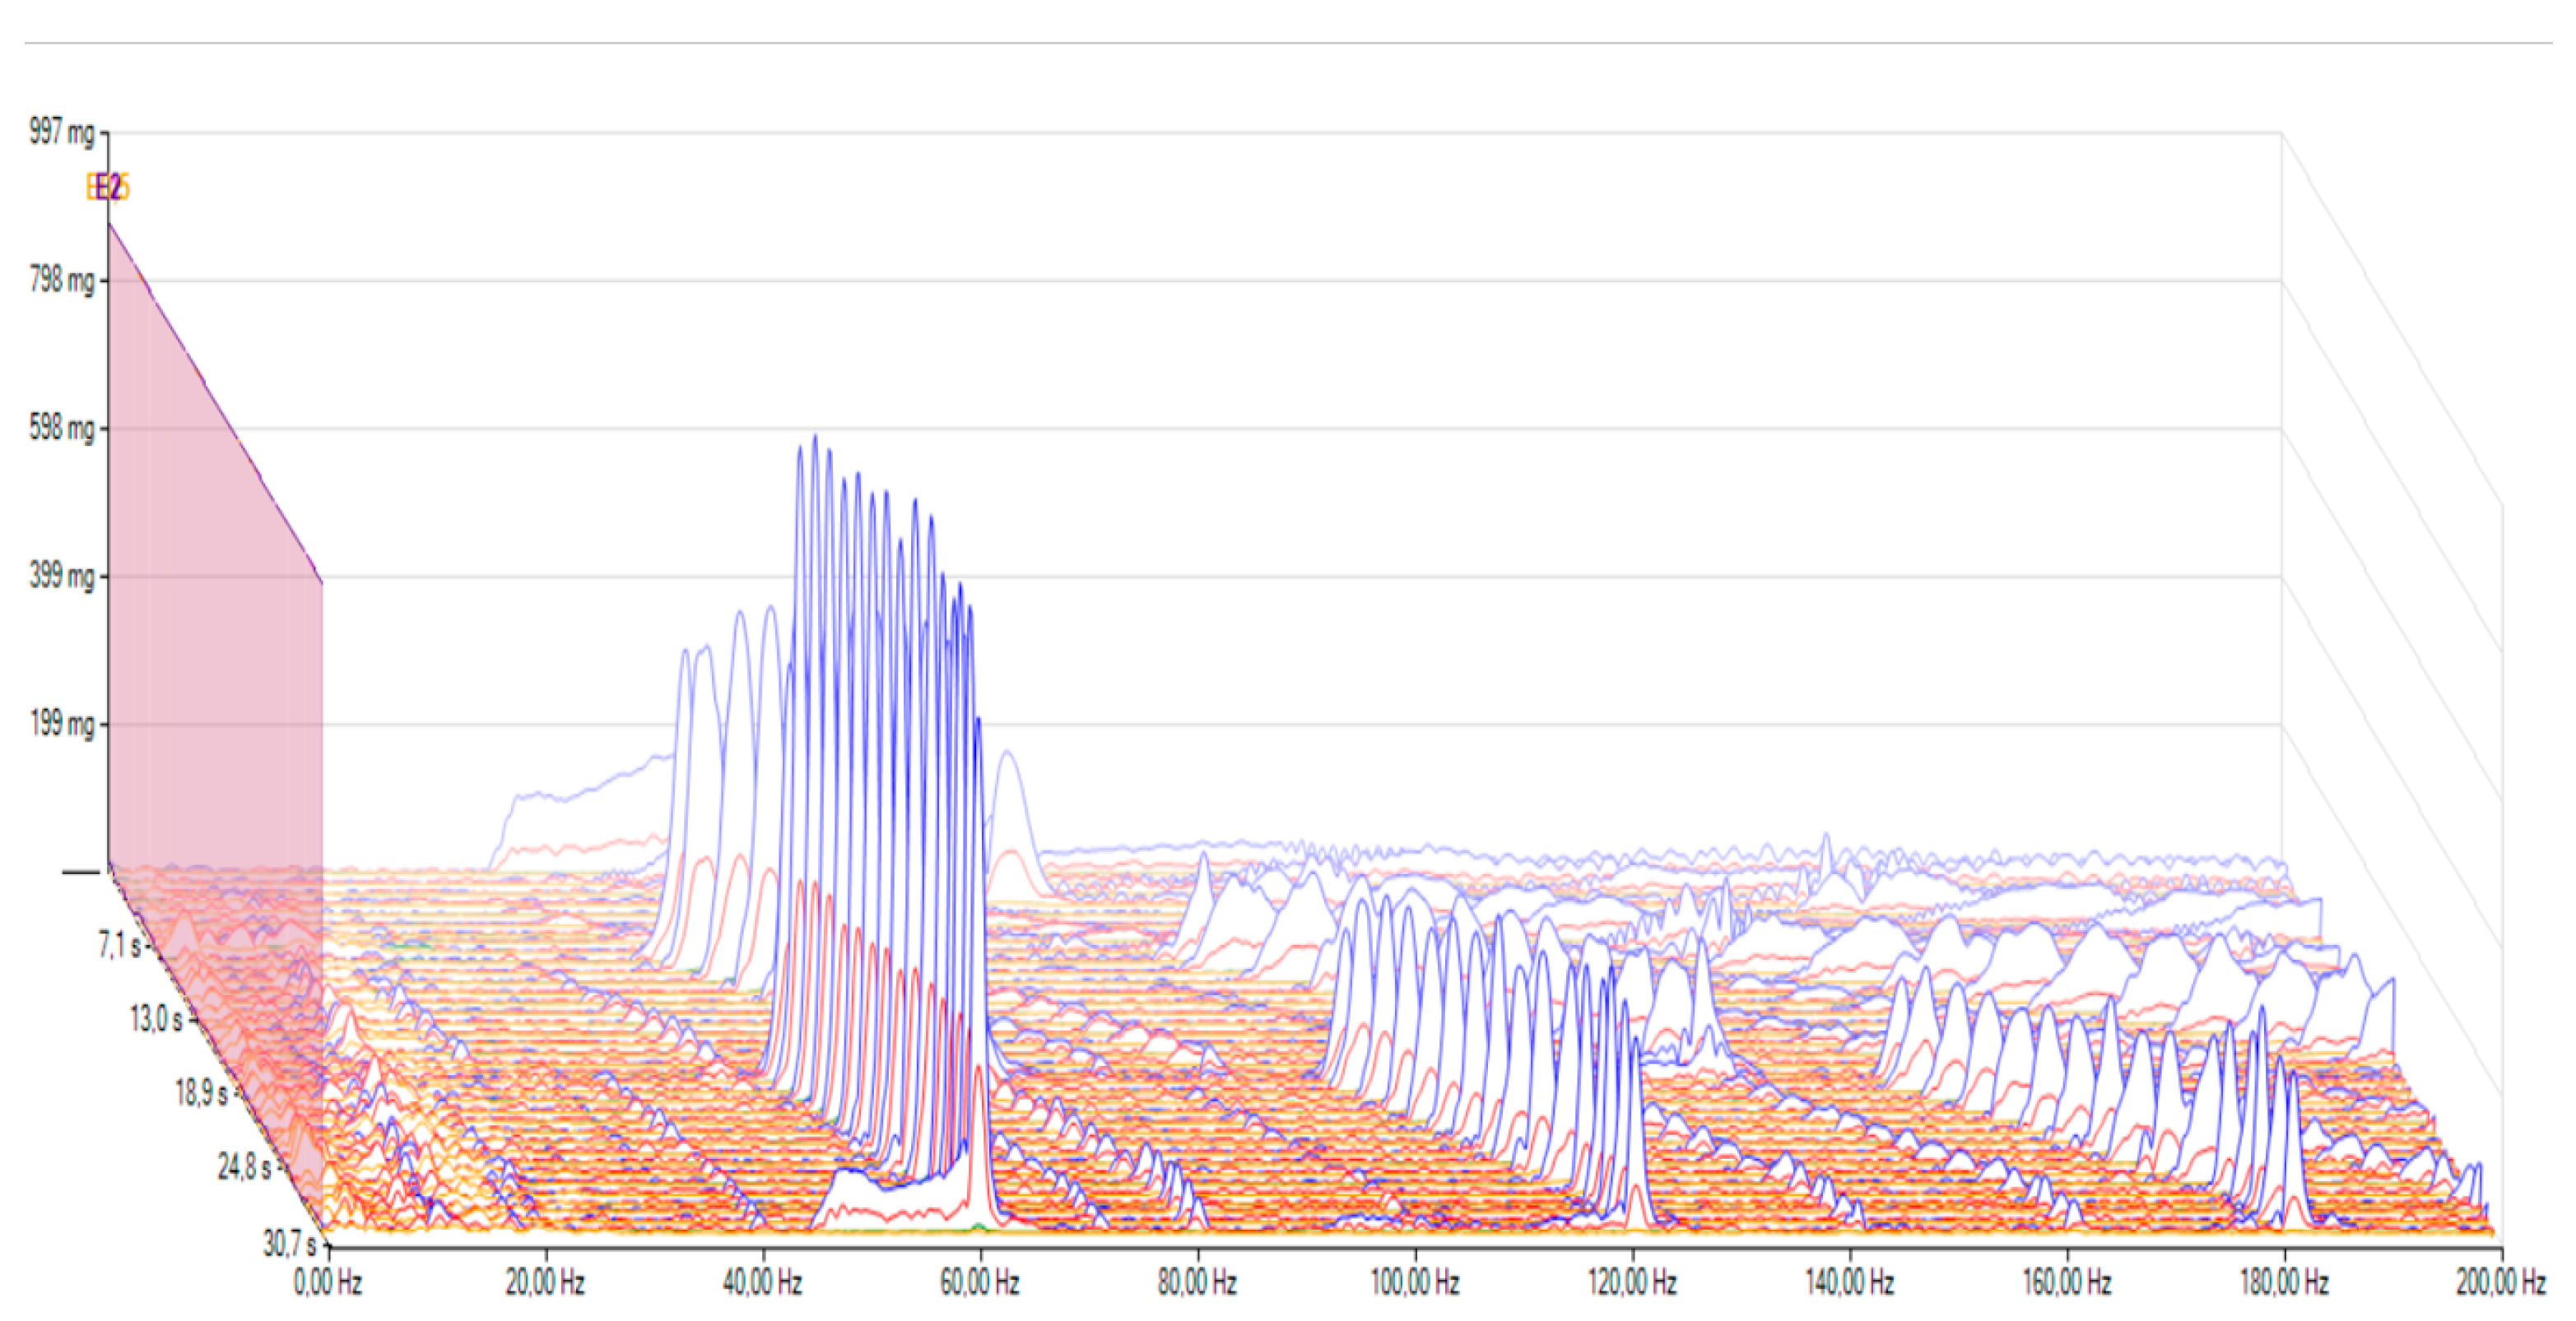
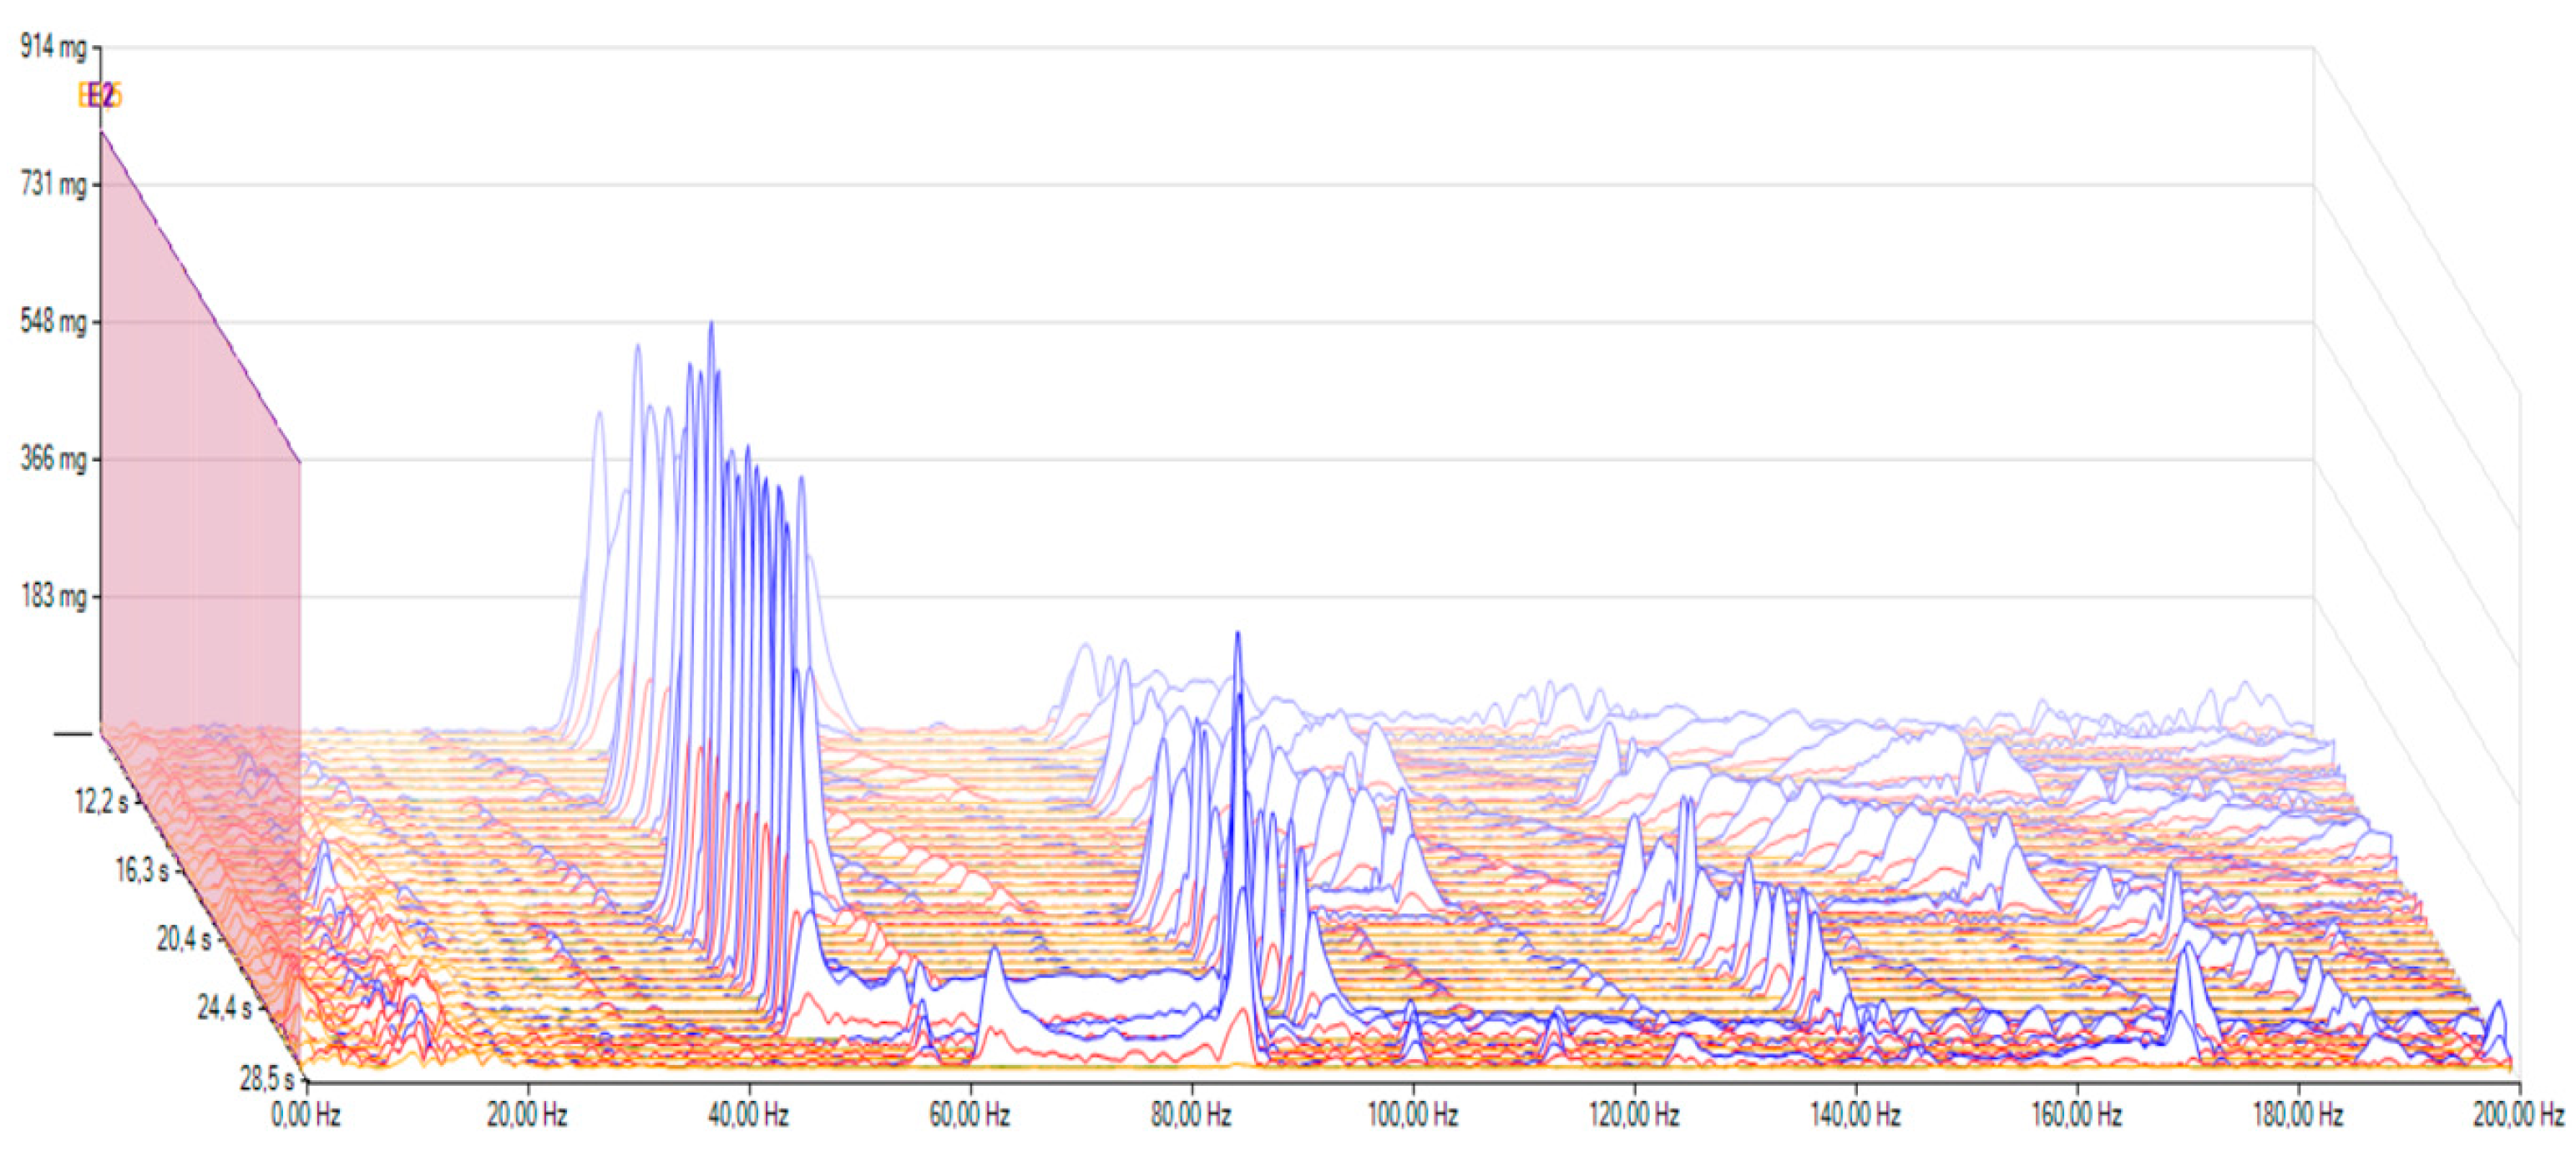
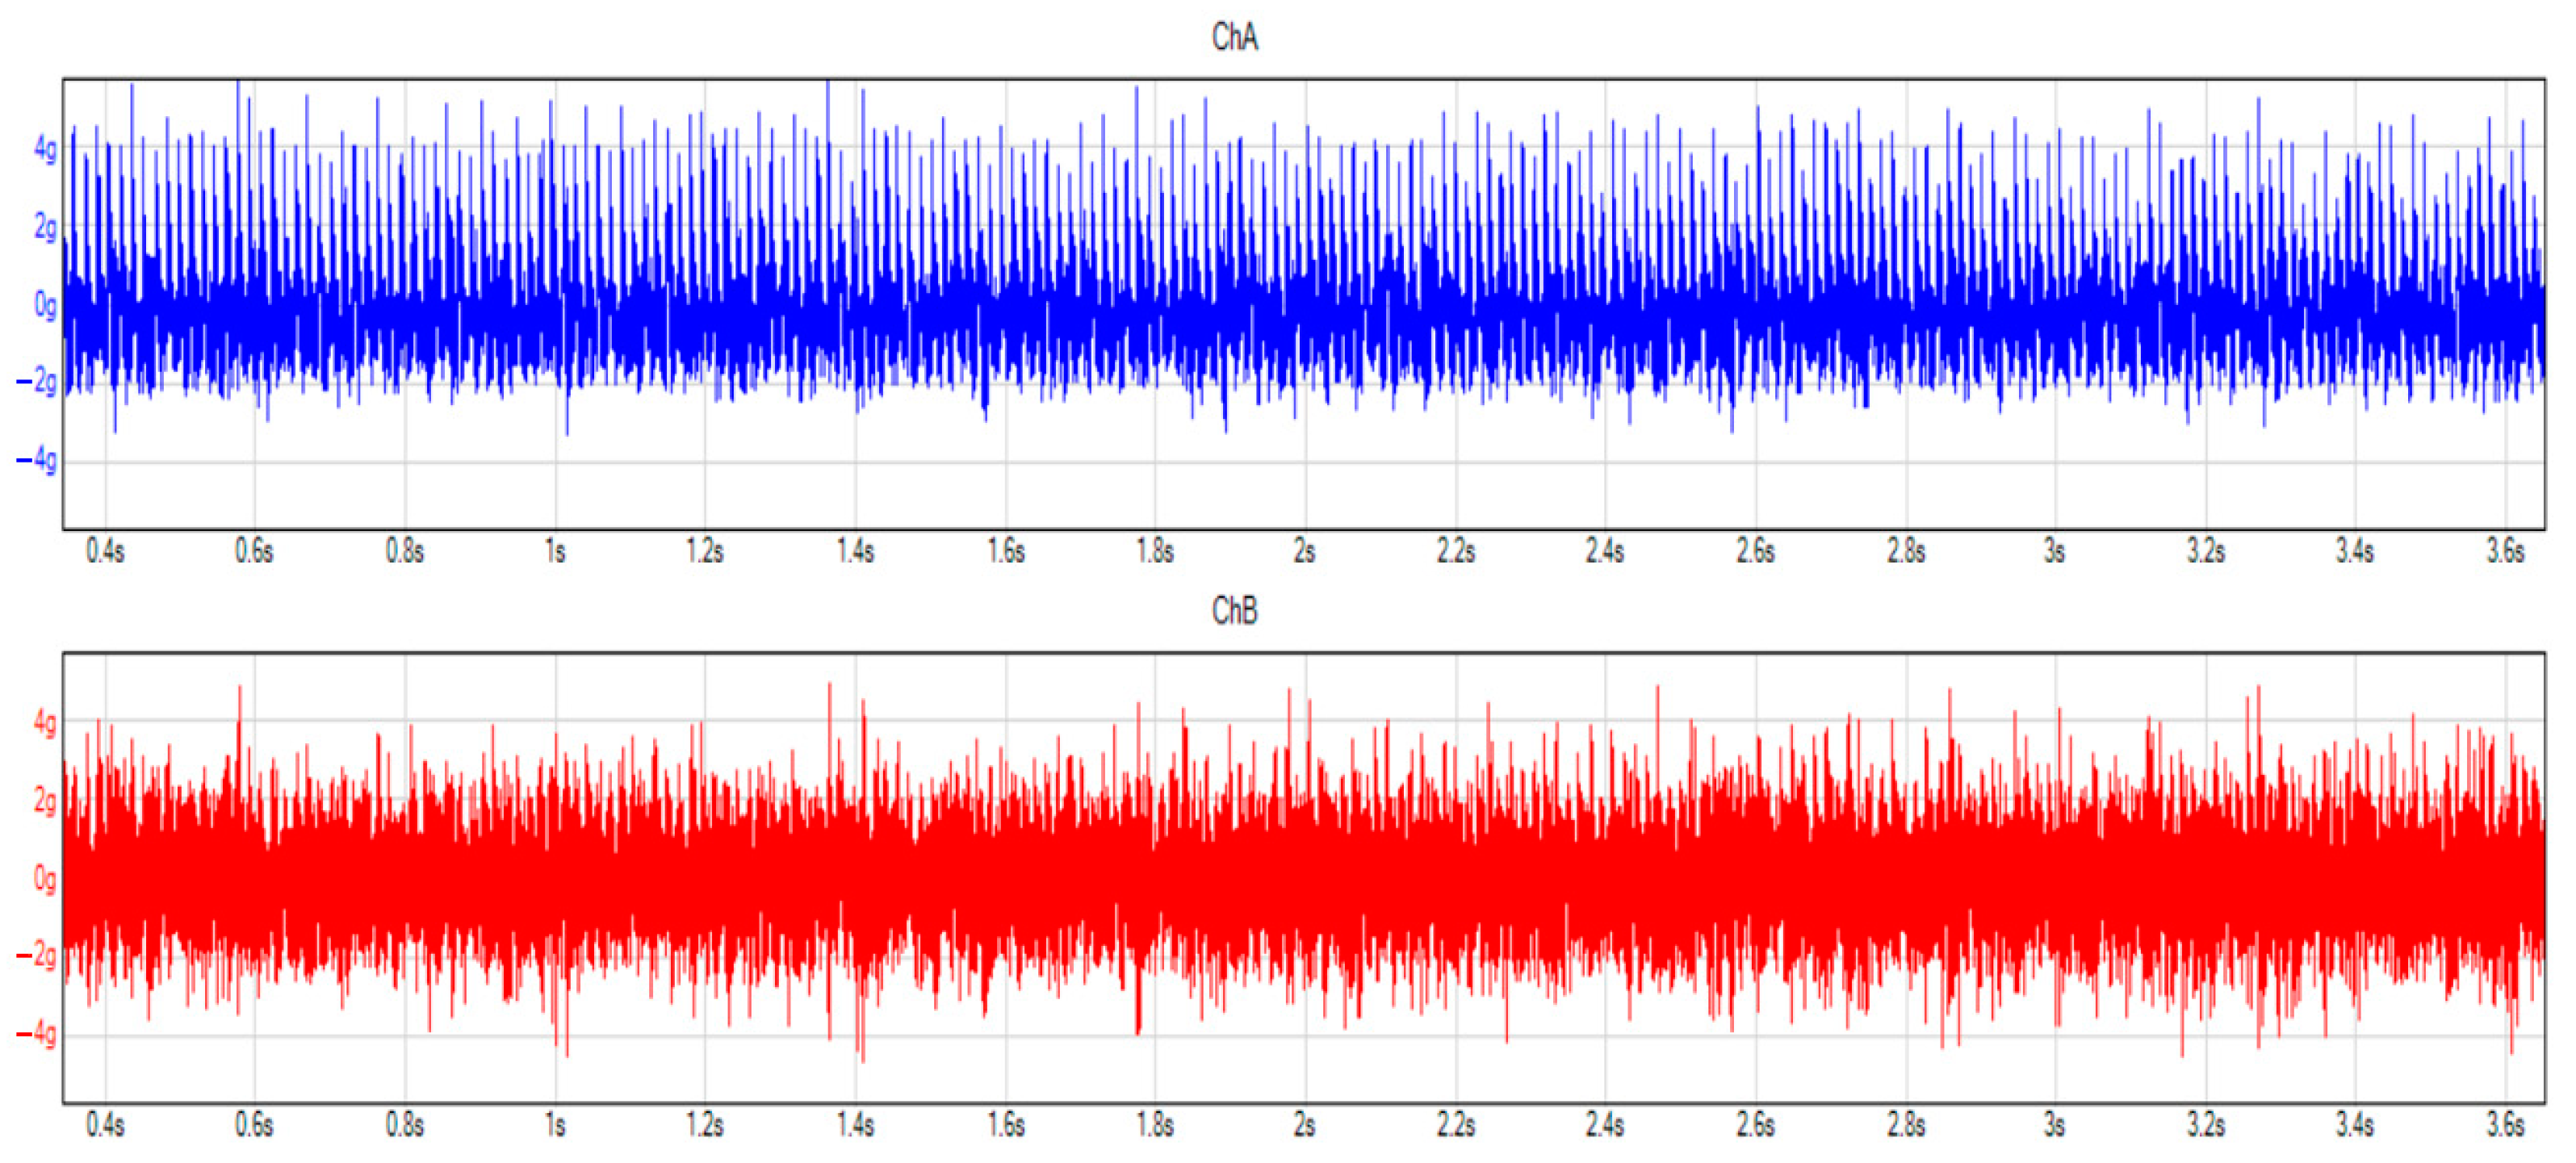
  • Both the time and frequency domains can be applied to detect the change in automatic transmission operation.
  • In the measured operating conditions, the difference in vibration with the old and new oil was approximately from 4.3% to 21%.
  • To be able to ensure the same conditions for the comparison, the torque, engine speed, vehicle speed, and temperature parameters must be measured.
  • Flexible service intervals can be applied due to the vibration of the conventional automatic transmission.
  • Vibration-based flexible service intervals can extend the lifetime of the automatic transmission. In addition, compared to fixed intervals, it can reduce costs and be environmentally friendlier, as the ATF is changed only when necessary according to the operational conditions.
  • Further studies can be performed on the topic of oil degradation and vibrations: a comparison at different temperatures, oil analysis from the samples, different types of automatic transmissions, and long-term measurement.

Author Contributions

Conceptualization, P.Ő. and I.L.; methodology, P.Ő., S.K.S. and I.L.; software, P.Ő.; validation, P.Ő.; formal analysis, P.Ő.; investigation, P.Ő., S.K.S., D.K., M.S., I.L. and S.F.; resources, P.Ő., S.K.S. and I.L.; data curation, P.Ő. and S.K.S.; writing—original draft preparation, P.Ő., S.K.S., D.K., M.S., I.L. and S.F.; writing—review and editing, P.Ő., S.K.S., D.K., M.S., I.L. and S.F.; visualization, P.Ő. and S.K.S.; supervision, S.K.S., D.K., M.S., I.L. and S.F.; project administration, P.Ő., S.K.S. and I.L.; funding acquisition, P.Ő., S.K.S., I.L. and S.F. All authors have read and agreed to the published version of the manuscript.

Funding

This research received no external funding.

Institutional Review Board Statement

Not applicable.

Informed Consent Statement

Not applicable.

Data Availability Statement

Not applicable.

Acknowledgments

The research was supported by the European Union within the framework of the National Laboratory for Autonomous Systems (RRF-2.3.1-21-2022-00002).

Conflicts of Interest

The authors declare no conflict of interest.

References

  1. Liu, Y.; Wang, S.; Dong, P.; Xu, X. Dynamic Analysis and Control of an Automatic Transmission for Start-Stop Function and Efficiency Improvement. Math. Probl. Eng. 2015, 2015, 209276. [Google Scholar] [CrossRef]
  2. American Society for Testing and Materials ASTM D445-21e2–Standard Test Method for Kinematic Viscosity of Transparent and Opaque Liquids. Available online: https://www.astm.org/standards/d445 (accessed on 14 January 2023).
  3. American Society for Testing and Materials ASTM D6595-17–Standard Test Method for Determination of Wear Metals and Contaminations in Used Lubricating Oils or Used Hydraulic Fluids by Rotating Disc Electrode Atomic Emission Spectrometry. Available online: https://www.astm.org/d6595-17.html (accessed on 14 January 2023).
  4. American Society for Testing and Materials ASTM D6304-20–Standard Test Method for Determination of Water in Petroleum Products, Lubricating Oils, and Additives by Coulometric Karl Fischer Titration. Available online: https://www.astm.org/d6304-20.html (accessed on 14 January 2023).
  5. Kumbár, V.; Glos, J.; Votava, J. Monitoring of Chemical Elements during Lifetime of Engine Oil. Acta Univ. Agric. Et Silvic. Mendel. Brun. 2014, 62, 155–159. [Google Scholar] [CrossRef]
  6. Guan, L.; Feng, X.L.; Xiong, G.; Xie, J.A. Application of Dielectric Spectroscopy for Engine Lubricating Oil Degradation Monitoring. Sens. Actuators A Phys. 2011, 168, 22–29. [Google Scholar] [CrossRef]
  7. Farfan-Cabrera, L.I.; Gallardo-Hernández, E.A.; Vite-Torres, M.; Godínez-Salcedo, J.G. Influence of Oxidation of Automatic Transmission Fluids (ATFs) and Sliding Distance on Friction Coefficients of a Wet Clutch in the Running-in Stage. Friction 2021, 9, 401–414. [Google Scholar] [CrossRef]
  8. Liddell, G.J.; Newingham, T.D. Some Physical Effects of Transmission Fluid Degradation. SAE Tech. Pap. Ser. 1966, 660097. [Google Scholar] [CrossRef]
  9. Kosiba, J.; Čorňák; Glos, J.; Jablonický, J.; Vozárová, V.; Petrović, A.; Csillag, J. Monitoring Oil Degradation during Operating Tests. Agron. Res. 2016, 14, 1626–1634. [Google Scholar]
  10. Ingram, M.; Noles, J.; Watts, R.; Harris, S.; Spikes, H.A. Frictional Properties of Automatic Transmission Fluids: Part II—Origins of Friction-Sliding Speed Behavior. Tribol. Trans. 2011, 54, 154–167. [Google Scholar] [CrossRef]
  11. Rivera, N.; Viesca, J.L.; García, A.; Prado, J.I.; Lugo, L.; Battez, A.H. Cooling Performance of Fresh and Aged Automatic Transmission Fluids for Hybrid Electric Vehicles. Appl. Sci. 2022, 12, 8911. [Google Scholar] [CrossRef]
  12. García Tuero, A.; Rivera, N.; Rodríguez, E.; Fernández-González, A.; Viesca, J.L.; Hernández Battez, A. Influence of Additives Concentration on the Electrical Properties and the Tribological Behaviour of Three Automatic Transmission Fluids. Lubricants 2022, 10, 276. [Google Scholar] [CrossRef]
  13. Cameron, T.M.; Tersigni, S.H.; McCombs, T.; Jao, T.C. ATF Effects on Friction Stability in Slip-Controlled Torque Converter Clutches. SAE Tech. Pap. Ser. 2003, 2003-01–3255. [Google Scholar] [CrossRef]
  14. Cameron, T.M.; McCombs, T.; Devlin, M.; Tersigni, S.; Jao, T.C. ATF Friction Properties and Shift Quality. J. Fuel. Lubr. 2004, 113, 2008–2013. [Google Scholar]
  15. Cameron, T.M.; Iyer, R.; McCombs, T.; Maelger, H.; Rollin, T.; Tersigni, S.; Jao, T.C. Enhanced Stability of Transmission Clutch Engagement with Temperature-Dependent ATF Friction. In Proceedings of the SAE Technical Paper Series; SAE International: Warrendale, PA, USA, 2007; pp. 828–833. [Google Scholar]
  16. Randall, R.B. Vibration-Based Condition Monitoring: Industrial, Aerospace and Automotive Applications; John Wiley & Sons Ltd.: Chichester, UK, 2010; ISBN 978-0-470-74785-8. [Google Scholar]
  17. Kuchak, A.; Marinkovic, D.; Zehn, M. Parametric Investigation of a Rail Damper Design Based on a Lab-Scaled Model. J. Vib. Eng. Technol. 2021, 9, 51–60. [Google Scholar] [CrossRef]
  18. Macura, D.; Laketić, M.; Pamučar, D.; Marinković, D. Risk Analysis Model with Interval Type-2 Fuzzy FMEA–Case Study of Railway Infrastructure Projects in the Republic of Serbia. Acta Polytech. Hung. 2022, 19, 103–118. [Google Scholar] [CrossRef]
  19. Kuchak, A.; Marinkovic, D.; Zehn, M. Finite Element Model Updating–Case Study of a Rail Damper. Struct. Eng. Mech. 2020, 73, 27–35. [Google Scholar] [CrossRef]
  20. Fischer, S.; Kocsis Szürke, S. Detection Process of Energy Loss in Electric Railway Vehicles. Facta Univ. Ser. Mech. Eng. 2023, 11368. [Google Scholar] [CrossRef]
  21. Zabler, E.; Müller, W.-M.; Bischoff, C.; Pfahler, C.; Weiberle, P.; Papert, U.; Gerhardt, C.; Miekley, K.; Frehoff, R.; Mast, M.; et al. Automotive Sensors. In Automotive Mechatronics. Bosch Professional Automotive Information; Reif, K., Ed.; Springer Vieweg: Wiesbaden, Germany, 2015; pp. 144–167. ISBN 978-3-658-03974-5. [Google Scholar]
  22. Hiramoto, Y.; Ohtake, S.; Takahashi, H. A Built-In Self-Diagnostic Mechanism for Delay Faults Based on Self-Generation of Expected Signatures. In Proceedings of the 2019 IEEE 28th Asian Test Symposium (ATS), Kolkata, India, 10–13 December 2019; pp. 31–36. [Google Scholar]
  23. Guan, J.J.; Willermet, P.A.; Carter, R.O.; Melotik, D.J. Interaction between ATFs and Friction Material for Modulated Torque Converter Clutches. SAE Tech. Pap. Ser. 1998, 981098, 1636–1643. [Google Scholar] [CrossRef]
  24. Newcomb, T.; Sparrow, M.; Ciupak, B.; Hadad, Y.; Hassert, J. The Effect of Lower Viscosity Automatic Transmission Fluid on Glaze Chemistry. SAE Int. J. Fuels. Lubr. 2009, 1, 1469–1479. [Google Scholar] [CrossRef]
  25. Marty, S.; Carpenter, B. Intricacies of SAE #2 Computerized Clutch Friction Durability Testing. SAE Tech. Pap. Ser. 1993, 932847. [Google Scholar] [CrossRef]
  26. Haviland, M.L.; Davison, E.D. Automatic Transmission Fluid Viscosity Requirements. SAE Tech. Pap. Ser. 1971, 710838, 2771–2781. [Google Scholar] [CrossRef]
  27. Tang, P.; Wang, S.; Liu, Y.; Xu, X. Analysis of the Oil Pressure Rule during the Shift Process of Automatic Transmission. In Proceedings of the 2010 7th International Conference on Fuzzy Systems and Knowledge Discovery (FSKD 2010), Yantai, China, 10–12 August 2010; Volume 1, pp. 109–113. [Google Scholar]
  28. Dong, P.; Liu, Y.; Jiang, E.; Xu, X.; Shui, L.; Zhang, G. Oil Pressure Characteristic of Automatic Transmission’s Shift Control Unit and Clutch Failure Analysis. In Proceedings of the ICCASM 2010—2010 International Conference on Computer Application and System Modeling, Taiyuan, China, 22–24 October 2010; Volume 3, pp. 42–46. [Google Scholar]
  29. Kučera, M.; Aleš, Z.; Pavlů, J.; Hnilicová, M. Applying of Automatic Laser Particle Counter as Technique to Morphology Assessment and Distribution of Wear Particles during Lifetime of Transmission Oils. Key Eng. Mater. 2016, 669, 417–425. [Google Scholar] [CrossRef]
  30. Liu, Y.F.; Dong, P.; Liu, Y.; Xu, X.Y. Design and Application of Electric Oil Pump in Automatic Transmission for Efficiency Improvement and Start–Stop Function. J. Cent. S. Univ. 2016, 23, 570–580. [Google Scholar] [CrossRef]
  31. Kim, Y.; Song, M.; Kim, J.; Lee, H.; Kim, H. Power-Based Control of an Electric Oil Pump for an Automatic-Transmission- Based Hybrid Electric Vehicle. Proc. Inst. Mech. Eng. Part D J. Automob. Eng. 2012, 226, 1088–1099. [Google Scholar] [CrossRef]
  32. Song, M.; Oh, J.; Kim, J.; Kim, Y.; Yi, J.; Kim, Y.; Kim, H. Development of an Electric Oil Pump Control Algorithm for an Automatic-Transmission-Based Hybrid Electric Vehicle Considering the Gear Shift Characteristics. Proc. Inst. Mech. Eng. Part D: J. Automob. Eng. 2014, 228, 21–36. [Google Scholar] [CrossRef]
  33. Seo, Y.; Sungdo, H. A Study on the Development of Remanufacturing Process of Oil Pumps for 7-Speed Automatic Transmissions. Trans. Korean Soc. Automot. Eng. 2021, 29, 675–681. [Google Scholar] [CrossRef]
  34. Farfán-Cabrera, L.I.; Gallardo-Hernández, E.A.; Vite-Torres, M.; Laguna-Camacho, J.R. Frictional Behavior of a Wet Clutch Using Blends of Automatic Transmission Fluid (ATF) and Biolubricant (Jatropha Oil) in a Pin-on-Disk Tester. Tribol. Trans. 2015, 58, 941–946. [Google Scholar] [CrossRef]
  35. Cahyadi, D.; Susilowati, E.; Puspita, D.F.; Ilham, I. Analysis of The Preliminary Anti-Wear Testing for Automatic Transmission Lubricating Oil Using The Four-Ball Method. In Proceedings of the 1st International Conference on Standardization and Metrology (ICONSTAM 2021), Tangerang Selatan, Virtual, 20 October 2021; p. 020009. [Google Scholar]
  36. Wang, W.; Li, W. Experimental Study of Performance of Automatic Transmission Oil Based on Pao. Pet. Process. Petrochem. 2019, 50, 90–94. [Google Scholar]
  37. Wu, H.; Yang, X.; Cao, G.; Zhao, L.; Yang, L. Design and Optimisation of Die Casting Process for Heavy-Duty Automatic Transmission Oil Circuit Board. Int. J. Cast Met. Res. 2021, 34, 88–96. [Google Scholar] [CrossRef]
  38. Zeng, J.; Liyan, Z.; Guilin, L. The Solution of Test Plateform for Vehicle Automatic Transmission. In Proceedings of the 2006 Chinese Control Conference Proceedings, CCC 2006, Harbin, China, 7–11 August 2006; pp. 1256–1261. [Google Scholar]
  39. Li, G.; Chen, Y.; Wang, W.; Wu, Y.; Liu, R. Automatic Transmission Bearing Fault Diagnosis Based on Comprehensive Index Method and Convolutional Neural Network. World Electr. Veh. J. 2022, 13, 184. [Google Scholar] [CrossRef]
  40. Li, C.; Sánchez, R.V.; Zurita, G.; Cerrada, M.; Cabrera, D. Fault Diagnosis for Rotating Machinery Using Vibration Measurement Deep Statistical Feature Learning. Sensors 2016, 16, 895. [Google Scholar] [CrossRef]
  41. Kocsis Szürke, S.; Dineva, A.; Szalai, S.; Lakatos, I. Determination of Critical Deformation Regions of a Lithium Polymer Battery by DIC Measurement and WOWA Filter. Acta Polytech. Hung. 2022, 19, 113–134. [Google Scholar] [CrossRef]
  42. Wei, X.; Feng, Y.; Han, X.; He, Z. Simulation of Flow-Induced Vibration and Dynamic Performance of Circular-Arc Helical Gear Pump under Background of Machine Learning. Int. Trans. Electr. Energy Syst. 2022, 2022, 513357. [Google Scholar] [CrossRef]
  43. EN 61326-1:2013; Electrical Equipment for Measurement, Control and Laboratory Use. EMC Requirements. Part 1: General Requirements (IEC 61326-1:2012). European Committee for Electrotechnical Standardization: Brussels, Belgium, 2013; pp. 1–23.
Figure 1. The automatic transmission fluid before and after the oil change.
Infrastructures 08 00031 g001
Figure 2. The location of the accelerometer on the transmission.
Infrastructures 08 00031 g002
Figure 3. The location of the accelerometer on the bracket.
Infrastructures 08 00031 g003
Figure 4. The measurement system, including the attenuators and the scope.
Infrastructures 08 00031 g004
Figure 5. Measurements on the transmission before oil change in the time domain. Blue and red colors mean the different considered and applied channels, during the measurement.
Infrastructures 08 00031 g005
Figure 6. Measurements on the transmission after oil change in the time domain. Blue and red colors mean the different considered and applied channels, during the measurement.
Infrastructures 08 00031 g006
Figure 7. Vibrations in the frequency domain before oil change.
Infrastructures 08 00031 g007
Figure 8. Vibrations in the frequency domain after the oil change.
Infrastructures 08 00031 g008
Figure 9. Vibrations in the time domain before the oil change, 0–70 km/h. Blue and red colors mean the different considered and applied channels, during the measurement.
Infrastructures 08 00031 g009
Figure 10. Vibrations in the time domain after the oil change, 0–70 km/h. Blue and red colors mean the different considered and applied channels, during the measurement.
Infrastructures 08 00031 g010
Figure 11. Vibrations in the frequency domain before the oil change, 0–70 km/h.
Infrastructures 08 00031 g011
Figure 12. Vibrations in the frequency domain after the oil change, 0–70 km/h.
Infrastructures 08 00031 g012
Figure 13. Vibrations in time domain before the oil change, 50 km/h, 3rd gear. Blue and red colors mean the different considered and applied channels, during the measurement.
Infrastructures 08 00031 g013
Figure 14. Vibrations in the time domain after the oil change, 50 km/h, 3rd gear. Blue and red colors mean the different considered and applied channels, during the measurement.
Infrastructures 08 00031 g014
Figure 15. Vibrations in time domain before oil change, standstill, “D” selected. Blue and red colors mean the different considered and applied channels, during the measurement.
Infrastructures 08 00031 g015
Figure 16. Vibrations in time domain after oil change, standstill, “D” selected. Blue and red colors mean the different considered and applied channels, during the measurement.
Infrastructures 08 00031 g016
Table 1. The available parameters of the measurement device based on the official datasheets.
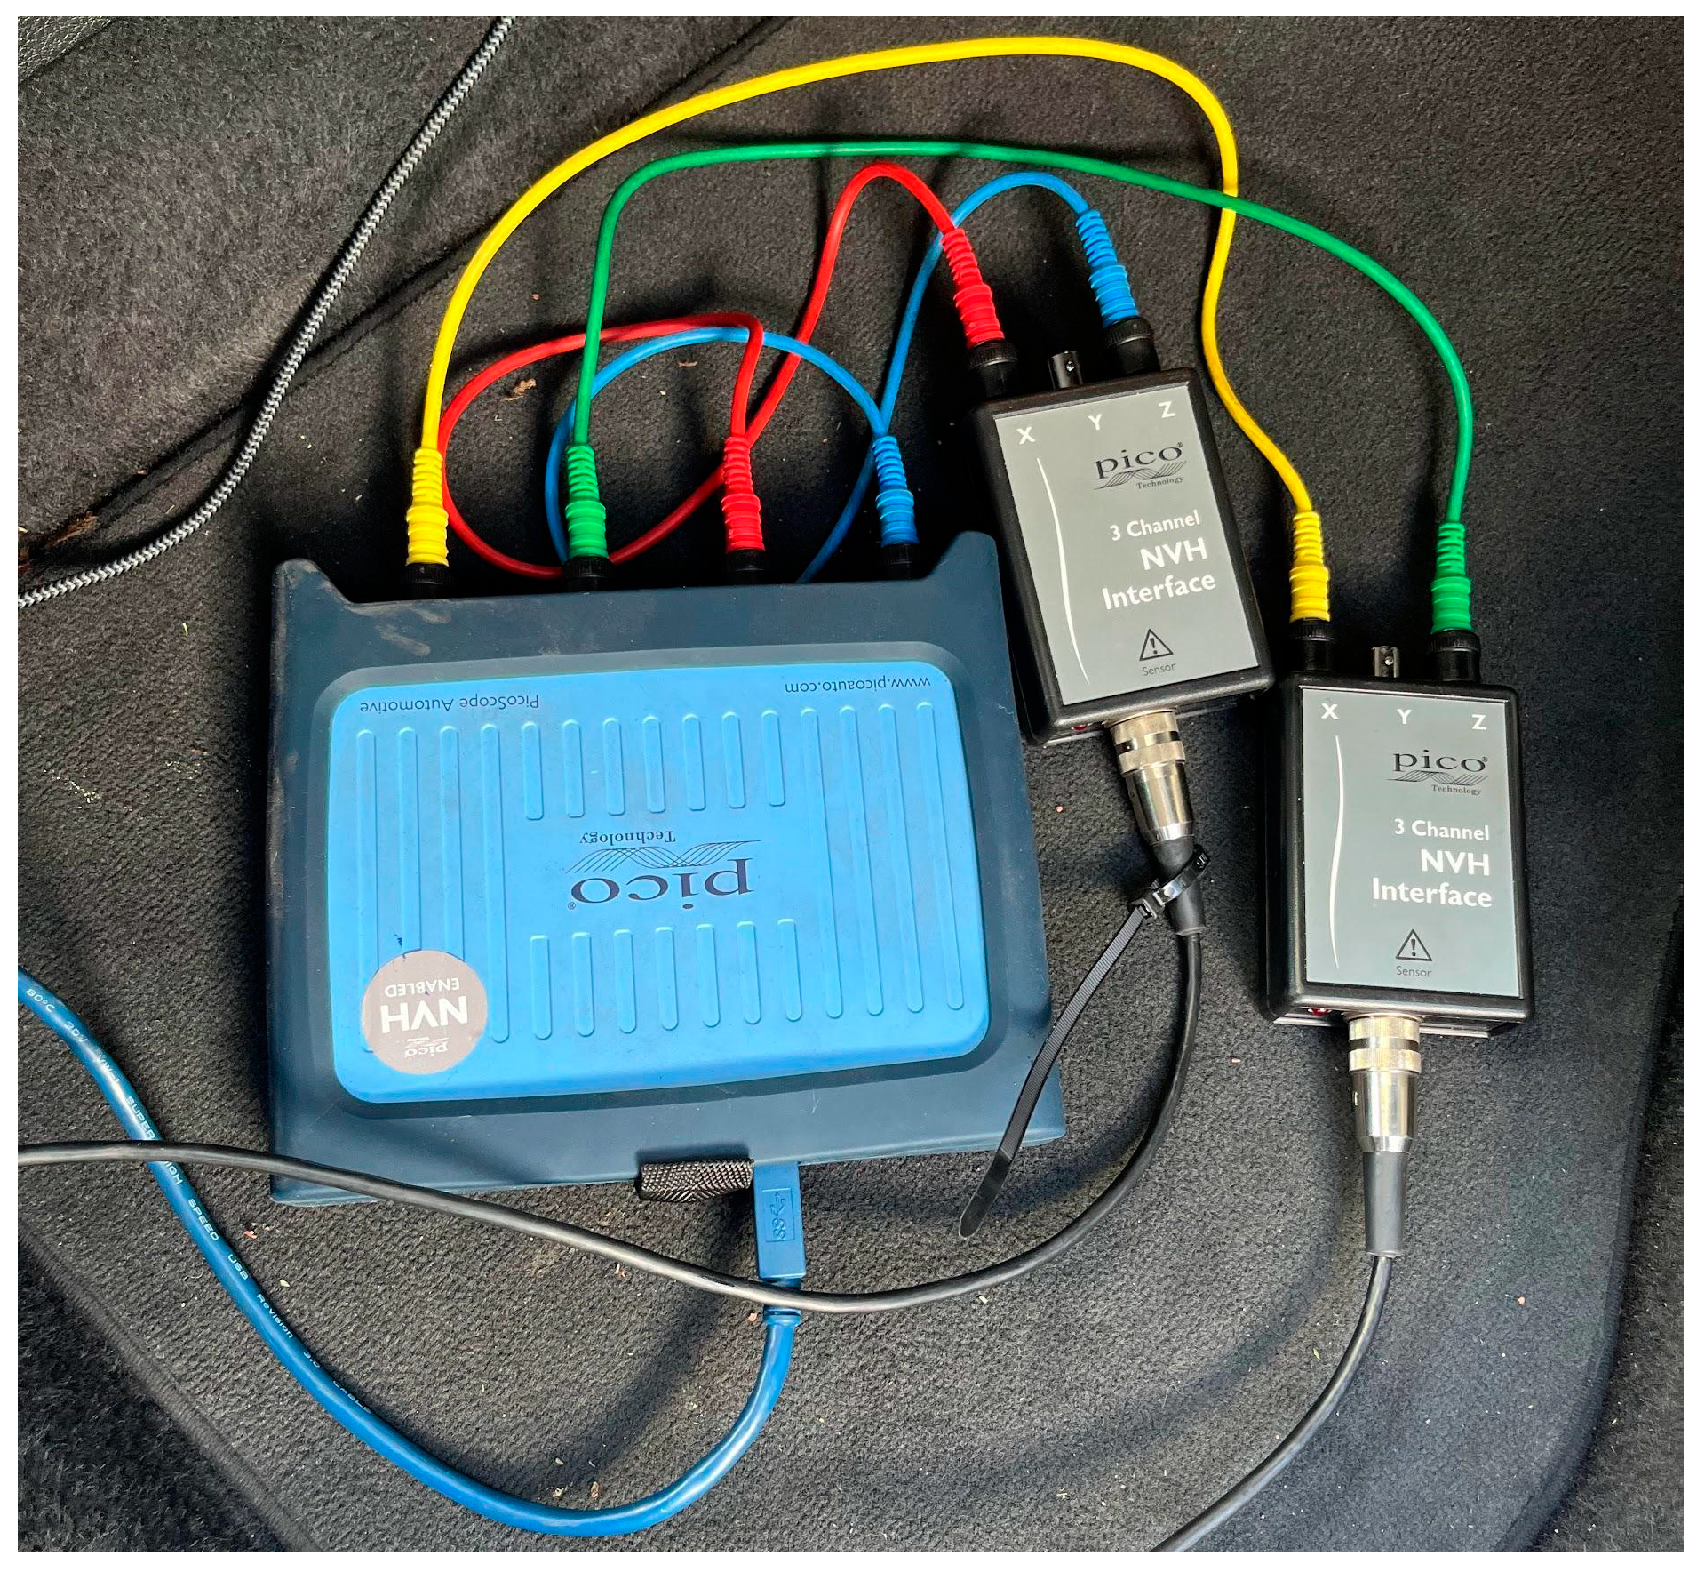
NVH Kit Specifications
Weight (interface/accelerometer/microphone)120 g/80 g/20 g
Dimensions:
Sensor interface (inc. BNCs-Bayonet Neill–Concelmans)105 mm × 65 mm × 27 mm
Magnet (inc. fitted grub screw)12 mm × ø18 mm
Sensor extension lead length3 m
Battery (lithium primary cell)CR123(A) 3 V (user-replaceable)
Battery life (shelf/vibration mode/microphone mode)10 years/6 months/2 months
Maximum measurable acceleration±5 g
Vibration frequency range (3 dB)DC to 350 Hz
Shock survivability (accelerometer head)10,000 g
Operating temperature range (accelerometer head)–40 °C to 85 °C
Thread mounting (accelerometer)¼″ × 28 UNF
EMC approvalsCE: Meets EN 61326-1:2006 [43]
Table 2. Comparison of maximum values of frequency-based analysis.
Operating ConditionsMaximum Values in Frequency Domain (mg)Difference (%)
Before Oil ChangeAfter Oil Change
Idling27121421
Acceleration with the gear change89474716.4
50 km/h vehicle speed in 3rd gear6546254.3
Standstill with “D” selected29726012.4
Disclaimer/Publisher’s Note: The statements, opinions and data contained in all publications are solely those of the individual author(s) and contributor(s) and not of MDPI and/or the editor(s). MDPI and/or the editor(s) disclaim responsibility for any injury to people or property resulting from any ideas, methods, instructions or products referred to in the content.

