
Investigation of “Open” Superstructure Tramway Tracks in Budapest
by
 , , and
Vivien Jóvér
1,
Zoltán Major
1,*,
Attila Németh
1,
Dmytro Kurhan
2,
Mykola Sysyn
3 and
Szabolcs Fischer
1,* 1
Central Campus Győr, Széchenyi István University, H-9026 Győr, Hungary
2
Department of Transport Infrastructure, Ukrainian State University of Science and Technologies, UA-49010 Dnipro, Ukraine
3
Department of Planning and Design of Railway Infrastructure, Institute of Railway Systems and Public Transport, Technical University of Dresden, 01069 Dresden, Germany
*
Authors to whom correspondence should be addressed.
Infrastructures 2023, 8(2), 33; https://0-doi-org.brum.beds.ac.uk/10.3390/infrastructures8020033
Submission received: 15 January 2023
/
Revised: 8 February 2023
/
Accepted: 9 February 2023
/
Published: 15 February 2023
(This article belongs to the Special Issue Land Transport, Vehicle and Railway Engineering)
Abstract
:The most important thing nowadays is to use available resources to develop infrastructure as efficiently as possible. In this regard, evaluating the deterioration of tramway tracks is critical from both a technical and an economic viewpoint. In Hungary, seven types of superstructure systems are currently differentiated in the case of tramway transport, but the geometrical deterioration, lifecycle, and lifecycle cost of the tramway tracks are not accurately known. The current study aimed to evaluate and compare the results of track geometry measurements of two different “open” tramway superstructure systems depending on their traffic load and age. The geometry measurements we re executed by TrackScan 4.01 instrument, developed and maintained by a Hungarian developer company called Metalelektro Méréstechnika Ltd. The evaluation of the measurements showed a clear relationship between the traffic load, age, and track deterioration. Based on the results, it can be generally stated, concerning “open” superstructure systems, that regardless of the “open” superstructure system or the level of traffic load, the average value of alignment is decreasing; however, the average value of the longitudinal level is increasing. Furthermore, the deterioration of an older ballasted track with lower traffic is similar to that of a younger ballasted track that has a higher traffic load. Another significant result was that the deterioration of the track gauge parameter in the case of concrete slab tracks is clearly described as the broadening of the track gauge.
1. Introduction
Transport can be divided into three main areas, following the classical grouping: (i) land transport, (ii) air transport—which includes space transport—and (iii) water transport, i.e., shipping.
Humans have been moving since time immemorial, with a greater or lesser need for mobility. Following the emergence of human societies, the demand for transport has increased significantly, generated and increased mainly by trade between settlements, cities, and countries.
The greatest steps (and innovations), quantitatively and qualitatively, can be linked to specific points in history. Examples include the invention of the wheel, the start of shipbuilding, the industrial revolution and the invention of the steam engine, the invention of the internal combustion engine, the invention of electricity and the electric drive, the harnessing of nuclear energy for transport, and space travel. In many cases, these were also the causes or consequences of major wars. For example, the invention of the atomic bomb and nuclear power was linked to the Second World War, so the peaceful use of nuclear power and its use in vehicles became important (see, for example, nuclear-powered submarines).
In each area, it is possible to distinguish between passenger and freight transport. In passenger transport, individual and collective transport are theoretically conceivable, but there are specific areas, such as rail transport or space travel, where individual transport is severely restricted—both from a technical and legal point of view. Although freight transport is solved and works in all areas, the only attractive area to discuss is perhaps space transport, where the concept of freight transport is not yet fully developed.
The following disciplines are considered to be closely related to transport sciences: (i) transport engineering with logistics-transport-packaging sub-disciplines [1,2,3,4,5], (ii) civil engineering [6,7,8,9,10,11,12,13], (iii) mining and metallurgical engineering [11,12,14], (iv) urban, municipal and architectural engineering [15,16], (v) mechanical engineering [17,18,19,20,21], (vi) electrical engineering [7,22,23,24,25,26], and (vii) vehicle engineering However, in reality, these fields often entirely overlap, or overlap to a lesser or greater extent.
One of the most critical areas of land transport is fixed-rail transport. It includes: (i) railways, (ii) tramways and detached railways, and (iii) specialized railways, e.g., rack railways, cableways, funicular railways, etc. From the early 1800s, rail transport became one of the world’s most dominant land transport modes. James Watt’s invention of the steam engine in 1769 revolutionized this part of mechanical and vehicle engineering, and, after many attempts, the first railroad vehicle for public use was George Stephenson’s Rocket steam locomotive of 1825, according to the history of engineering [27]. Rudolph Diesel invented the diesel engine. The diesel engine was invented by Rudolph Diesel in 1958, which further boosted the development of the railway from 1840 to 1850. The first electric locomotive was designed in 1837 by Robert Davidson, a Scottish engineer. In 1879, Werner von Siemens built the first electrically powered tram. It was first shown at an exhibition in Berlin. In 1881, the first 3 km- long electrified tramway line was built in Berlin. The power and tractive effort of diesel locomotives could be significantly enhanced by electric traction, which is still the dominant feature of the 21st century. Electric traction uses environmentally friendly, clean energy—provided that it is not produced using fossil fuels, which have a significant carbon footprint—and its transport can be easily managed using the established electricity grid. The issue of regenerative braking energy [7,24,28] is also crucial for electric traction. In the 20th and 21st centuries, we should also expect to see hybrid (mainly diesel– electric hybrid) and even fuel cell and hydrogen-based propulsion. The use of solar energy is also an option, of course. In addition, the possibility of nuclear trains cannot be ruled out. Battery power is also an important trend in electric propulsion [27]. Railways are one of the most prominent transportation options worldwide, carrying large volumes of freight and bulk cargo and many passengers over short and long distances. According to European statistics [29,30], i.e., in the EU-28 (the 28 countries of the European Union), in 2018, passenger kilometers traveled by rail amounted to 407.2 billion passenger kilometers (a total of 5915.9 billion), while domestic freight kilometers traveled by rail amounted to 423.3 billion tonne-kilometers (a total of 2371.2 billion).
This article deals with tramways and is based on the civil engineering discipline (it should be mentioned that tramways use mainly electric hauling with catenary systems or third rail sunk systems). In the next paragraph, the authors introduce the relevance of the public railways, starting from far and focusing on details.
It is important to develop and maintain an appropriate public transport infrastructure in Europe’s largest cities [31] and, of course, worldwide [32]. The well-developed public transport systems not only reduce environmental pollution but also make cities more livable, and they are beneficial from an economic point of view [7]. Nowadays, electric energy consumption is also a key issue all over the world; in this way, the energy efficiency and the electric, electric– hybrid service of fixed-rail vehicles are vital [7,22,28,33]. The backbone of urban public transport in most cities is guided land transport [34,35,36,37]. As more and more people live in cities, the infrastructure must work together with those who participate in public transport. Thus, it is also imperative to develop and implement safety-promoting systems that allow the detection, recognition, and tracking of pedestrians, vehicles, and cyclists near the tramway [38,39,40,41,42,43,44,45].
In the years 2021–2023, a significant increase in electricity and fuel prices [46] (e.g., gas oil, kerosene, etc.) will cause serious problems and difficulties for countries, public and private (large) public transport companies (the same can, of course, be said for private transport, where the prices of petrol, gas oil, electricity, natural gas, etc.,). The reasons are, of course, many and varied: some explanations and justifications include the ongoing war in Eastern Europe [47], others include the prolonged COVID epidemic [48], the cyclical and proven boom and bust of the world stock market [49], etc. The most likely explanation, however, is a combination of the above to a greater or lesser extent, i.e., no single factor can be neglected entirely.
Another essential component of the safe and acceptable coexistence of infrastructure and people is to make the noise generated by urban rail as bearable as possible. Although rail dampers are cost-effective and reduce noise, nevertheless, the parameters influencing their effects are not well known [35,50,51].
In Budapest, the capital of Hungary, traveling by tram is one of the most critical parts of public transport [34,52,53]. The fixed-rail transport is realized for nearly 300 km, with six types of vehicles and seven types of superstructure systems in this city. The seven different superstructure systems can be divided into two main groups: “open” and “paved” tracks. “Open” superstructure systems are also used in railway transport, representing about 45% of Budapest’s tramway tracks. However, it is essential to mention that tramway transits are not equivalent to (traditional) railways (or railroads) because they have different speeds and axle loads of vehicles [34].
The deterioration of “open” tramway tracks can be described in two ways: observing the condition of structural elements or the geometric parameters. In the case of “open” tracks—such as ballasted tracks—the change of geometric parameters appears first: the deterioration of track gauge, alignment, and longitudinal level. It is followed by structural deterioration: the condition of structural elements, like rails, fastenings, and sleepers [6,23,54,55,56,57].
The geometrical condition of railway tracks can also be inferred from sudden changes in the vehicle’s acceleration speed. The measured acceleration data are currently also used to classify passengers’ travel comfort and check the condition of railway tracks. Therefore, traditional methods and tools, as well as measured acceleration data, are helpful for recording deviations in track parameters [58].
Early detection of track deterioration and planned repair and maintenance interventions are the preconditions for a longer service life of the superstructure systems [11,12,59]. Nowadays, the lifecycle of railway tracks is already known, and much recent research and studies have been done about this subject. In general, there are four lifetimes: technical (planning) lifetime, economic lifetime, service lifetime, and moral lifetime. In addition, in several countries, including Morocco, extraordinary research is being done about how satisfied passengers are with tramways, so they examine the moral lifetime [60].
Comparing them, it can be said that the average lifetime of an “open” ballasted railway track is approximately 30 years. However, it must be mentioned that each structural element has its (own) lifetime, too. Therefore, these values can be equal; however, they can also be different [61,62,63].
Unfortunately, in contrast to the results of railway tracks, only a few research studies are available about tramway tracks’ lifetime. Although there are several cities where the issues are addressed, in most cases, the track gauge and its variations are primarily studied. For example, in the case of the Melbourne tramway network, track deterioration is predicted by considering track gauge variation, traffic data, and structural parameters [64]. In Melbourne, researchers developed a machine learning method to forecast the future Track Degradation Index (TDI) based on their measurements and analysis. Determining the future TDI is essential because it becomes possible to determine when and where the maintenance and operation activities should be carried out [65].
In Budapest, the geometrical deterioration, lifecycle, and lifecycle cost of the tramway tracks are not accurately known; their selection and application are currently mainly based on experience. In the future, it will also be important—from a technical and national economic point of view—so that the newly built superstructures can be selected, considering the geometric properties, the possible load, and the future maintenance and operation tasks. Due to the economic problems of recent years, it would also be a specific goal that the estimated costs do not increase. To be able to achieve this, risk management must play a key role throughout the project’s entire life. A country’s economic and social development depends not only on expanding the transport infrastructure but also on its proper maintenance [66].
In the field of railway track life, the Graz University of Technology in Austria has significant research [67,68,69,70]. A research team led by Professor Peter Veit was involved in the research project Strategie Fahrweg from 1997 to 2003. Life cycle costs were calculated for railway lines and sections of railway tracks in different conditions, geometries, and loads, based on a survey of the entire ÖBB (Austrian State Railways) network [67,68,69,70]. It was shown that for substructures in good and medium to poor condition, the lifecycle costs could be in a ratio of 1:3 up to 1:9 (for substructures, one of the most critical parameters is the adequate drainage, the load capacity of the substructure, etc.). The result was that a railway siding with a radius of 500 m, roughly 42 m long, corresponds to a lifecycle cost of roughly 450 m running track. Traffic disruption costs (particularly for single track) and depreciation costs are the most significant for a railway track section, accounting for up to half or even two-thirds of the total cost. The curvature of the railway track is also a critical parameter. The lifetime cost of a small radius curve can be twice or even three times the lifetime cost of a straight section of track.
In this article, the authors investigated the geometrical change of seven “open” tramway tracks. The measurements were made, on average, every third month from July 2021. During the evaluation of measurements, relationships between traffic load, age, and track deterioration were examined. Section 2 deals with the “Materials and Methods”, Section 3 presents the results, Section 4 presents the discussion, and Section 5 presents the conclusions.
2. Materials and Methods
2.1. Examined “Open” Superstructure Reference Sections
Four of the seven examined reference sections are ballasted track superstructures, and three are concrete slab tracks.
The ballasted track superstructure system is the most commonly applied in railway and tramway tracks. The lowest layer is ballasted bed on which the sleepers (made of reinforced concrete, wooden or synthetic material) rest. The fastening can be direct or indirect systems with screws or rail clamps, and the rail systems are usually grooved rails or flat-bottom rails (i.e., so-called Vignole rail profiles) [71].
In the case of the concrete slab track superstructure systems, the lowest layer is a reinforced concrete slab or reinforced concrete beam. Rails are stabilized by anchor bolts, bonded (direct), or spring rail fastening. The rail profiles are grooved rails or flat-bottom rails [71].
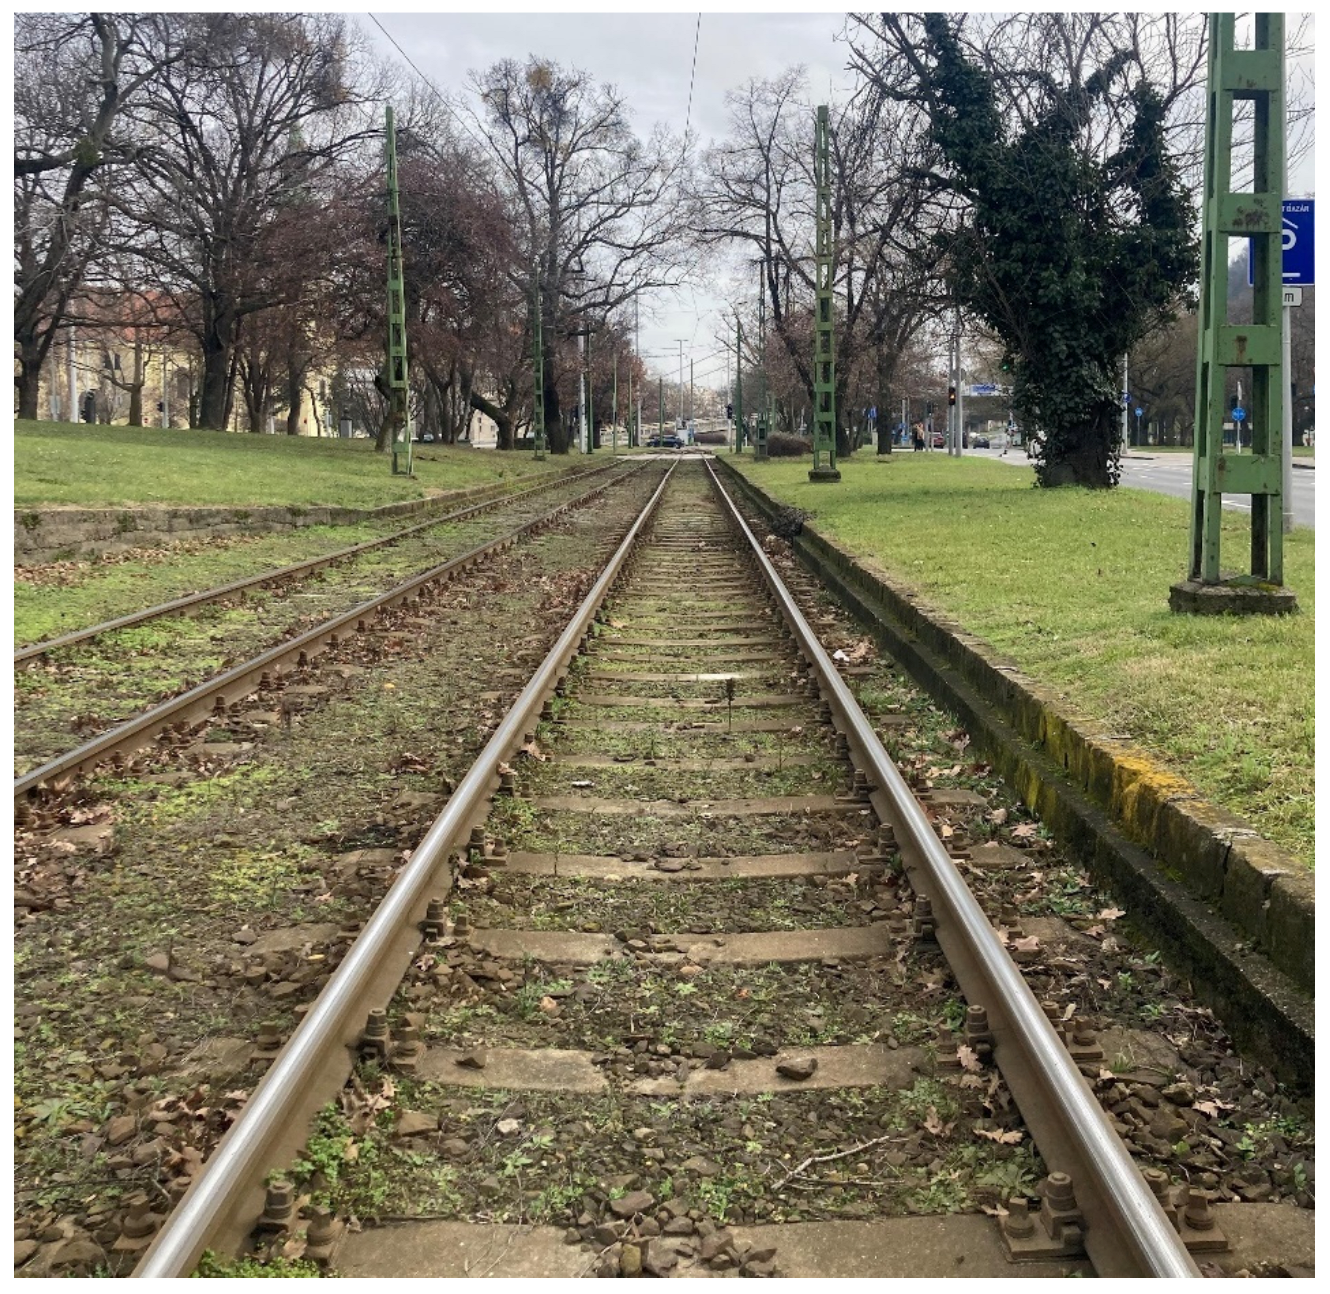
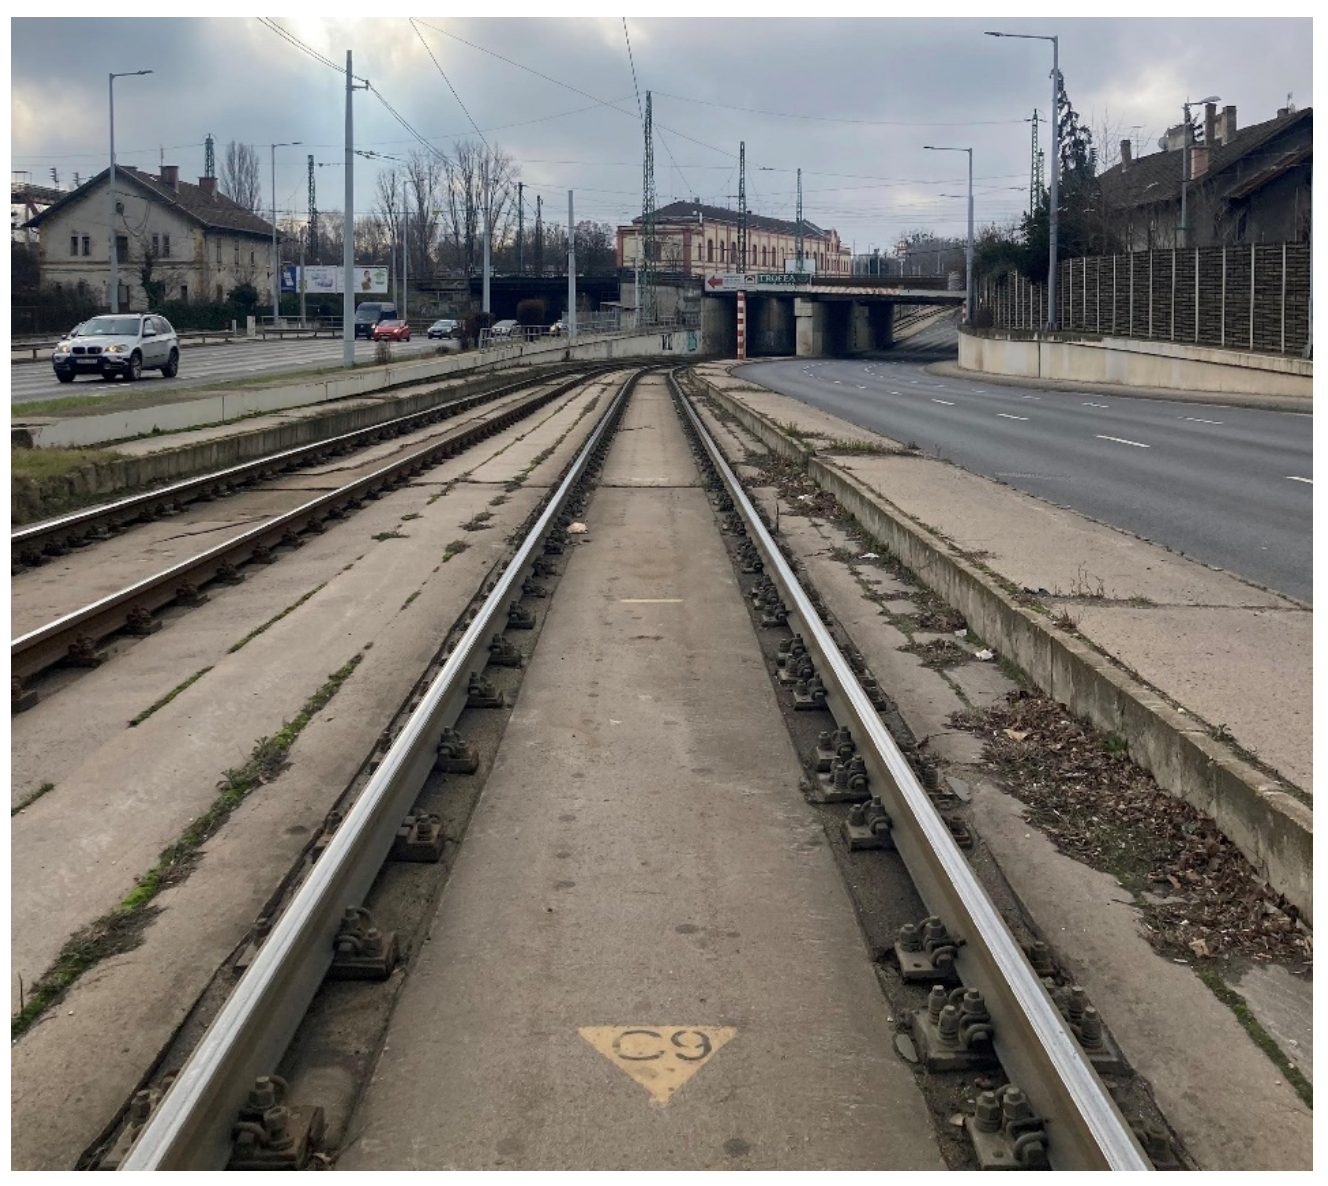
Section #1 is a 476-m-long ballasted track built in 1985 (Figure 1). The applied rail profiles are flat bottom rails called MÁV48, with a reinforced concrete sleeper, a GEO-type rail fastening system (so-called K-type rail fastening), and a ballast bed. There is one level crossing and one turnout in the section. The geometrical configuration (alignment) is mainly straight; there is a 50-m long (R = 240 m) right direction curve, a 28-m long (R = 108 m) left direction curve, a 70-m long (R = 250 m) left direction curve, and another 33-m long (R = 275 m) left direction curve. Each curve has no transition curve or superelevation. In the first 100 m of the selected section, the track has a 9.4‰ (i.e., per-mile) gradient; the rest has a 12.8‰ gradient.
Section #2 is a 1715-m-long ballasted track built in 1987 (Figure 2). The applied rail profiles are MÁV48, with reinforced concrete sleepers, GEO-type rail fastening systems, and a ballast bed. There are two level crossings and no turnout in the section. The geometrical configuration (alignment) is variable, mainly straight; however, there is a 64-m long (R = 502 m) right direction curve, a 212-m long (R = 605 m) right direction curve, a 225-m long (R = 502 m) left direction curve and another 145-m long (R = 309 m) left direction curve. Each curve has no transition curve or superelevation. In the selected section, the track has a 4.9‰ elevation on average.
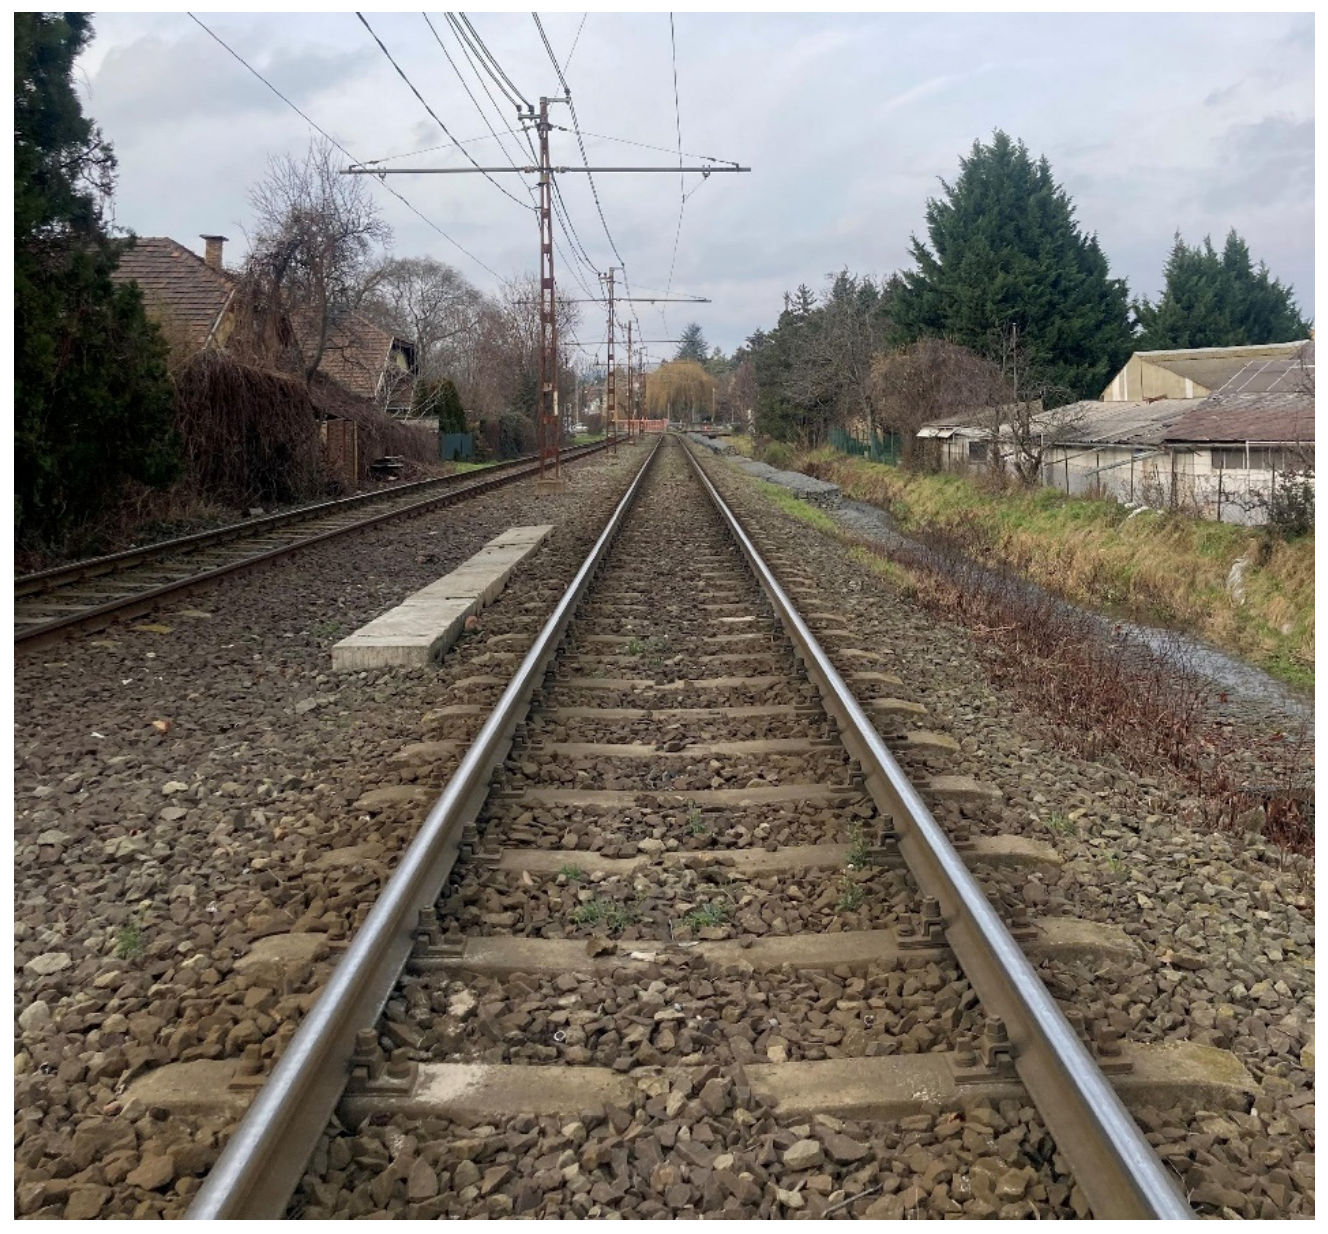
Section #3 is a 1090-m-long ballasted track built in 2002 (Figure 3). The applied rail profiles are 49E1, with reinforced concrete sleepers, (Vossloh) SKL-type rail fastening systems, and a ballast bed. There are five level crossings and no turnout in the section. The geometrical configuration (alignment) is mainly straight; there is a 14-m long (R = 278 m) left direction curve and another 34-m long (R = 250 m) right direction curve. Both curves have no transition curve or superelevation. In the first half of the selected section, the track has a 4.4‰ gradient; in the second half: a 2.4‰ and a 3.6‰ elevation.
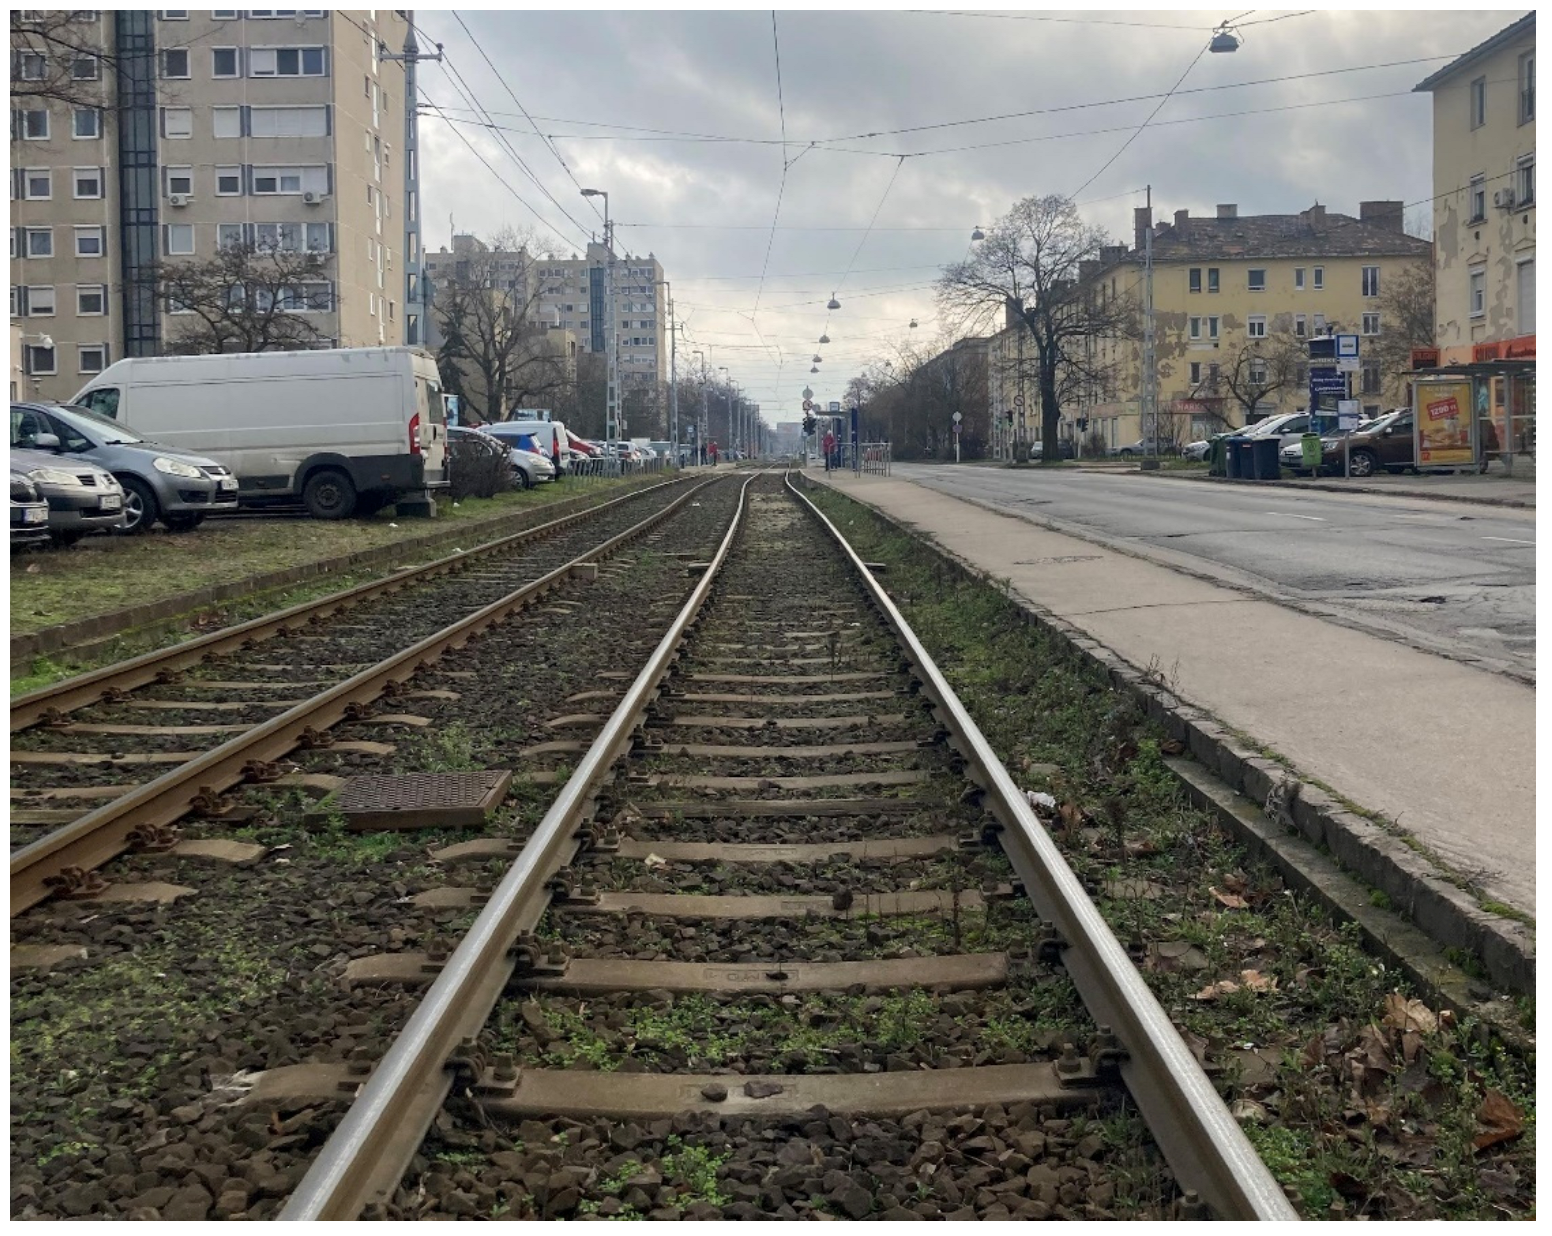
Section #4 is a 496-m-long ballasted track built in 2018 (Figure 4). The applied rail profiles are flat bottom rails called MAV48, with reinforced concrete sleepers, (Vossloh) SKL type rail fastening systems, and a ballast bed. There is no level crossing and no turnout in the section. The geometrical configuration (alignment) is also mainly straight; there is a 123-m long (R = 302 m) right direction curve, a 58-m long (R = 1050 m) right direction curve, and another 63-m long (R = 1150 m) left direction curve. The first curve has a transition curve, but the other one has not got it or superelevation. The downgrade of the track is 3.9‰ alongside; the line layout is primarily straight.
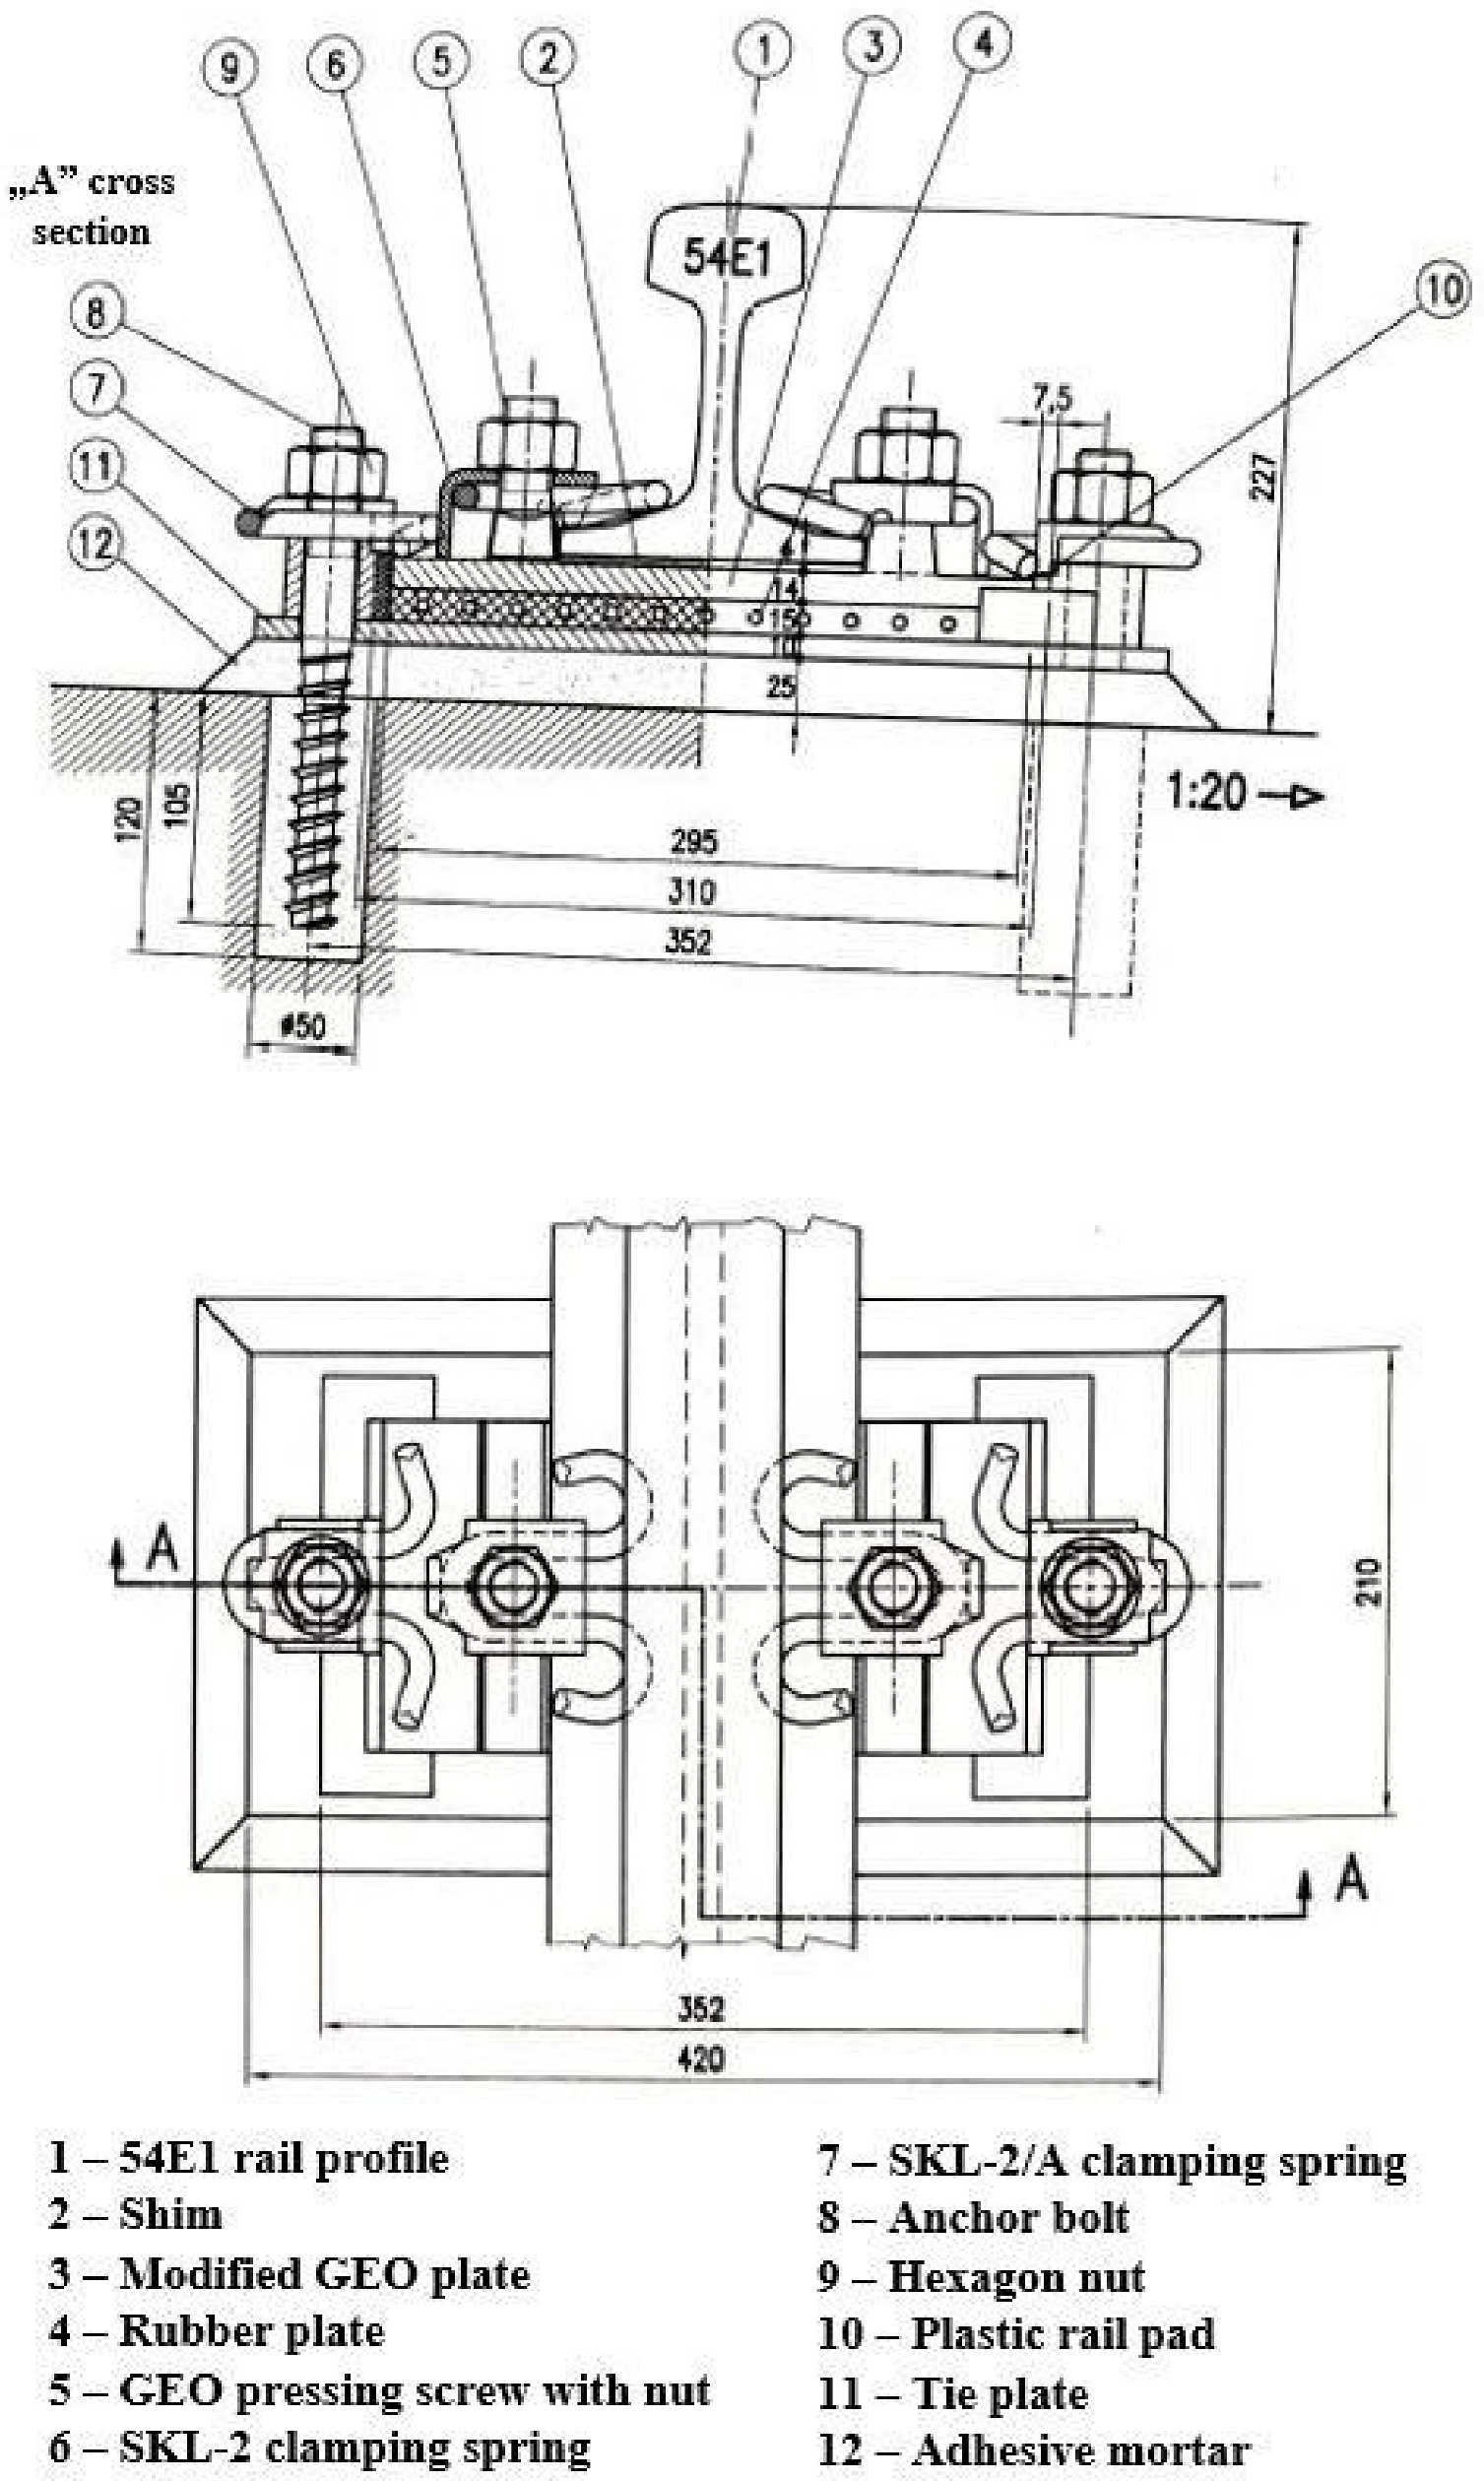
Section #5 is a 660-m-long concrete slab track built in 1986 (Figure 5). The applied rail profiles are 54E1, and they are stabilized by METRO III. type rail fastening [72] on a reinforced concrete slab (Figure 6). There is no level crossing and no turnout in the section. The geometrical configuration (alignment) is straight; there is an R = 1150 m left direction curve at the end of the section. The curve has a transition curve, and the superelevation is m = 65 mm. The gradient profile of the selected section is very variable: in the first 80 m, the track has an 8.4‰ elevation; the next 280-m long section has an 8.9‰ gradient, then there is a 110-m long 2.2‰ gradient, a 130-m long 8.0‰ gradient, and finally, a 60-m long 3.5‰ gradient.
Section #6 is a 370-m-long concrete slab track built in 2001 (Figure 7). The applied rail profiles are flat- bottom rails called MAV48, stabilized by GEO, and an embedded- type rail- fastening system on a reinforced concrete slab. There is no level crossing and no turnout in the section. The geometrical configuration (alignment) is mainly straight; there is a 91-m long (R = 240 m) right direction curve with a transition curve and a 116-m long (R = 1125 m) right direction curve, which has no transition curve. Both curves have not got superelevation. According to the measurement direction, the track has a 33.5‰ gradient; after the lowest point, the elevation is 39.3‰.
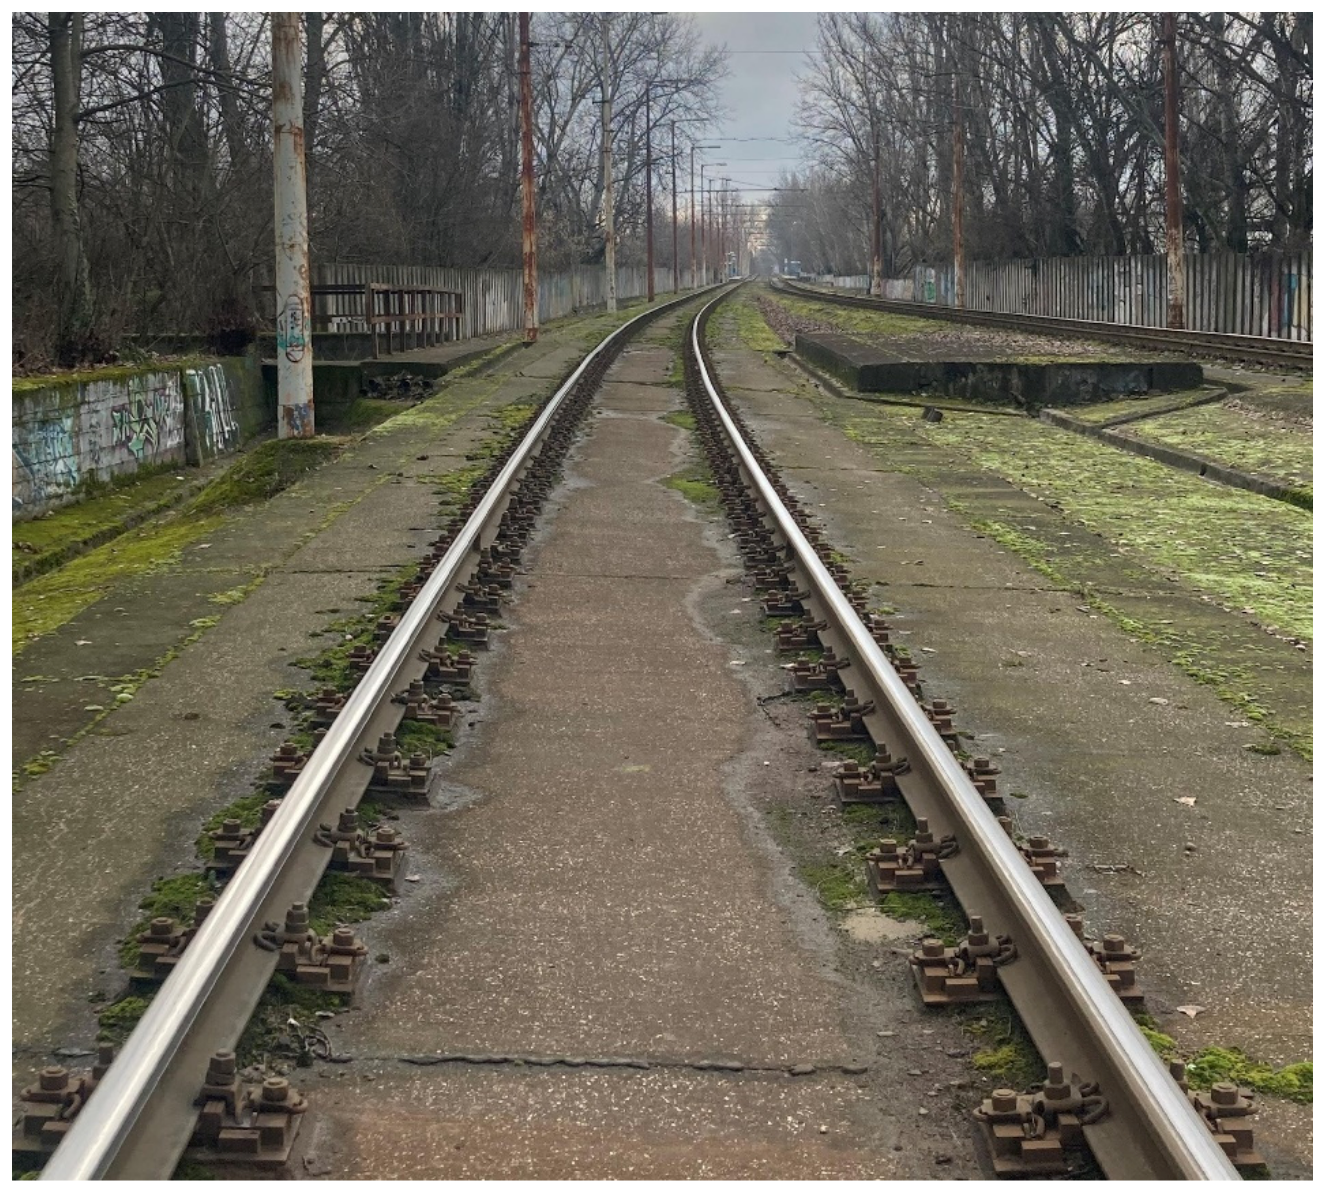
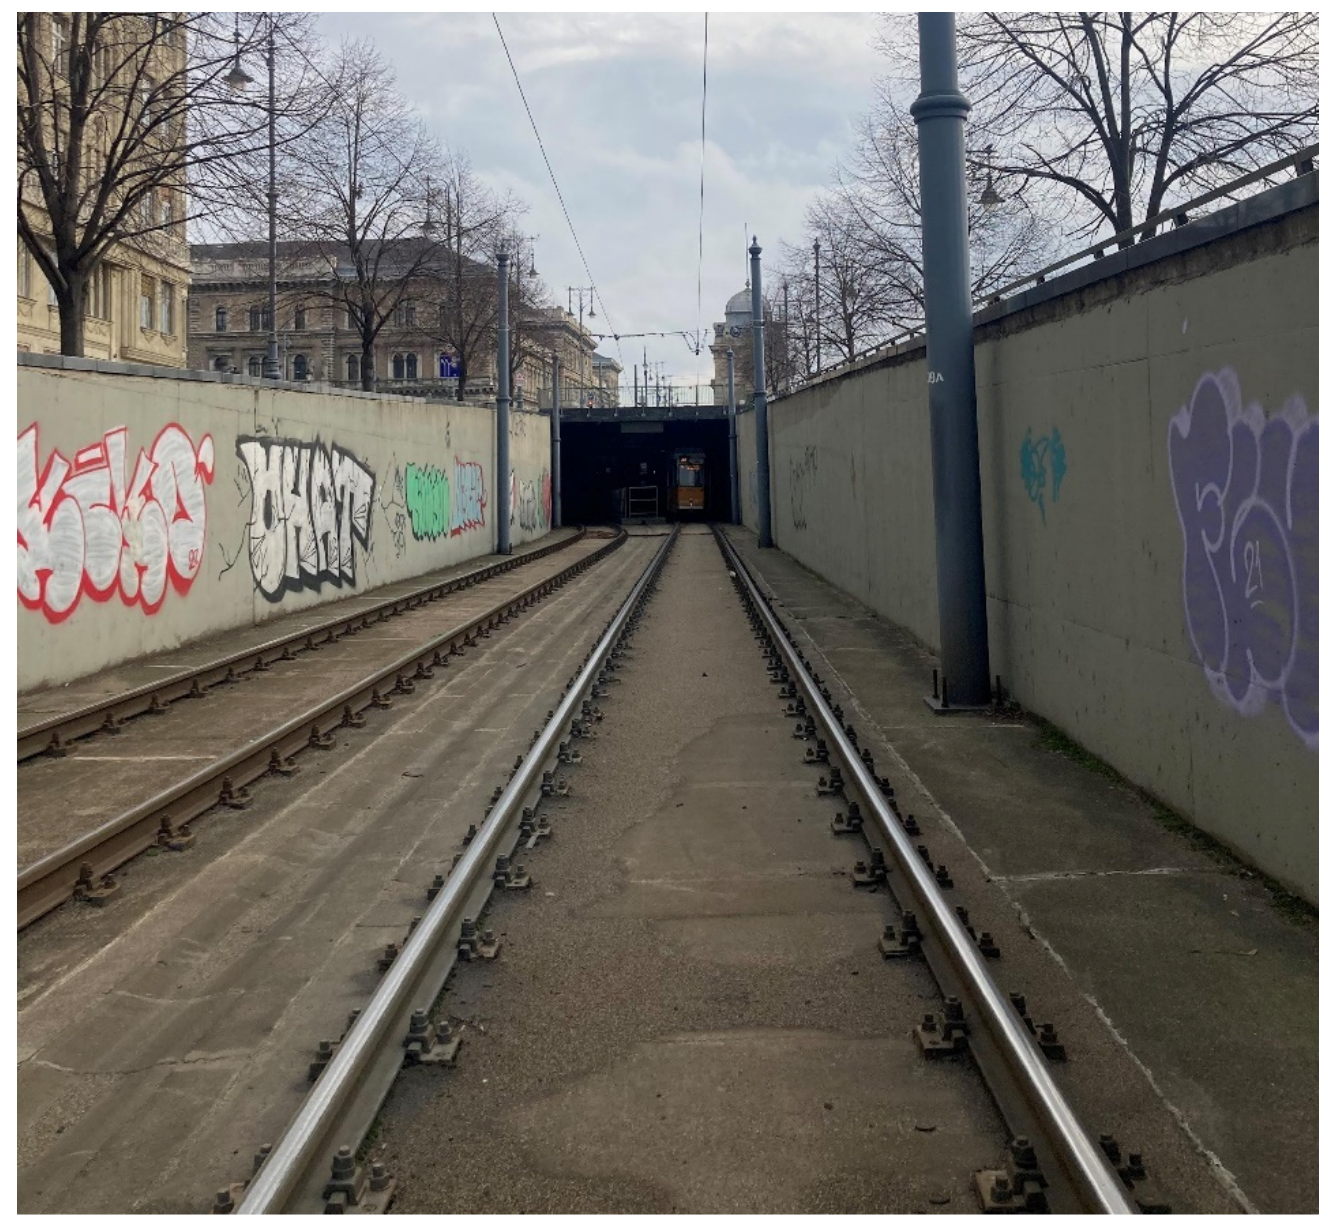
Section #7 is a 450-m-long concrete slab track built in 2010 (Figure 8). The applied rail profiles are 49E1, stabilized by GEO and embedded- type rail- fastening system on a reinforced concrete slab. There is no level crossing and no turnout in the section. The geometrical configuration (alignment) is variable; alternately, straight sections and curves exist. The curves are regularly short and have a high radius. Each curve has not got a transition curve or superelevation. The section is a tunnel, the track has an average 20.9‰ gradient, and after the lowest point, the elevation is 27.6 ‰.
2.2. Traffic Load and Age
In Hungary, several aspects are known to classify a tramway line in the capital city. The most often used characterization depends on the annual through-rolled tonnages. The through-rolled axle tonnage is the mass of all crossing vehicles on a given line in one direction in one year. It is determined by multiplying the total number of crossing vehicles on the line and the average of the T0 loading (serviceable vehicle without crew and passenger) and T3 loading (serviceable vehicle with staff and maximum passenger capacity) [71,72,73,74,75]. Based on these, four traffic load classes can be differentiated (Table 1).
In addition to the traffic load, the other important parameter that must be considered. It is the reference sections’ age. Unfortunately, it is impossible to know the exact age of each section by day, but they are known precisely by year. Therefore, in this article, the ages are relative to 2023. Table 2 shows the age and the average traffic load of the examined reference sections between 2017 and 2021.
2.3. Geometrical Measurements and Examined Parameters
The geometrical measurements are executed on average every third month at a night standstill. The TrackScan 4.01 instrument is applied to measure the geometrical characteristics of tramway tracks (Figure 9).
This instrument has been developed by the Hungarian company called Metalelektro Méréstechnika Ltd. [73,74,75]. This instrument is a complex track-measuring device that records the parameters every 25 centimeters and is suitable for continuous measurement of railway and tramway tracks. It can measure and record the following characteristics at the same time [73,74,75]:
- track gauge [mm];
- flange gauge [mm] (the distance between the guiding surface of the rail on one side and the back of the structure that ensures the guidance of the wheel on the other side, interpreted as the height of the track gauge);
- superelevation [mm];
- alignment [mm] (i.e., lateral track irregularity);
- longitudinal level [mm] (i.e., vertical track irregularity);
- length of the railway section [in meters to the nearest mm];
- twist [mm].
Based on the measured and recorded characteristics, the examined parameters of tracks are the following:
The average value of geometric characteristics was investigated during the statistical examination of the measured data.
3. Results
In this Section, the results of the geometric analysis of each reference section are presented separately. In the end, they are summed up, considering the traffic load and the sections’ ages.
3.1. Section #1
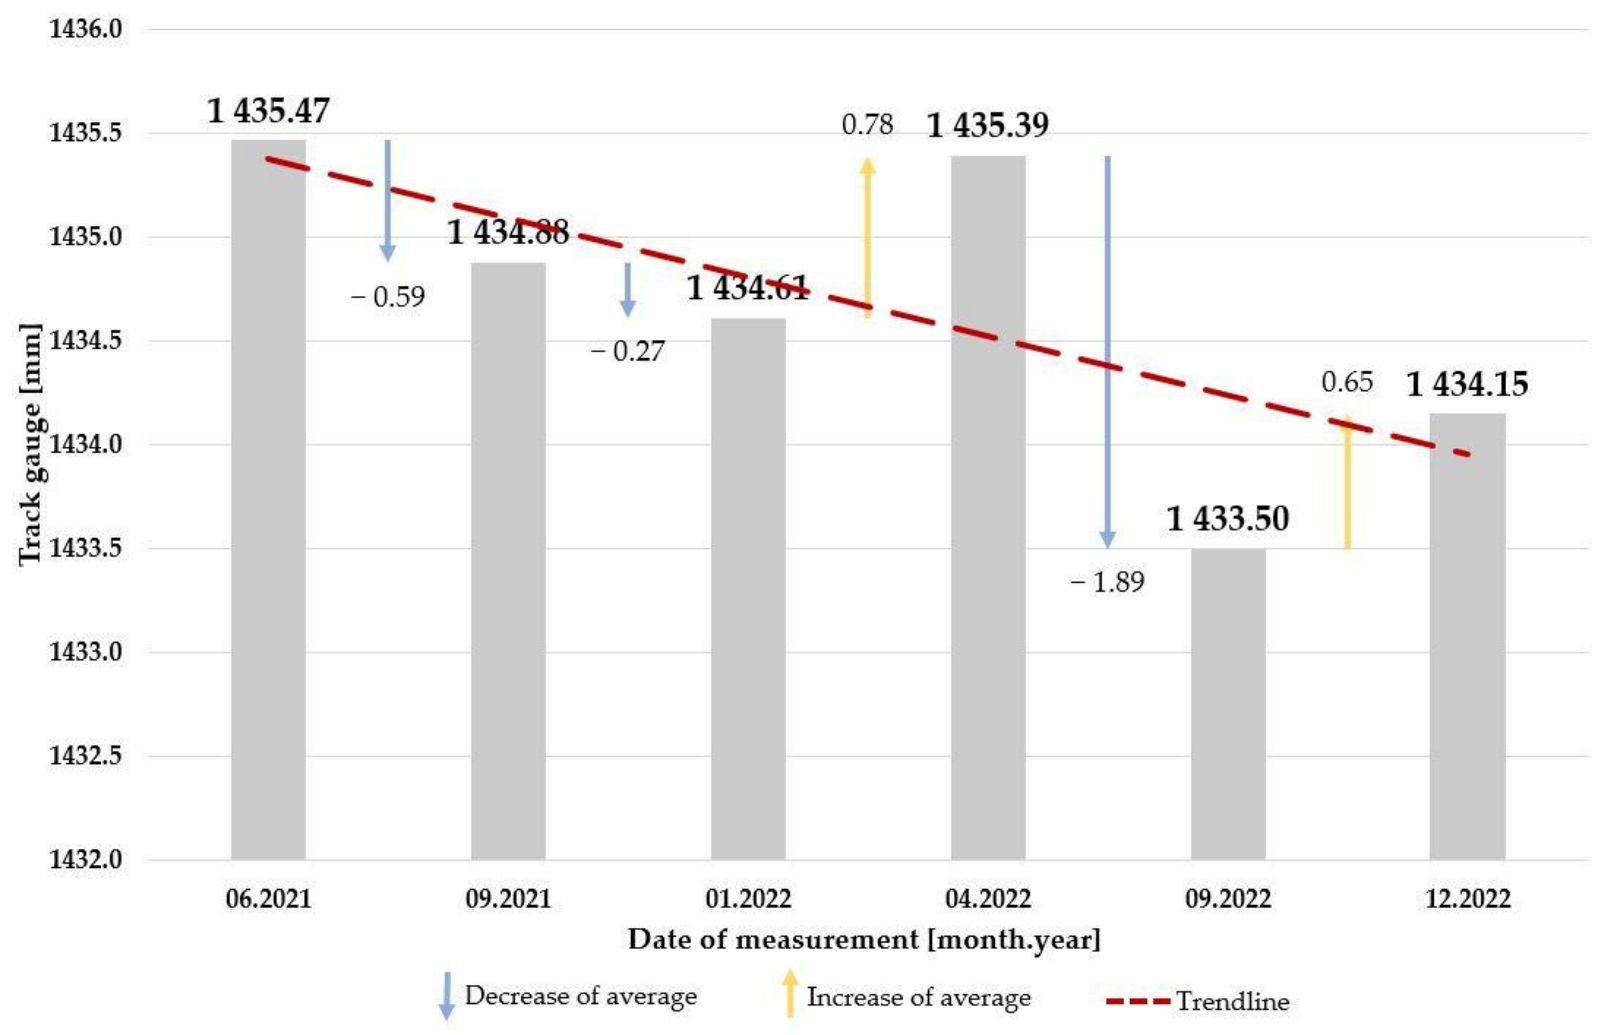
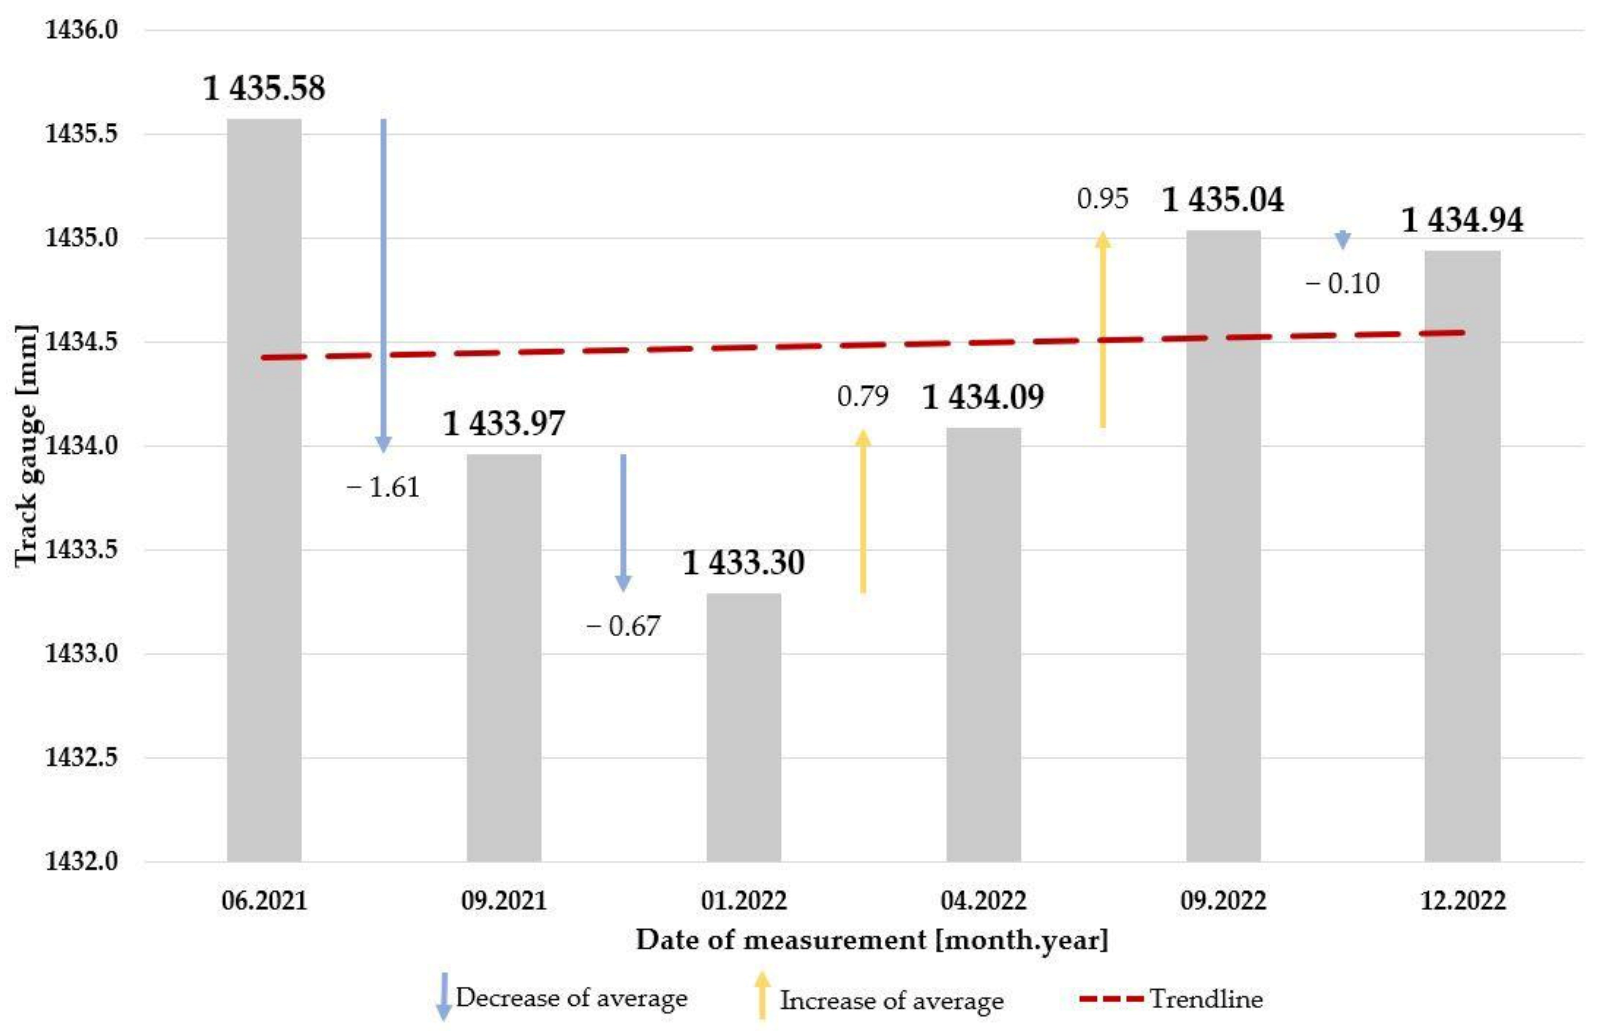
Figure 10 illustrates that the average values of the measurement results change very minimally concerning each other; there is only one case when the difference between the values is more than 1 millimeter. It is important to note that the change in average values complies with the regulations of [71]. However, based on the trendline of the measurement data, there is a clear increase in track gauge data in the section, which means the broadening of the track gauge. Therefore, it can be assumed that the weather conditions also affect the results.
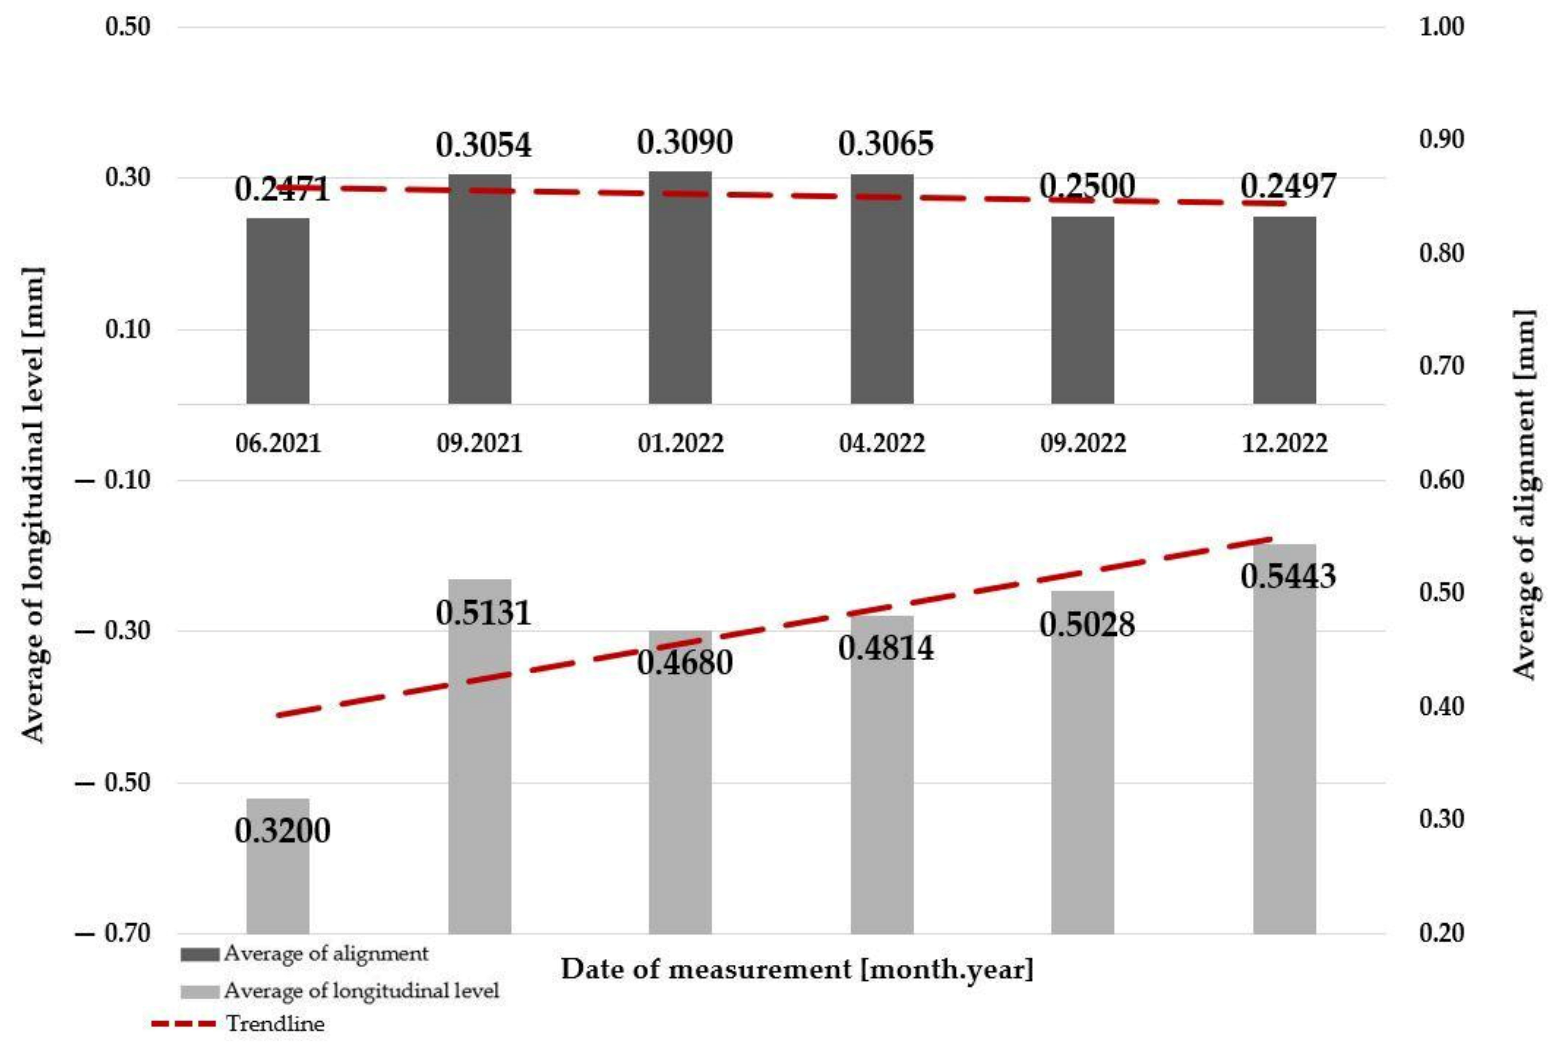
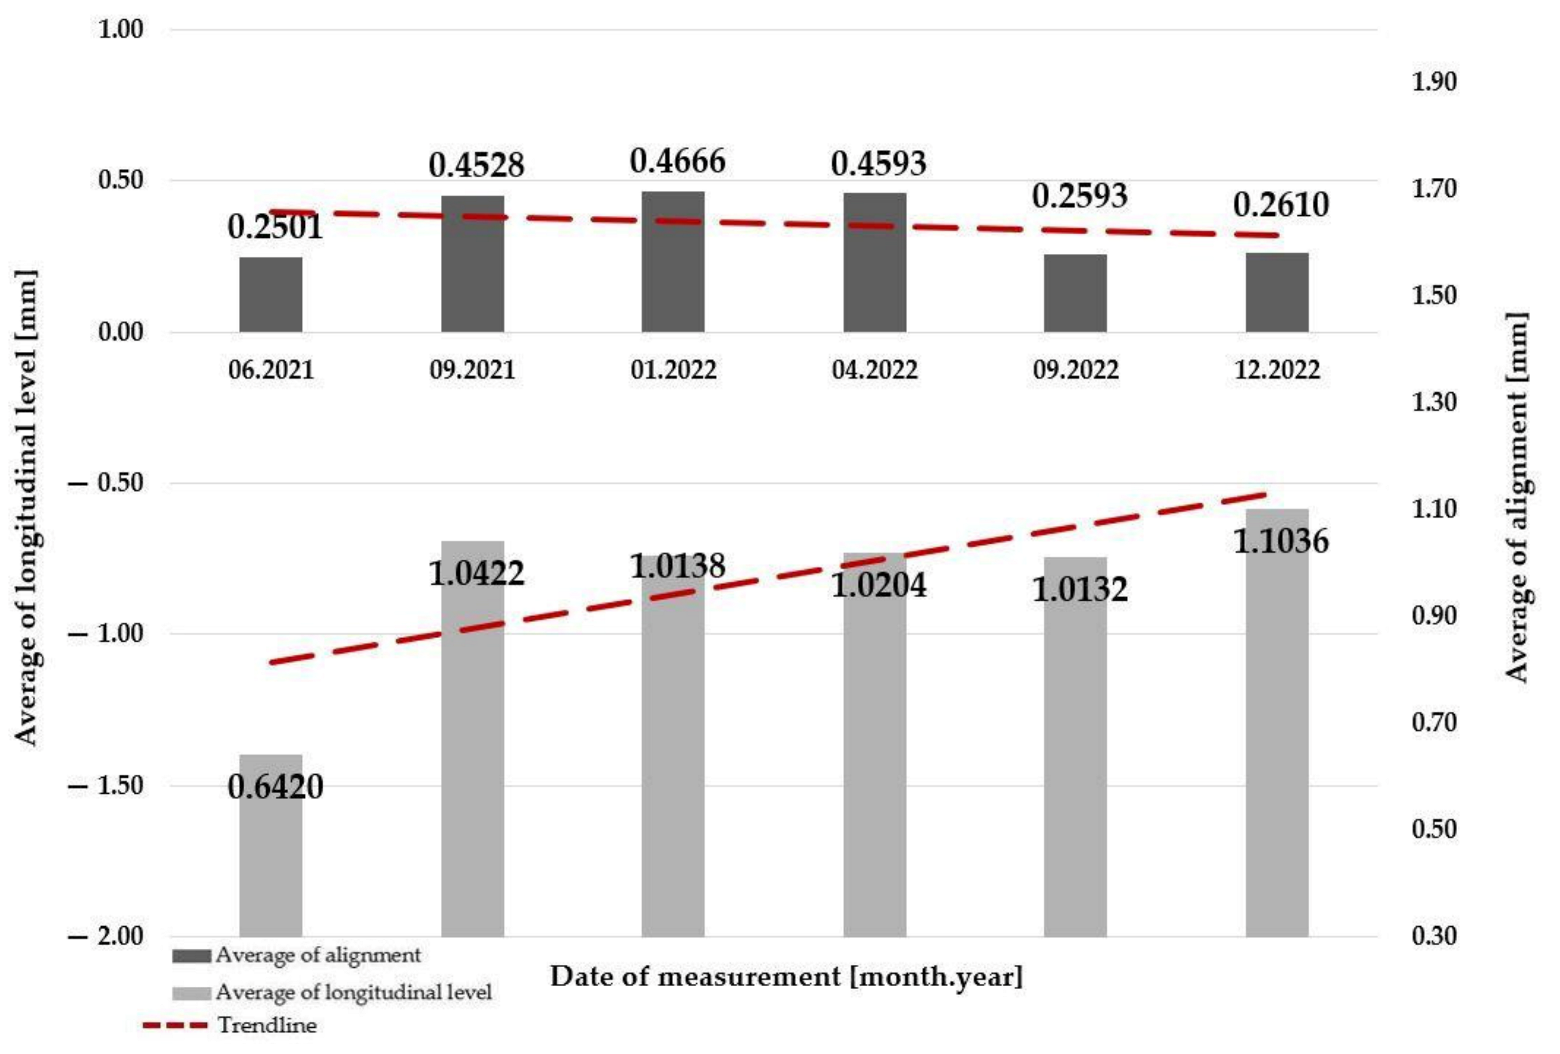
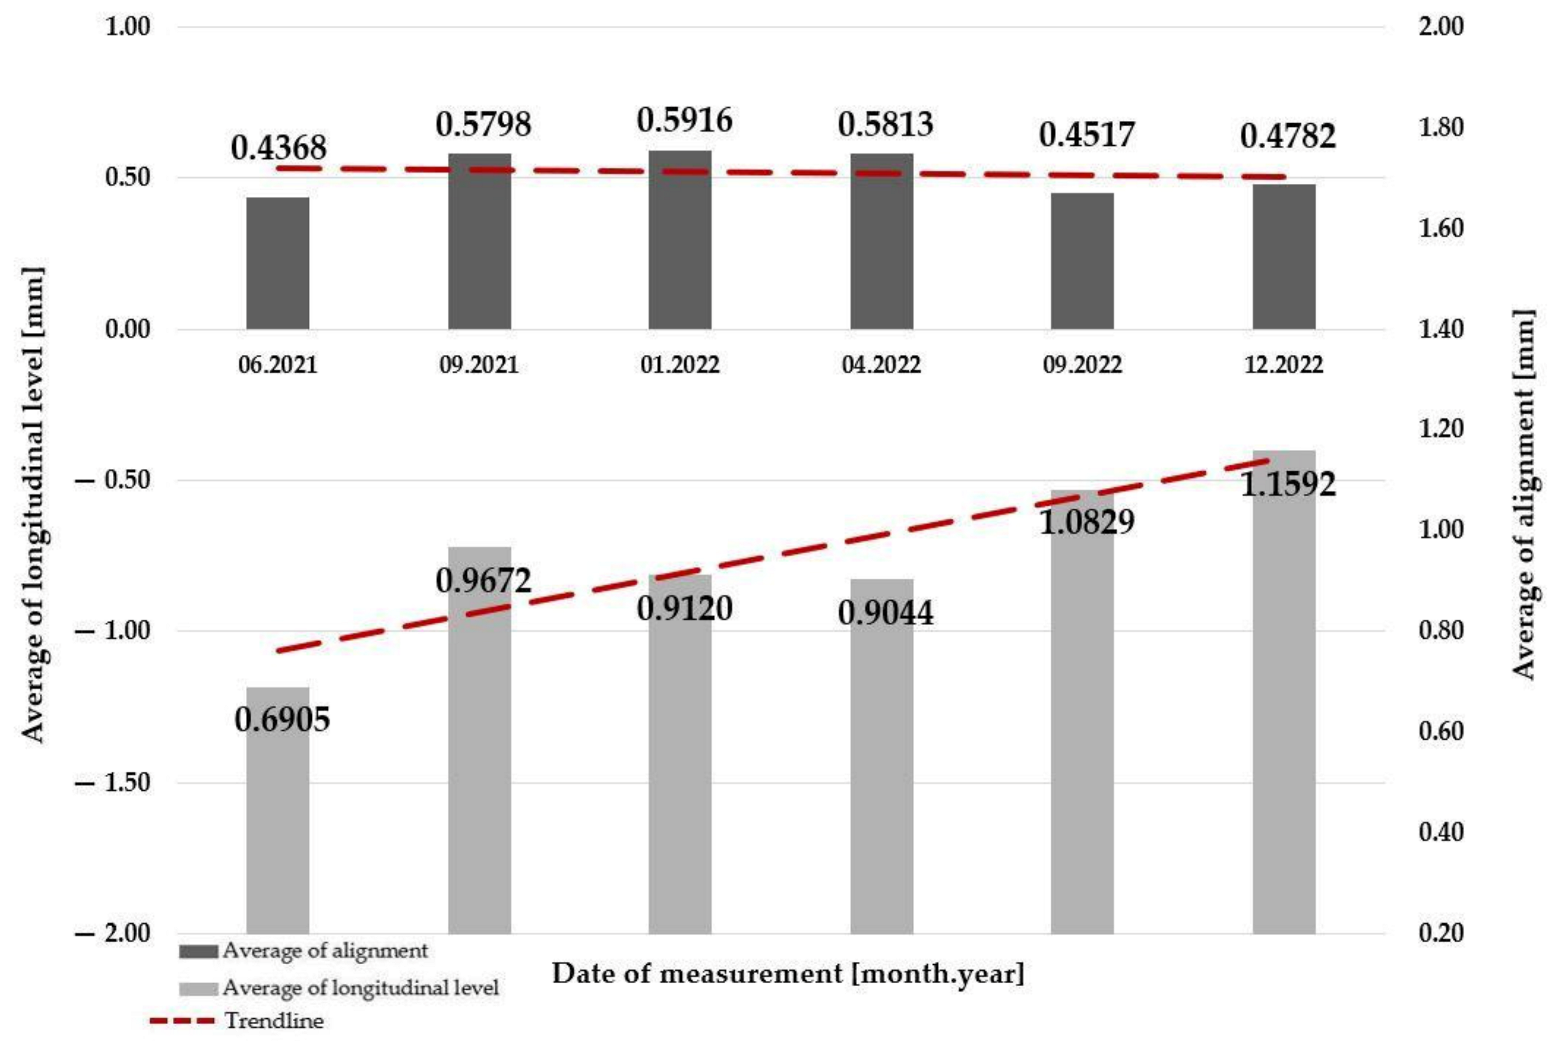
Examining the change of alignment and longitudinal level parameters is also vital. These values can have negative or positive signs, so the parameter values were examined in absolute terms to avoid errors. The TrackScan 4.01 instrument also measures these characteristics in the right and also left rail(s). In this article, the average of these values has been considered. Figure 11 shows that the trendline of the measurement data of longitudinal level—similar to the track gauge parameter—there is an evident increase. Even so, the trendline of the alignment parameter shows a minimal decrease.
3.2. Section #2
As described in Section 2.1., Section #2 is very similar to Section #1. There is only a two- year difference between their ages. Despite that fact, the change of track gauge parameter is the opposite. Figure 12 illustrates an evident decreasing trendline through the measurements, which means the narrowing of the track gauge.
Based on the results mentioned above, it was expected that opposite trendlines are formed for the alignment and longitudinal level parameters. Nevertheless, Figure 13 shows similar trendlines, such as the track gauge parameter’s trendline. However, in the case of the longitudinal level, there is a clear increase. Moreover, in the case of the alignment parameter, there is a minimal decrease.
3.3. Section #3
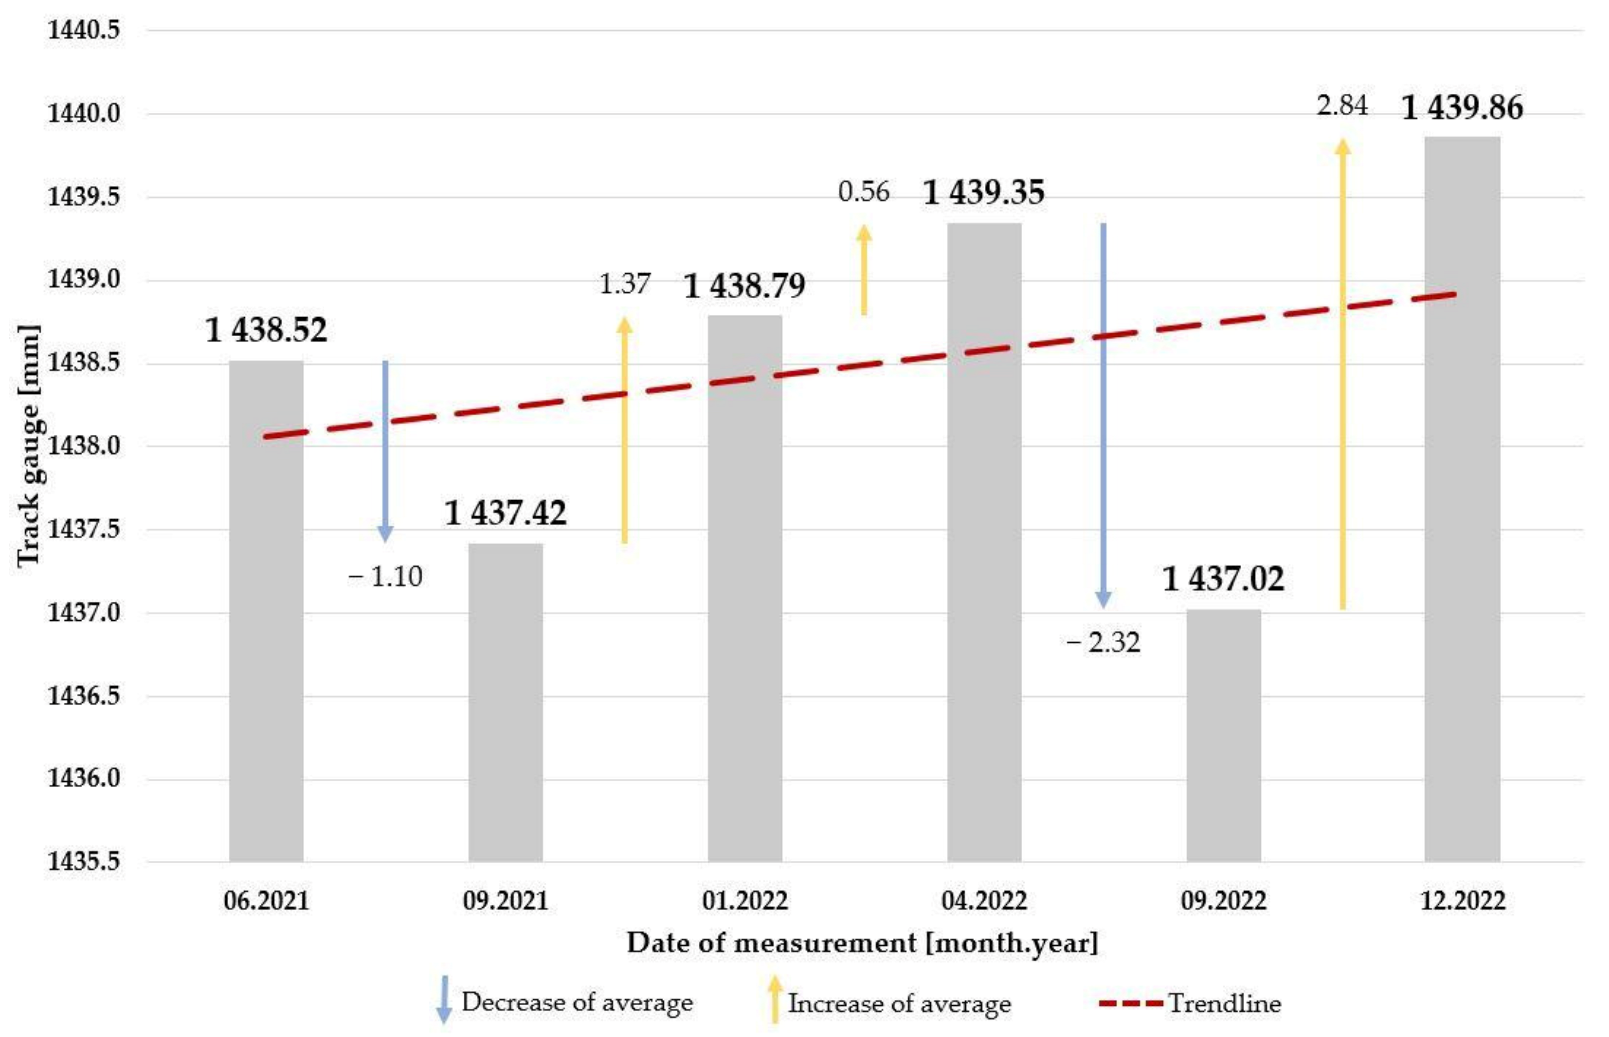
Section #3 is younger than the previous ones. In this case, the trendline of the track gauge parameter shows an unequivocal decrease, which means the narrowing of the track gauge (Figure 14). There are more cases when the difference between the values is more than 1 millimeter. The gradient of this trendline is smaller than the trendline of Section #2.
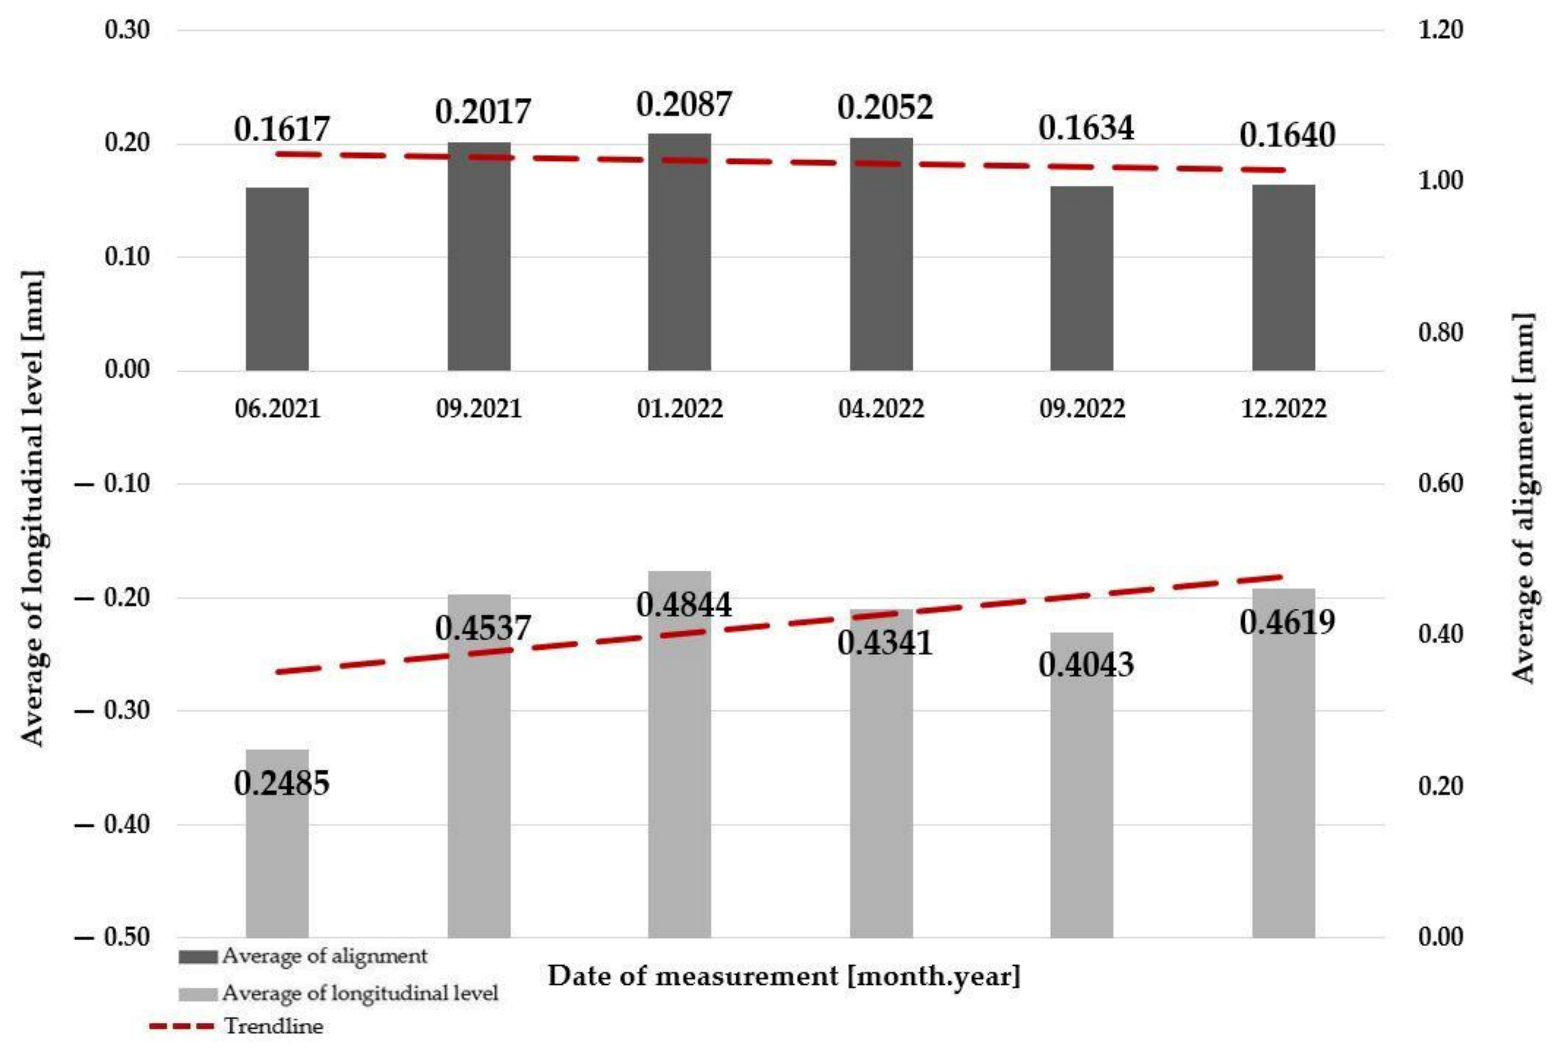
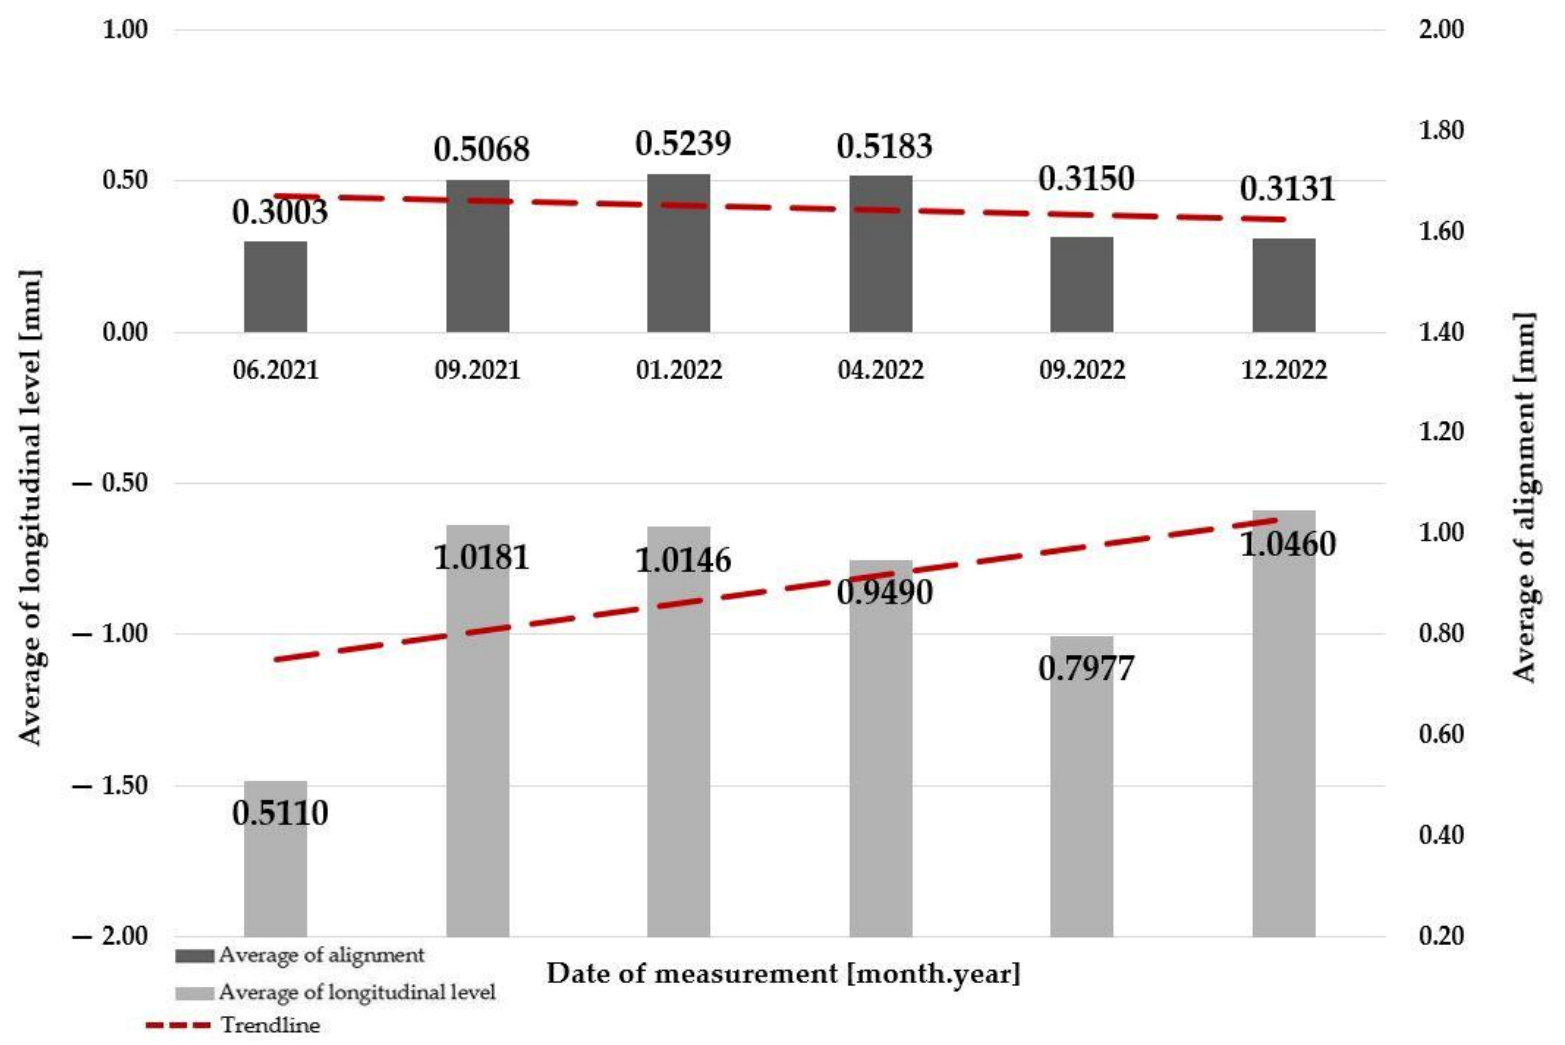
Figure 15 represents the examination of the change of alignment and longitudinal level parameters. The trendline of the longitudinal level—similar to Section #1 and Section #2—is evidently increasing. On the other hand, the trendline of the alignment parameter shows a decrease.
3.4. Section #4
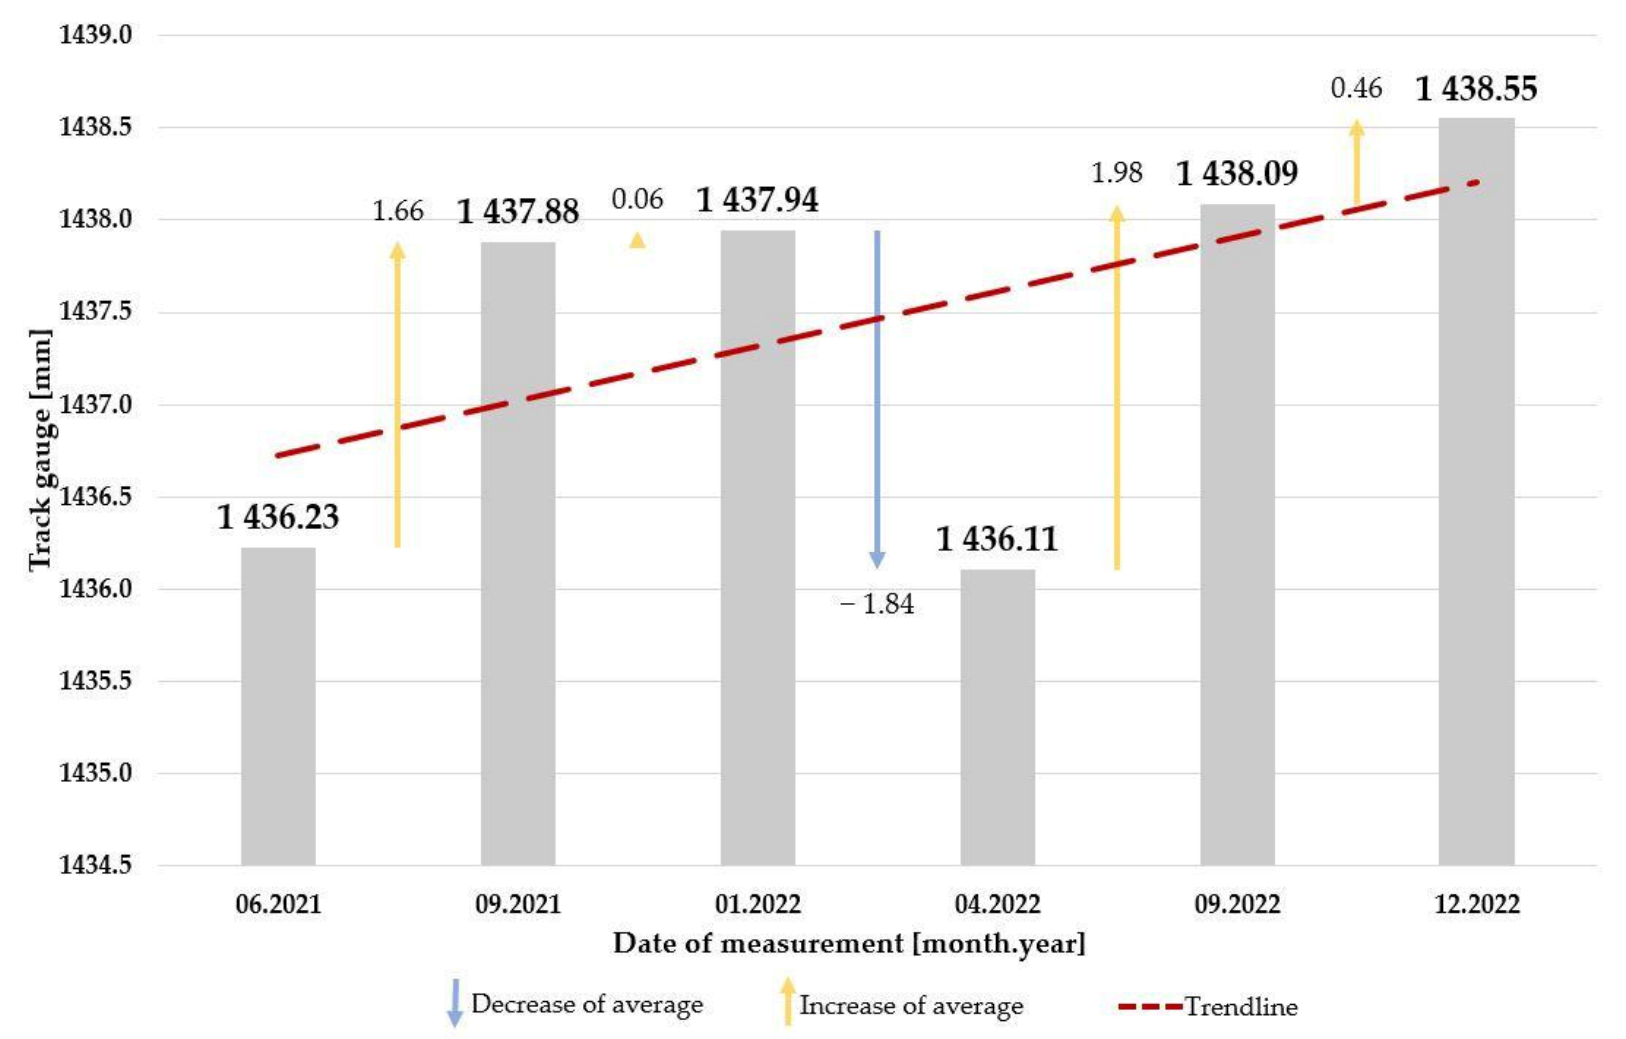
Section #4 is the youngest examined ballasted track section. The trendline of the track gauge parameter illustrates an evident but slight increase, which means the broadening of the track gauge. (Figure 16). In the case of the first four measurements, the difference between the values is 1 millimeter on average. The first and the second changes show a decreasing value, and the third and the fourth changes show an increasing value. The rise of this trendline is smaller than the trendline of Section #1.
Similar to the previous ones, Figure 17 shows that the trendline of the longitudinal level is increasing, while the trendline of the alignment parameter shows a minimal decrease.
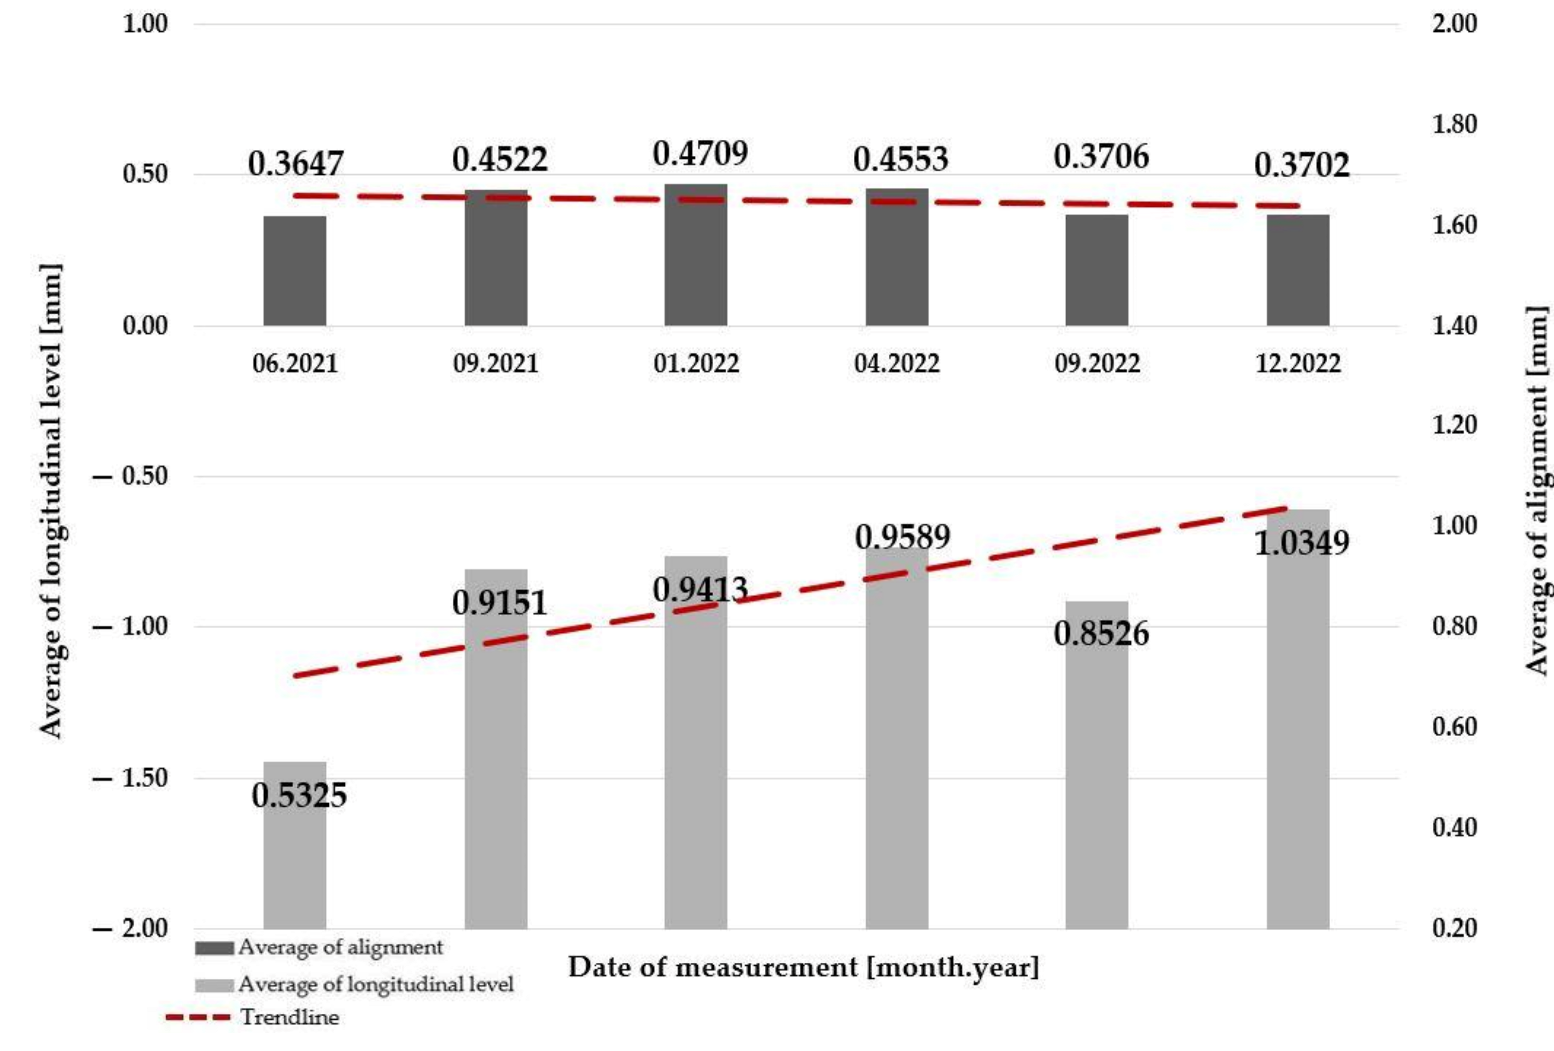
3.5. Section #5
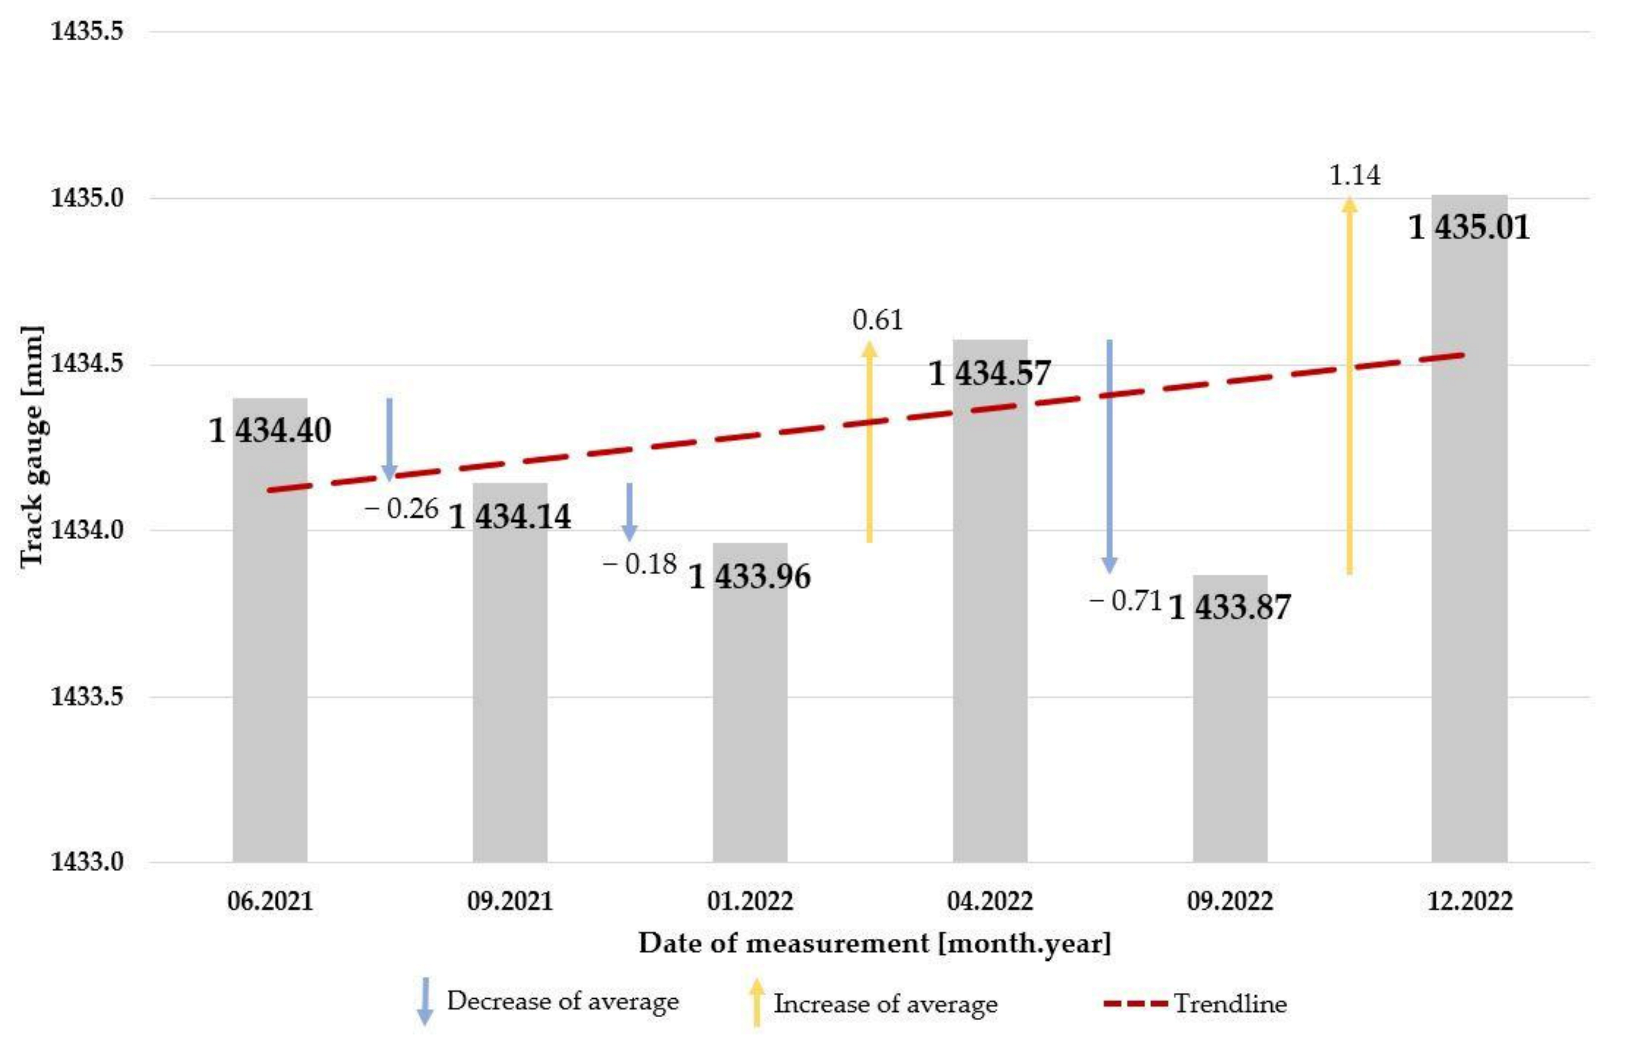
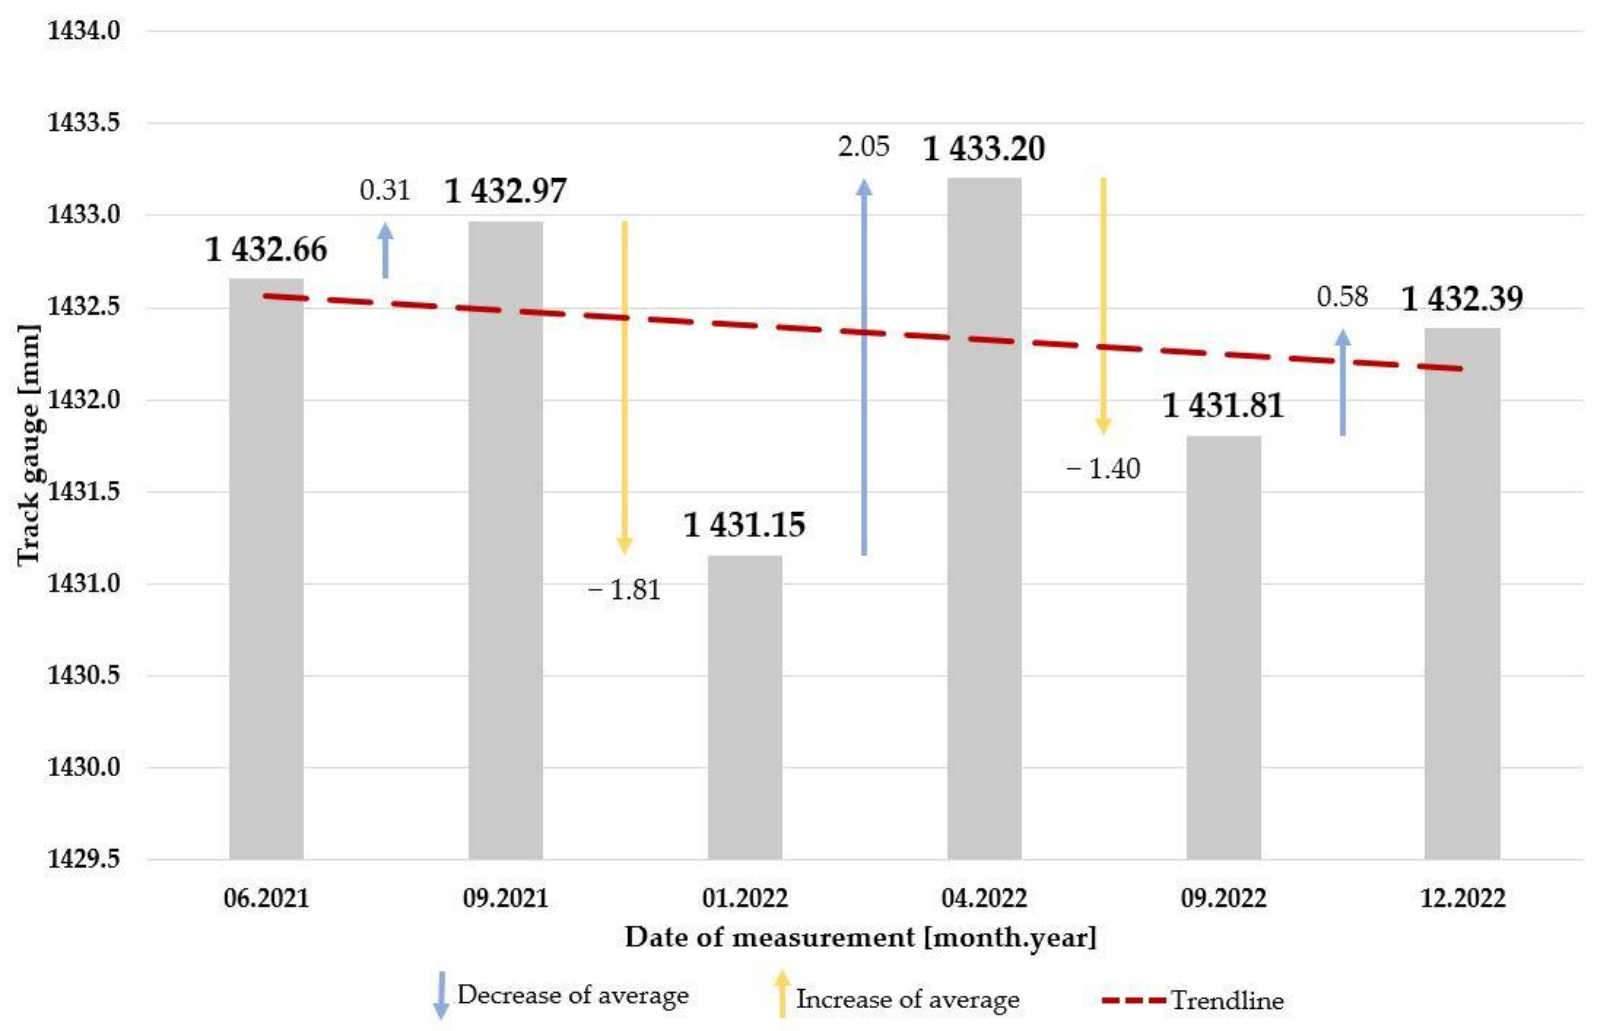
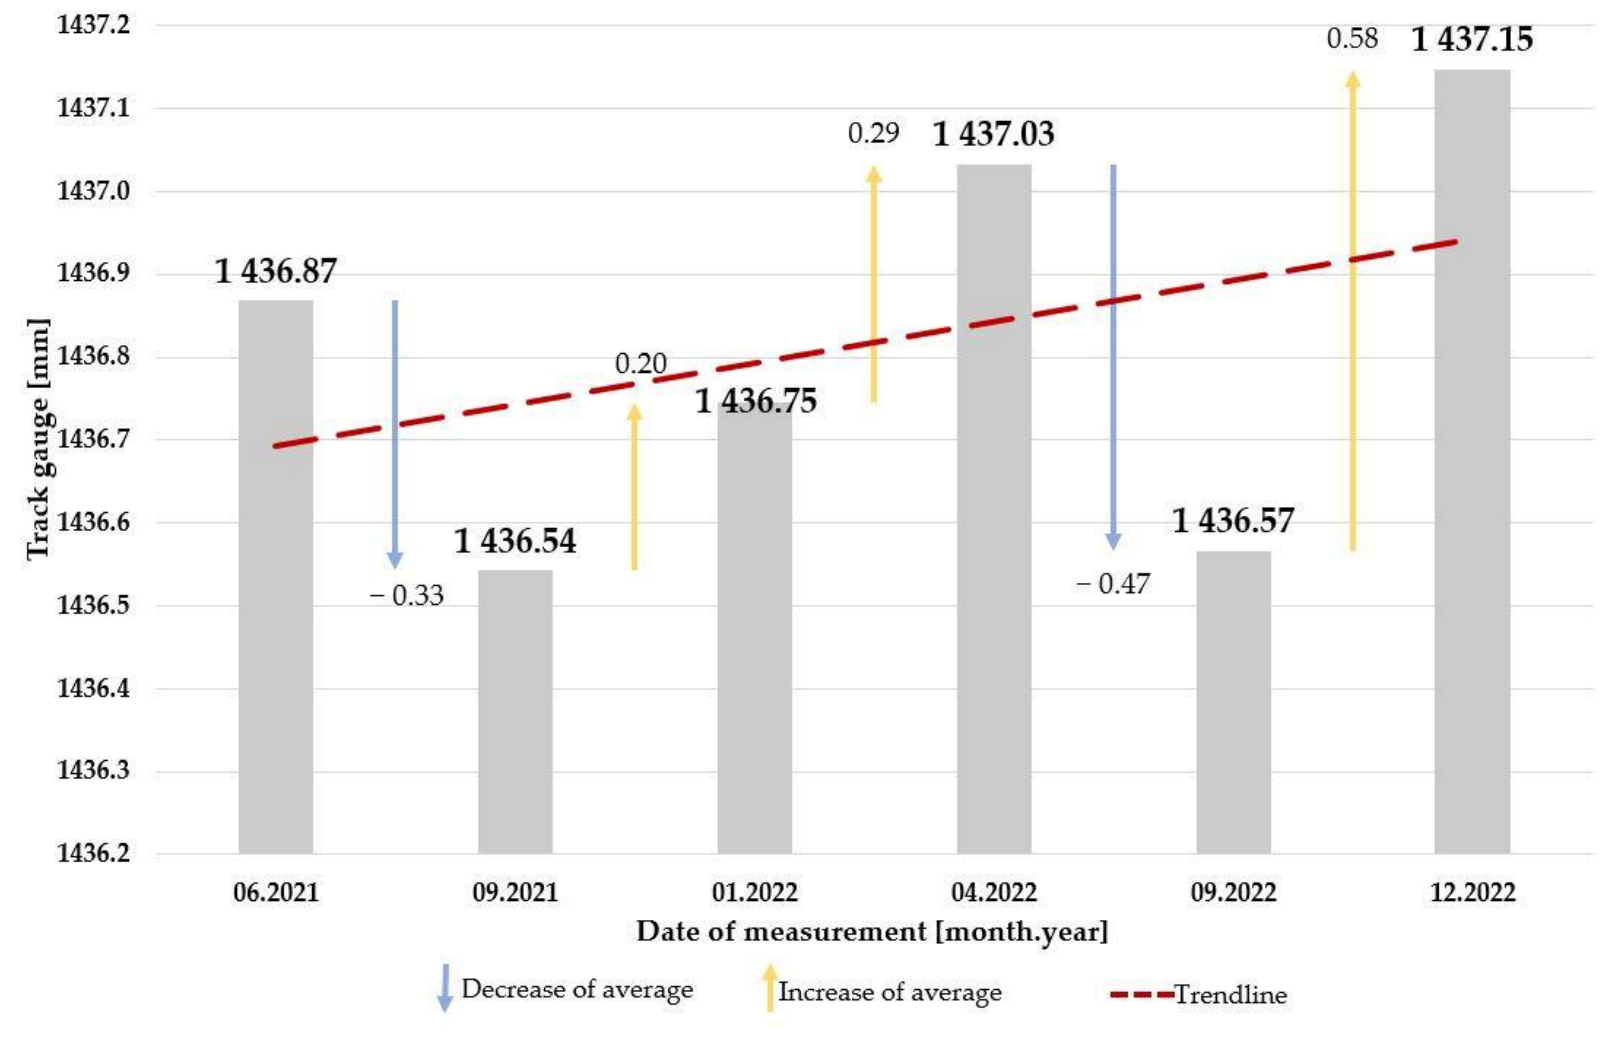
Figure 18 represents the average of track gauge parameters in the case of the oldest concrete slab track section in this research. It is crucial to notice the differences between the results of the last three measurements: the decreasing and the increasing values are almost the same.
The trendline indicates a pronounced increase, which means the track gauge has been broadened, just as in Section #1.
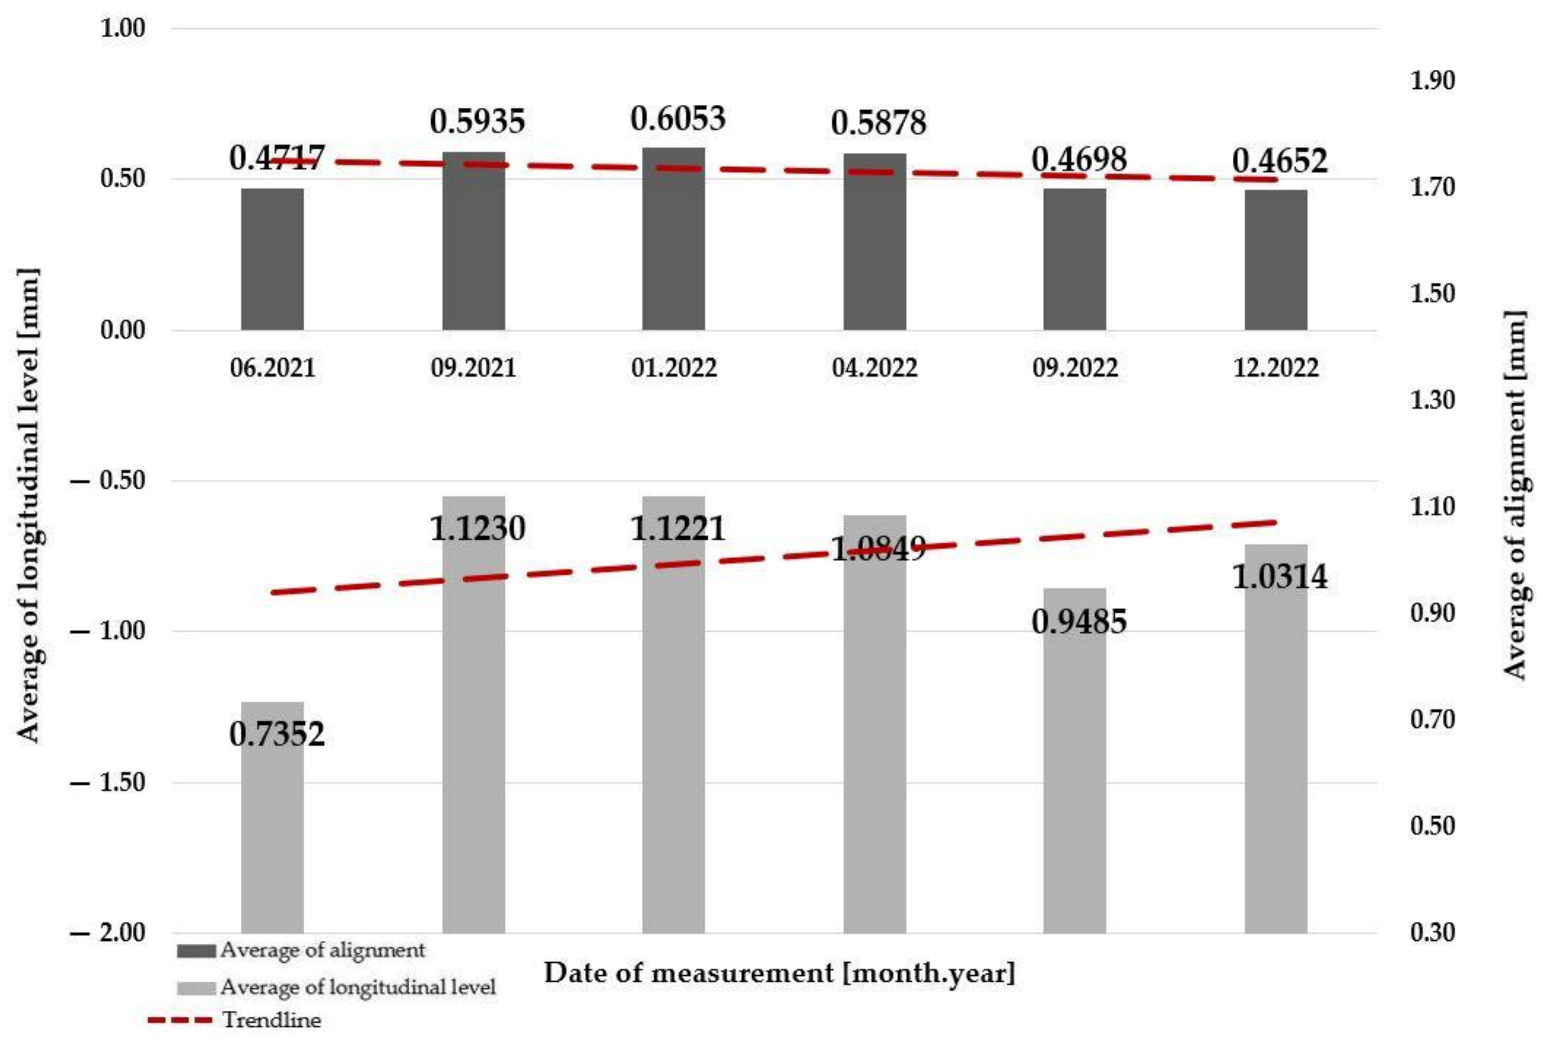
Figure 19 shows the assessment of the change of alignment and longitudinal level parameters. The trendline of the longitudinal level—similar to the previous sections—is increasing. However, the trendline of the alignment parameter also shows a decrease.
3.6. Section #6
Figure 20 introduces the changing of the average of the track gauge parameter of Section #6. In this case, as in Section #5, the trendline of the track gauge parameter shows a noticeable increase, which means the broadening of the track gauge. There are more cases when the difference between the values is increasing. The gradient of this trendline is similar to the trendline of Section #5.
Like all the previous sections, Figure 21 represents that the trendline of the longitudinal level is increasing, while the trendline of the alignment parameter shows a minimal decrease.
3.7. Section #7
Figure 22 illustrates the average of the track gauge parameters in the case of the youngest concrete slab track section related to the present investigation. The differences between the results of the last two measurements are similar, but they are in contrast. The trendline shows an evident increase, which means the broadening of the track gauge, similar to the case of Section #5 and Section #6.
Based on the previous results, it was expected that the trendlines seem to be the same. Figure 23 shows that the trendline of the longitudinal level is increasing, and the trendline of the alignment parameter is decreasing minimally.
4. Discussion
In this Section, the results of the geometric analysis of each reference section are discussed based on each superstructure system.
4.1. Results of Ballasted Track Systems
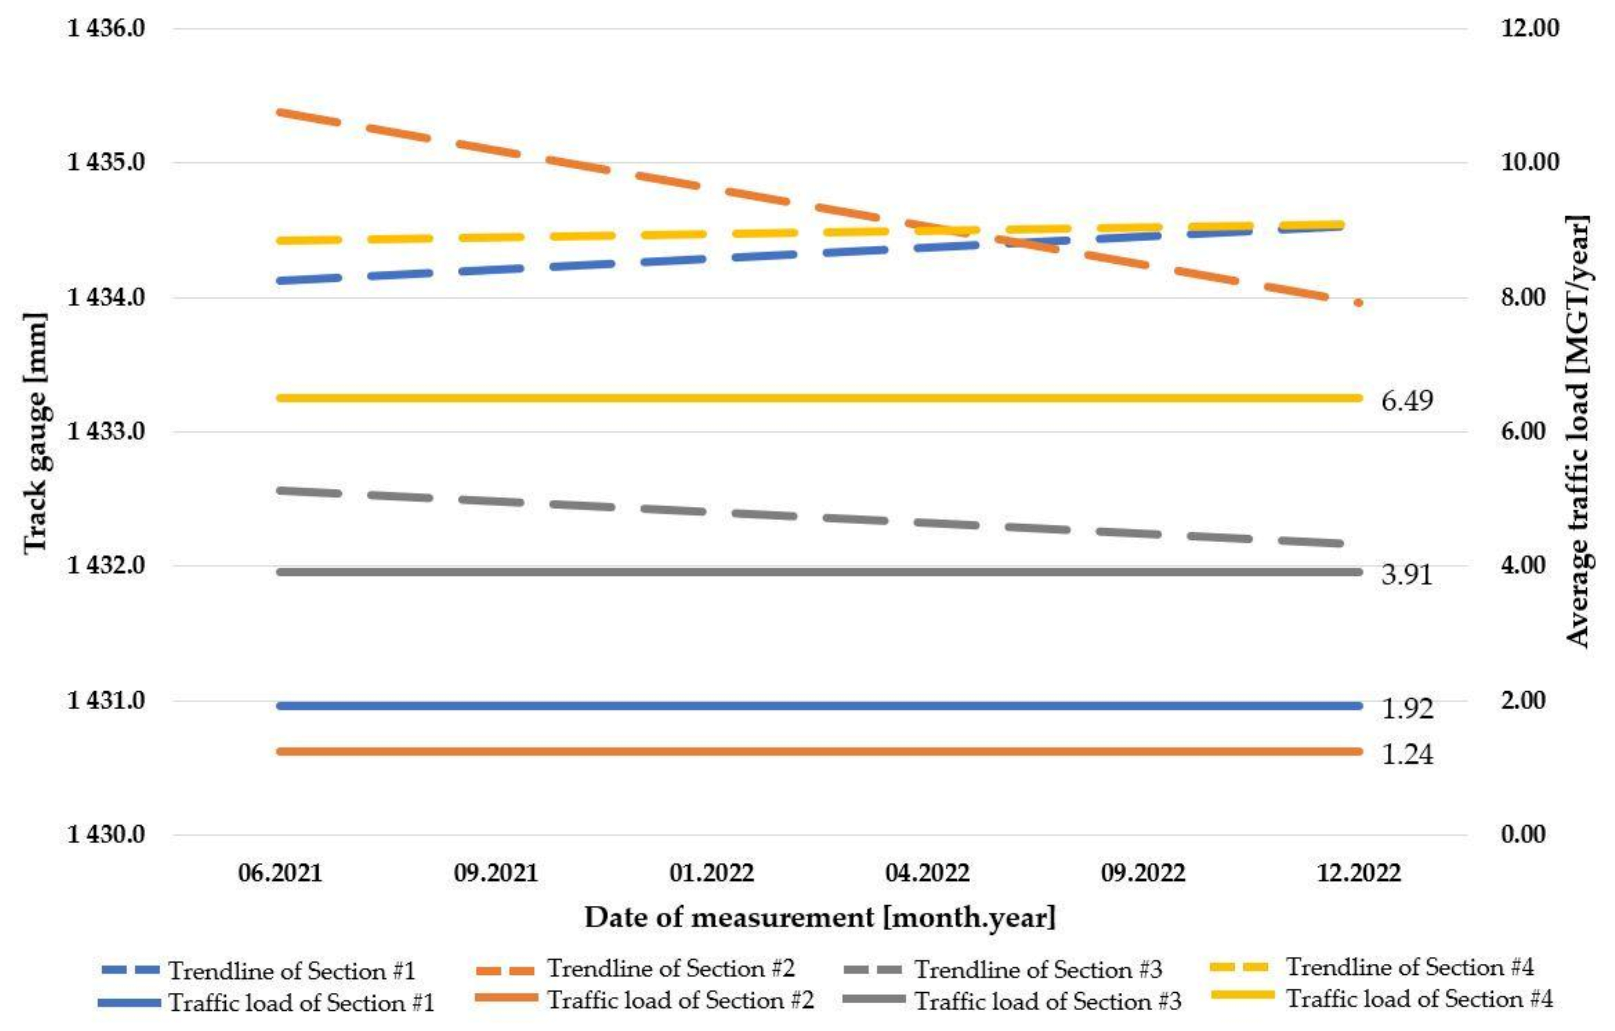
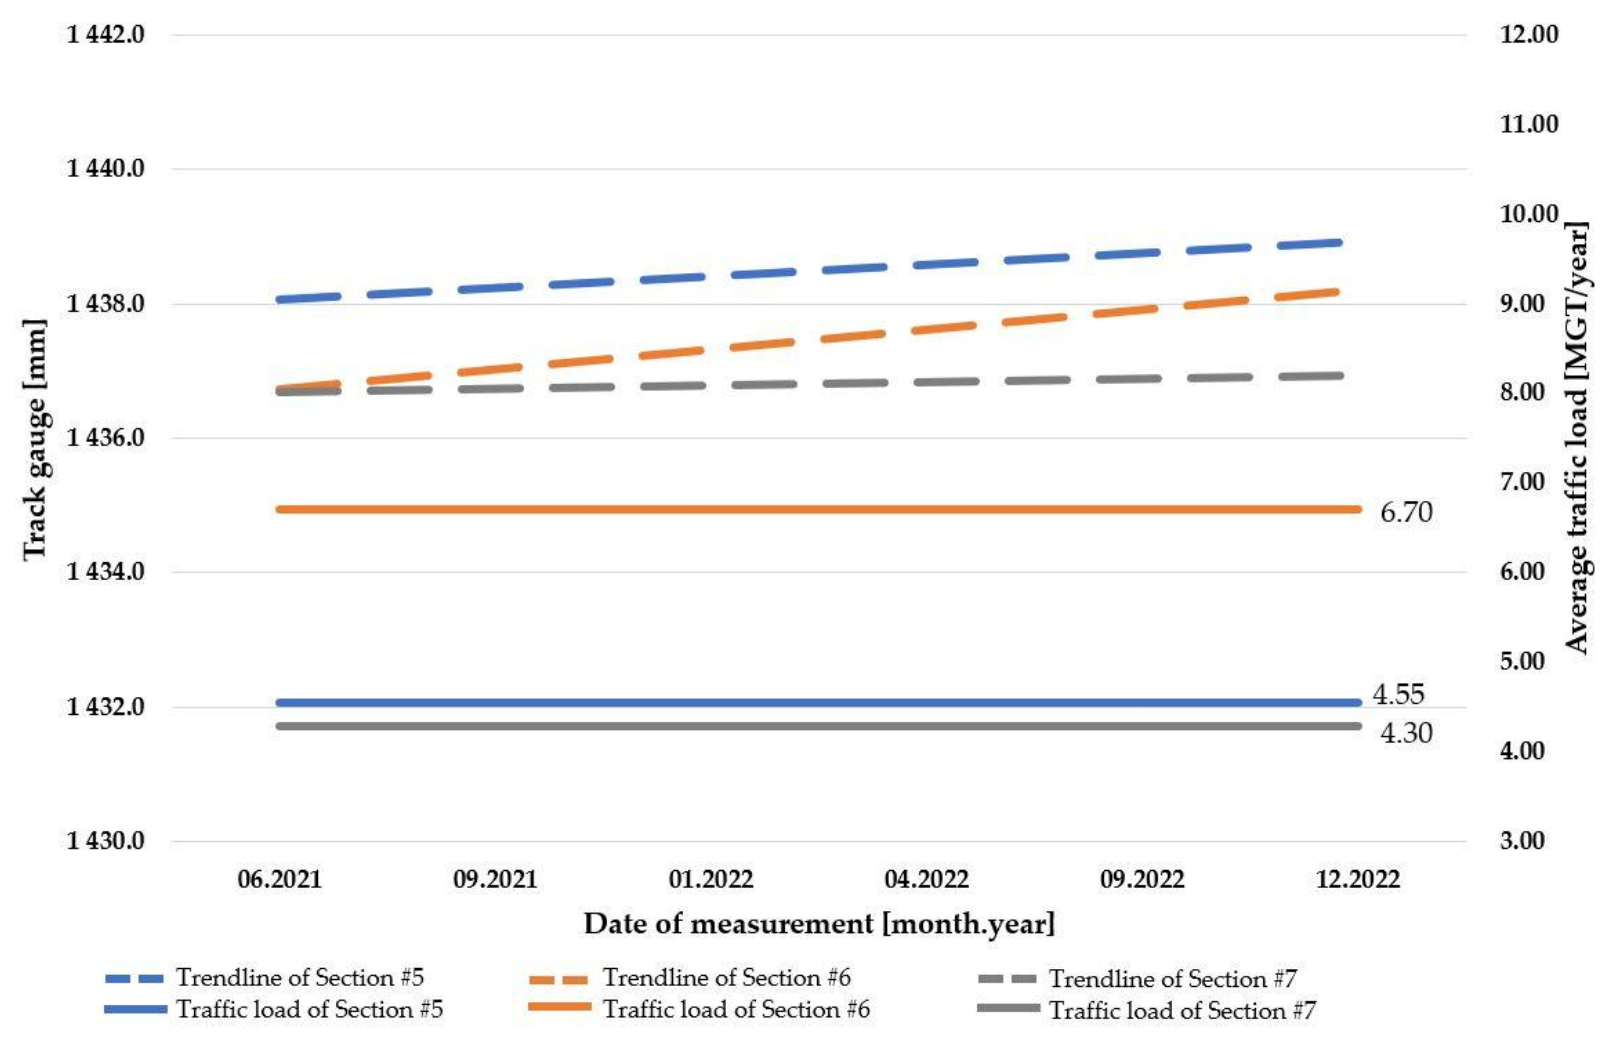
Figure 24 represents the relationship between trendlines of track gauge changes in the case of examined ballasted track systems and average traffic load values.
Section #1 and Section #2 are almost the same age and have almost the same average traffic load; despite that fact, their trendlines are opposite. The grade of the trendline in the case of Section #2 is steeper than in the case of Section #1. Section #3 was built 15 years later than Section #2, and its load is three times greater than Section #2’s traffic load. Even so, the grade of their trendlines is very similar. Section #4 is the most recent ballasted track, and it has more than three times greater traffic load than Section #1. Despite that, their trendlines are almost the same.
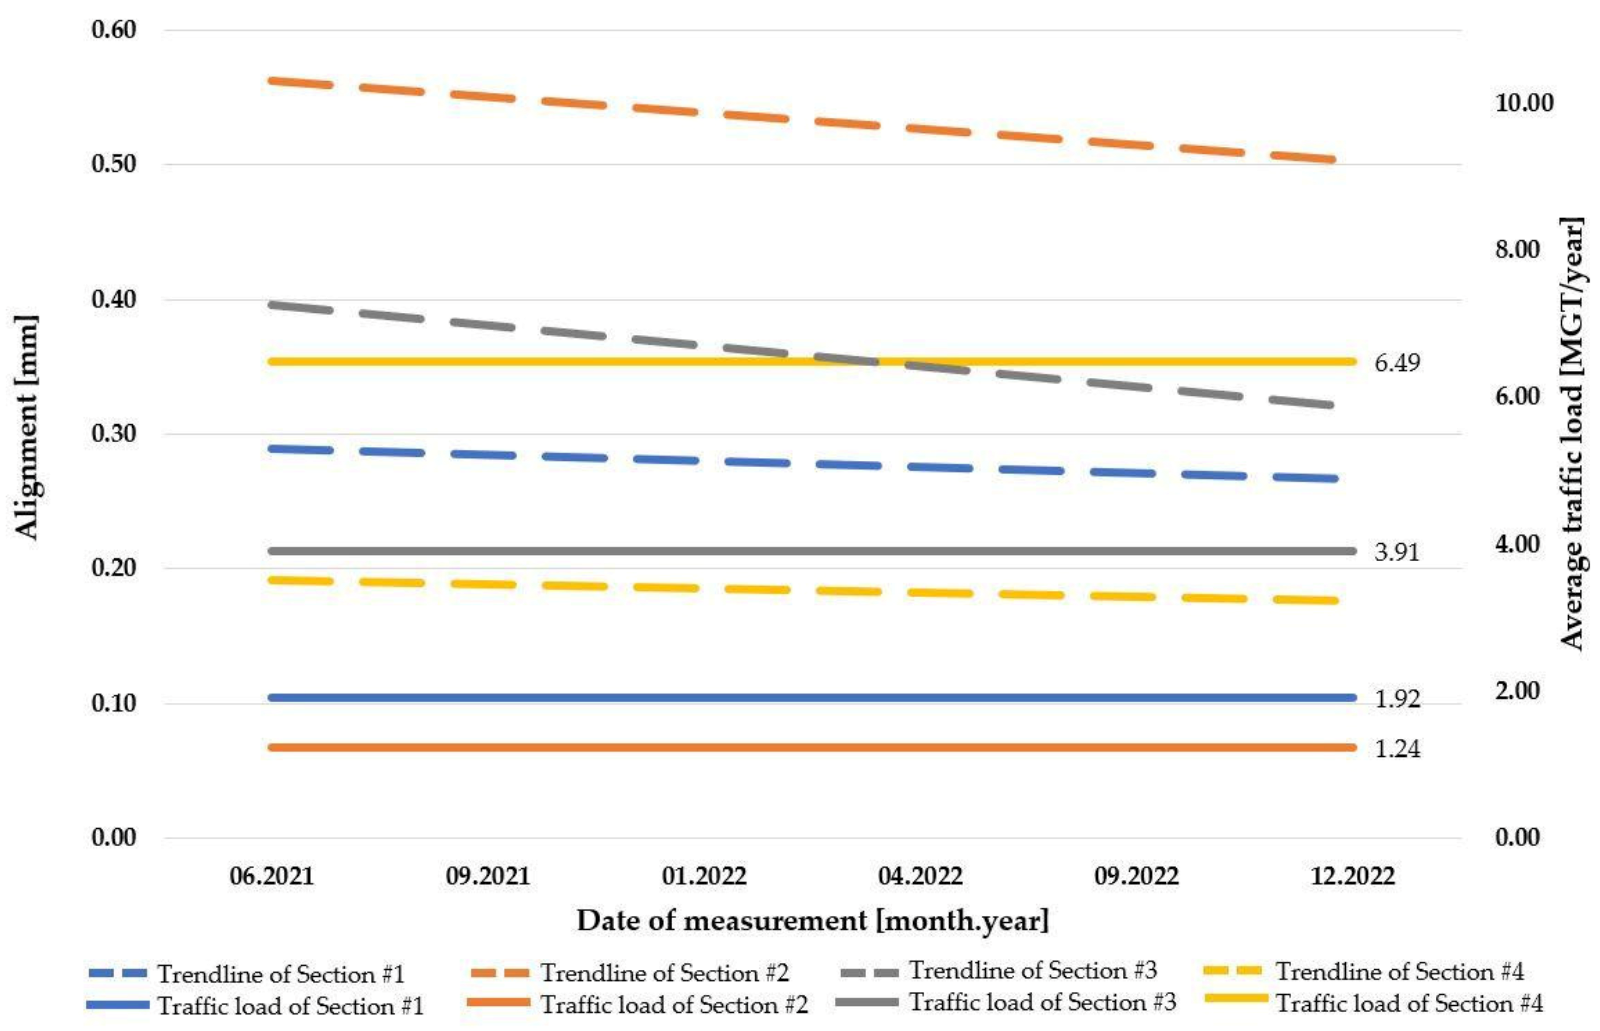
Figure 25 shows the relationship between trendlines of alignment changes in the case of the examined ballasted track systems and average traffic load values.
Regardless of the traffic load level, in each section, the trendlines are decreasing. Section #1 is the oldest ballasted track, and the grade of its trendline is similar to Section #4, which is the newer section. The grade of the trendline of Section #2 is steep, similar to the trendline of Section #3.
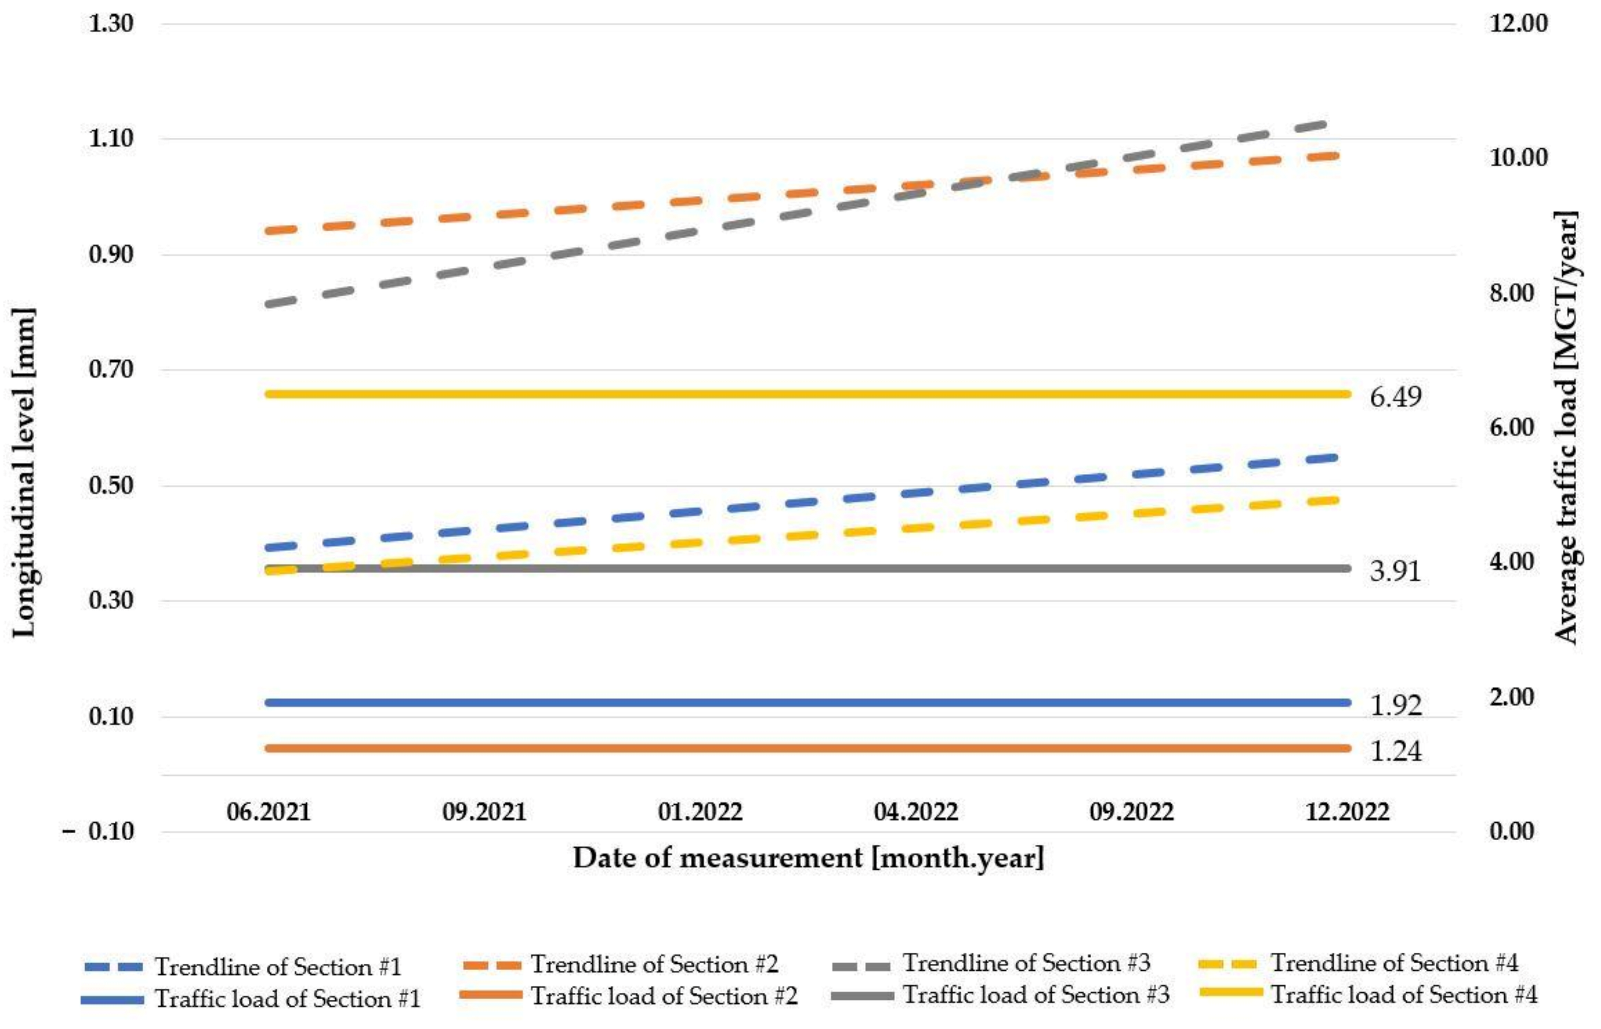
Figure 26 shows the relationship between trendlines of the longitudinal level changes in the case of examined ballasted track systems and average traffic load values.
Similar to the results of the alignment parameter, regardless of the level of traffic load, in the case of each section, the trendlines are increasing. Section #1 is the oldest considered and analyzed ballasted track section, and the grade of its trendline is similar to Section #4, which is the considered most younger section. There is also a significant difference between their traffic load values.
The grade of the trendline of Section #3 is steep, similar to the trendline of Section #2.
The results of the examination of the longitudinal level parameter are similar to the results of the alignment parameter but the opposite.
Based on the results, the following statements can be determined about the ballasted tracks:
- when a ballasted track section is at least 1.5-times older but has a lower traffic load, the narrowing of the track gauge is similar to the case when the ballasted track is newer but has a greater traffic load: the deterioration is comparable;
- when a ballasted track section is at least seven times older and has at least a traffic load at least three times higher than another ballasted track, the broadening of the track gauge is similar: the deterioration is comparable;
- regardless of the level of traffic load, the average value of alignment is decreasing;
- when a ballasted track is at least seven times older and has a traffic load at least three times higher than another ballasted track, they have a similar average value of decreasing alignment;
- regardless of the level of traffic load, the average value of the longitudinal level is increasing.
4.2. Results of Concrete Slab Track Systems
Figure 27 illustrates the relationship between trendlines of track gauge changes in the case of examined concrete slab track systems and average traffic load values.
According to the results, in the case of each examined track section, the trendlines are increasing. Section #6 is much steeper than Section #5 or Section #7. This fact can be explained by Section #6’s higher traffic load.
Section #7 was built 24 years later than Section #5, and its load is almost the same; moreover, the grade of their trendlines is also very similar.
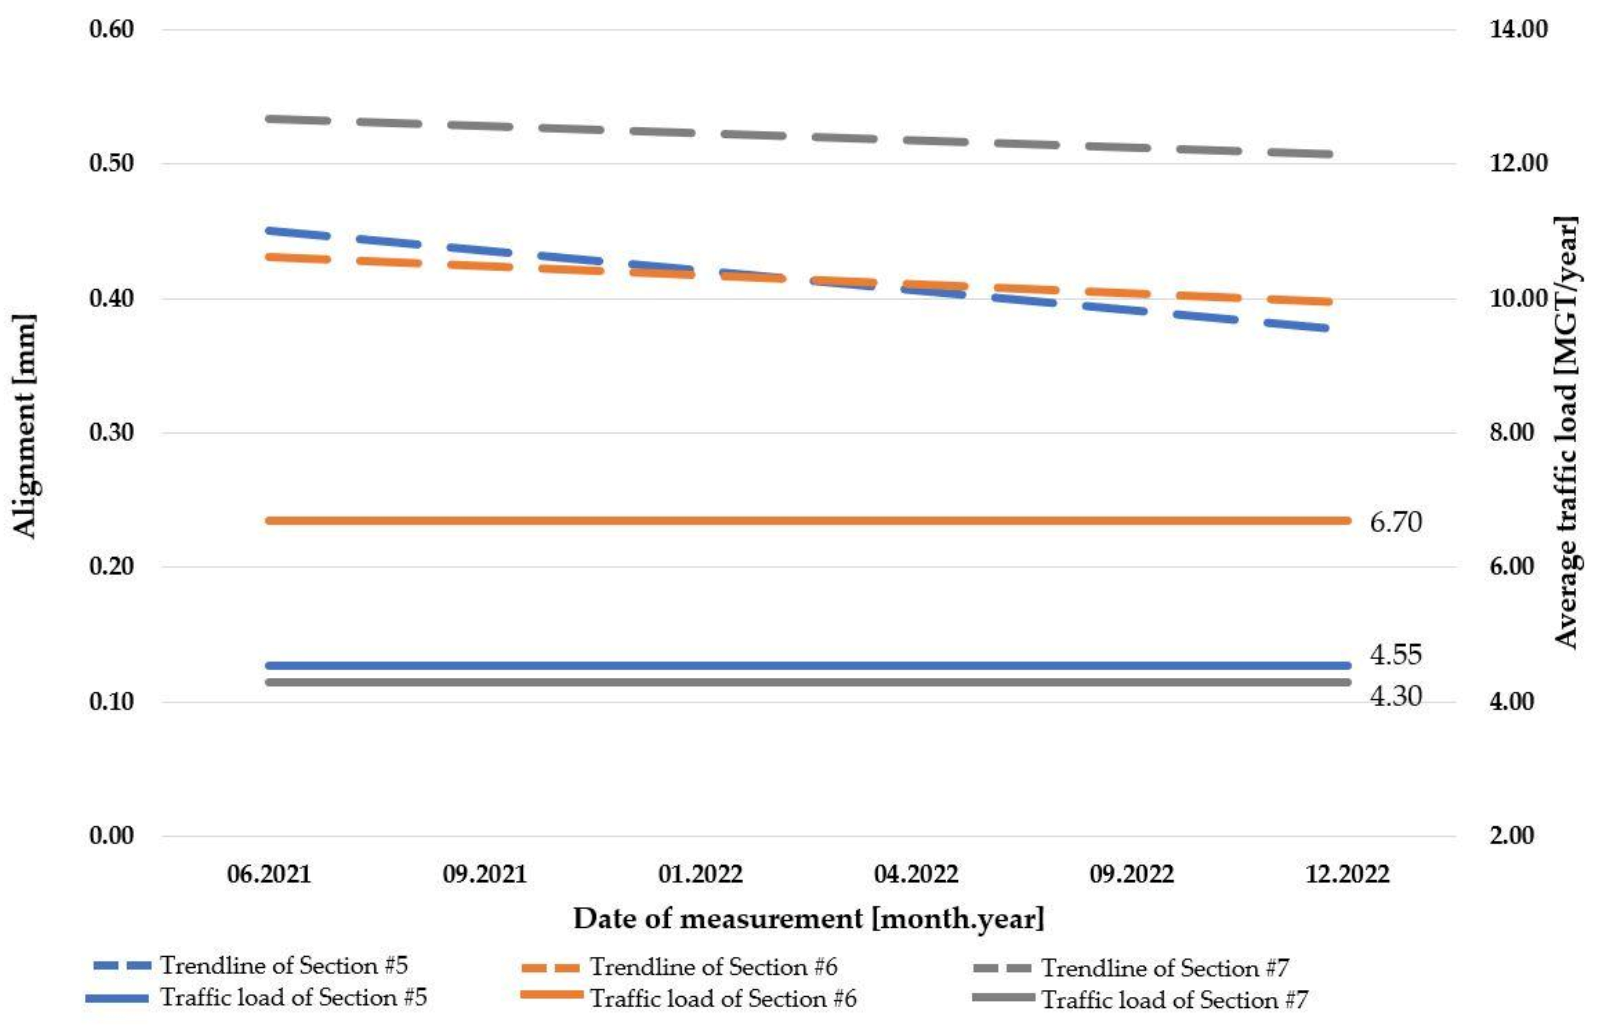
Figure 28 shows the relationship between trendlines of the alignment changes in the case of examined concrete slab track systems and average traffic load values.
Regardless of the traffic load level, in each section, the trendlines are decreasing. Section #5 is the oldest concrete slab track section, and its trendline grade is similar to Section #7, which is the newer section.
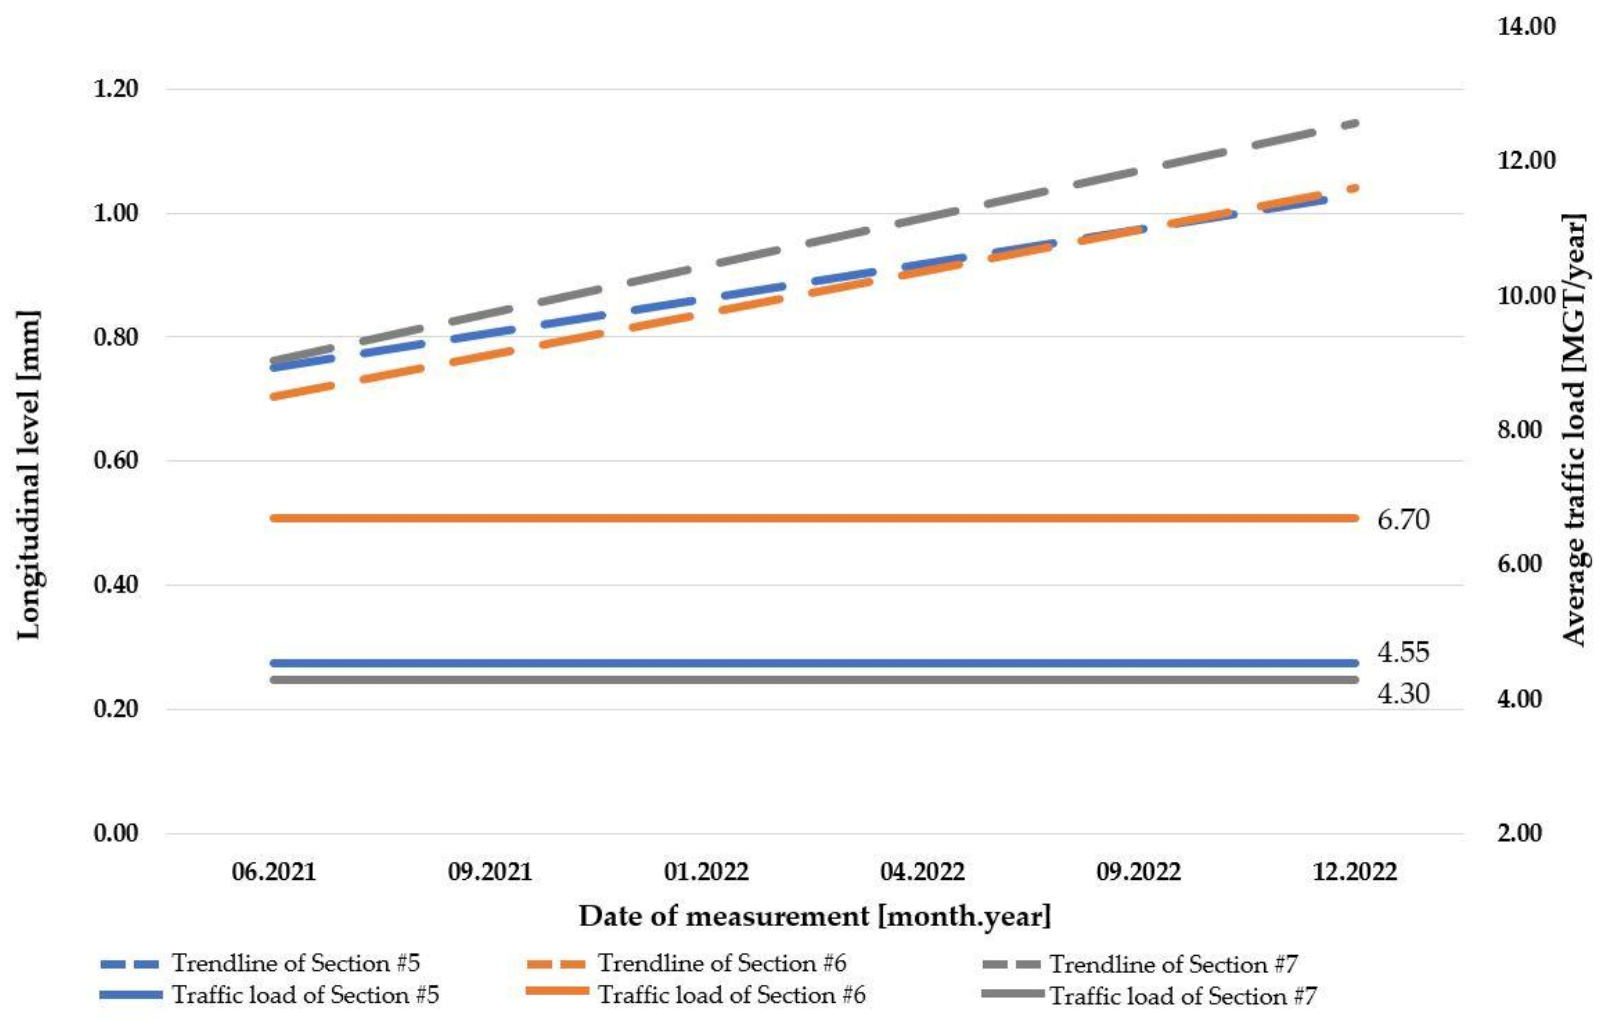
Figure 29 shows the relationship between trendlines of longitudinal level changes in the case of examined concrete slab track systems and average traffic load values.
Similar to the results of the alignment parameter, regardless of the level of traffic load, in the case of each section, the trendlines are increasing. Section #5 is the oldest ballasted track section, and its trendline grade is not as steep as Section #6 or Section #7.
The results of the examination of the longitudinal level parameter are similar to the results of the alignment parameter but the opposite.
Based on the results, the following statements can be determined about the concrete slab tracks:
- the deterioration of track gauge parameter in the case of concrete slab tracks is clearly described as the broadening of track gauge;
- the more significant the load of the examined concrete slab track section, the steeper the grade of the trendline of the track gauge parameter;
- regardless of the level of traffic load, the average value of alignment is decreasing;
- regardless of the level of traffic load, the average value of the longitudinal level is increasing.
5. Conclusions
Nowadays, when the prices of materials and energy are increasing significantly, the individual urban transport infrastructure elements must be properly planned and maintained.
In the case of tramway tracks in Budapest, the capital of Hungary, there are seven superstructure systems, which can be divided into two large groups: “open” or “paved” tracks. “Paved” superstructure systems, when the pavement zone of the track axis and the pavement zone of the permanent way axis, furthermore, the connected part to the public road and verge are paved. All other superstructure systems, such as ballasted track and concrete slab track are “open” superstructures. As described in the Introduction, unfortunately, the geometrical deterioration, lifecycle, and lifecycle cost of the tramway tracks are not accurately known; their selection and application are currently mainly based on experience. Therefore, this procedure is not the most suitable from an economic and technical point of view.
In this article, the authors investigated the geometrical change of seven “open” tramway tracks. The measurements have been made on average every third month since July 2021 with TrackScan 4.01 instrument. Of the measured and recorded characteristics, the examined parameters of tracks were the track gauge, alignment, and longitudinal level.
Based on the results, the following statements can be determined about the “open” tracks:
- regardless of the “open” superstructure system or the level of traffic load, the average value of alignment is decreasing;
- regardless of the “open” superstructure system level of traffic load, the average value of the longitudinal level is increasing;
- when a ballasted track section is older but has a lower traffic load, the narrowing of the track gauge is similar to the case when the ballasted track is newer but has a greater traffic load;
- when a ballasted track section is much older and has a greater traffic load than another ballasted track, the broadening of the track gauge is similar;
- the deterioration of track gauge parameter in the case of concrete slab tracks is clearly described as the broadening of track gauge;
- the more significant the load of the examined concrete slab track section, the steeper the grade of the trendline of the track gauge parameter.
In the future, the authors aim to examine the presented sections and analyze the changes. The most important thing is to investigate whether the measured and evaluated results show or do not show significant deviations from the current trend lines. It is also advisable to evaluate the measurement results of “paved” tracks and observe whether there is a similarity between the behavior of “open” tracks and the behavior of “paved” tracks.
Author Contributions
Conceptualization, V.J. and S.F.; methodology, V.J. and S.F.; software, V.J. and S.F.; validation, V.J. and S.F.; formal analysis, V.J. and S.F.; investigation, V.J., Z.M., A.N., D.K., M.S. and S.F.; resources, V.J., Z.M., A.N. and S.F.; data curation, V.J. and S.F.; writing—original draft preparation, V.J., Z.M., A.N., D.K., M.S. and S.F.; writing—review and editing V.J., Z.M., A.N., D.K., M.S. and S.F.; visualization, V.J. and S.F.; supervision, Z.M., A.N., D.K., M.S. and S.F.; project administration, V.J. and S.F.; funding acquisition, S.F. All authors have read and agreed to the published version of the manuscript.
Funding
This research received no external funding.
Data Availability Statement
Not applicable.
Acknowledgments
This work was technically supported by BKV PLC. This paper was prepared by the research team “SZE-RAIL”.
Conflicts of Interest
The authors declare no conflict of interest.
References
- Nugymanova, G.; Nurgaliyeva, M.; Zhanbirov, Z.; Naumov, V.; Taran, I. Choosing a servicing company’s strategy while interacting with freight owners at the road transport market. Nauk. Visnyk Natsionalnoho Hirnychoho Universytetu 2021, 1, 204–210. [Google Scholar] [CrossRef]
- Ramazan, B.; Mussaliyeva, R.; Bitileuova, Z.; Naumov, V.; Taran, I. Choosing the logistics chain structure for deliveries of bulk loads: Case study of the Republic Kazakhstan. Nauk. Visnyk Natsionalnoho Hirnychoho Universytetu 2021, 3, 142–147. [Google Scholar] [CrossRef]
- Damjanović, M.; Stević, Ž.; Stanimirović, D.; Tanackov, I.; Marinković, D. Impact of the Number of Vehicles on Traffic Safety: Multiphase Modeling. Facta Univ. Ser. Mech. Eng. 2022, 20, 177–197. [Google Scholar] [CrossRef]
- Shekhovtsov, A.; Więckowski, J.; Kizielewicz, B.; Sałabun, W. Towards Reliable Decision-Making in the Green Urban Transport Domain. Facta Univ. Ser. Mech. Eng. 2022, 20, 381–398. [Google Scholar] [CrossRef]
- Đalić, I.; Stević, Ž.; Ateljević, J.; Turskis, Z.; Zavadskas, E.K.; Mardani, A. A Novel Integrated MCDM-SWOT-TOWS Model for the Strategic Decision Analysis in Transportation Company. Facta Univ. Ser. Mech. Eng. 2021, 19, 401–422. [Google Scholar] [CrossRef]
- Németh, A.; Fischer, S. Investigation of the Glued Insulated Rail Joints Applied to Cwr Tracks. Facta Univ. Ser. Mech. Eng. 2021, 19, 681–704. [Google Scholar] [CrossRef]
- Fischer, S.; Kocsis Szürke, S. Detection Process of Energy Loss in Electric Railway Vehicles. Facta Univ. Ser. Mech. Eng. 2023, 11368. [Google Scholar] [CrossRef]
- Fischer, S.; Harangozó, D.; Németh, D.; Kocsis, B.; Sysyn, M.; Kurhan, D.; Brautigam, A. Investigation of Heat-Affected Zones of Thermite Rail Weldings. Facta Univ. Ser. Mech. Eng. 2023. [Google Scholar] [CrossRef]
- Eller, B.; Szalai, S.; Sysyn, M.; Harrach, D.; Liu, J.; Fischer, S. Inner Shear Resistance Increasing Effect of Concrete Canvas in Ballasted Railway Tracks. Nauk. Visnyk Natsionalnoho Hirnychoho Universytetu 2023, submitted.
- Jóvér, V.; Sysyn, M.; Liu, J.; Fischer, S. Geometry Variation of Ballasted Railway Tracks Due to Weather Conditions. Nauk. Visnyk Natsionalnoho Hirnychoho Universytetu 2023, 2023, 74–79. [Google Scholar] [CrossRef]
- Czinder, B.; Török, Á. Strength and abrasive properties of andesite: Relationships between strength parameters measured on cylindrical test specimens and micro-Deval values—A tool for durability assessment. Bull. Eng. Geol. Environ. 2021, 80, 8871–8889. [Google Scholar] [CrossRef]
- Czinder, B.; Vásárhelyi, B.; Török, Á. Long-term abrasion of rocks assessed by micro-Deval tests and estimation of the abrasion process of rock types based on strength parameters. Eng. Geol. 2021, 282, 105996. [Google Scholar] [CrossRef]
- Kou, L.; Sysyn, M.; Liu, J. Influence of Crossing Wear on Rolling Contact Fatigue Damage of Frog Rail. Facta Univ. Ser. Mech. Eng. 2023. [Google Scholar] [CrossRef]
- Fischer, S. Investigation of effect of water content on railway granular supplementary layers. Nauk. Visnyk Natsionalnoho Hirnychoho Universytetu 2021, 64–68. [Google Scholar] [CrossRef]
- Kim, T.-H.; Ramos, C.; Mohammed, S. Smart City and IoT. Future Gener. Comput. Syst. 2017, 76, 159–162. [Google Scholar] [CrossRef]
- Harrison, C.; Donnelly, I.A. A Theory of Smart Cities. In Proceedings of the 55th Annual Meeting of the International Society for the Systems Sciences 2011, Hull, UK, 17–22 July 2011; pp. 521–535. [Google Scholar]
- Szalai, S.; Dogossy, G. Speckle pattern optimization for DIC technologies. Acta Tech. Jaurinensis 2021, 14, 228–243. [Google Scholar] [CrossRef]
- Szalai, S.; Csótár, H.; Kurhan, D.; Németh, A.; Sysyn, M.; Fischer, S. Testing of Lubricants for DIC Tests to Measure the Forming Limit Diagrams of Aluminum Thin Sheet Materials. Infrastructures 2023, 8, 32. [Google Scholar] [CrossRef]
- Szalai, S.; Fehér, V.; Kurhan, D.; Németh, A.; Sysyn, M.; Fischer, S. Optimization of Surface Cleaning and Painting Methods for DIC Measurements on Automotive and Railway Aluminum Materials. Infrastructures 2023, 8, 27. [Google Scholar] [CrossRef]
- Szalai, S.; Herold, B.; Kurhan, D.; Németh, A.; Sysyn, M.; Fischer, S. Optimization of 3D Printed Rapid Prototype Deep Drawing Tools for Automotive and Railway Sheet Material Testing. Infrastructures 2023, submitted.
- Szalai, S.; Szívós, B.F.; Kurhan, D.; Németh, A.; Sysyn, M.; Fischer, S. Optimization of Surface Preparation and Painting Processes for Railway and Automotive Steel Sheets. Infrastructures 2023, 8, 28. [Google Scholar] [CrossRef]
- Szürke, S.K.; Dineva, A.; Szalai, S.; Lakatos, I. Determination of Critical Deformation Regions of a Lithium Polymer Battery by DIC Measurement and WOWA Filter. Acta Polytech. Hung. 2022, 19, 113–134. [Google Scholar] [CrossRef]
- Szalai, S.; Szürke, S.K.; Harangozó, D.; Fischer, S. Investigation of deformations of a lithium polymer cell using the Digital Image Correlation Method (DICM). Rep. Mech. Eng. 2022, 3, 206–224. [Google Scholar] [CrossRef]
- Fischer, S.; Vass, A.; Szalai, S.; Harangozó, D.; Németh, A.; Major, Z.; Kocsis Szürke, S. Application Possibilities of Recuperated Energy of Modern Railway Hauling Vehicles. In Proceedings of the RAILCON ’22, Nis, Serbia, 13–14 October 2022; pp. VII–X. [Google Scholar]
- Polák, J.; Lakatos, I. Efficiency Optimization of Electric Permanent Magnet Motor Driven Vehicle. Mach. Des. 2015, 7, 1259–1821. [Google Scholar]
- Pup, D.; Szakallas, G.; Polák, J. Research of vehicle parameter and sensor systems necessary to control autonomous vehicles. In Proceedings of the 2018 14th IEEE/ASME International Conference on Mechatronic and Embedded Systems and Applications, MESA, Oulu, Finland, 2–4 July 2018; p. 8449146. [Google Scholar] [CrossRef]
- Czére, B. A Vasút Története; Corvina Kiadó: Budapest, Hungary, 1989. [Google Scholar]
- Fischer, S. Traction Energy Consumption of Electric Locomotives and Electric Multiple Units at Speed Restrictions. Acta Tech. Jaurinensis 2015, 8, 240–256. [Google Scholar] [CrossRef] [Green Version]
- Statista Inland Freight Mileage in EU-28 in 2018, by Mode. Available online: https://0-www-statista-com.brum.beds.ac.uk/statistics/280517/inland-freight-mileage-in-eu-27-by-mode/ (accessed on 8 February 2023).
- Statista Passenger Mileage in EU-28 in 2018, by Mode. Available online: https://0-www-statista-com.brum.beds.ac.uk/statistics/280519/passenger-mileage-in-eu-27-by-mode/ (accessed on 8 February 2023).
- Kenworthy, J.R.; Svensson, H. Exploring the Energy Saving Potential in Private, Public and Non-Motorized Transport for Ten Swedish Cities. Sustainability 2022, 14, 954. [Google Scholar] [CrossRef]
- Godfrid, J.; Radnic, P.; Vaisman, A.; Zimányi, E. Analyzing public transport in the city of Buenos Aires with MobilityDB. Public Transp. 2022, 14, 287–321. [Google Scholar] [CrossRef]
- Shao, J.; Wang, L. Can new-type urbanization improve the green total factor energy efficiency? Evidence from China. Energy 2023, 262, 125499. [Google Scholar] [CrossRef]
- Jóvér, V.; Fischer, S. Közúti Vasúti Felépítményrendszerek Vágánygeometriai És Járműdinamikai Vizsgálata. In Proceedings of the City Rail 2022, Balatonfenyves, Hungary, 7–8 September 2022; pp. 121–135. [Google Scholar]
- Lakusic, S.; Kecur, R. The Impact of the Geometry of Rail Welds on Noise Level in Urban Environments. In Proceedings of the Annual Conference of the Australian Acoustical Society 2005, Acoustics 2005: Acoustics in a Changing Environment, Busselton, Australia, 9–11 November 2005; pp. 247–251. [Google Scholar]
- Haladin, I.; Bogut, M.; Lakušić, S. Analysis of Tram Traffic-Induced Vibration Influence on Earthquake Damaged Buildings. Buildings 2021, 11, 590. [Google Scholar] [CrossRef]
- Haladin, I.; Vranešić, K.; Ivančev, M.; Lakušić, S. Influence of Tram Vibrations on Earthquake Damaged Buildings. In Proceedings of the 1st Croatian Conference on Earthquake Engineering 1CroCEE, Zabreg, Croatia, 22–24 March 2021; pp. 1583–1593. [Google Scholar]
- Guerrieri, M.; Parla, G. Smart Tramway Systems for Smart Cities: A Deep Learning Application in ADAS Systems. Int. J. Intell. Transp. Syst. Res. 2022, 20, 745–758. [Google Scholar] [CrossRef]
- Naugain, M.; Singh, A.K. Planning for Pedestrian-Friendly Cities. In Lecture Notes in Civil Engineering: Sustainable Infrastructure Development; Springer: Singapore, 2022; Volume 199, pp. 44–63. [Google Scholar]
- Zakharov, D.; Fadyushin, A. The Efficiency of some Activities for the Development of Urban Infrastructure for Public Transport, Cyclists and Pedestrians. Int. J. Transp. Dev. Integr. 2021, 5, 136–149. [Google Scholar] [CrossRef]
- Campisi, T.; Tesoriere, G.; Skoufas, A.; Zeglis, D.; Andronis, C.; Basbas, S. Perceived Pedestrian Level of Service: The Case of Thessaloniki, Greece. In Proceedings of the Transportation Research Procedia, Brescia, Italy, 9–10 September 2021; Volume 60, pp. 124–131. [Google Scholar]
- Ferrer-Ortiz, C.; Marquet, O.; Mojica, L.; Vich, G. Barcelona under the 15-Minute City Lens: Mapping the Accessibility and Proximity Potential Based on Pedestrian Travel Times. Smart Cities 2022, 5, 146–161. [Google Scholar] [CrossRef]
- Loraamm, R.; Mustain, M. Social Deprivation and the Performance of Pedestrian Infrastructure for School Children: Identifying Need in the Putnam City School District, Oklahoma City, Oklahoma. Prof. Geogr. 2022, 74, 231–245. [Google Scholar] [CrossRef]
- Mako, E.; Szakonyi, P. Evaluation of Human Behaviour at Pedestrian Crossings. In Proceedings of the Transportation Research Procedia, Shanghai, China, 10–15 July 2016; Volume 14, pp. 2121–2128. [Google Scholar]
- Kizawi, A.; Borsos, A. Literature review on the conflict analysis of vehicle-pedestrian interactions. Acta Tech. Jaurinensis 2021, 14, 599–611. [Google Scholar] [CrossRef]
- Benatia, D. Ring the alarm! Electricity markets, renewables, and the pandemic. Energy Econ. 2022, 106, 105755. [Google Scholar] [CrossRef]
- Lepskiy, M.; Lepska, N. The War in Ukraine and its Challenge to NATO: Peacekeeping to Peace Engineering. Am. Behav. Sci. 2023, 67, 402–425. [Google Scholar] [CrossRef]
- To, K.K.-W.; Tsang, O.T.-Y.; Leung, W.-S.; Tam, A.R.; Wu, T.-C.; Lung, D.C.; Yip, C.C.-Y.; Cai, J.-P.; Chan, J.M.-C.; Chik, T.S.-H.; et al. Temporal profiles of viral load in posterior oropharyngeal saliva samples and serum antibody responses during infection by SARS-CoV-2: An observational cohort study. Lancet Infect. Dis. 2020, 20, 565–574. [Google Scholar] [CrossRef] [Green Version]
- Daniel, K.; Hirshleifer, D.; Subrahmanyam, A. Investor Psychology and Security Market Under- and Overreactions. J. Finance 1998, 53, 1839–1885. [Google Scholar] [CrossRef] [Green Version]
- Kuchak, A.; Marinkovic, D.; Zehn, M. Finite Element Model Updating–Case Study of a Rail Damper. Struct. Eng. Mech. 2020, 73, 27–35. [Google Scholar] [CrossRef]
- Kuchak, A.J.T.; Marinkovic, D.; Zehn, M. Parametric Investigation of a Rail Damper Design Based on a Lab-Scaled Model. J. Vib. Eng. Technol. 2021, 9, 51–60. [Google Scholar] [CrossRef]
- Richter, W.D.; Uebel, L.; Kristen, G. Combino Plus Used for Two Years in the Budapest Tram Network. eb Elektr. Bahnen 2008, 106, 439–447. [Google Scholar]
- Takács, P. Theoretical optimization of tram availibility for daily schedules (role of public transport and trams in Budapest). Stud. Mundi Econ. 2020, 7, 86–96. [Google Scholar] [CrossRef]
- Ahac, M.; Lakušić, S. Tram Track Maintenance-Planning by Gauge Degradation Modelling. Transport 2015, 30, 430–436. [Google Scholar] [CrossRef] [Green Version]
- Kurhan, D.; Fischer, S. Modeling of the Dynamic Rail Deflection Using Elastic Wave Propagation. J. Appl. Comput. Mech. 2022, 8, 379–387. [Google Scholar] [CrossRef]
- Szalai, S.; Eller, B.; Juhász, E.; Movahedi, M.R.; Németh, A.; Harrach, D.; Baranyai, G.; Fischer, S. Investigation of deformations of ballasted railway track during collapse using the Digital Image Correlation Method (DICM). Rep. Mech. Eng. 2022, 3, 258–282. [Google Scholar] [CrossRef]
- Sysyn, M.; Nabochenko, O.; Kovalchuk, V.; Przybyłowicz, M.; Fischer, S. Investigation of interlocking effect of crushed stone ballast during dynamic loading. Rep. Mech. Eng. 2021, 2, 65–76. [Google Scholar] [CrossRef]
- Falamarzi, A.; Moridpour, S.; Nazem, M. Development of a tram track degradation prediction model based on the acceleration data. Struct. Infrastruct. Eng. 2019, 15, 1308–1318. [Google Scholar] [CrossRef]
- Ižvolt, L.; Šestáková, J.; Šmalo, M. Tendencies in the Development of Operational Quality of Ballasted and Ballastless Track Superstructure and Transition Areas. IOP Conf. Ser. Mater. Sci. Eng. 2017, 236, 012038. [Google Scholar] [CrossRef] [Green Version]
- Zehmed, K.; Jawab, F. The performance of tramway service from the users’ viewpoint: A comparative analysis between two Moroccan cities. Arch. Transp. 2021, 60, 7–21. [Google Scholar] [CrossRef]
- Gáspár, L.; Horvát, F.; Lublóy, L. Közlekedési Létesítmények Élettartama; Universitas-Győr Nonprofit Kft.: Győr, Hungary, 2011; ISBN 9789639819733. [Google Scholar]
- Gáspár, L. Lifetime Engineering Principles and Durable Roads. Int. J. Pavement Eng. Asph. Technol. 2016, 17, 58–72. [Google Scholar]
- Gáspár, L.; Bencze, Z. Long-Life Pavements—European and American Perspectives. N. Build. Mater. Constr. World 2018, 24, 122–135. [Google Scholar]
- Falamarzi, A.; Moridpour, S.; Nazem, M.; Hesami, R. Integration of Genetic Algorithm and Support Vector Machine to Predict Rail Track Degradation. In Proceedings of the MATEC Web of Conferences, Bangkok, Thailand, 3–5 August 2018; Volume 259, p. 02007. [Google Scholar]
- Falamarzi, A.; Moridpour, S.; Nazem, M.; Cheraghi, S. Development of Random Forests Regression Model to Predict Track Degradation Index: Melbourne Case Study. In Proceedings of the ATRF 2018—Australasian Transport Research Forum 2018, Proceedings, Darwin, Australia, 30 October–1 November 2018; pp. 1–12. [Google Scholar]
- Macura, D.; Laketić, M.; Pamučar, D.; Marinković, D. Risk Analysis Model with Interval Type-2 Fuzzy FMEA—Case Study of Railway Infrastructure Projects in the Republic of Serbia. Acta Polytech. Hung. 2022, 19, 103–118. [Google Scholar] [CrossRef]
- Marschnig, S.; Veit, P. Making a Case for Under-Sleeper Pads. Int. Railw. J. 2011, 51, 27–29. [Google Scholar]
- Veit, P.; Marschnig, S. Towards a More Sustainable Track. Railw. Gaz. Int. 2011, 167, 42–44. [Google Scholar]
- Veit, P. Qualität Im Gleis—Luxus Oder Notwendigkeit? Der Eisenbahningenieur 2006, 57, 32–37. [Google Scholar]
- TU Graz Strategie Fahrweg, Research Report. Available online: https://online.tugraz.at/tug_online/fdb_detail.ansicht?cvfanr=F12083&cvorgnr=37&sprache=1 (accessed on 8 February 2023).
- BKV Ltd. Technical Instructions for the Construction and Maintenance of Tramway Tracks, P.1.; BKV Ltd.: Budapest, Hungary, 2019. [Google Scholar]
- BKV Ltd. Technical Instructions for the Construction and Maintenance of Subway Tracks, P.1.; BKV Ltd.: Budapest, Hungary, 2008. [Google Scholar]
- Jóvér, V.; Gáspár, L.; Fischer, S. Investigation of Tramway Line No. 1, in Budapest, Based on Dynamic Measurements. Acta Polytech. Hung. 2022, 19, 65–76. [Google Scholar] [CrossRef]
- Metalelektro Railway Diagnostic Track Geometry Measurement. Available online: https://www.metalelektro.eu/track-geometry (accessed on 15 January 2023).
- Jover, V.; Fischer, S. Statistical Analysis of Track Geometry Parameters on Tramway Line No. 1 in Budapest. Balt. J. Road Bridg. Eng. 2022, 17, 75–106. [Google Scholar] [CrossRef]
Figure 1.
Photo of Section #1 (own photo).

Figure 2.
Photo of Section #2 (own photo).

Figure 3.
Photo of Section #3 (own photo).

Figure 4.
Photo of Section #4 (own photo).

Figure 5.
Photo of Section #5 (own photo).

Figure 6.
METRO III. type rail fastening (on the basis of [72]).
Figure 6.
METRO III. type rail fastening (on the basis of [72]).

Figure 7.
Photo of Section #6 (own photo).

Figure 8.
Photo of Section #7 (own photo).

Figure 9.
TrackScan 4.01 instrument (own photo).

Figure 10.
The change of average values of the track gauge in Section #1.

Figure 11.
The change of average values of longitudinal level and alignment in Section #1.

Figure 12.
The change of average values of the track gauge in Section #2.

Figure 13.
The change of average values of longitudinal level and alignment in Section #2.

Figure 14.
The change of average values of the track gauge in Section #3.

Figure 15.
The change of average values of longitudinal level and alignment in Section #3.

Figure 16.
The change of average values of the track gauge in Section #4.

Figure 17.
The change of average values of longitudinal level and alignment in Section #4.

Figure 18.
The change of average values of the track gauge in Section #5.

Figure 19.
The change of average values of longitudinal level and alignment in Section #5.

Figure 20.
The change of average values of the track gauge in Section #6.

Figure 21.
The change of average values of longitudinal level and alignment in Section #6.

Figure 22.
The change of average values of the track gauge in Section #7.

Figure 23.
The change of average values of longitudinal level and alignment in Section #7.

Figure 24.
The relationship between track gauge and traffic load in ballasted track systems.

Figure 25.
The relationship between alignment and traffic load in ballasted track systems.

Figure 26.
The relationship between longitudinal level and traffic load in ballasted track systems.

Figure 27.
The relationship between track gauge and traffic load in concrete slab track systems.

Figure 28.
The relationship between alignment and traffic load in concrete slab track systems.

Figure 29.
The relationship between longitudinal level and traffic load in concrete slab track systems.
Figure 29.
The relationship between longitudinal level and traffic load in concrete slab track systems.


Table 1.
Traffic load classes in the case of Budapest’s tramway lines [71].
Table 1.
Traffic load classes in the case of Budapest’s tramway lines [71].
| Traffic Load Class | MGT 1/Year/Direction |
|---|---|
| I./A. extremely heavy loaded line | >7.5 |
| I./B. heavily loaded line | 5.0 … 7.5 |
| II. medium loaded line | 2.5 … 5.0 |
| III. low loaded line | <2.5 |
1 The abbreviation MGT means million gross tons, i.e., the annual through-rolled tonnages.
Table 2.
Characteristics of examined reference sections.
| ID. of Reference Sections | Type of Superstructure System | Average Traffic Load [MGT/Year] | Age [Year] |
|---|---|---|---|
| Section #1 | Ballasted track | 1.92 | 38 |
| Section #2 | Ballasted track | 1.24 | 36 |
| Section #3 | Ballasted track | 3.91 | 21 |
| Section #4 | Ballasted track | 6.49 | 5 |
| Section #5 | Concrete slab track | 4.55 | 37 |
| Section #6 | Concrete slab track | 6.70 | 22 |
| Section #7 | Concrete slab track | 4.30 | 13 |
Disclaimer/Publisher’s Note: The statements, opinions and data contained in all publications are solely those of the individual author(s) and contributor(s) and not of MDPI and/or the editor(s). MDPI and/or the editor(s) disclaim responsibility for any injury to people or property resulting from any ideas, methods, instructions or products referred to in the content. |
© 2023 by the authors. Licensee MDPI, Basel, Switzerland. This article is an open access article distributed under the terms and conditions of the Creative Commons Attribution (CC BY) license (https://creativecommons.org/licenses/by/4.0/).
Share and Cite
MDPI and ACS Style
Jóvér, V.; Major, Z.; Németh, A.; Kurhan, D.; Sysyn, M.; Fischer, S. Investigation of “Open” Superstructure Tramway Tracks in Budapest. Infrastructures 2023, 8, 33. https://0-doi-org.brum.beds.ac.uk/10.3390/infrastructures8020033
AMA Style
Jóvér V, Major Z, Németh A, Kurhan D, Sysyn M, Fischer S. Investigation of “Open” Superstructure Tramway Tracks in Budapest. Infrastructures. 2023; 8(2):33. https://0-doi-org.brum.beds.ac.uk/10.3390/infrastructures8020033
Chicago/Turabian StyleJóvér, Vivien, Zoltán Major, Attila Németh, Dmytro Kurhan, Mykola Sysyn, and Szabolcs Fischer. 2023. "Investigation of “Open” Superstructure Tramway Tracks in Budapest" Infrastructures 8, no. 2: 33. https://0-doi-org.brum.beds.ac.uk/10.3390/infrastructures8020033