Article

Deformation Mechanisms of Twinning-Induced Plasticity Steel under Shock-Load: Investigated by Synchrotron X-ray Diffraction

1
School of Materials, University of Manchester, Oxford Road, Manchester M13 9PL, UK
2
High Temperature Materials, Wood plc, Birchwood Park, Warrington, Cheshire WA3 6GA, UK
3
Guangdong Technion—Israel Institute of Technology, Shantou 515063, China
4
Technion—Israel Institute of Technology, Haifa 32000, Israel
*
Author to whom correspondence should be addressed.
Quantum Beam Sci. 2019, 3(3), 15; https://0-doi-org.brum.beds.ac.uk/10.3390/qubs3030015
Submission received: 6 May 2018 / Revised: 30 June 2018 / Accepted: 6 June 2019 / Published: 6 July 2019
(This article belongs to the Special Issue Strain, Stress and Texture Analysis with Quantum Beams)

Abstract

:
As an ideal candidate material for automobiles, twinning-induced plasticity (TWIP) steels possess excellent formability, high strength and high energy absorption ability during collision. This is attributed to its deformation mechanism of mechanical twinning, resulting in a high work hardening rate. In the current study, deformation mechanisms of low-stacking fault energy TWIP steel, under different strain rates between 0.01/s to 1581/s, were investigated by high-energy X-ray diffraction. After compression, grains with {110}||compression direction became favourable. Higher intensity was observed near brass and A components in the selected orientation distribution function (ODF) section (φ2 = 45°) for all the compressed specimens. The activity of twinning was found to be the highest in the specimens that had been compressed with medium–high strain rates (e.g., 100/s and 10/s), while the texture component related to slip had stronger intensity in the specimen deformed with a quasi-static strain rate (0.01/s).

1. Introduction

For more than a decade, medium and high manganese steels have been the focus of innovative steel development due to its light weight, high strength, outstanding formability and energy absorption ability. It has been widely accepted that, due to its low-stacking fault energy, twinning is an effective means of deformation in high manganese austenitic steel, called twinning-induced plasticity (TWIP) steel. This has been supported by transmission electron microscopy and electron backscatter diffraction (EBSD), wherein it has been demonstrated that the volume fraction of twins increases concomitantly with plastic deformation [1]. Specifically, one variant of the {111} <112> twin system is activated within grains at the early stages of plastic deformation, followed by the nucleation of twins that are different variants of the {111} <112> twin system between the boundaries of the first set of twins, leading to a ladder-like structure [2]. Recent work by Barbier et al. [3] employed texture component analysis to explore the fraction of dislocation slip and deformation twinning during plastic deformation. However, the combination of various conventional surface microstructure analysis methods are limited in their provision of bulk information, particularly in terms of the evolving dislocation density, bulk texture, local strain, stacking faults and deformation mechanisms that operate in the total volume of a tested material.
When low-stacking fault materials are deformed, the possible deformation mechanisms (e.g., dislocation slip, mechanical twinning and phase transformation) closely interact and compete with one another [4,5,6]. The potential of each mechanism is determined by the stacking fault energy (SFE), which is controlled by the chemical composition of the material [7]. The twinning effect is activated at a low SFE (between 12 and 35 mJ /m2) [8], which is inherent in these materials. As deformation proceeds, twins nucleate and grow in the core of large grains and move to the next strong obstacle, such as grain boundaries or twin boundaries. Subsequently, twins become thicker, more closely spaced and longer as the applied stress increases, and it is believed that dislocation movement interacts with—and is hindered and obstructed by—mechanical twinning [6]. Consequently, higher stress is needed for new twins to form [9], which generates a rise in the work hardening rate, thereby enhancing the strength and increasing ductility [2].
Despite the well-received theory of twinning-induced plasticity in low-stacking fault materials, particularly during tensile deformation, the activity of twinning is actually suppressed in compression. As one of the main potential applications for TWIP steel is within the automobile industry, automobile manufacturers require not only a material that can maintain its mechanical properties under quasi-static loading conditions, but also under dynamic loading conditions. The question as to how TWIP steel responds to dynamic loading during a collision has become a key issue in design and material optimization. In addition to microstructure features, such as grain size, defect density and phase morphology, which determine the mechanical and physical properties of most metallic materials, grain orientation distribution (texture) is also an important consideration and may well have a definitive influence on the application of TWIP steels in the automotive industry.
Texture is a collective term for non-uniform distributions of crystallographic orientations in polycrystalline aggregates. In metallic materials processing, texture ‘components’ and ‘fibres’ are often used to represent the simplified orientation distribution. Texture components are a superposition of a small number of single crystals, with some spread (which may be quantified by Gaussian processes). Others can be idealized as fibres in orientation space, in which a single angle can be used to specify an orientation within the fibre. Through Euler angles, a certain crystallographic plane, hkl, and direction, uvw, can be transformed to align with sample coordinates. For face-centred-cubic (fcc) materials, the brass component has the {110} plane parallel to the deformation plane (N) and the <112> direction parallel to the deformation direction (L), which is noted as {110} <112>. Other typical texture components, like Goss ({110} <100>), cube ({001} <100>), and copper ({112} <111>), are usually used to demonstrate the texture types after plastic deformation. In addition, these typical texture components provide information of deformation mechanisms for materials that contain different stacking fault energy, alloy elements and/or deform at different temperature and strain rates. The influence of strain rate on texture has been extensively investigated by other researchers [10,11]. It is well accepted that at low strain rate or at the early stage of plastic deformation, initial texture is significantly reduced, while at higher strain rates plastic deformation texture components develop and the grains elongate along the loading direction. Moreover, grain boundary sliding and shear bands are accepted as deformation mechanisms during high strain rate deformation [12]. For microstructural evolution during high strain rate deformation, three stages for obtaining an ultra-fine grain size structure may be described: (i) Elongated cells and subgrains form, generating an increase in misorientations between neighbouring grains, and thus breakup of elongated grains into smaller units occurs; (ii) these subgrains are then rotated by grain boundary rotation; and, finally, (iii) an equiaxed structure forms. Although these previous studies have supplied information of materials’ microstructure, including texture evolution during high strain rate deformation, only a few studies have focused on fcc-structured materials with low-stacking fault energy, which may introduce martensitic phase transformation and mechanical twinning under extreme loading conditions.
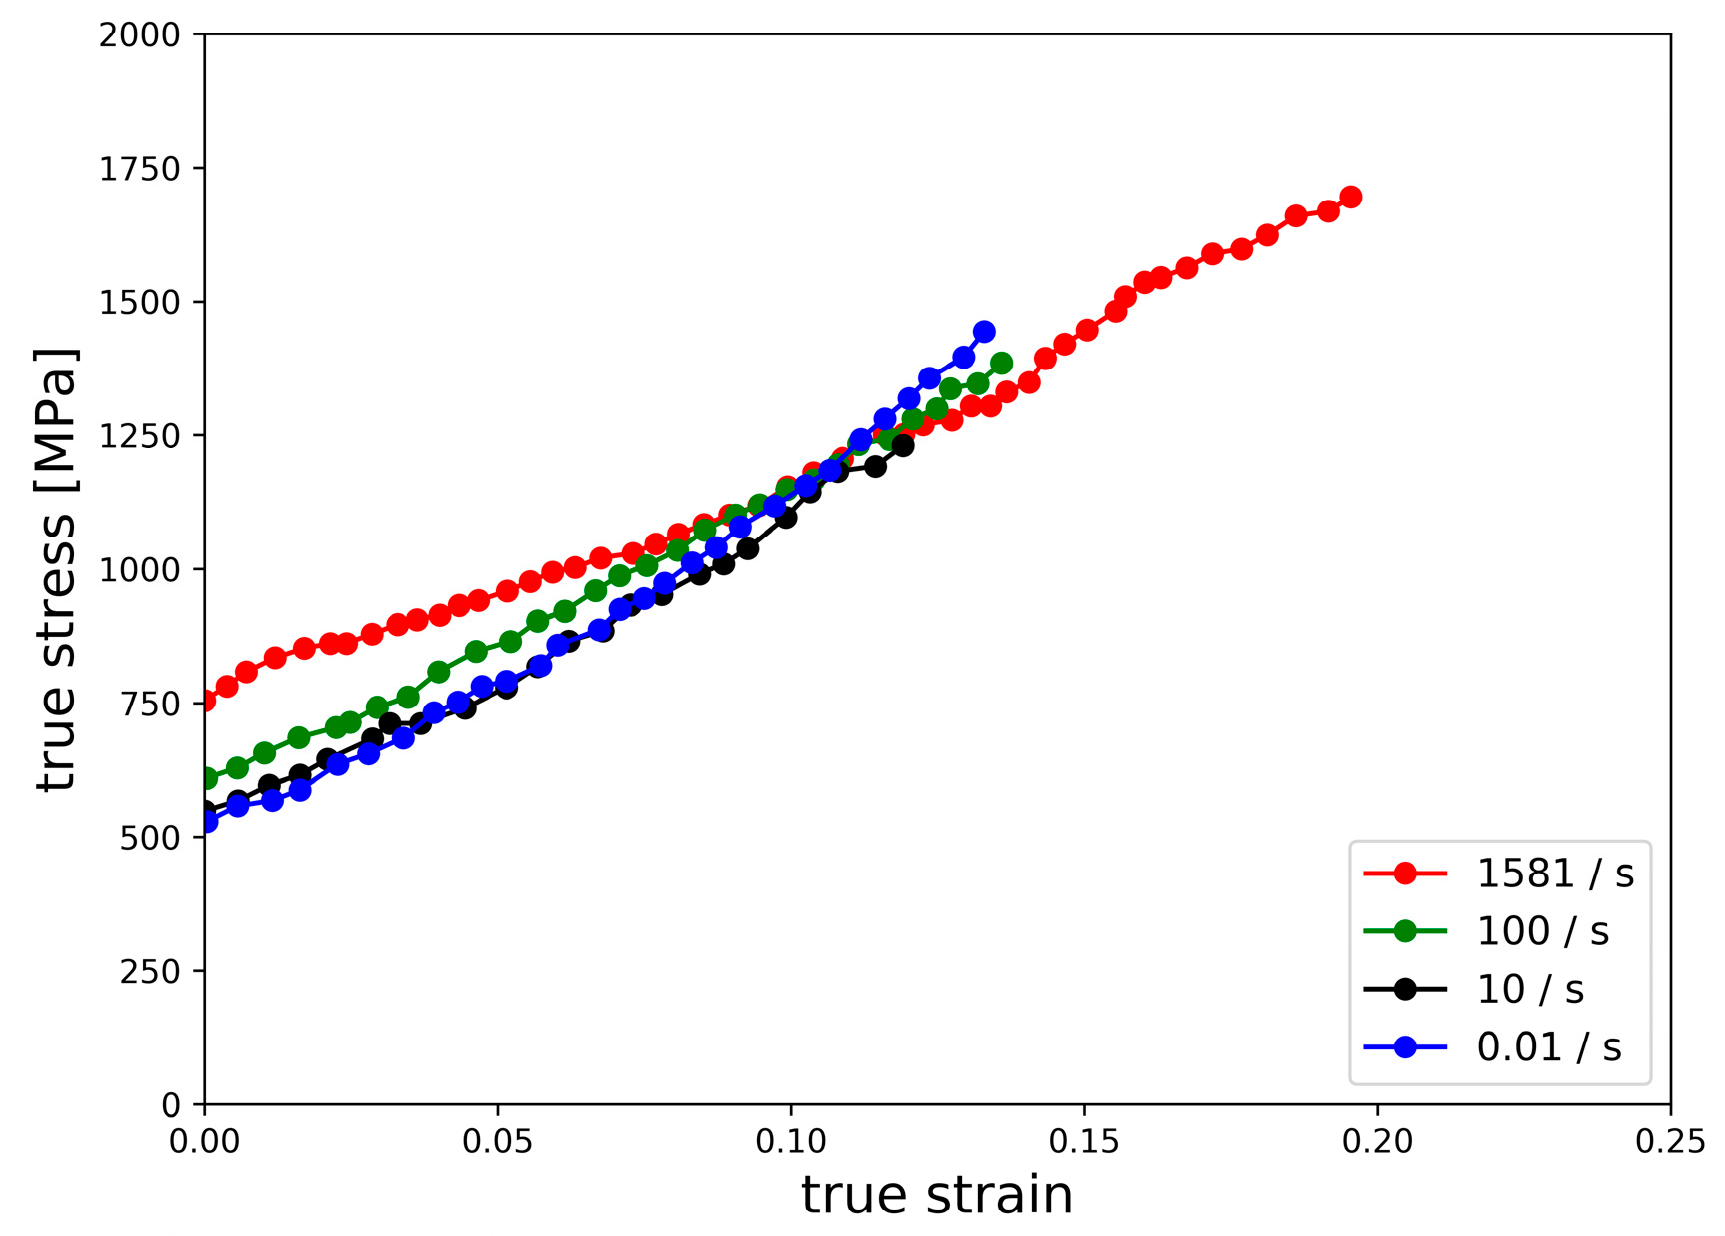
In a similar manner to strain-induced martensitic transformation (SIMT), the formation of twinning is also diffusionless. It is speculated that twinning activity should be irrelevant to deformation rate at room temperature. However, with a higher strain rate, improved ductility may be observed in comparison to the same materials deformed under a lower straining rate. In this context, the deformation mechanisms of TWIP steel (Fe-18Mn-0.6C-1.5Al), compressed with various strain rates ranging from 0.01/s to 1581/s, were investigated using microstructural analysis and texture component analysis.

2. Materials and Methods

Cylindrical specimens 5 mm in diameter and 2.5 mm in thickness were extracted from a rolled plate for compression tests, further texture measurement and microstructural analyses. Four specimens were compressed at different strain rates. One specimen was compressed using a split-Hopkinson pressure bar (SHPB) test at a strain rate of 1581/s to a total strain of ~20%; three other specimens were compressed using a Gleeble 3500 thermo-mechanical simulator at strain rates of 0.01/s, 10/s and 100/s to a total strain of ~15%. All specimens were compressed along the normal direction (ND) of the steel sheet via both SHPB and Gleeble 3500 instruments.
The texture measurements were conducted by high-energy X-ray diffraction [
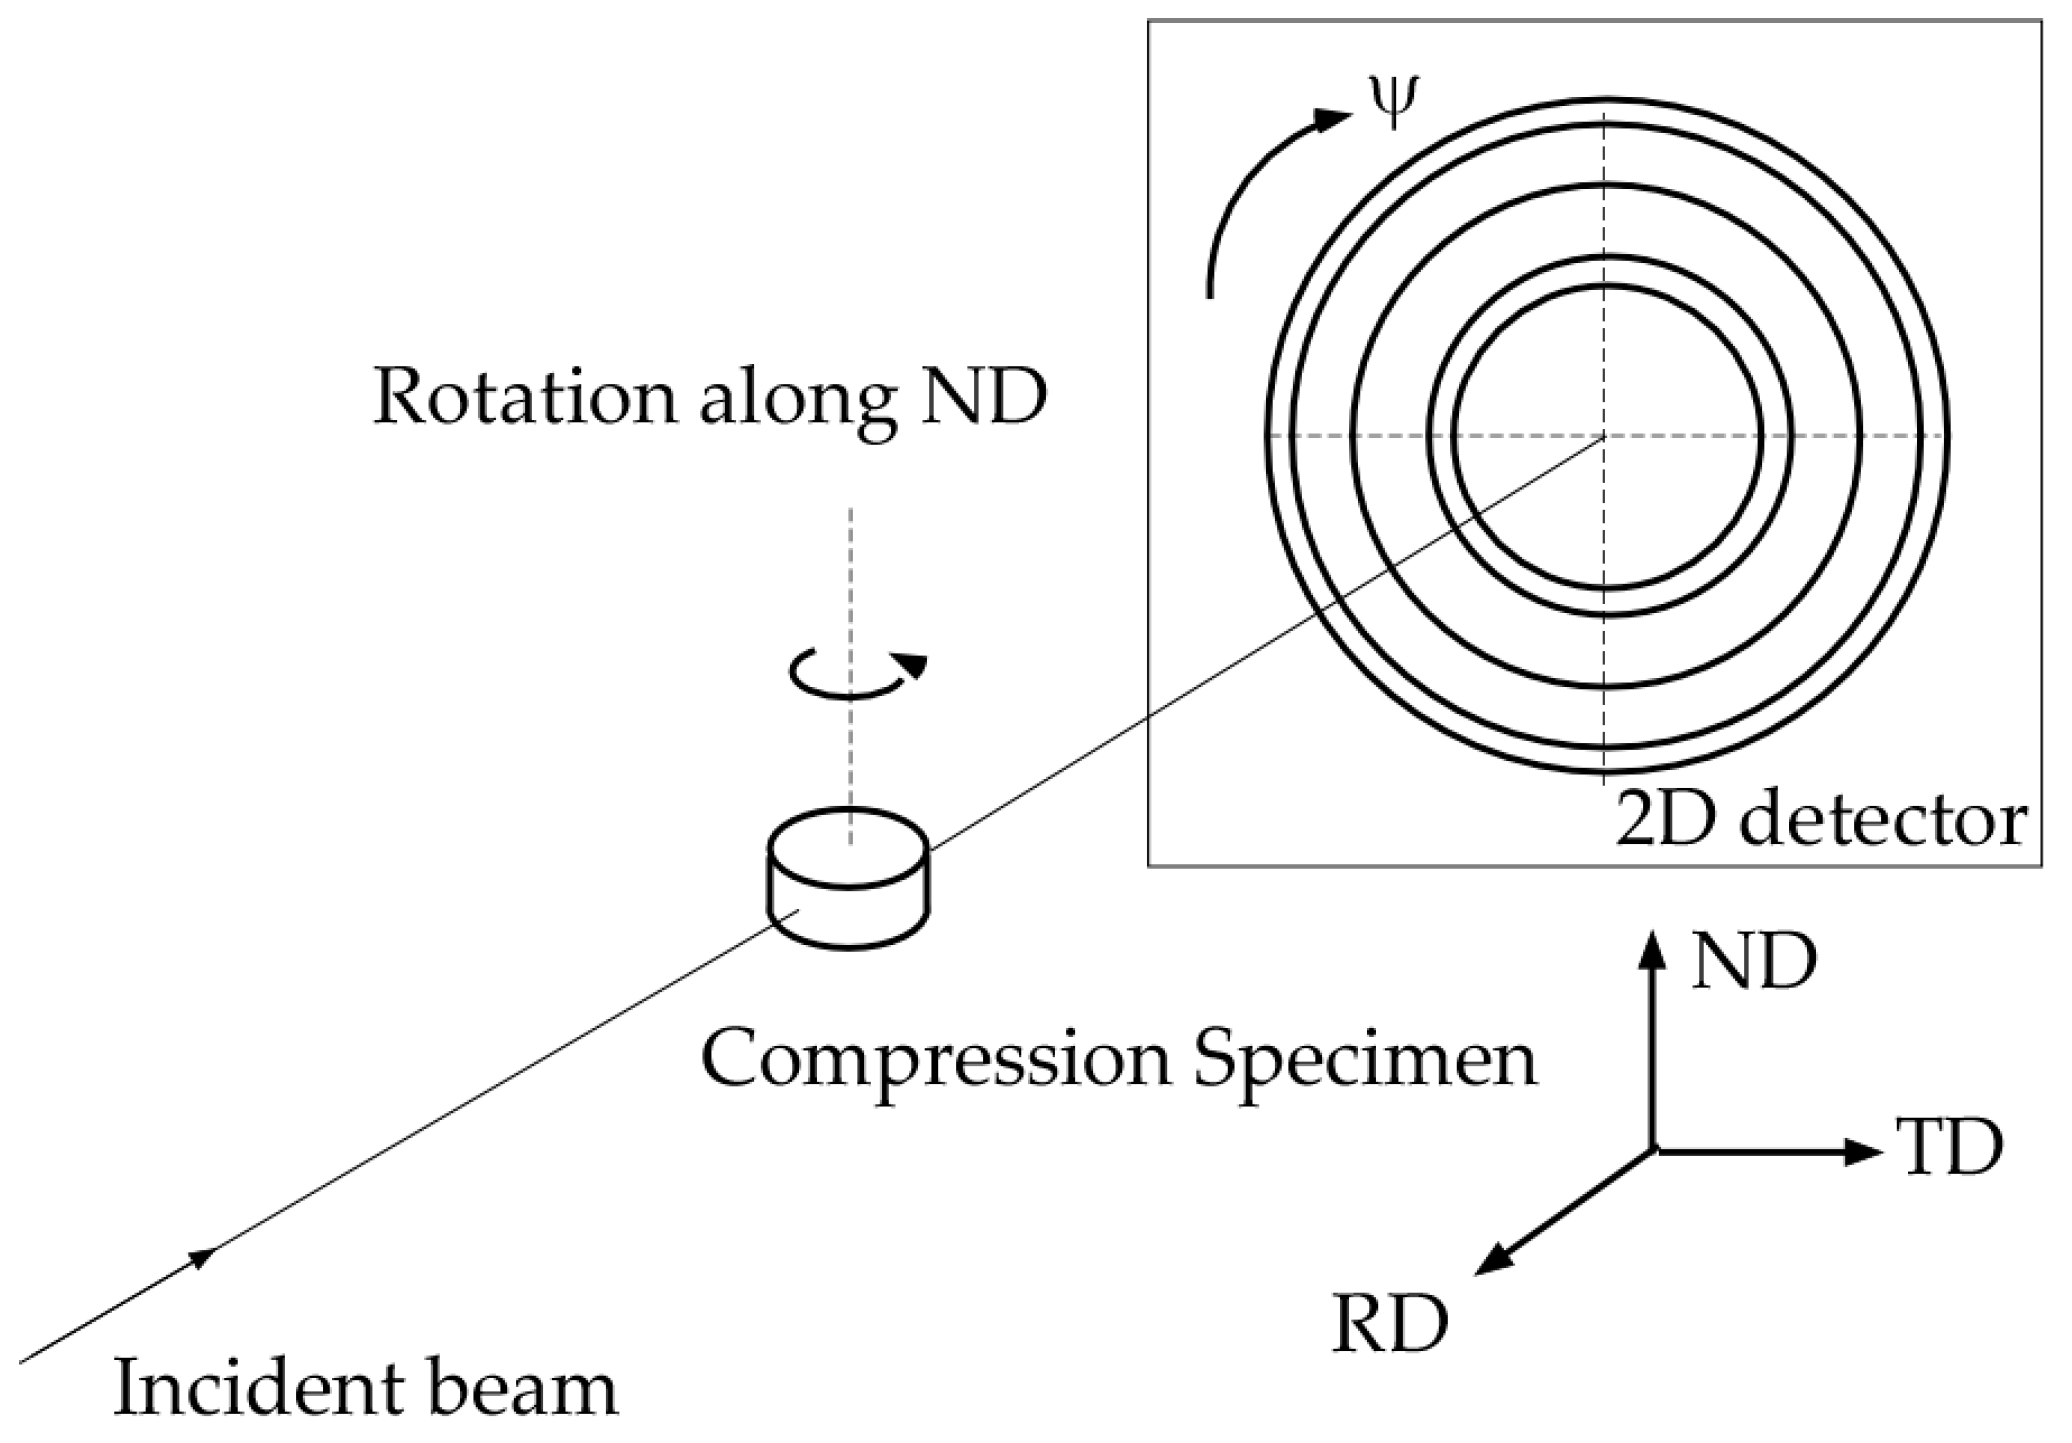
13] at the beamline ID15B of the European Synchrotron Radiation Facility (ESRF). The size of the incident X-ray beam was 0.3 × 0.3 mm at an X-ray energy of 89.70 keV. A two-dimensional detector was used for collecting the Debye–Scherrer diffraction data. Details of the experimental setup and the raw materials are identical to those of Reference [14]. As shown in 
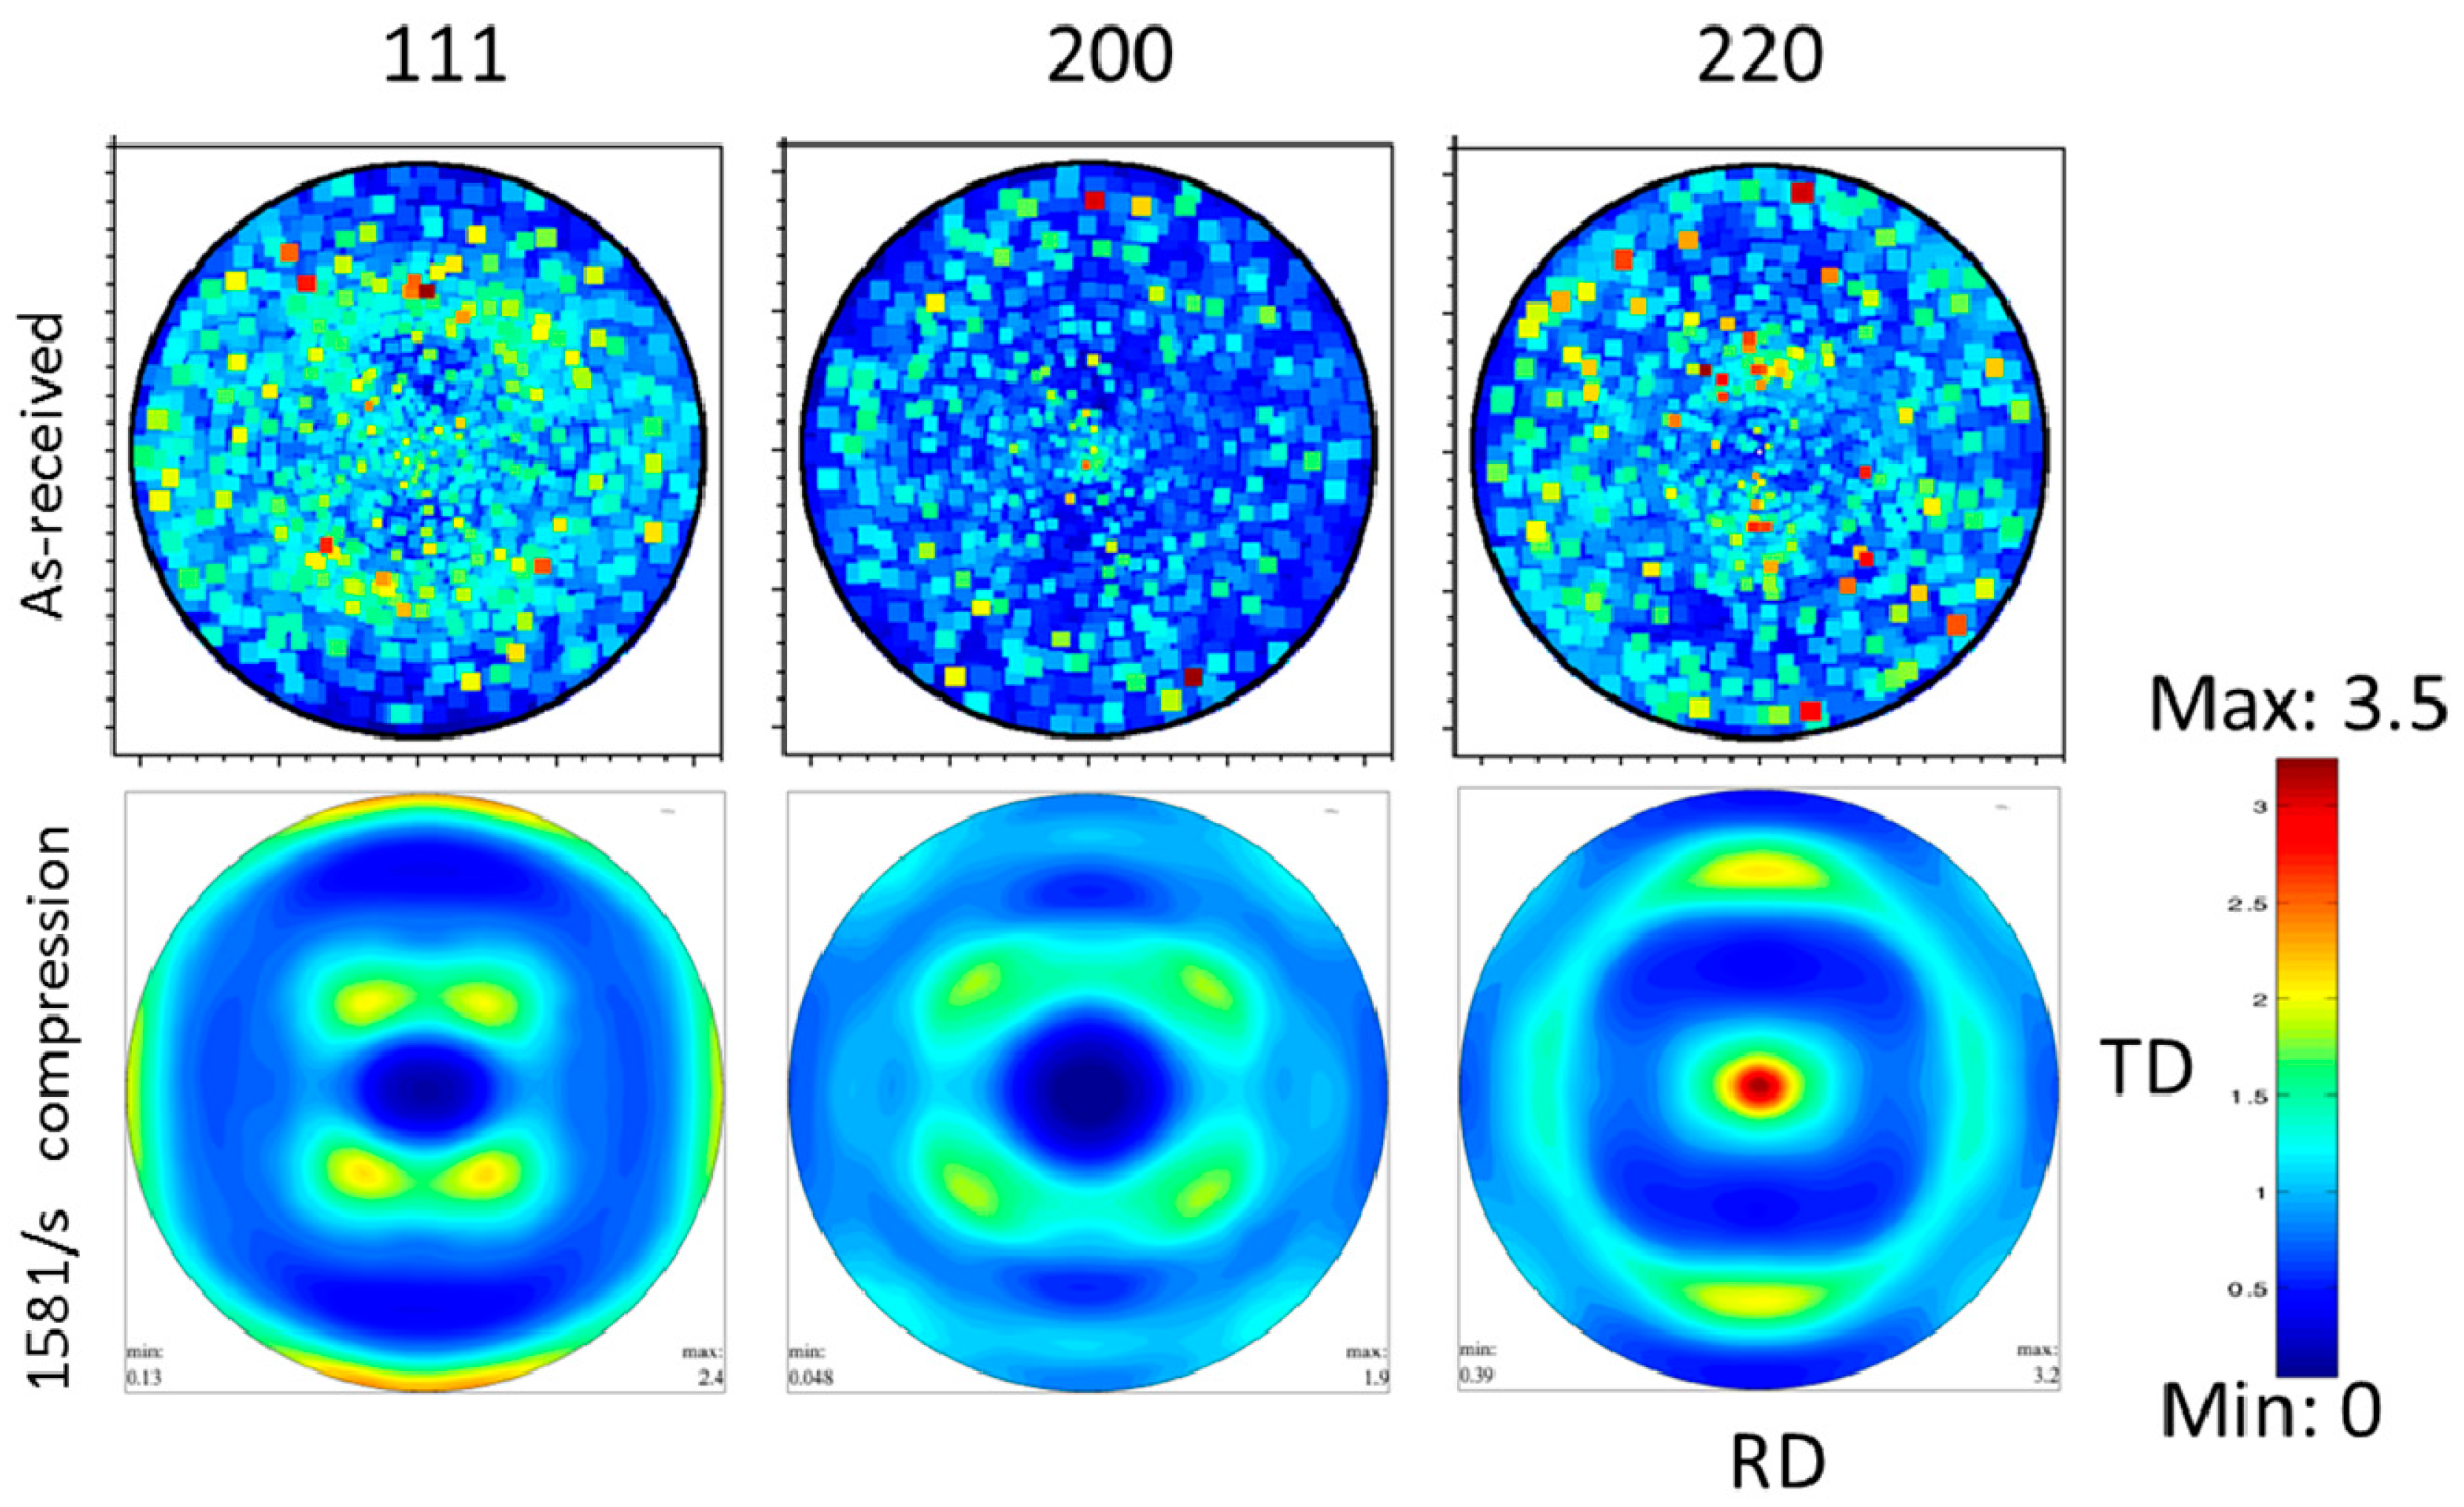
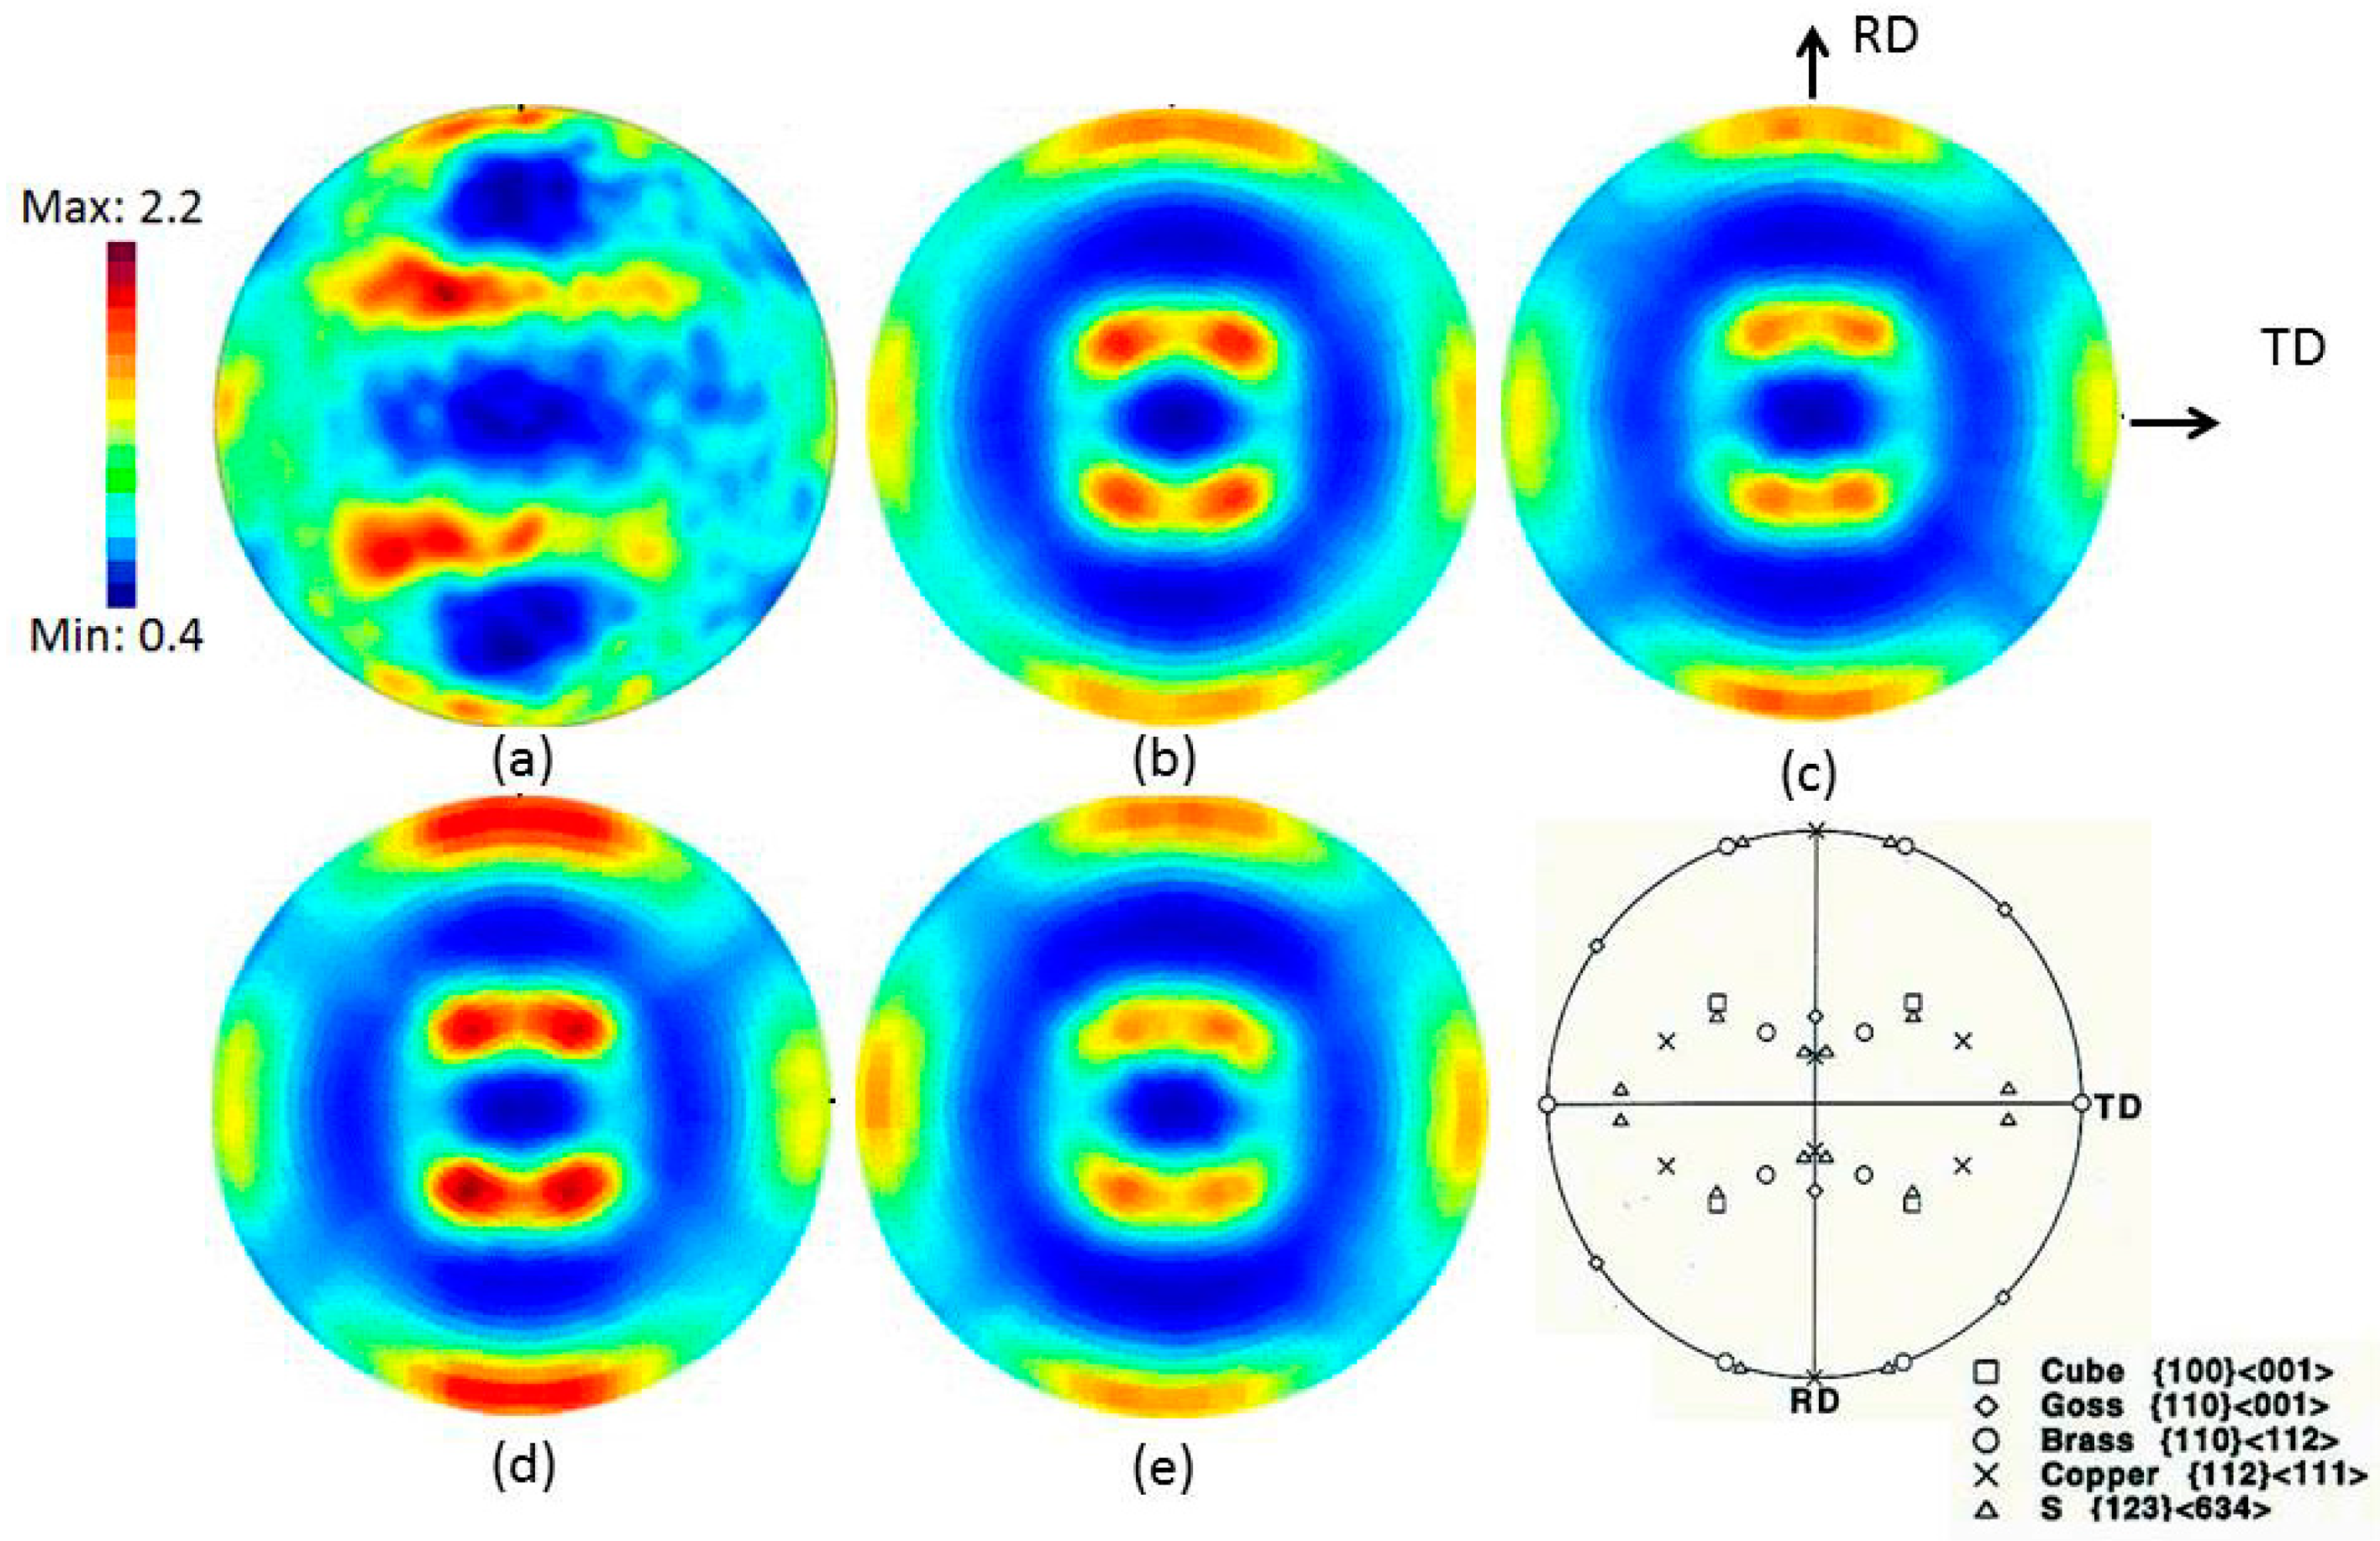
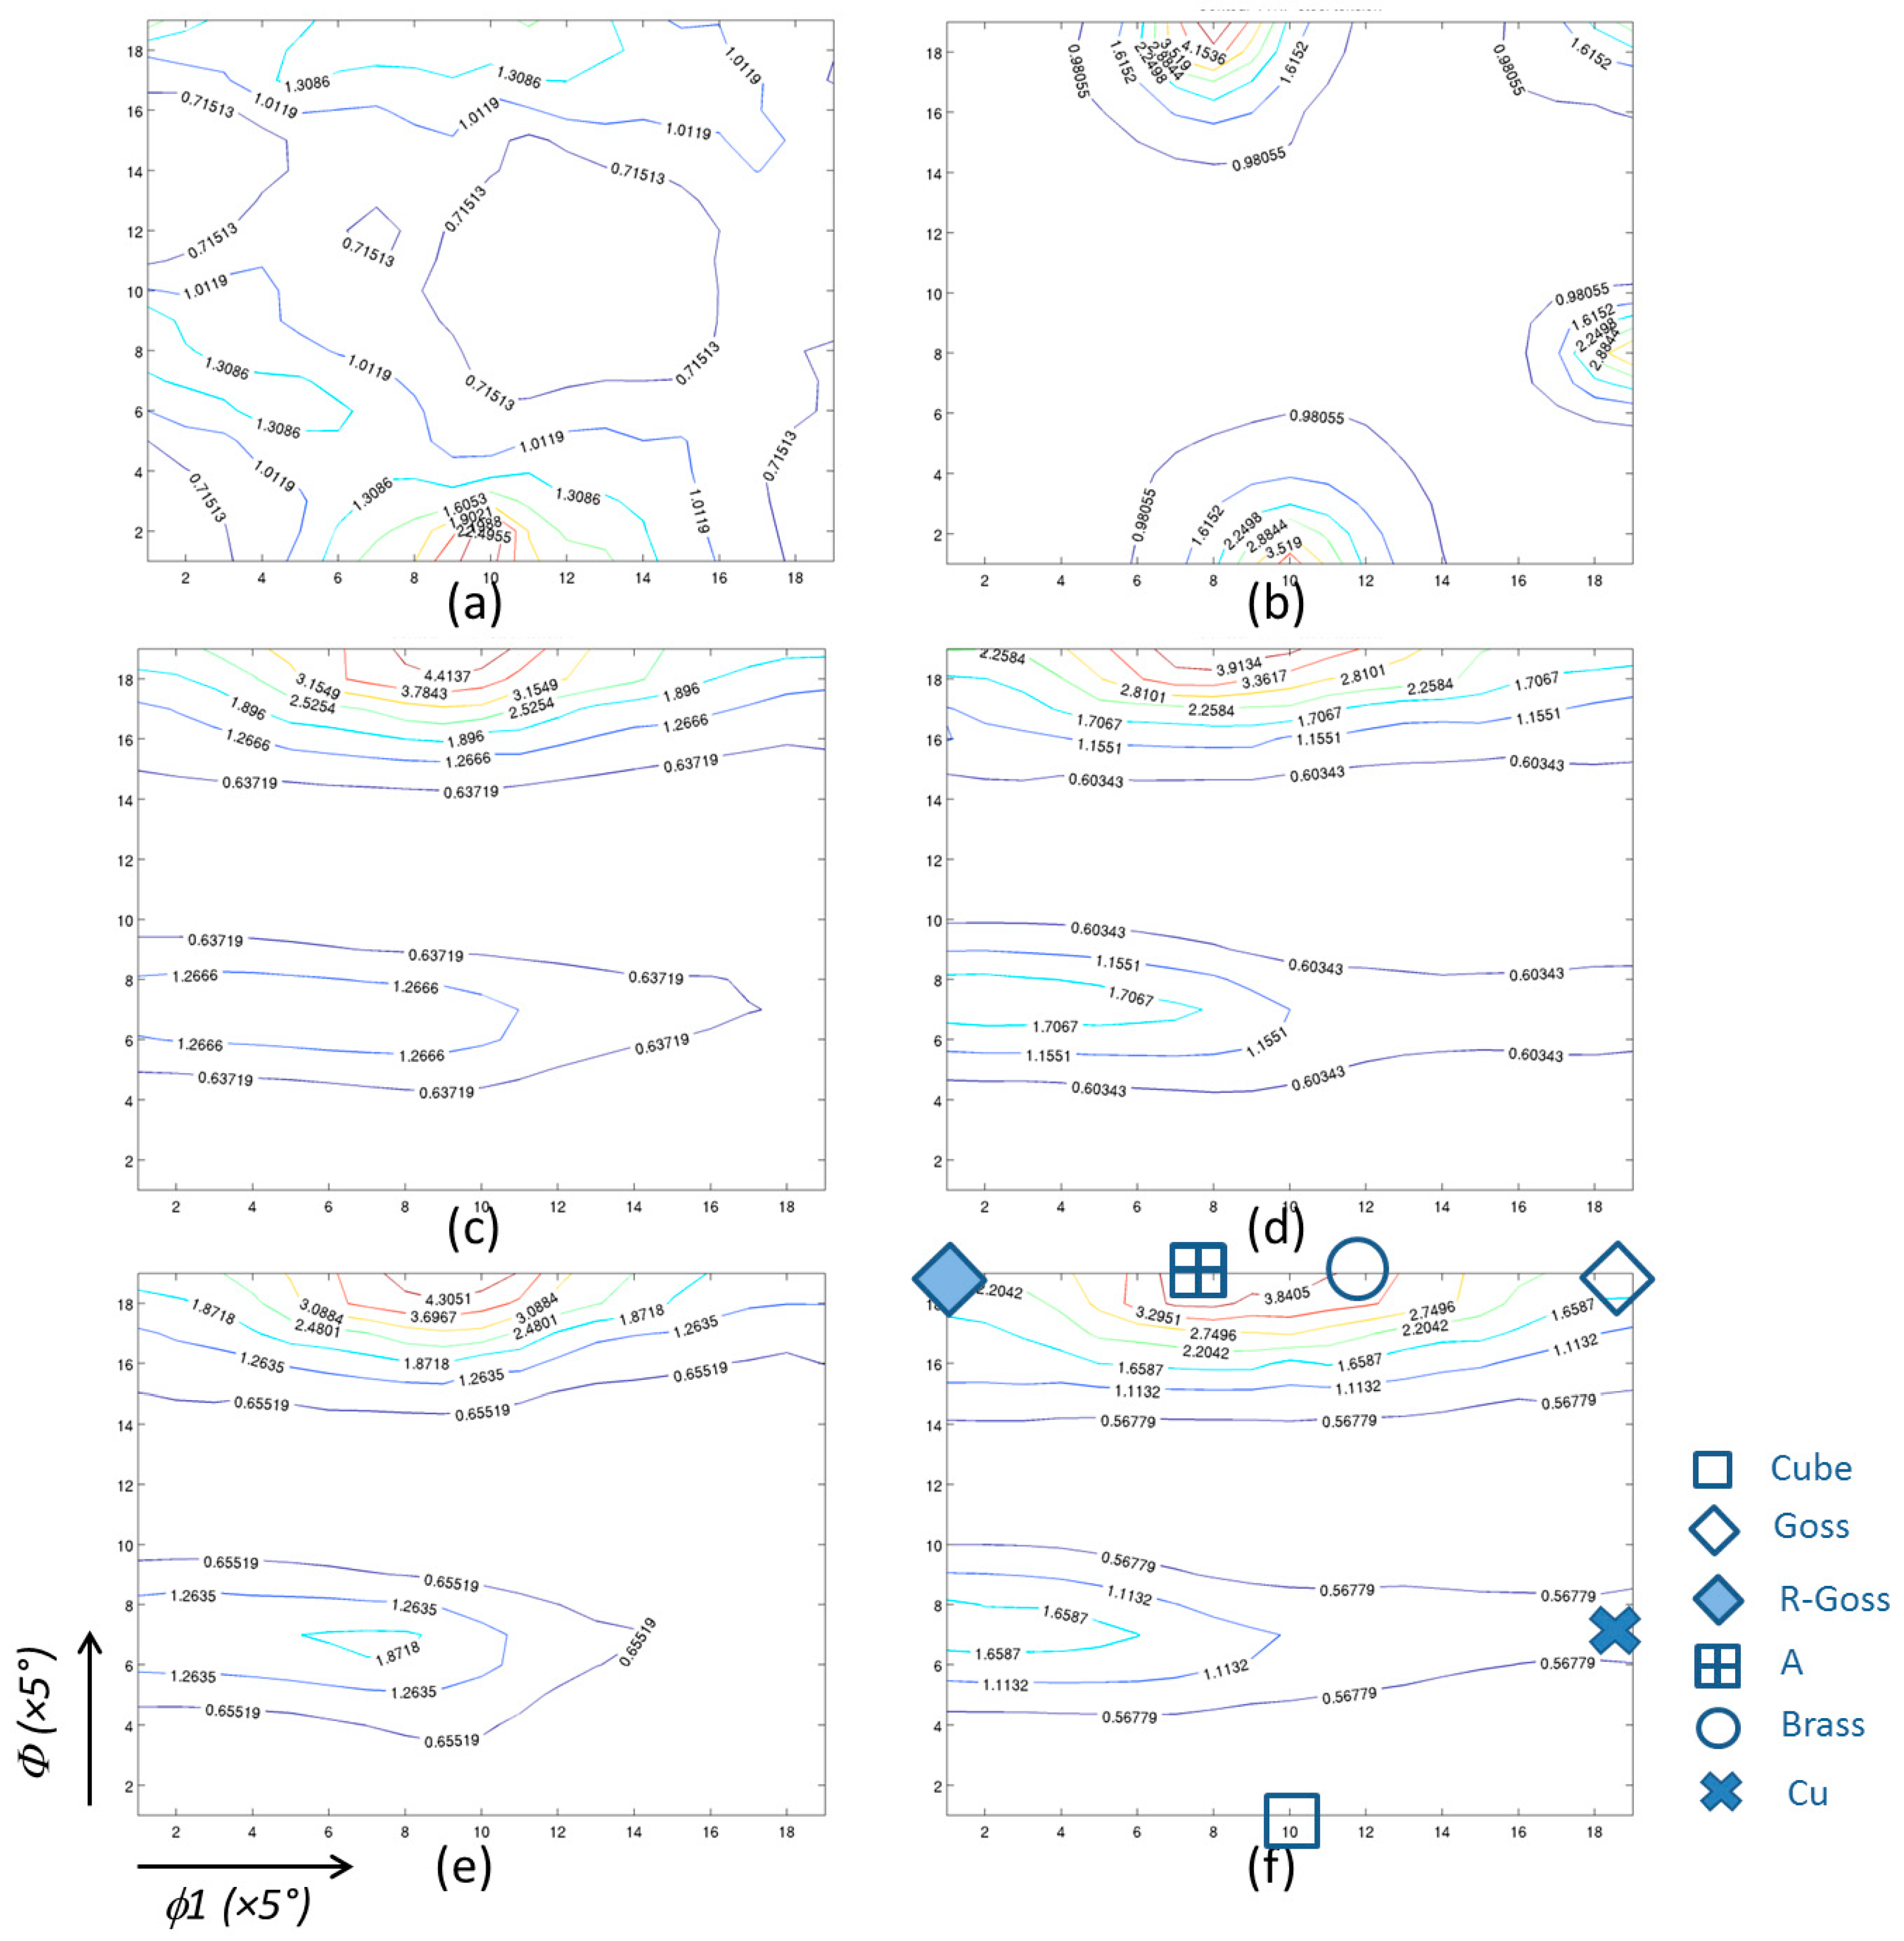
Figure 1, the incident beam was aligned perpendicular to the plane composed by the rolling direction (RD) and transverse direction (TD), in accordance with the rolled plate. The specimen was then rotated around its axial axis from 0° to 360° with steps of 2.5°. Pole figures for reflections 111, 200, 220 and 311 were calculated from radically integral intensity distributions along the azimuthal angel ψ. An Mtex/Matlab program [15] was employed to calculate the orientation distribution function (ODF) and the selected section of the ODF was plotted accordingly.
After deformation and texture measurements by synchrotron radiation X-ray diffraction, all specimens were mechanically ground and polished in accordance with standard procedures for steels and etched with 2.5% Nital. Microstructural characterization was conducted using a Leica DMR optical microscope and a JEOL JSM-6490 scanning electron microscope (SEM).

3. Results

3.1. Mechanical Response

The true stress–strain curves obtained from both the Gleeble 3500 and SHPB compression test experiments are shown in Figure 2. They reveal only the plastic behaviour of the materials as a function of strain rate; that is, compressive behaviour from yield onward. Since the Gleeble 3500 tests had slight irregularities within the elastic limit, the elastic portion of all the curves was removed. For the specimen that was compressed by the SHPB at high strain rate of 1581/s, the total strain was measured as ~20%. Quasi-static compression tests performed on the Gleeble 3500 at strain rates between 0.01/s to 100/s achieved a total strain of ~15%.
As seen in Figure 2, the yield strength increased with an increase in strain rate, which is in good agreement with previous studies [9,16]. It should be noted, however, that the total deformation level of the specimen compressed by the SHPB was higher than the lower strain rate compression tests conducted using Gleeble 3500. Also, the work hardening—i.e., the slope of the true strain–stress curves—was reduced for the larger strain rates. The improved compressive properties obtained via the high strain rate specimen tested by the SHPB can be attributed to the formation of twins, which was subsequently validated by microstructural analyses and the texture evolution of the deformed specimens, which will be described in further sections.

3.2. Microstructure Analysis

Figure 3 displays the microstructure of the as-received Fe-18Mn-0.6C-1.5Al steel, together with the deformed microstructure after compression testing at various strain rates, which was obtained by optical microscopy (Figure 3a–e) and scanning electron microscopy (Figure 3f). In the as-received material (Figure 3a), the microstructure was found to be fully austenite phase, with a small number of annealing twins, as indicated by the arrows in the figure. Before deformation, no clear subgrain structure was observed, however, a feathery-shaped substructure within grains was present in all the compression tested specimens after deformation, regardless of the strain rate (Figure 3b–e). Some of these rendered as distinct parallel lines, while others were significantly finer and more difficult to distinguish. The average grain size of the as-received material was approximately 20 μm. After plastic deformation, the grain sizes of all the compression tested specimens were found to be approximately half of the as-received grain size. Comparatively, the SHPB specimen, tested at the high strain rate, contained larger grains and the distribution of grain size range was wider than the quasi-static deformed samples. A SEM micrograph of the compression specimen tested at 0.01/s strain rate is shown in Figure 3f, wherein mechanical twins (indicated by arrows) can be observed. Similar features were observed for all the compression tested specimens in this study.

3.3. Texture Analysis

The results of texture measurements for the as-received specimen and the specimen compression tested at a high strain rate of 1581/s are displayed as (111), (200) and (220) pole figures in Figure 4. As demonstrated in the top row of Figure 4, grain orientations in the as-received specimen were rather randomly distributed in all directions. Comparatively, most of the grains had their (110) planes perpendicular to the compressing direction after compression, which was evidenced by the high intensity area observed along the ND direction in the (220) pole figure.
In Figure 5, the (111) pole figures of the as-received material and the compression tested specimens with strain rates of 1581/s, 100/s, 10/s and 0.01/s are presented. The (111) pole figure of the ideal compression texture components for fcc-structured materials is also included for comparison. From the distribution of the (111) pole, it is clear that the compression deformation with the final strain of ~20% did not cause a highly anisotropic distribution of grain orientation, as the maximum intensity on the (111) pole is only 2.2 times higher than random distribution. In addition, the preferred orientation on fcc grains appears to have not been affected by the various compression strain rates.
Typical deformation texture components for fcc materials, e.g., copper ({112} <111̅>), brass ({110} <1̅12>), Goss ({110} <001>), cube ({001 <01̅0>) and A ({110} <111>), as well as fibre texture components of <111>-fibre, <001>-fibre and <112>-fibre, are normally used to evaluate the change of preferred orientation. Combining the information from Figure 4 and Figure 5, we can only exclude the appearance of cube and S components. To further identify the distribution of these typical texture components for fcc materials in the compression tested specimens, orientation distribution function (ODF) plots were generated with Bunge’s notation [φ1, Φ, φ2]. In Figure 6, ODFs at φ2 = 45° are plotted for the as-received condition and after compression tests. In Figure 6a, the as-received sample shows slightly higher intensity at [45°, 0°, 45°], noted as a cube component. For the specimen compressed up to ~20% strain, higher intensity (3.8~4.4) was found between [35°, 90°, 45°] and [55°, 90°, 45°], corresponding to an A component and brass component. The changes in texture were obvious after plastic deformation occurring in quasi-static compression or dynamic compression. The cube texture component disappeared in all of the compression-tested specimens, with brass and A components becoming the dominant texture components for all the compressed specimens. For the specimen deformed by a strain rate of 0.01/s (Figure 6f), the texture displayed the lowest intensity of the brass component after deformation. In contrast, the highest intensity of the brass component was found in the specimen deformed by a strain rate of 1581/s. Apart from the concentrated high intensities found near the brass and A components, intensities (1.9–2.5) that were considered relatively higher than random distribution were found near the Goss component and Rotation-Goss (R-Goss) component. These Goss, R-Goss and brass components all belong to a fibre texture with a compression direction perpendicular to the {110} lattice plane. For the purposes of comparison, the texture of a specimen that experienced uniaxial tensile deformation to 20% elongation is also included in Figure 6 (Figure 6b). It can be observed that after a similar amount of strain, the intensity along the cube component is slightly enhanced, and is accompanied with an orientation concentration at the A and copper components as part of the <111>-fibre.

4. Discussion

Before further discussions, it is worth clarifying the terms low, medium and high strain rate deformation conditions. As is described in Reference [17], at strain rates of the order 10−6 to 10−5/s, the creep behaviour of the material is the primary consideration and creep laws are used to describe the mechanical behaviour. At higher rates, e.g., in the range of 0.0001/s to 0.01/s, a uniaxial test or a quasi-static stress–strain curve obtained from a constant strain rate test is used to describe the material behaviour. In this region, the mechanical response of the material may change, and alternate testing techniques may have to be used. The range of strain rates from 0.1/s to 100/s is generally referred to as an intermediate or medium strain rate regime. Within this regime, strain rate effects become a consideration in most materials, although the magnitude of such effects may be quite small. Strain rates of 1000/s or more are generally treated as high strain rate responses. It is within the high strain rate range that inertia and wave propagation effects become important in interpreting experimental data. At these high rates of strain, care must be taken to distinguish between average and local values of stress, which may be the result of one or more high-intensity stress waves propagating through the material.
When researchers have correlated texture and microscopy results with the compressive deformation mechanisms of TWIP steel, they have reported that different deformation mechanisms are activated to accommodate the speed of external loading. Jia et al. [12] reported that for materials with low to medium stacking fault energy, shear bands play an important role during high strain rate plastic deformation. This conclusion was based on the observation of shear bands in 304L stainless steel specimens, which were compressed to ~54% strain at a high strain rate of 10000/s by SHPB testing. No shear band structure was observed in the deformed TWIP steel specimens in the current work, hence, it is inappropriate to include shear bands as a third deformation mechanism. As such, only the two deformation mechanisms of mechanical twinning and dislocation slip were considered. Furthermore, Jia et al. [12] found that the texture intensity difference in SHPB-deformed specimen and “quasi-static” deformed specimen was attributed to the roll of shear bands. However, there were no observations of shear band structures, nor significant texture intensity differences found between the SHPB deformed specimen and the quasi-static deformed specimens in the current study. As previously detailed, only dislocation slip and mechanical twinning were considered here as deformation mechanisms of TWIP steel. Meng et al. [
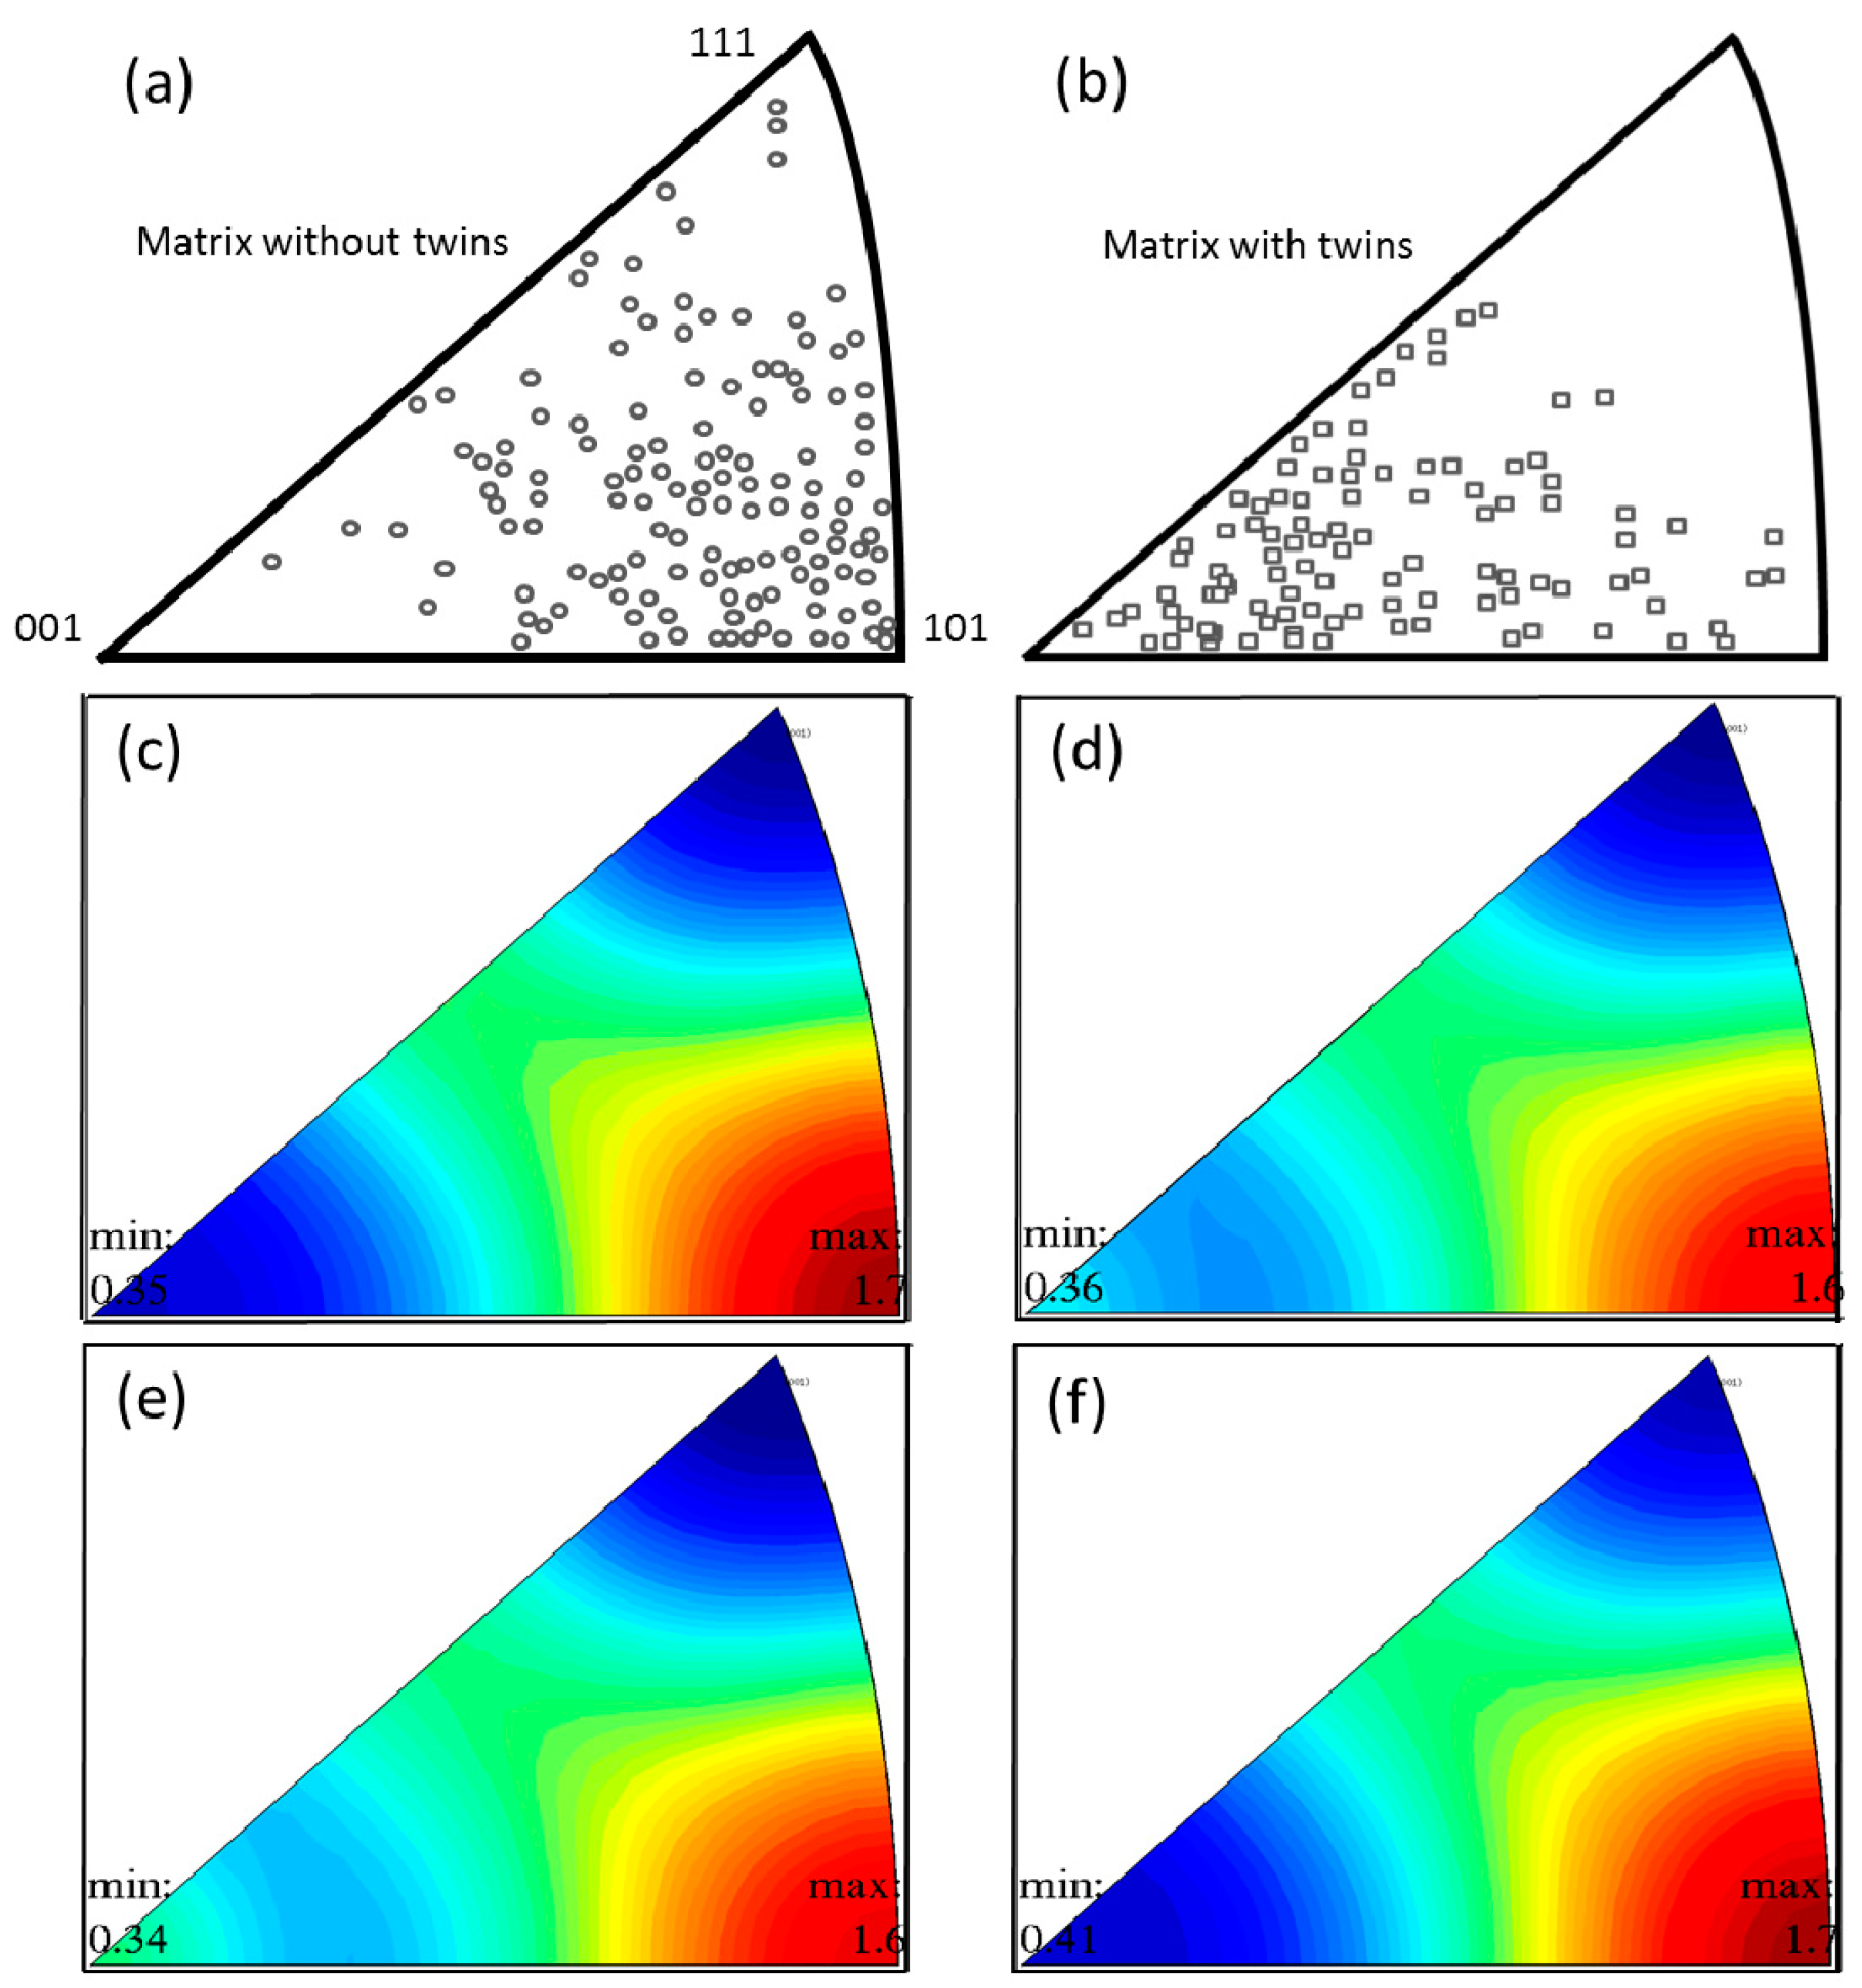
18] reported the grain orientation distribution of TWIP steels after various levels of final compressive strain. In Meng’s study, with detailed mapping using electron backscatter diffraction, grains with and without twin structure were extracted from full scan mapping. As shown in Figure 7a,b, twinning mainly occurred in the <001>-oriented grains, rather than the <101>-oriented grains. In comparison, <101>-oriented grains tended to slip as the preferred deformation mechanism. In addition, there was reasonable overlap between the <001> and <111> orientation, which could be explained by grain rotation (i.e., <001> to <101> due to slip). For similar levels of final compressive strain but different strain rates, and using the same method, we found that all the compression samples showed high intensity for <101>-oriented grains along the loading direction. However, more <001>-oriented grains were found in 100/s and 10/s compressed samples (Figure 7d,e), indicating a higher level of twinning.
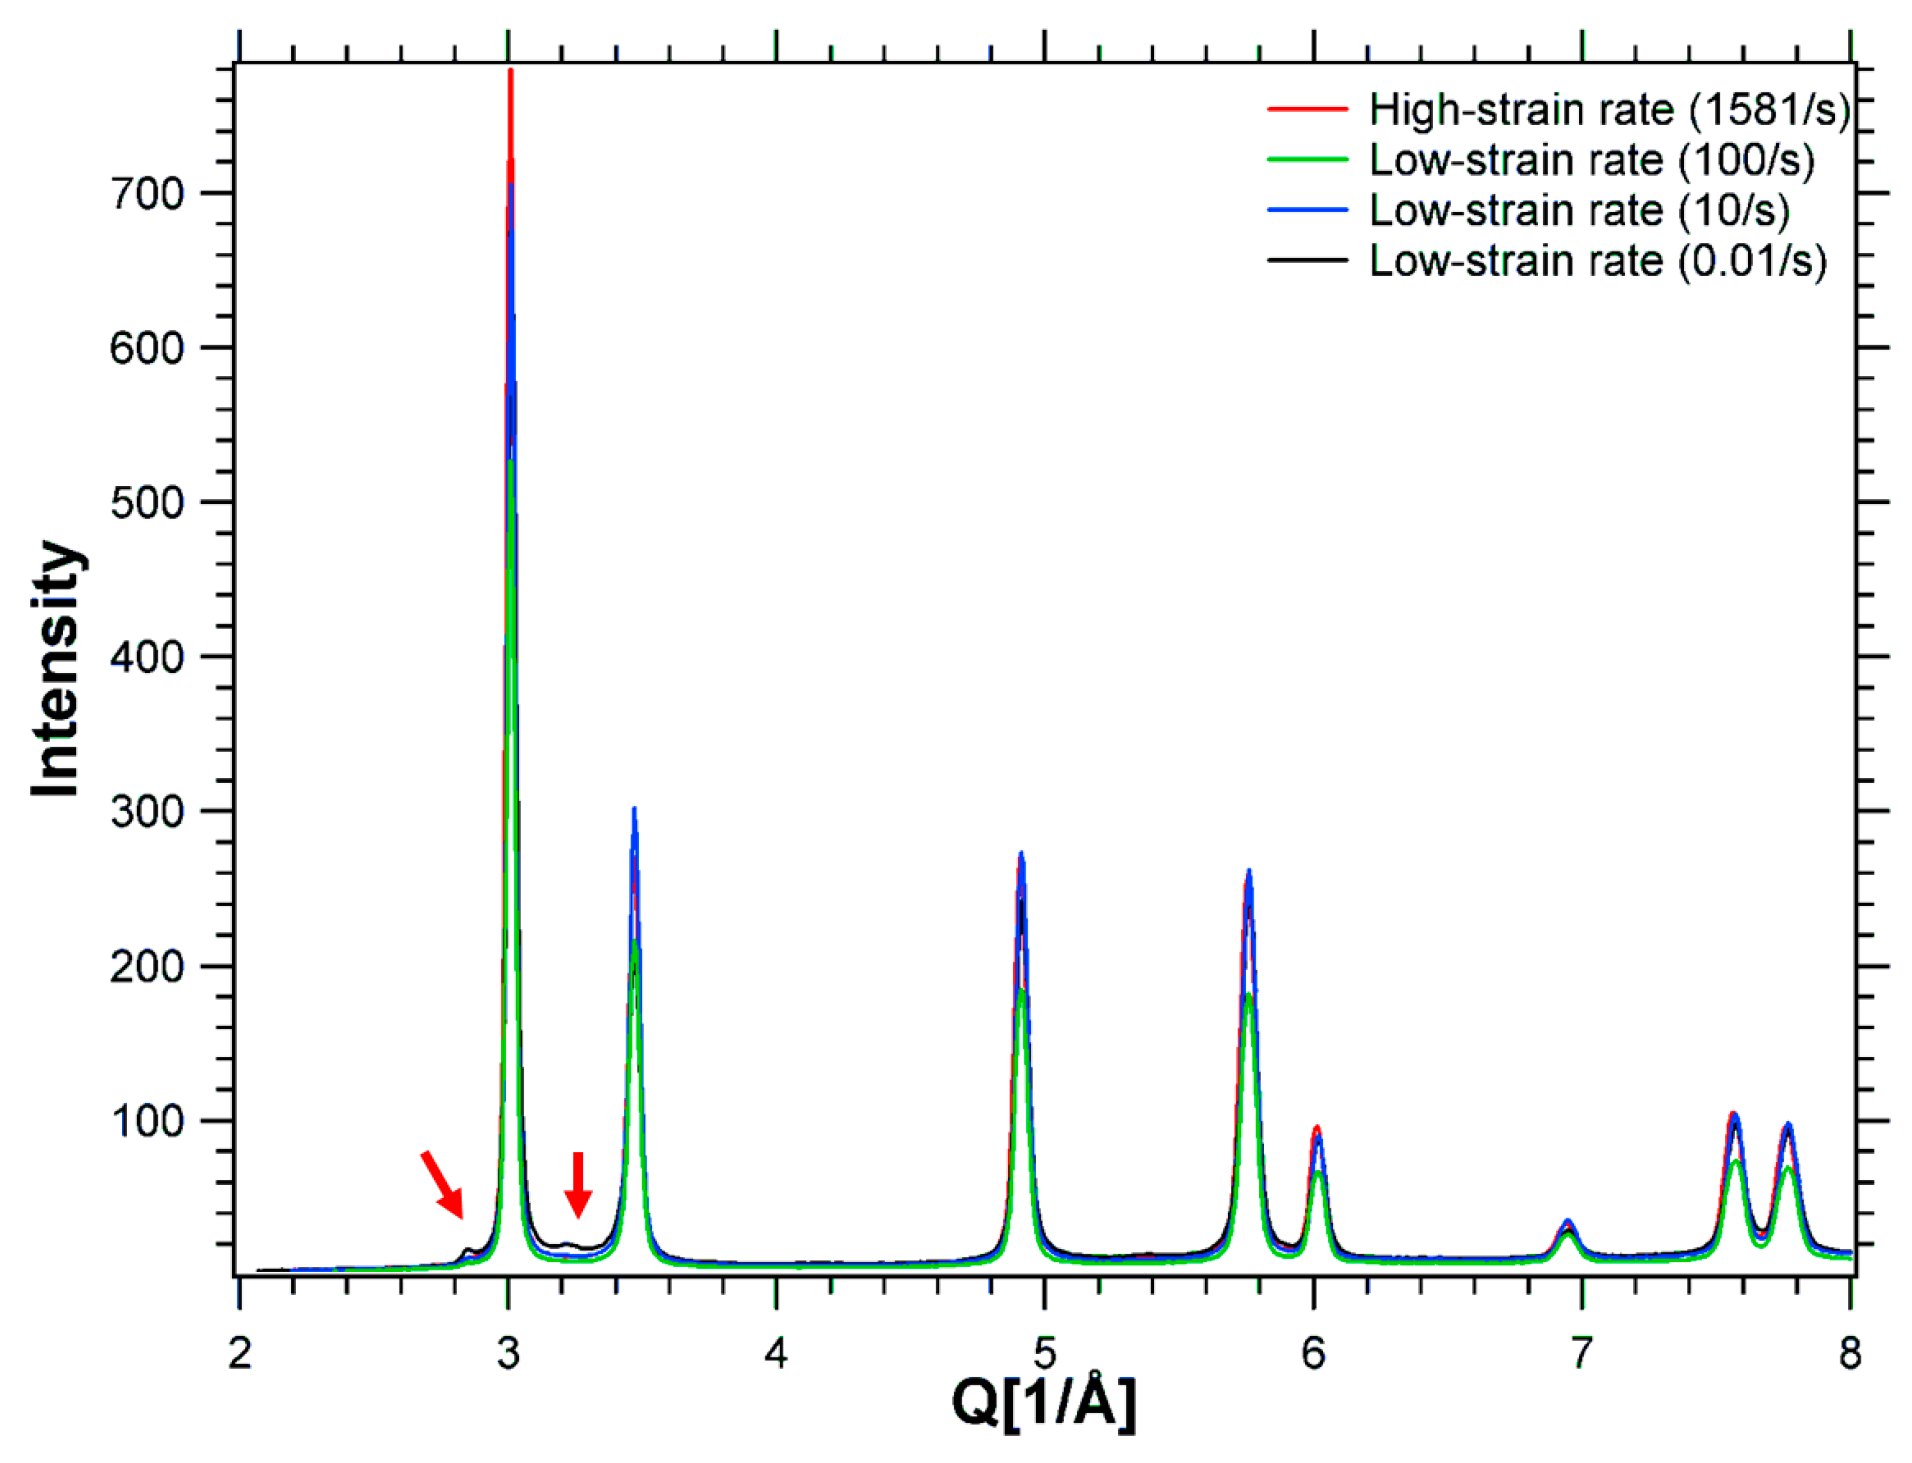
Diffraction profiles were also used to demonstrate the microstructural changes in the specimens deformed at different strain rates. In Figure 8, the diffraction intensities for each specimen are plotted against the scattering vector, Q. As can be seen in the figure, no displacements in the diffraction peak positions were observed. Interestingly, extra peaks, as indicated by arrows in Figure 8, revealed the evolution of a different phase in the specimen deformed at a strain rate of 0.01/s—a phase which possessed a crystallographic structure other than the fcc austenite phase. With preliminary refinement, these extra peaks were found to belong to the 
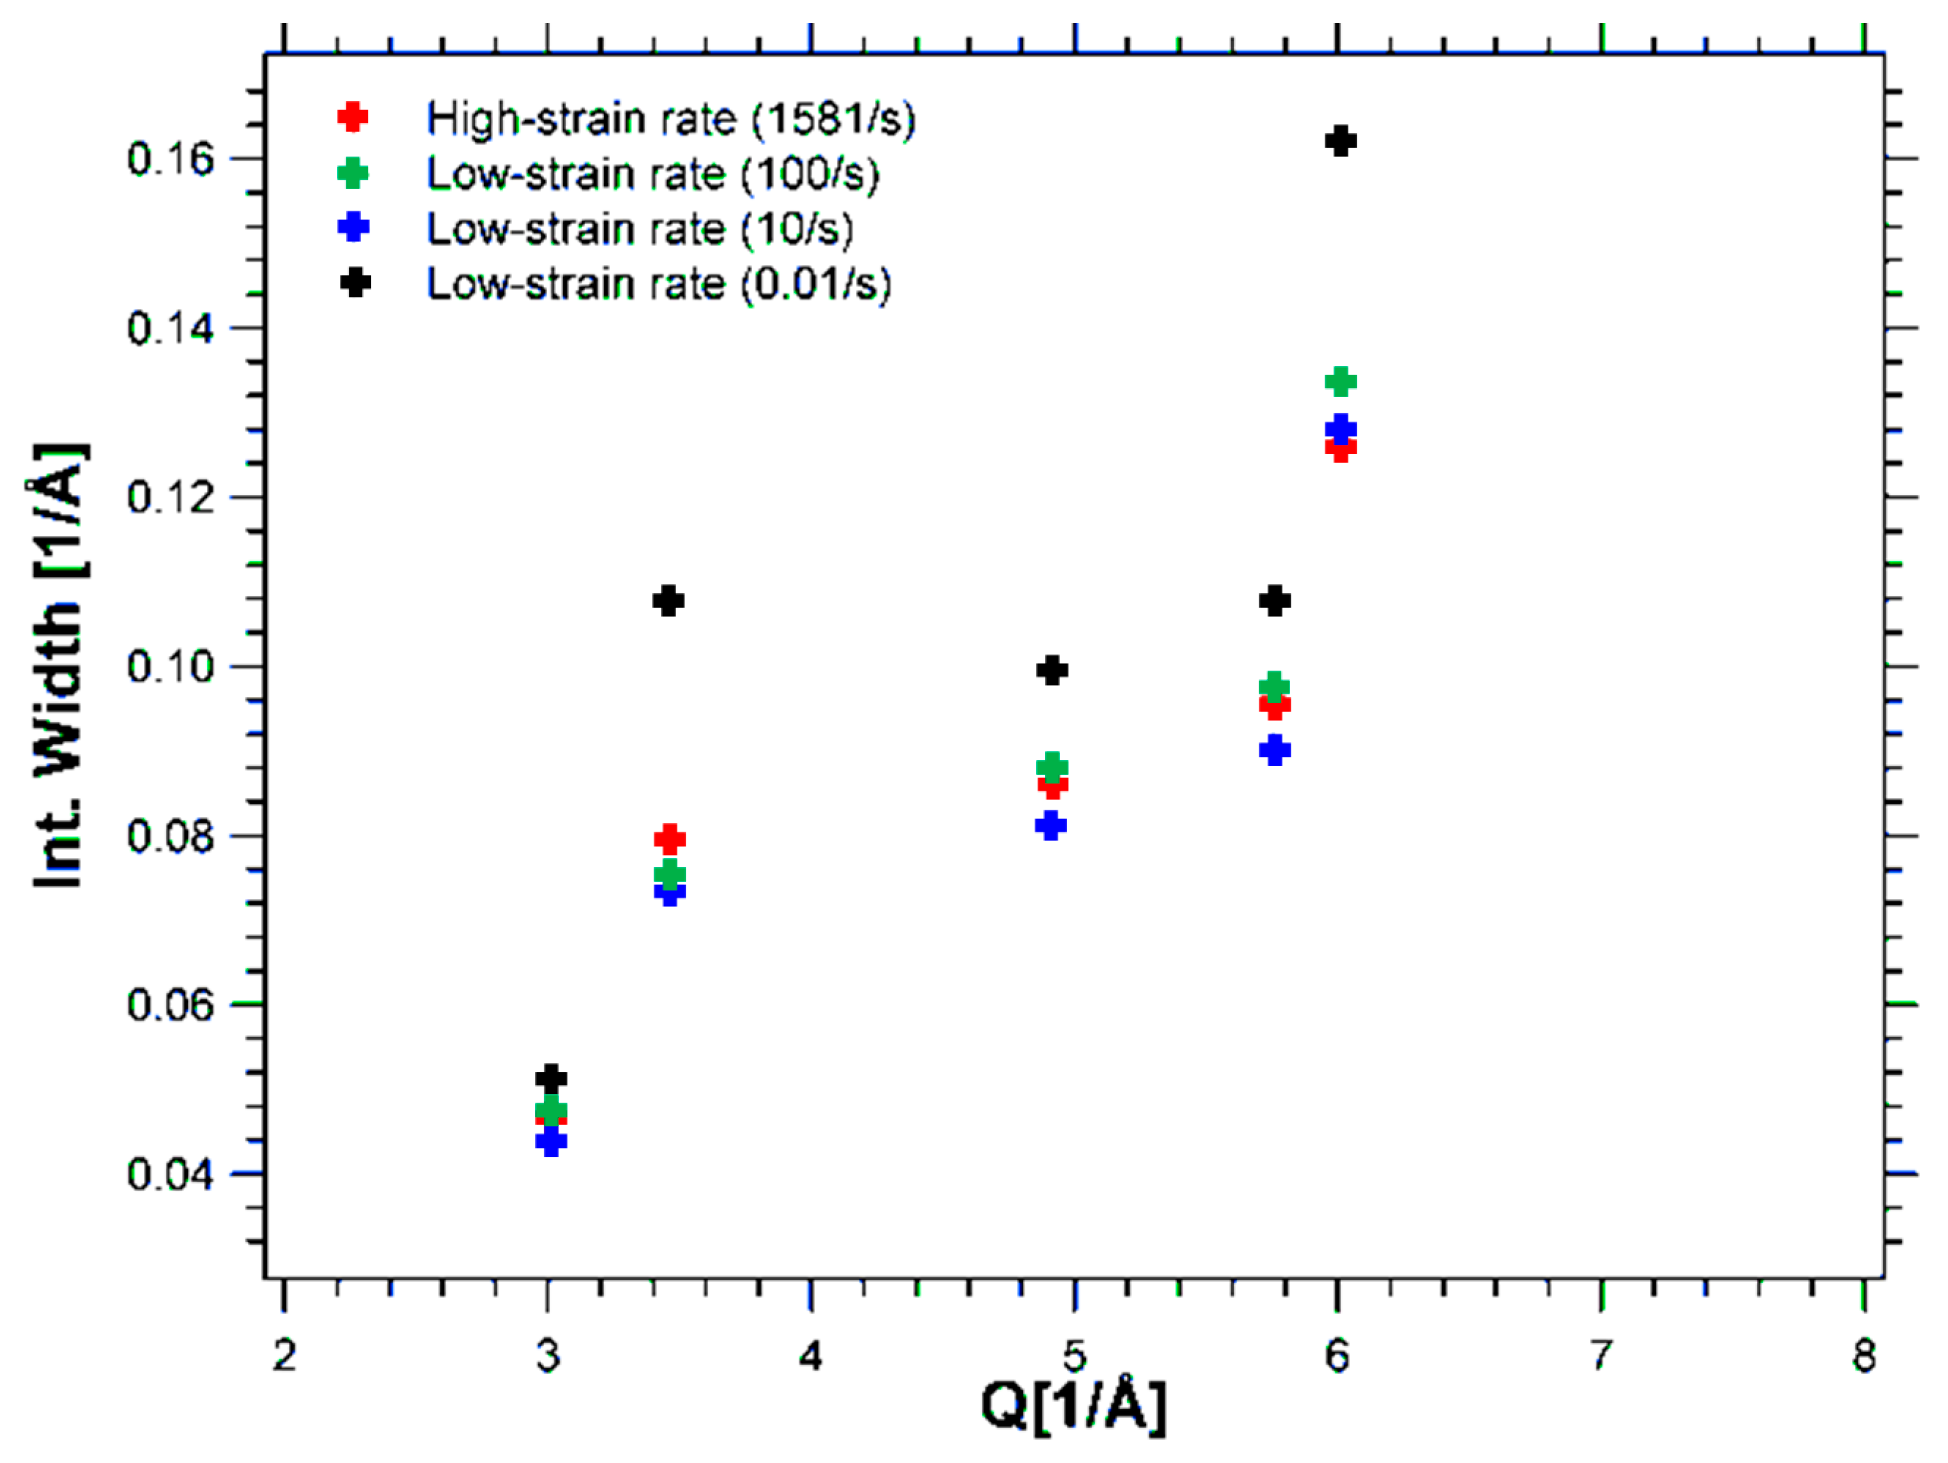
hcp structured martensite or ABABAB structured stacking faults; however, the fraction of this new phase was very small. Additionally, the integrated peak width of different reflections—shown in Figure 9—indicated that the specimen deformed at the lowest strain rate (0.01/s) obtained the broadest peak width. Diffraction peak broadening, as Estrin et al. [19] described, indicates small crystallites, grains or subgrains, and/or the presence of micro-stresses. In the test with the lowest strain rate (0.01/s), the broad peak width can mainly be attributed to finer grain size, the contents of dislocations and the subgrain structure introduced by dislocation movement, which are all due to slip. In Figure 9, the typical high width value of the austenite 200 peak (i.e., the second peak) may be observed, which has previously been reported by Ungár et al. [20] to be particularly broadened by the anisotropy of crystallographic slip on {111}, a/2<110>. This observation further emphasises the role of dislocation gliding in plastic deformation at our lowest strain rate of 0.01/s. As twinning has a larger role at elevated deformation rates, fewer dislocations accumulate due to slip, leading to a smaller broadening.

5. Conclusions

Deformation mechanisms of low-stacking fault energy material TWIP steel, as a function of compression testing at different strain rates, were investigated by high-energy X-ray diffraction and microscopy. After compression, grains with {110}||compression direction became favourable. Higher intensity was observed near Brass and A components on ODF (φ2 = 45°) for all the compressed specimens. The slowest strain rate tested specimen (0.01/s) obtained a wider integrated diffraction peak width and anisotropy, which is indicative of a refined structure and higher dislocation density, stemming from a slip deformation process. Overall, our results indicate that the low strain rate deformation test involved more dislocation gliding, whilst the medium strain rate tested specimen favoured mechanical twinning. This observation is in contrast with previous reports of compression deformation suppressing twinning activity and strain rate having a negligible impact on the deformation mechanism of low- to medium-stacking fault material at room temperature. For the medium strain rate tests, the mechanism of deformation was found to be closer to high strain rate rather than low strain rate deformation. Neither lower texture intensity nor shear band microstructure was observed in the highest strain rate tested specimen, which is also in contrast to other reported low-stacking fault energy materials that have been compression tested, such as 904L stainless steel.

Author Contributions

All authors have participated in performing the synchrotron radiation X-ray diffraction experiment; M.D.C. contributed to the sample preparation and microstructural analysis; K.Y. contributed to the X-ray diffraction data analysis and texture analysis; K.-D.L. contributed to writing of this manuscript.

Funding

This research received no external funding.

Acknowledgments

The authors acknowledge C.-T. Peng for assistance with optical microscopy at University of Wollongong, Australia. The SHPB facility (Australian Research Council Grant DP0450212) is acknowledged for the high strain rate compression test. All authors acknowledge travel funding to the ESRF provided by the International Synchrotron Access Program (ISAP) managed by the Australian Synchrotron. The ISAP is funded by a National Collaborative Research Infrastructure Strategy Grant provided by the Federal Government of Australia. The authors thank the ESRF management, User Office and beamline staff, particularly M. Scheel as local contact, and appreciate their access and support under proposal number MA-991. Thanks are also given to D. Carr at ANSTO, for participation in the high-energy X-ray diffraction experiments at the ESRF.

Conflicts of Interest

The authors declare no conflicts of interest.

References

  1. Misra, R.D.K.; Kumar, B.R.; Somani, M.; Karjalainen, P. Deformation processes during tensile straining of ultrafine/nanograined structures formed by reversion in metastable austenitic steels. Scr. Mater. 2008, 59, 79–82. [Google Scholar] [CrossRef]
  2. Vercammen, S.; Blanpain, B.; De Cooman, B.C.; Wollants, P. Cold rolling behaviour of an austenitic fe–30mn–3al–3si twip-steel: The importance of deformation twinning. Acta Mater. 2004, 52, 2005–2012. [Google Scholar] [CrossRef]
  3. Barbier, D.; Gey, N.; Allain, S.; Bozzolo, N.; Humbert, M. Analysis of the tensile behavior of a twip steel based on the texture and microstructure evolutions. Mater. Sci. Eng. A 2009, 500, 196–206. [Google Scholar] [CrossRef]
  4. El-Danaf, E.; Kalidindi, S.R.; Doherty, R.D. Influence of grain size and stacking-fault energy on deformation twinning in fcc metals. Metall. Mater. Trans. A 1999, 30, 1223–1233. [Google Scholar] [CrossRef]
  5. Idrissi, H.; Ryelandt, L.; Veron, M.; Schryvers, D.; Jacques, P.J. Is there a relationship between the stacking fault character and the activated mode of plasticity of fe–mn-based austenitic steels? Scr. Mater. 2009, 60, 941–944. [Google Scholar] [CrossRef]
  6. Xiong, R.-G.; Fu, R.-Y.; Su, Y.; Li, Q.; Wei, X.-C.; Li, L. Tensile properties of twip steel at high strain rate. J. Iron Steel Res. Int. 2009, 16, 21, 81–86. [Google Scholar] [CrossRef]
  7. Dumay, A.; Chateau, J.P.; Allain, S.; Migot, S.; Bouaziz, O. Influence of addition elements on the stacking-fault energy and mechanical properties of an austenitic fe–mn–c steel. Mater. Sci. Eng. A 2008, 483–484, 184–187. [Google Scholar] [CrossRef]
  8. Allain, S.; Chateau, J.P.; Bouaziz, O.; Migot, S.; Guelton, N. Correlations between the calculated stacking fault energy and the plasticity mechanisms in fe–mn–c alloys. Mater. Sci. Eng. A 2004, 387–389, 158–162. [Google Scholar] [CrossRef]
  9. Grässel, O.; Krüger, L.; Frommeyer, G.; Meyer, L.W. High strength fe–mn–(al, si) trip/twip steels development—properties—application. Int. J. Plast. 2000, 16, 1391–1409. [Google Scholar] [CrossRef]
  10. Kaschner, G.C.; Tomé, C.N.; McCabe, R.J.; Misra, A.; Vogel, S.C.; Brown, D.W. Exploring the dislocation/twin interactions in zirconium. Mater. Sci. Eng. A 2007, 463, 122–127. [Google Scholar] [CrossRef]
  11. Sisneros, T.A.; Brown, D.W.; Clausen, B.; Donati, D.C.; Kabra, S.; Blumenthal, W.R.; Vogel, S.C. Influence of strain rate on mechanical properties and deformation texture of hot-pressed and rolled beryllium. Mater. Sci. Eng. A 2010, 527, 5181–5188. [Google Scholar] [CrossRef]
  12. Jia, N.; Nie, Z.H.; Ren, Y.; Lin Peng, R.; Wang, Y.D.; Zhao, X. Formation of deformation textures in face-centered-cubic materials studied by in-situ high-energy X-ray diffraction and self-consistent model. Metall. Mater. Trans. A 2010, 41, 1246–1254. [Google Scholar] [CrossRef]
  13. Liss, K.-D.; Bartels, A.; Schreyer, A.; Clemens, H. High-energy X-rays: A tool for advanced bulk investigations in materials science and physics. Textures Microstruct. 2003, 35, 219–252. [Google Scholar] [CrossRef]
  14. Qu, D.; Liss, K.D.; Yan, K.; Reid, M.; Almer, J.D.; Wang, Y.; Liao, X.; Shen, J. On the atomic anisotropy of thermal expansion in bulk metallic glass. Adv. Eng. Mater. 2011, 13, 861–864. [Google Scholar] [CrossRef]
  15. Bachmann, F.; Hielscher, R.; Schaeben, H. Texture analysis with mtex—Free and open source software toolbox. Solid State Phenom. 2010, 160, 63–68. [Google Scholar] [CrossRef]
  16. Saleh, A.A.; Pereloma, E.V.; Gazder, A.A. Texture evolution of cold rolled and annealed fe–24mn–3al–2si–1ni–0.06c twip steel. Mater. Sci. Eng. A 2011, 528, 4537–4549. [Google Scholar] [CrossRef]
  17. Haddad, Y.M. Transition to the dynamic behaviour of engineering materials. In Mechanical Behaviour of Engineering Materials: Volume 2: Dynamic Loading and Intelligent Material Systems; Haddad, Y.M., Ed.; Springer: Dordrecht, The Netherlands, 2000; pp. 11–51. [Google Scholar]
  18. Meng, L.; Yang, P.; Xie, Q.; Ding, H.; Tang, Z. Dependence of deformation twinning on grain orientation in compressed high manganese steels. Scr. Mater. 2007, 56, 931–934. [Google Scholar] [CrossRef]
  19. Estrin, Y.; Zehetbauer Michael, J. Niche applications of bulk nanostructured materials processed by severe plastic deformation. Bulk Nanostruct. Mater. 2009. [Google Scholar] [CrossRef]
  20. Ungár, T.; Borbély, A. The effect of dislocation contrast on X-ray line broadening: A new approach to line profile analysis. Appl. Phys. Lett. 1996, 69, 3173–3175. [Google Scholar] [CrossRef]
Figure 1. Experimental setup for the texture measurements by high-energy X-ray diffraction on compression-tested twinning-induced plasticity (TWIP) steel specimens.
Qubs 03 00015 g001
Figure 2. Compressive true stress–strain responses of Fe-18Mn-0.6C-1.5Al TWIP steel from yield onward as a function of different strain rates.
Qubs 03 00015 g002
Figure 3. The microstructure of the TWIP steel specimens: (a) Optical micrograph of the as-received specimen; (b) optical micrograph of a specimen compression tested to a plastic strain of ~20% at a strain rate of 1581/s; (c) optical micrograph of a specimen compression tested to a plastic strain of ~15% at a strain rate of 100/s; (d) optical micrograph of a specimen compression tested to a plastic strain of ~15% at a strain rate of 10/s; (e) optical micrograph of a specimen compression tested to a plastic strain of ~15% at a strain rate of 0.01/s; and (f) scanning electron micrograph of a specimen compression tested to a plastic strain of ~15% at a strain rate of 0.01/s.
Qubs 03 00015 g003
Figure 4. The (111), (200) and (220) pole figures of TWIP steel for the as-received specimen (top row) and the specimen compression tested to a plastic strain ~20% at a strain rate of 1581/s (bottom row).
Qubs 03 00015 g004
Figure 5. (111) pole figures of TWIP steel for the (a) as-received specimen; (b) specimen compression tested to a plastic strain of ~20% at a strain rate of 1581/s; (c) specimen compression tested to a plastic strain of ~15% at a strain rate of 100/s; (d) specimen compression tested to a plastic strain of ~15% at a strain rate of 10/s; and (e) specimen compression tested to a plastic strain of ~15% at a strain rate of 0.01/s. Face-centred-cubic (fcc) materials’ ideal texture components are also presented as a (111) pole figure for comparison.
Qubs 03 00015 g005
Figure 6. Orientation distribution function (ODF) section at φ2 = 45° for the compression tested TWIP steel (a,cf) and a specimen that experienced uniaxial tensile deformation to 20% elongation (b). (a) As-received specimen; (b) tensile deformed to 20% strain; (c) specimen compression tested to a plastic strain of ~20% at a strain rate of 1581/s; (d) specimen compression tested to a plastic strain of ~15% at a strain rate of 100/s; (e) specimen compression tested to a plastic strain of ~15% at a strain rate of 10/s; and (f) specimen compression tested to a plastic strain of ~15% at a strain rate of 0.01/s.
Qubs 03 00015 g006
Figure 7. Inverse pole figure of compression direction for ~20% compressed specimens. (a) orientation of the grains without twinning; (b) orientation of the grains producing deformation twins (reproduced from Reference [18]); and (cf) texture distribution of specimens that experienced ~20% compressive strain with a strain rate of 1581/s, 100/s, 10/s and 0.01/s, respectively.
Qubs 03 00015 g007
Figure 8. Diffraction profile of the four specimens deformed at different strain rates.
Qubs 03 00015 g008
Figure 9. Williamson–Hall plot of the four specimens deformed at different strain rates, where the integrated width was calculated using peak area/peak height.
Qubs 03 00015 g009

