Learning to Describe: A New Approach to Computer Vision Based Ancient Coin Analysis


School Of Computer Science, University of St Andrews, Jack Cole Building, North Haugh, St Andrews KY16 9SX, UK
*
Authors to whom correspondence should be addressed.
Sci 2020, 2(2), 27; https://0-doi-org.brum.beds.ac.uk/10.3390/sci2020027
Submission received: 22 February 2020
/
Accepted: 24 February 2020
/
Published: 17 April 2020
(This article belongs to the Special Issue Machine Learning and Vision for Cultural Heritage)
Abstract
:In recent years, a range of problems under the broad umbrella of computer vision based analysis of ancient coins have been attracting an increasing amount of attention. Notwithstanding this research effort, the results achieved by the state of the art in published literature remain poor and far from sufficiently well performing for any practical purpose. In the present paper we present a series of contributions which we believe will benefit the interested community. We explain that the approach of visual matching of coins, universally adopted in existing published papers on the topic, is not of practical interest because the number of ancient coin types exceeds by far the number of those types which have been imaged, be it in digital form (e.g., online) or otherwise (traditional film, in print, etc.). Rather, we argue that the focus should be on understanding the semantic content of coins. Hence, we describe a novel approach—to first extract semantic concepts from real-world multimodal input and associate them with their corresponding coin images, and then to train a convolutional neural network to learn the appearance of these concepts. On a real-world data set, we demonstrate highly promising results, correctly identifying a range of visual elements on unseen coins with up to 84% accuracy.
1. Introduction
Numismatics is the study of currency, including coins, paper money, and tokens. This discipline yields fascinating cultural and historical insights and is a field of great interest to scholars, amateur collectors, and professional dealers alike. Important applications of machine learning in this field include theft detection, identification and classification of finds, and forgery prevention. The present work focuses on ancient coins and builds upon our previous research [1] with extended theoretical content, further experiments and a more in-depth analysis and discussion of our findings and their relevance.
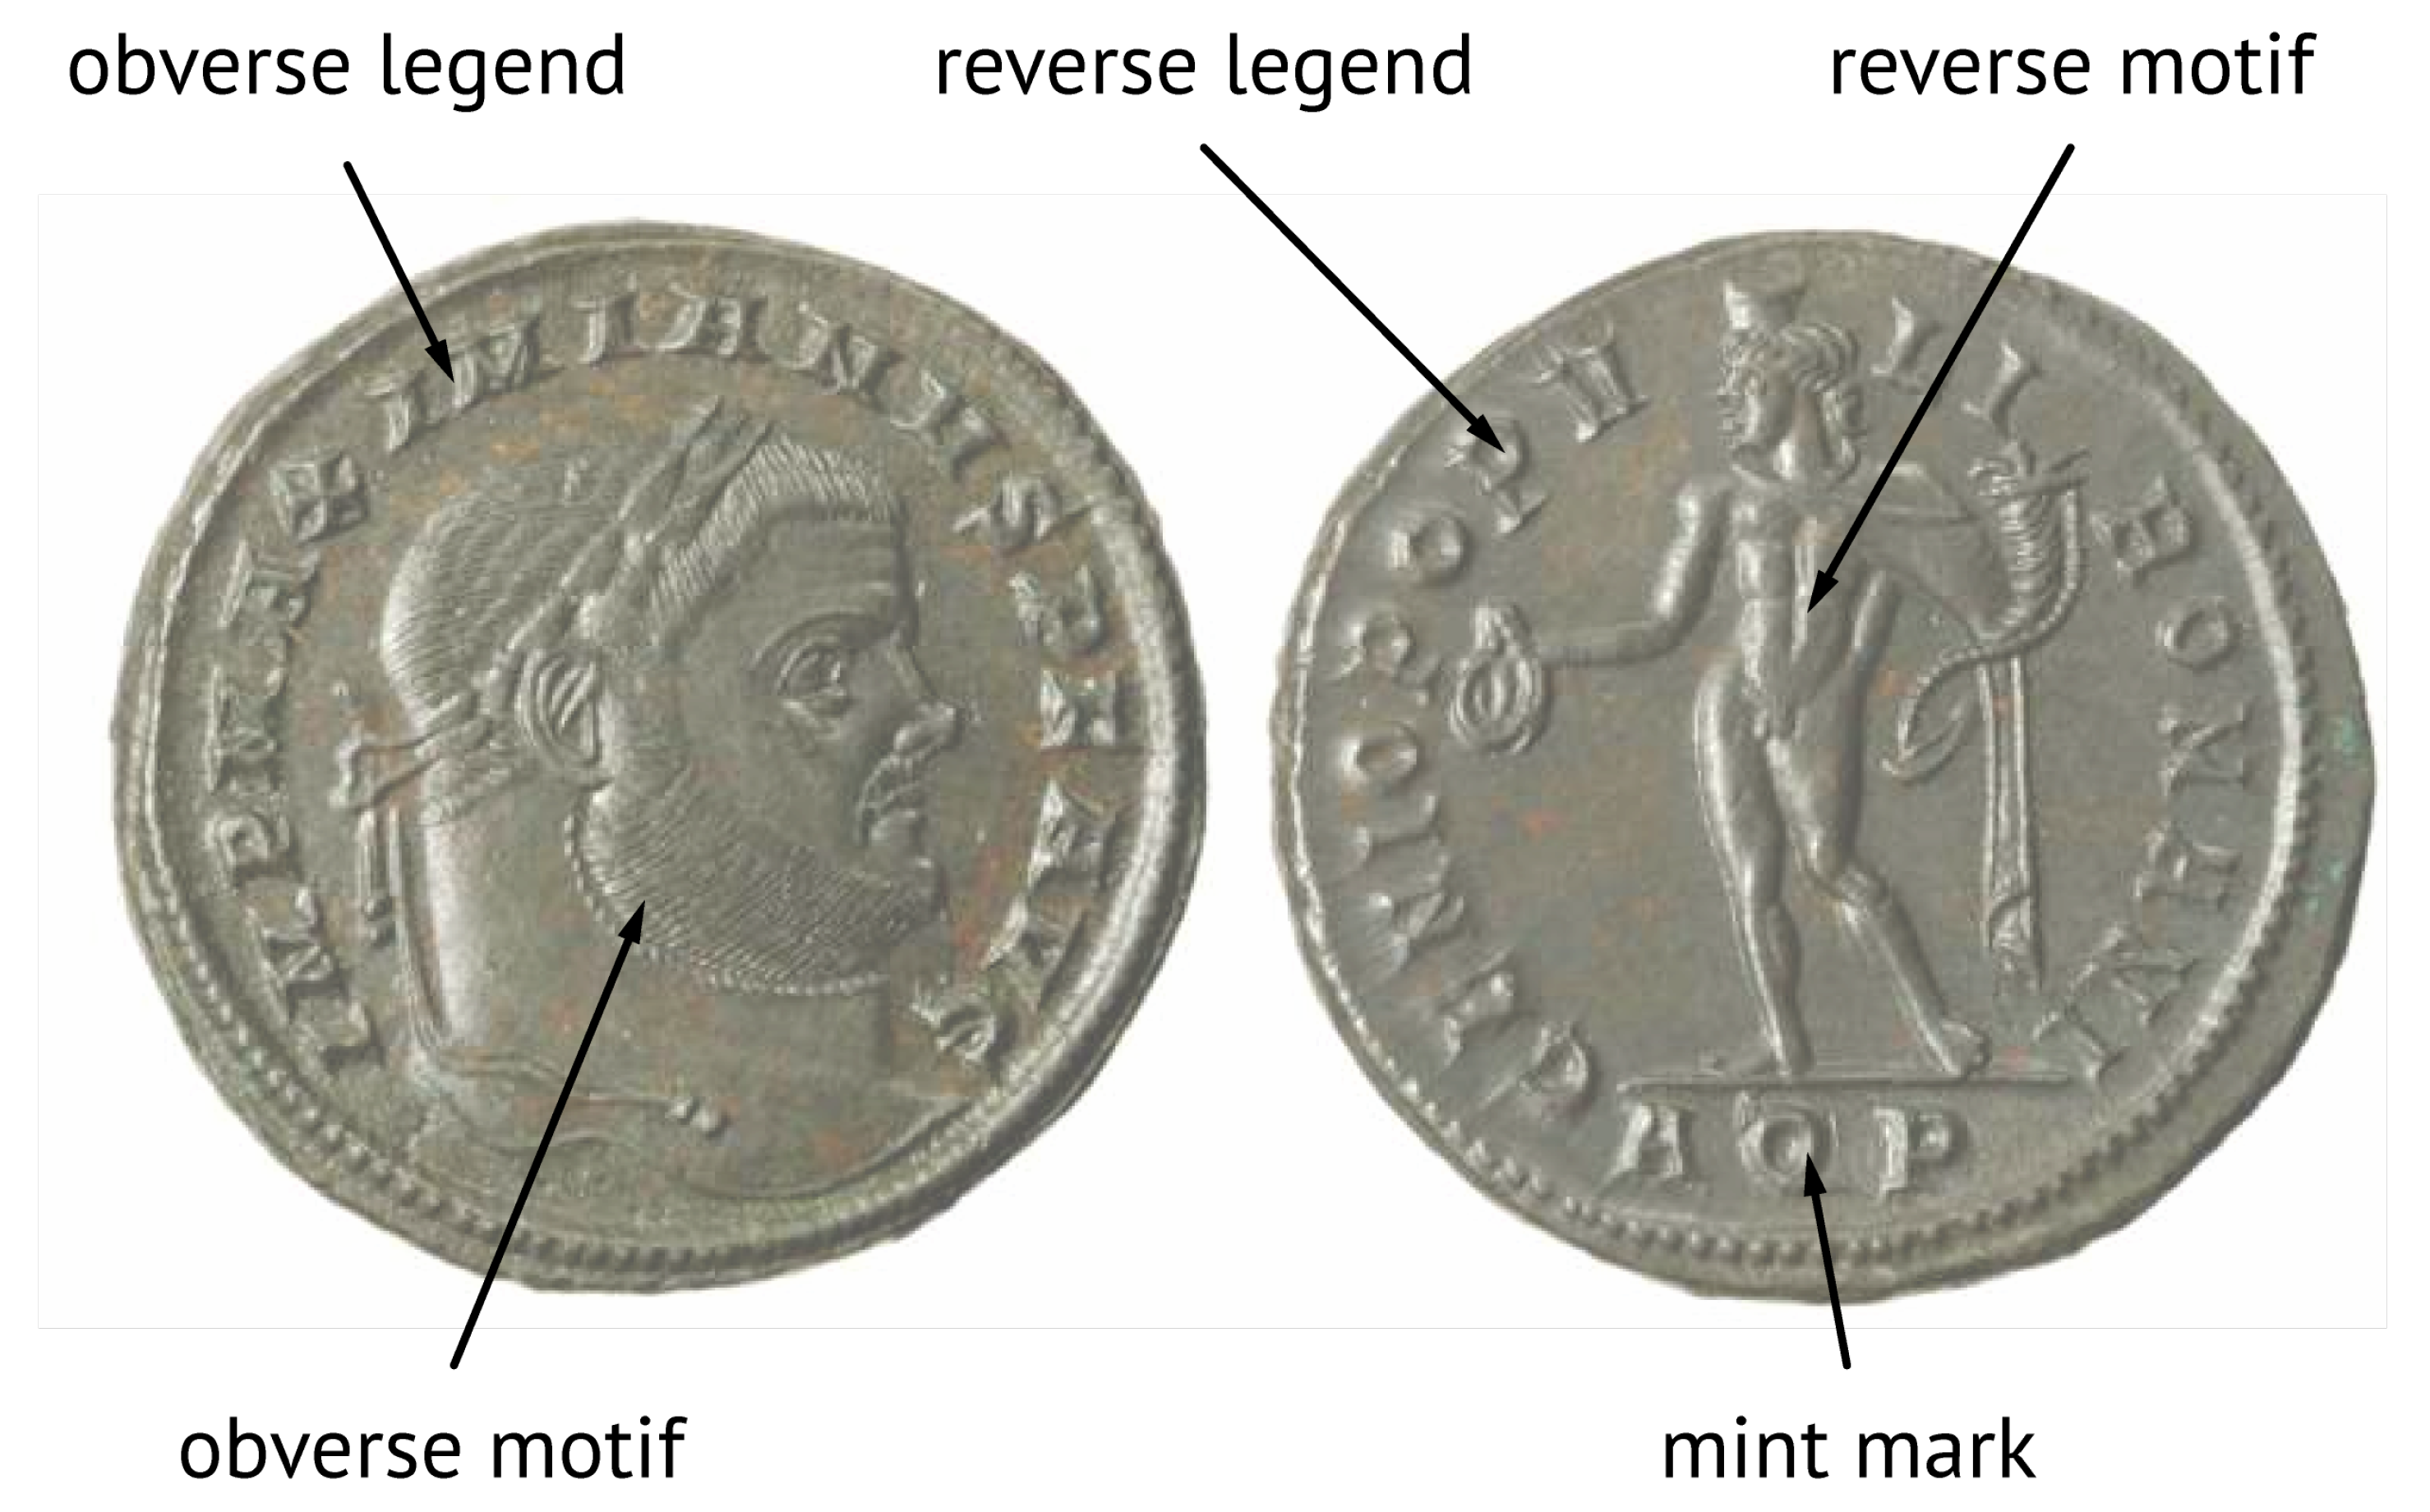
Individual ancient coins of the same type can vary widely in appearance due to centering, wear, patination, and variance in artistic depiction of the same semantic elements. This poses a range of technical challenges and makes it difficult to reliably identify which concepts are depicted on a given coin using machine learning and computer vision based automatic techniques [2]. For this reason, ancient coins are typically identified and classified by professional dealers or scholars, which is a time consuming process demanding years of experience due to the specialist knowledge required. Human experts attribute a coin based on its denomination, the ruler it was minted under and the time and place it was minted. A variety of different characteristics are commonly used for attribution (see Figure 1), including:
- Physical characteristics such as weight, diameter, die alignment and color,
- Obverse legend, which includes the name of the issuer, titles or other designations,
- Obverse motif, including the type of depiction (head or bust, conjunctional or facing, etc.), head adornments (bare, laureate, diademed, radiate, helmet, etc.), clothing (draperies, breastplates, robes, armour, etc.), and miscellaneous accessories (spears, shields, globes, etc.),
- Reverse legend, often related to the reverse motif,
- Reverse motif (primary interest herein), e.g., person (soldier, deity, etc.), place (harbour, fortress, etc.) or object (altar, wreath, animal, etc.), and
- Type and location of any mint markings.
Relevant Prior Work
Most existing algorithmic approaches to coin identification are local feature based [3,4,5] which results in poor performance due to loss of spatial relationships between elements [2]. In particular, this loss is engendered by the manner in which local information is aggregated to constitute a global description of an entire coin. Following general object recognition methods in the previous literature, usually the space of local descriptors is partitioned by clustering which allows histograms over this discretized space to be formed [6,7]. To overcome this limitation in capturing global geometric relationships, approaches which divide a coin into segments have been proposed, but these assume that coins are perfectly centred, accurately registered, and nearly circular in shape [8]. Recent work shows that existing approaches perform poorly on real world data because of the fragility of such assumptions [8]. Although the legend can be a valuable source of information, relying on it for identification is problematic because it is often significantly affected by wear, illumination, and minting flaws [9]. Lastly, numerous additional challenges emerge from the process of automatic data preparation, e.g., segmentation, normalisation of scale, orientation, and colour [10].
In the context of the present work, it is particularly important to note that all existing work in this area is inherently limited by the reliance on visual matching [2,11,12,13,14] and the assumption that the unknown query coin is one of a limited number of gallery types. However, this assumption is unrealistic as there are tens of thousands of different coin types [15] (Online Coins of the Roman Empire, a joint project of the American Numismatic Society and the Institute for the Study of the Ancient World at New York University, lists 43,000 published types). Hence, herein, our idea is to explore the possibility of understanding the artistic content depicted on a coin, which could then be used for subsequent text based matching, allowing access to a far greater number of coin types without requiring them to be represented in the training data. In short, our ultimate aim is to describe a coin in the same way that a human expert would—by identifying the individual semantic elements depicted thereon. We believe that this approach is hitherto unseen in the published literature and our work the first to attempt this task to date.
2. Problem Specification, Constraints, and Context
A neural network (an instance of which is often referred to as a model) is a system loosely modelled on the mammalian brain, consisting of a number of layers through which data is passed. It consists of an input layer, some number of hidden layers, and an output layer. It can be thought of as a complex function that takes a number of parameters for which we want to find the optimal values. Each layer contains several nodes (sometimes called neurons), which take input data and transform it using an activation function in order to introduce non-linearity into the network. Each of these nodes are connected to the nodes in the previous layers by links, which multiply the output of the previous node by a weight.
The weights of these links are the parameters that we want to learn during the training stage, such that the loss function (a measure of the difference between the actual prediction of the trained network and what we want to train it to predict) is minimized. We do this using backpropagation—an algorithm which calculates the partial derivative (AKA the slope) of the loss function with respect to each weight. Each weight is then adjusted in such a way that the gradient of the slope decreases—a technique more commonly known as gradient descent. This process is repeated over many data samples until the loss converges.
Deep learning loosely refers to neural networks with many layers, which enables them to identify high level features present in the data. This approach has proven successful across a range of tasks, including recommendation systems, language processing, pattern recognition of many kinds and computer vision [16].
There are many possible ways of designing neural networks—but the number of nodes and layers and the way in which they are linked must be selected with regard to the task at hand. All modern work in deep learning applied to images uses deep convolutional neural networks (DCNNs), a type of deep neural network which is constructed from some number of convolutional layers interspersed with pooling layers, followed by a few dense layers. The convolutional and pooling layers are collectively responsible for learning visual features in the input data (in our case, these features would be the shape of a cornucopia, or a patera, or a shield, etc.), and the fully connected layers then use those features to output a prediction. DCNNs have been fruitfully applied to many different domains in which predictions can be made from visual data, from digital diagnostics to facial recognition.
Recent pioneering work applying DCNNs to coin images has demonstrated extremely promising results, outperforming more traditional approaches by an order of magnitude [17]. A major difference in the nature of the challenge we tackle here is that our data set is weakly supervised—that is, samples are labelled only at the image level by a corresponding largely unstructured textual description, even though the actual semantic elements of interest themselves occupy a relative small area of the image. These kinds of data are much more abundant and easier to obtain than fully supervised data (pixel level labels) but pose a far greater challenge.
2.1. Challenge of Weak Supervision
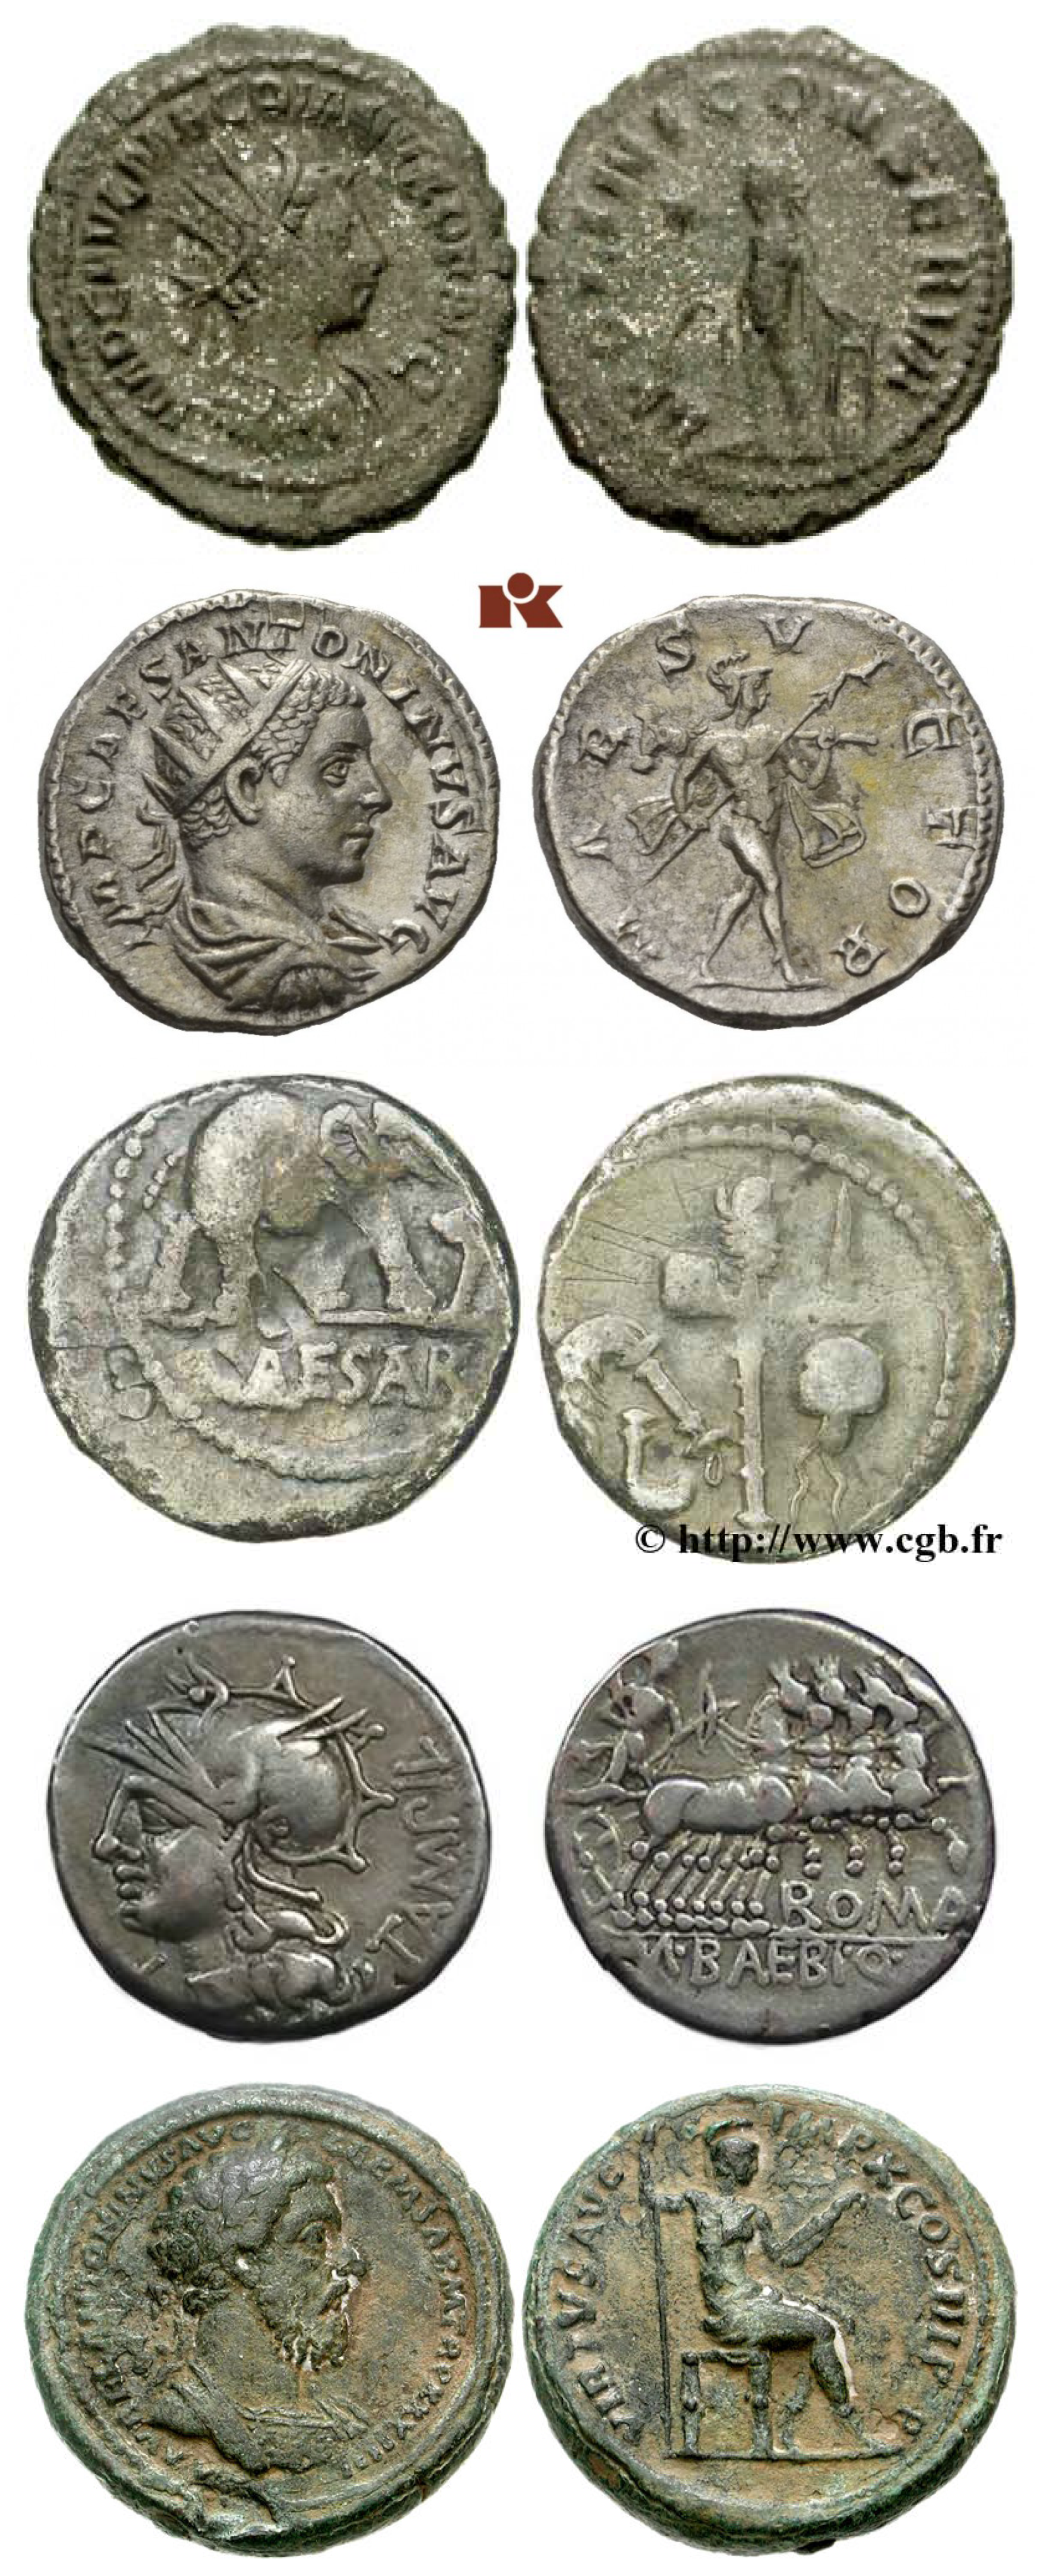
Recall that our overarching goal is to identify the presence of various important semantic elements on an unknown query coin’s reverse. Moreover, we are after a scalable approach—one which could be used with a large and automatically extracted list of elements. As this is the first attempt at solving the suggested task, we chose to use images which are relatively uncluttered, thus disentangling the separate problems of localizing the coin in an image and segmenting it out. Representative examples of images used can be seen in Figure 2.
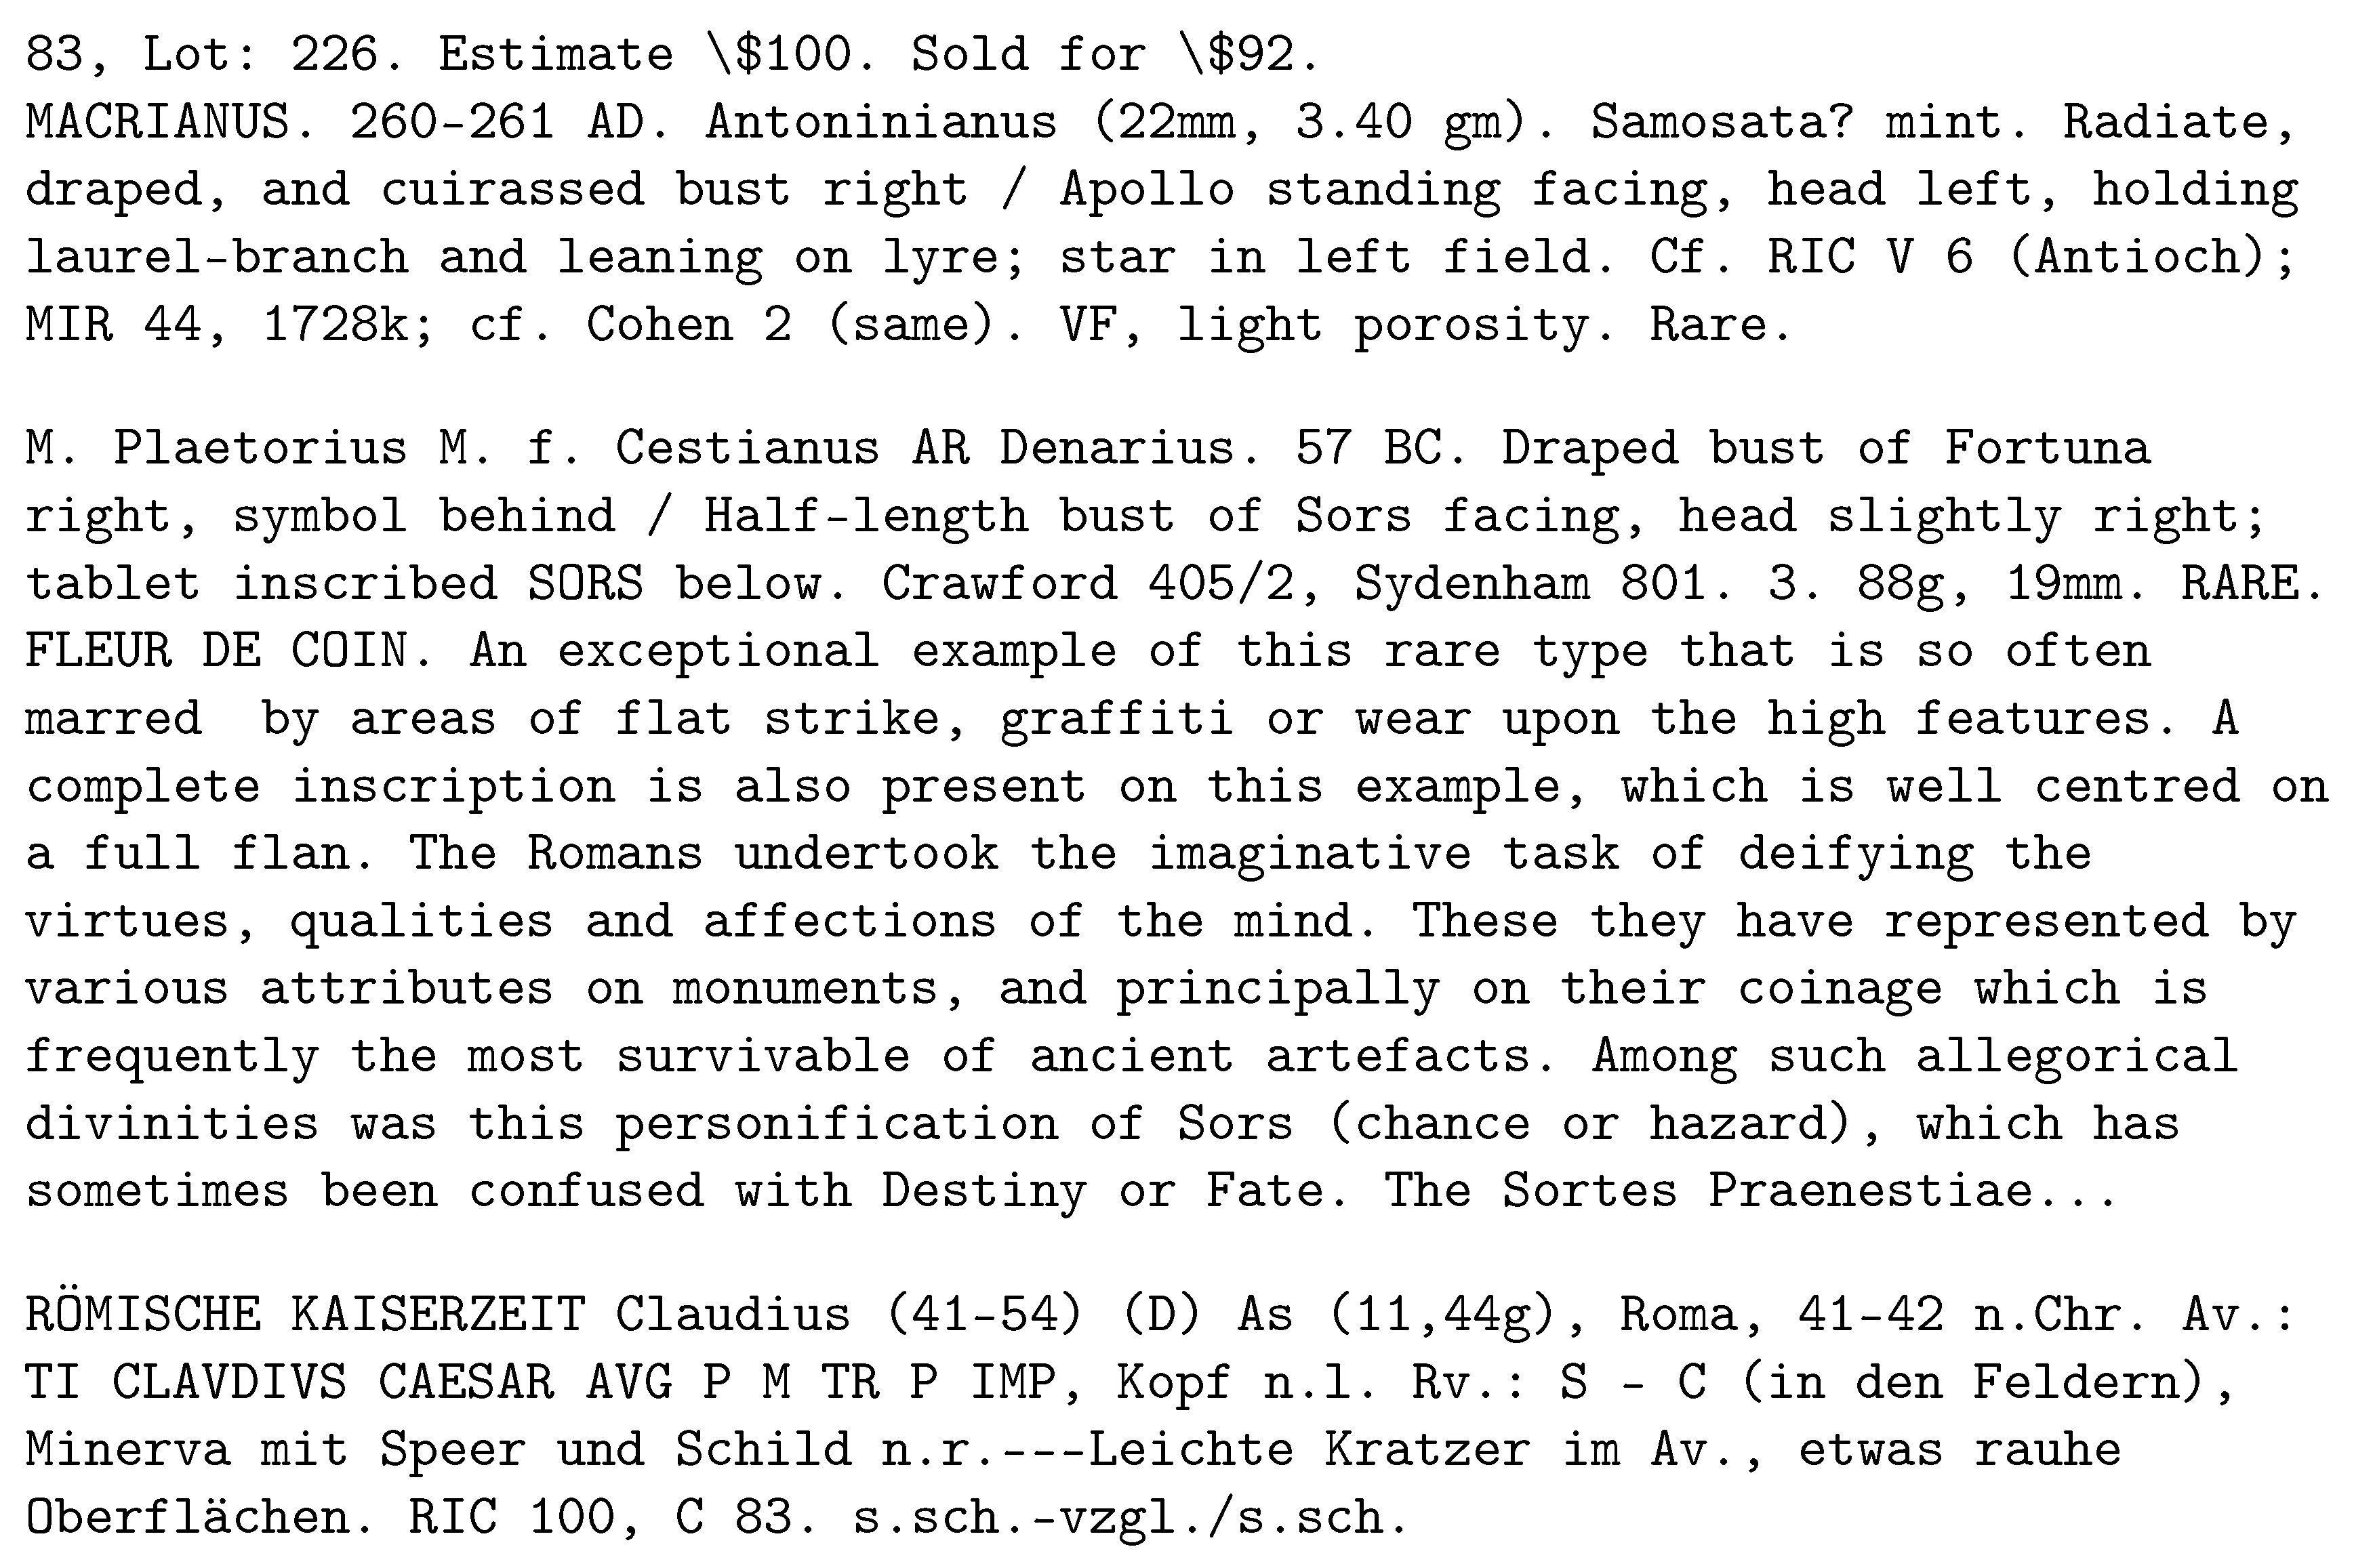
To facilitate the automatic extraction of salient semantic elements and the learning of their visual appearance, each coin image is associated with an unstructured text description of the coin, as provided by the professional dealer selling the coin; see Figure 3. The information provided in this textual meta-data varies substantially—invariably it includes the descriptions of the coin’s obverse and reverse, and the issuing authority (the person, usually emperor, on the obverse), but it may also feature catalogue references, minting date and place, provenance, etc.
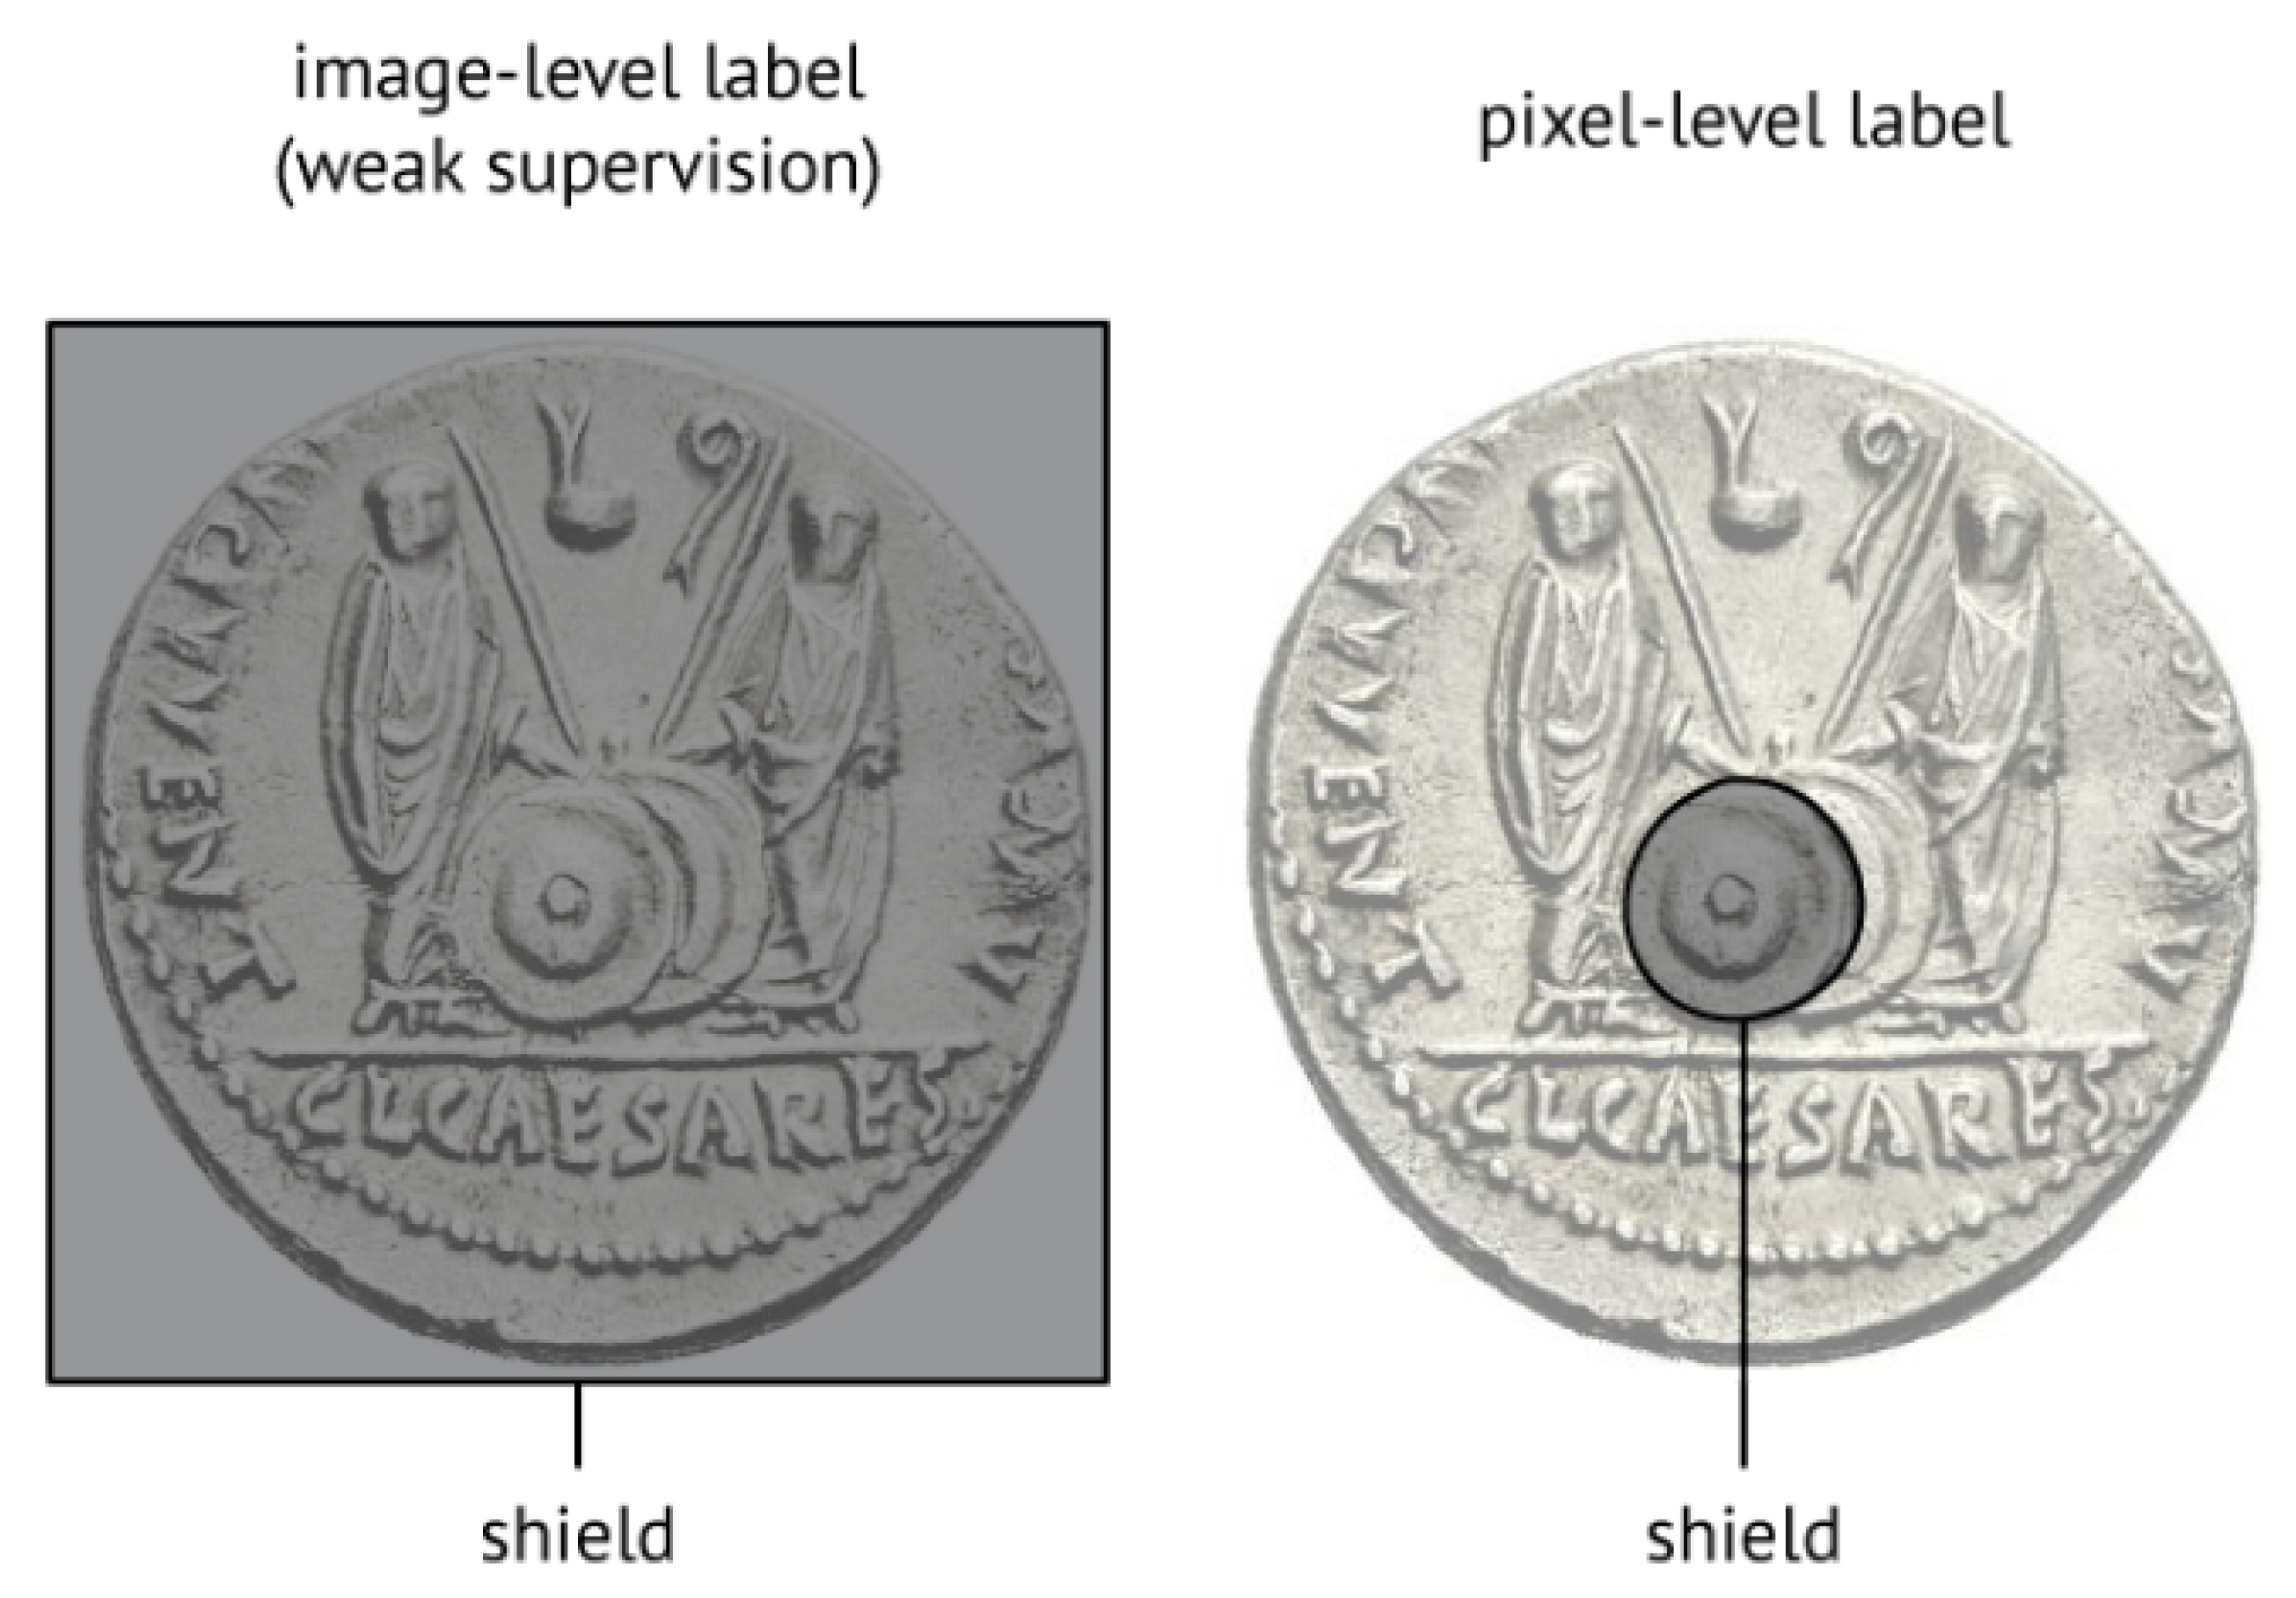
We have already emphasized the practical need for a scalable methodology. Consequently, due to the nature of the available data (which itself is representative of the type of data which can be readily acquired in practice), at best it is possible to say whether a specific semantic element (as inferred from text; see next section) is present in an image or not, see Figure 4. Due to the amount of human labour required it is not possible to perform finer labelling i.e. to specify where the element is, or its shape (there are far too many possible elements and the amount of data which would require labeling is excessive), necessitating weak supervision of the sort illustrated in Figure 4.
2.2. Data Pre-Processing and Clean-Up
As in most real-world applications and unstructured, loosely standardized, and heterogeneous data, a major challenge in the broad domain of interest in the present work is posed by possibly erroneous labeling, idiosyncrasies, etc. Hence, robust pre-processing and clean-up of data is a crucial step for facilitating learning.
2.2.1. Image Based Pre-Processing
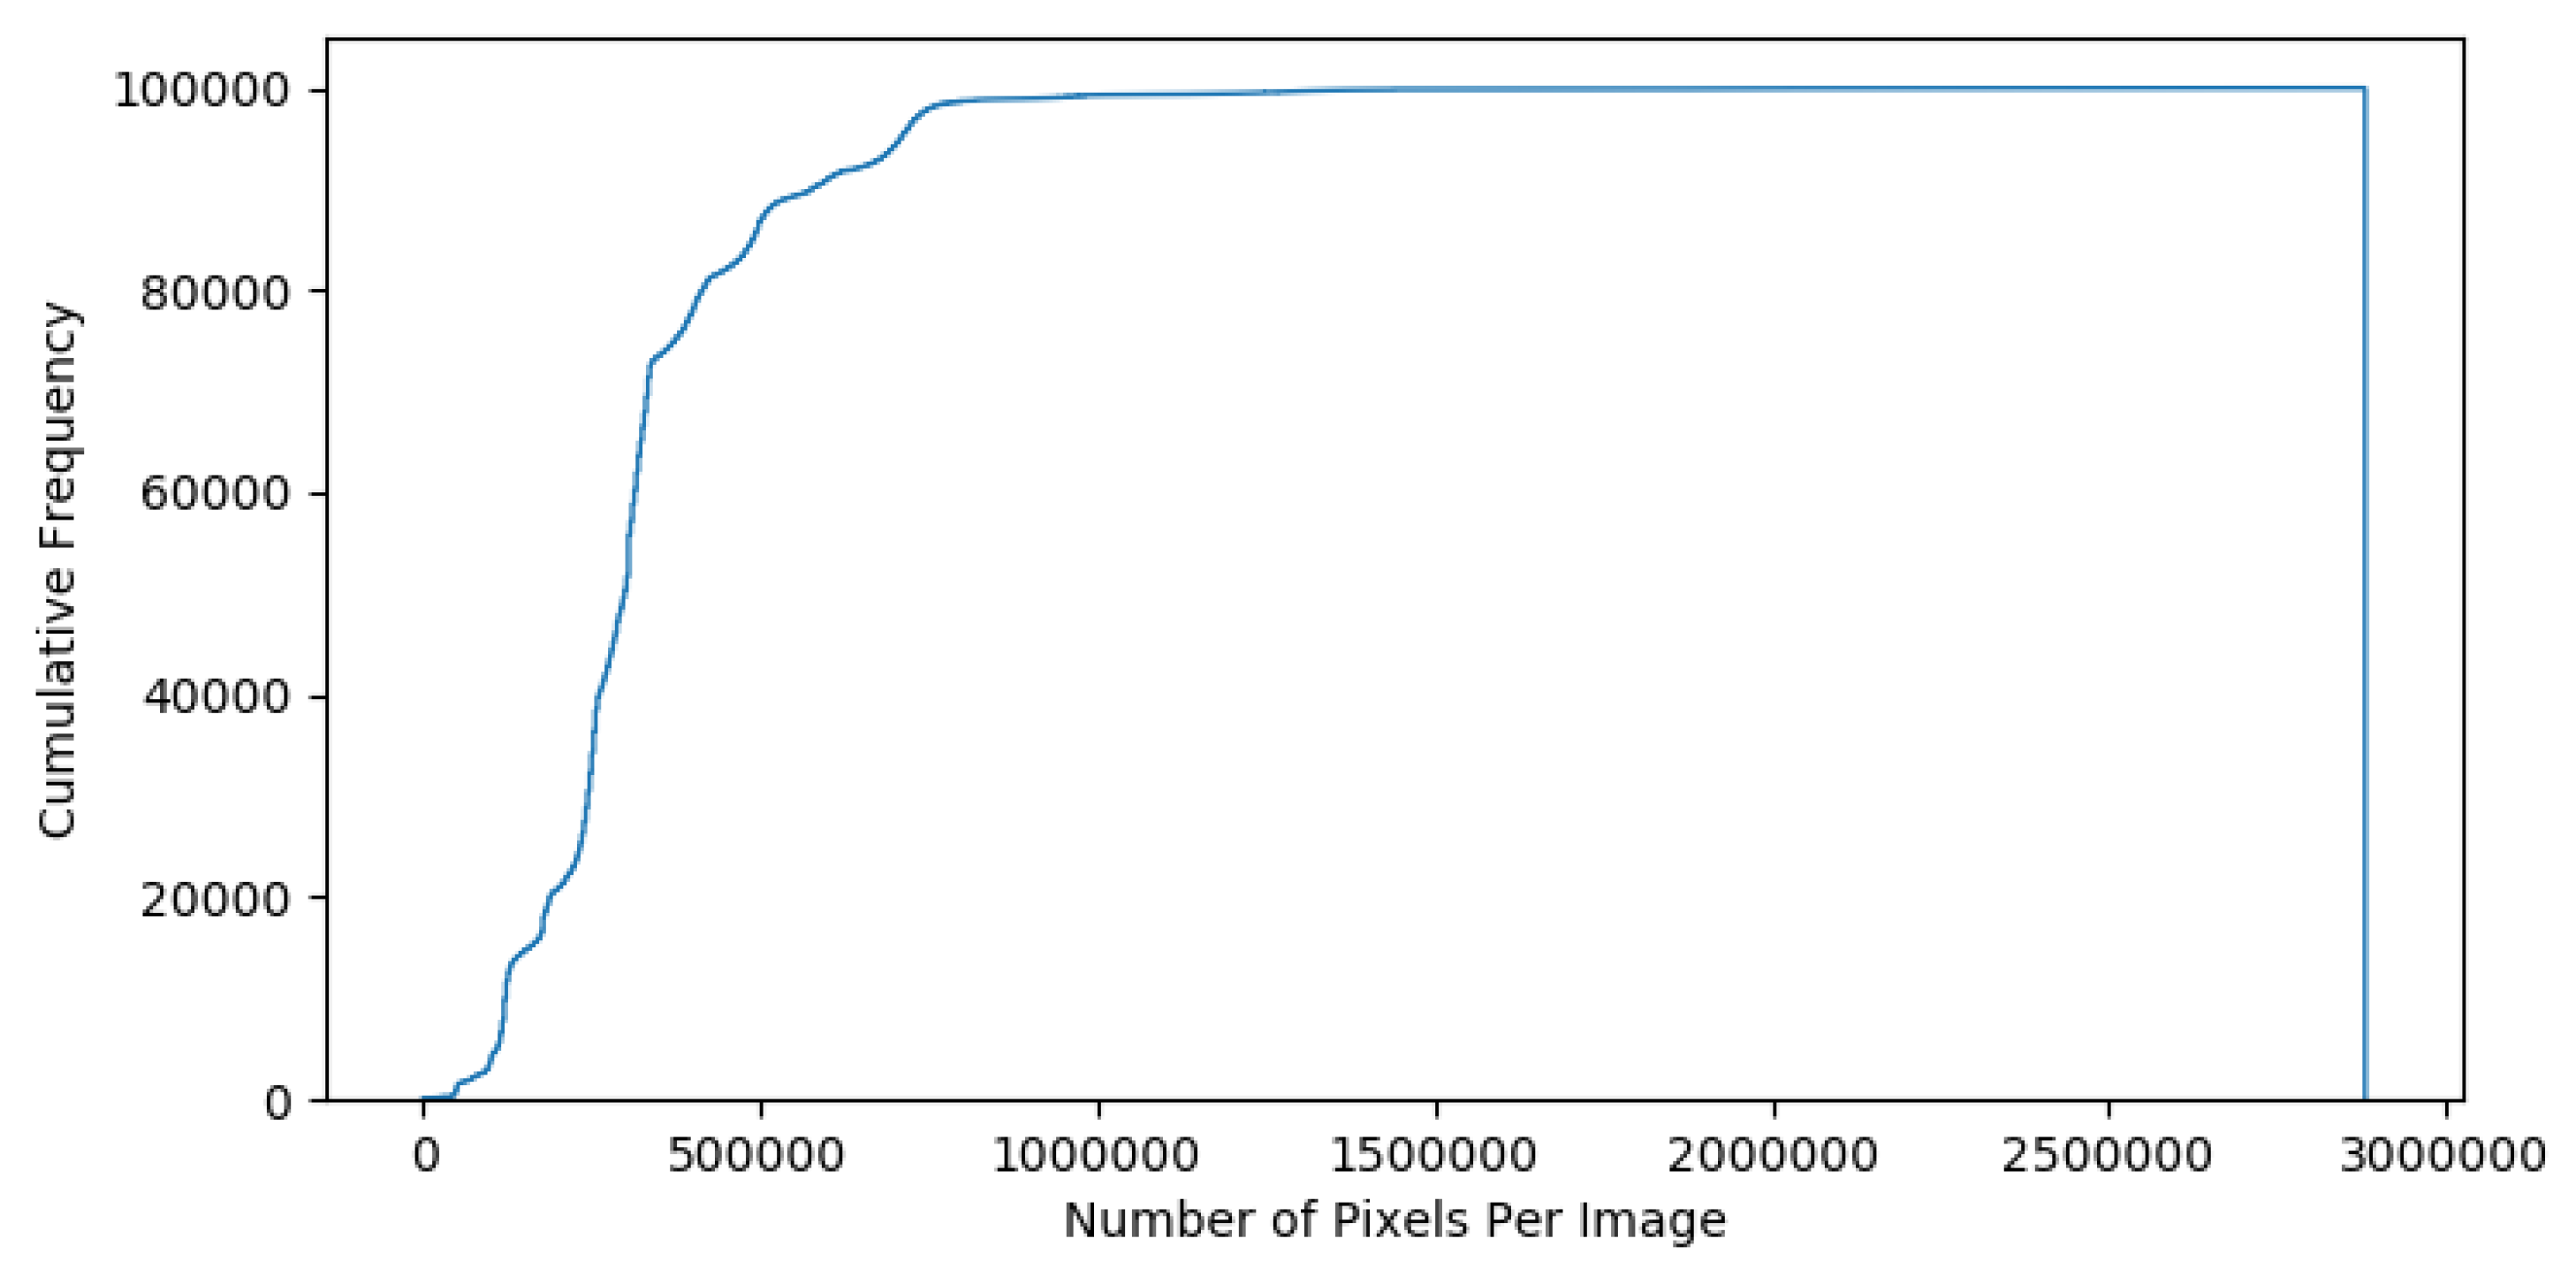
The images in our corpus vary in size (see Figure 5) with a minimum size of pixels and a maximum of pixels, so we begin by cropping all images to the square bounding box which contains just the reverse of the corresponding coin, and isotropicaly resizing the result to the uniform scale of pixels. The obverse of a coin typically depicts the bust of an emperor, whilst the reverse contains the semantic elements of interest herein.
2.2.2. Text Based Extraction of Semantics
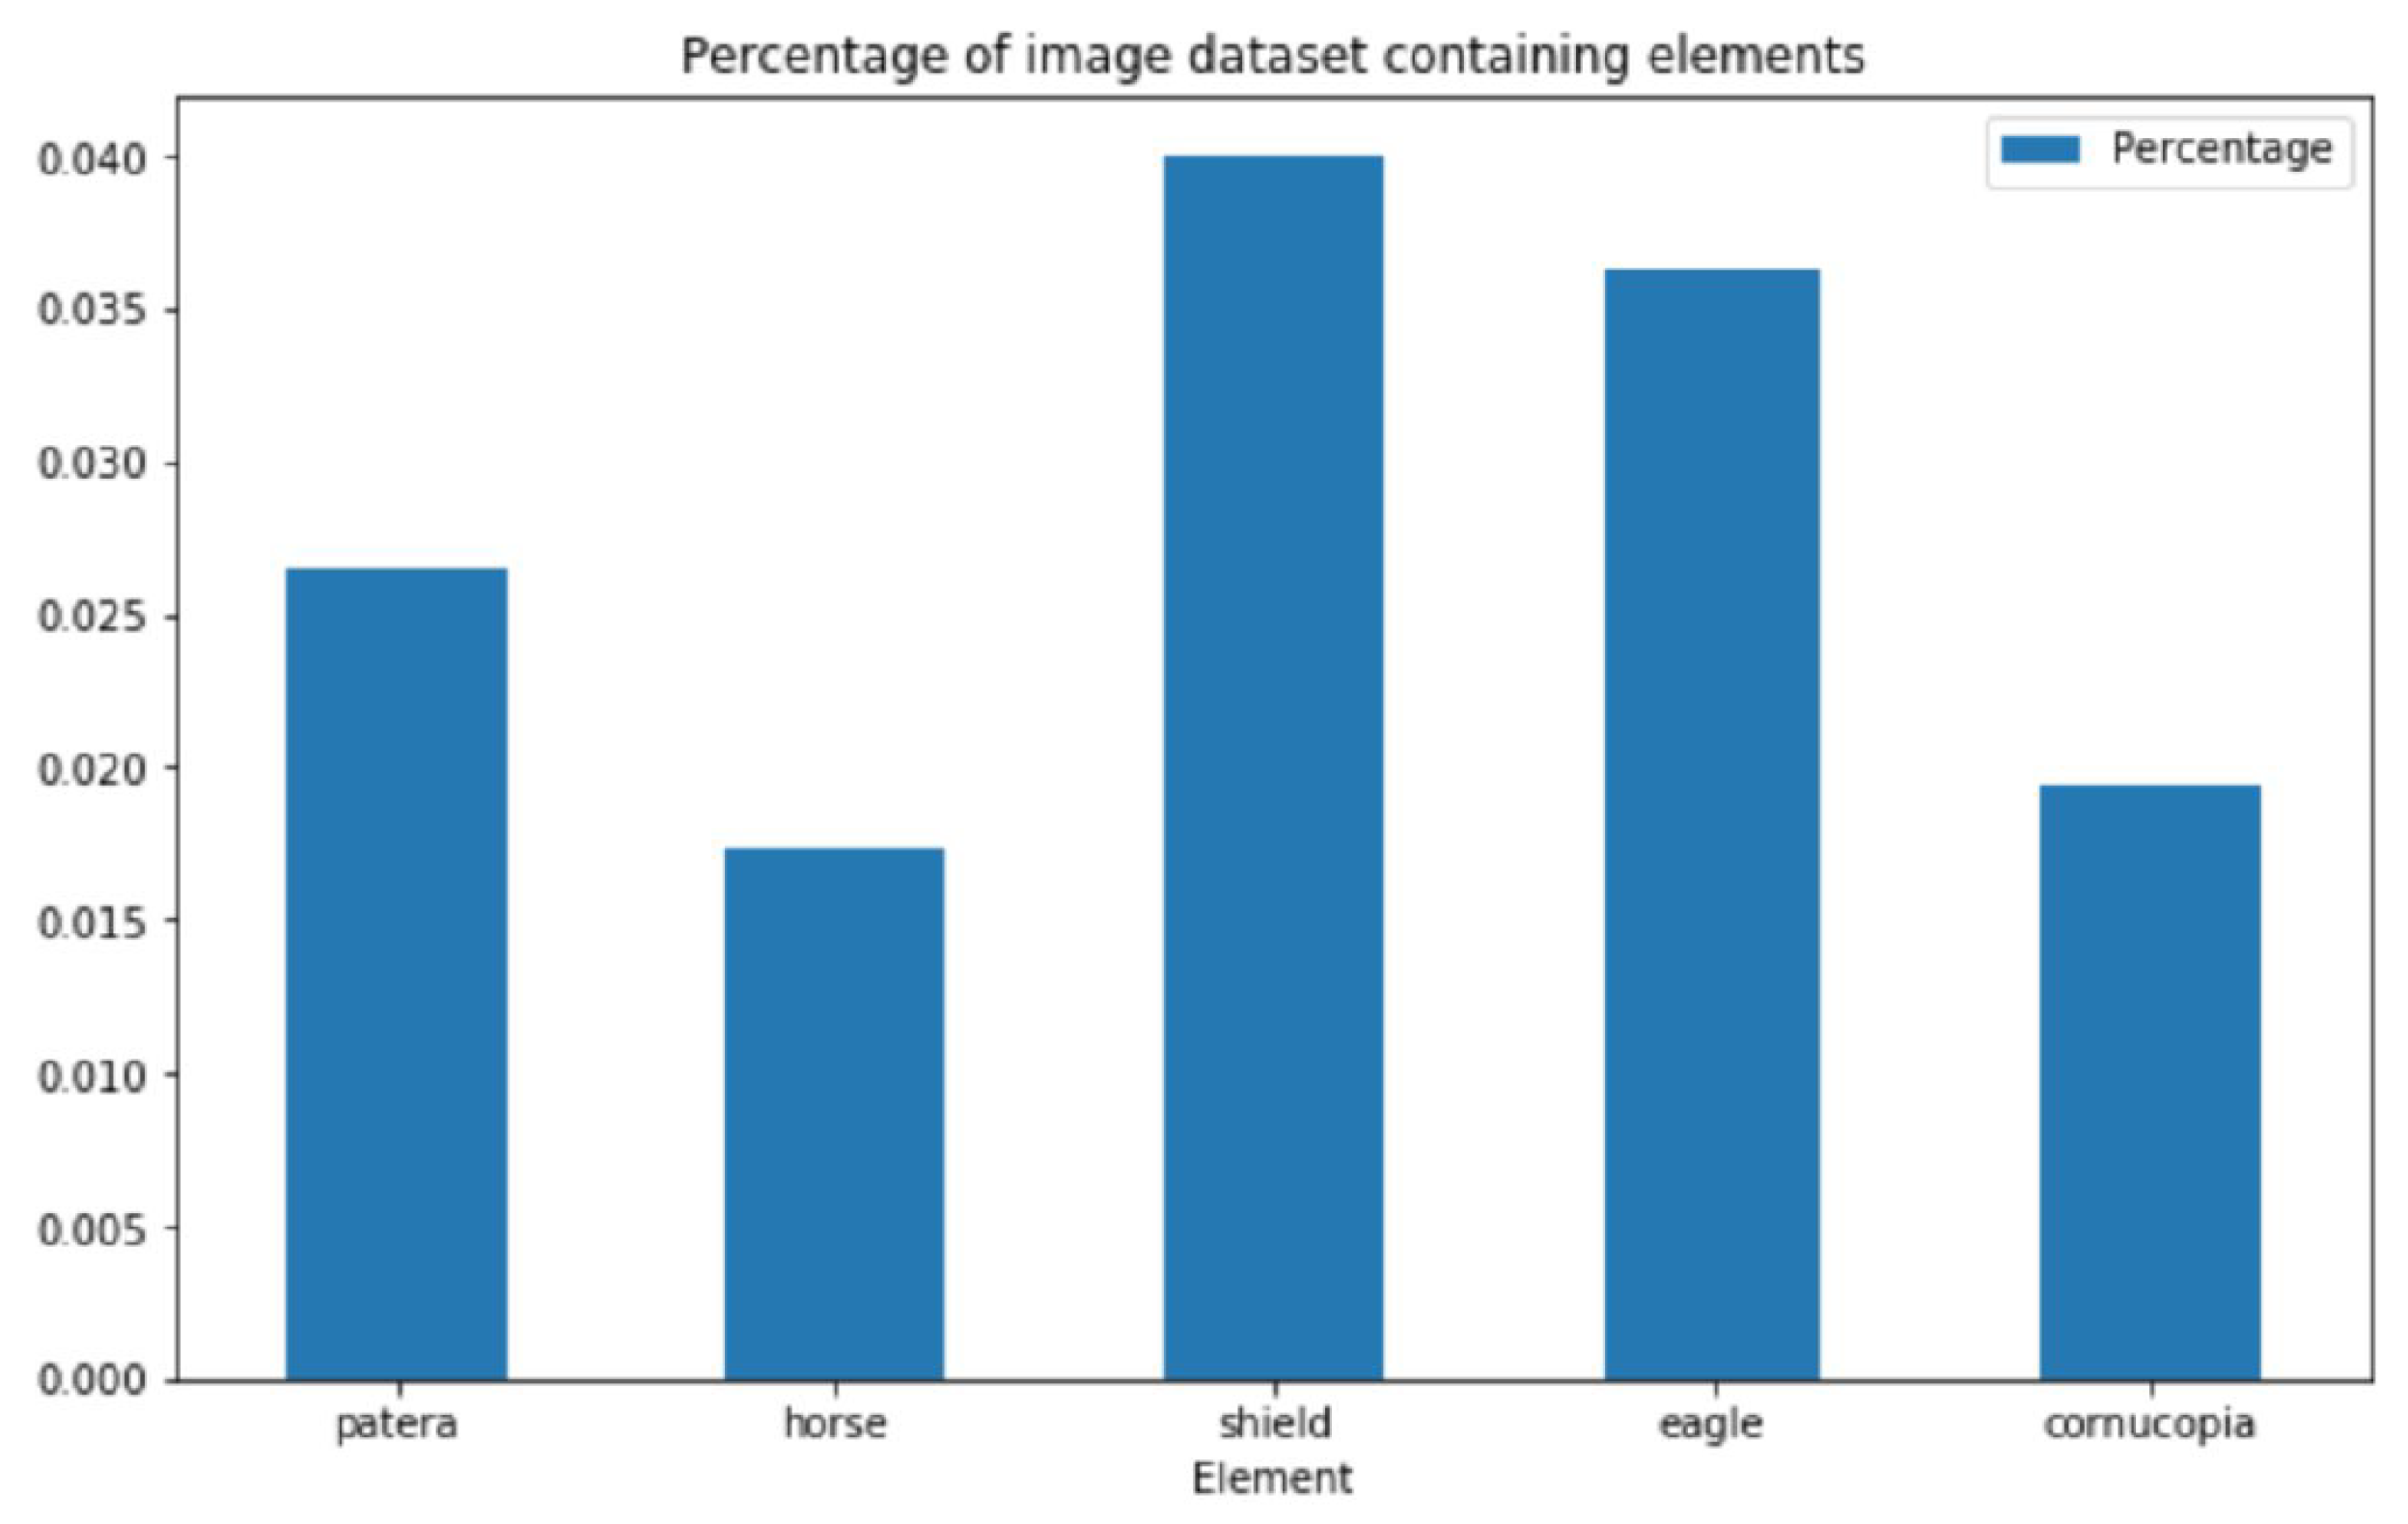
In order to select which semantic elements to focus on, we use the unstructured text files to analyse the frequency of word occurrences and, specifically, focus on the five most common concepts, see Figure 6 and Figure 7. Considering that the present work is the first attempt at addressing the problem at hand, the aforementioned decision was made in order to ensure that sufficient training data is available.
Clean-Up and Normalisation of Text Data
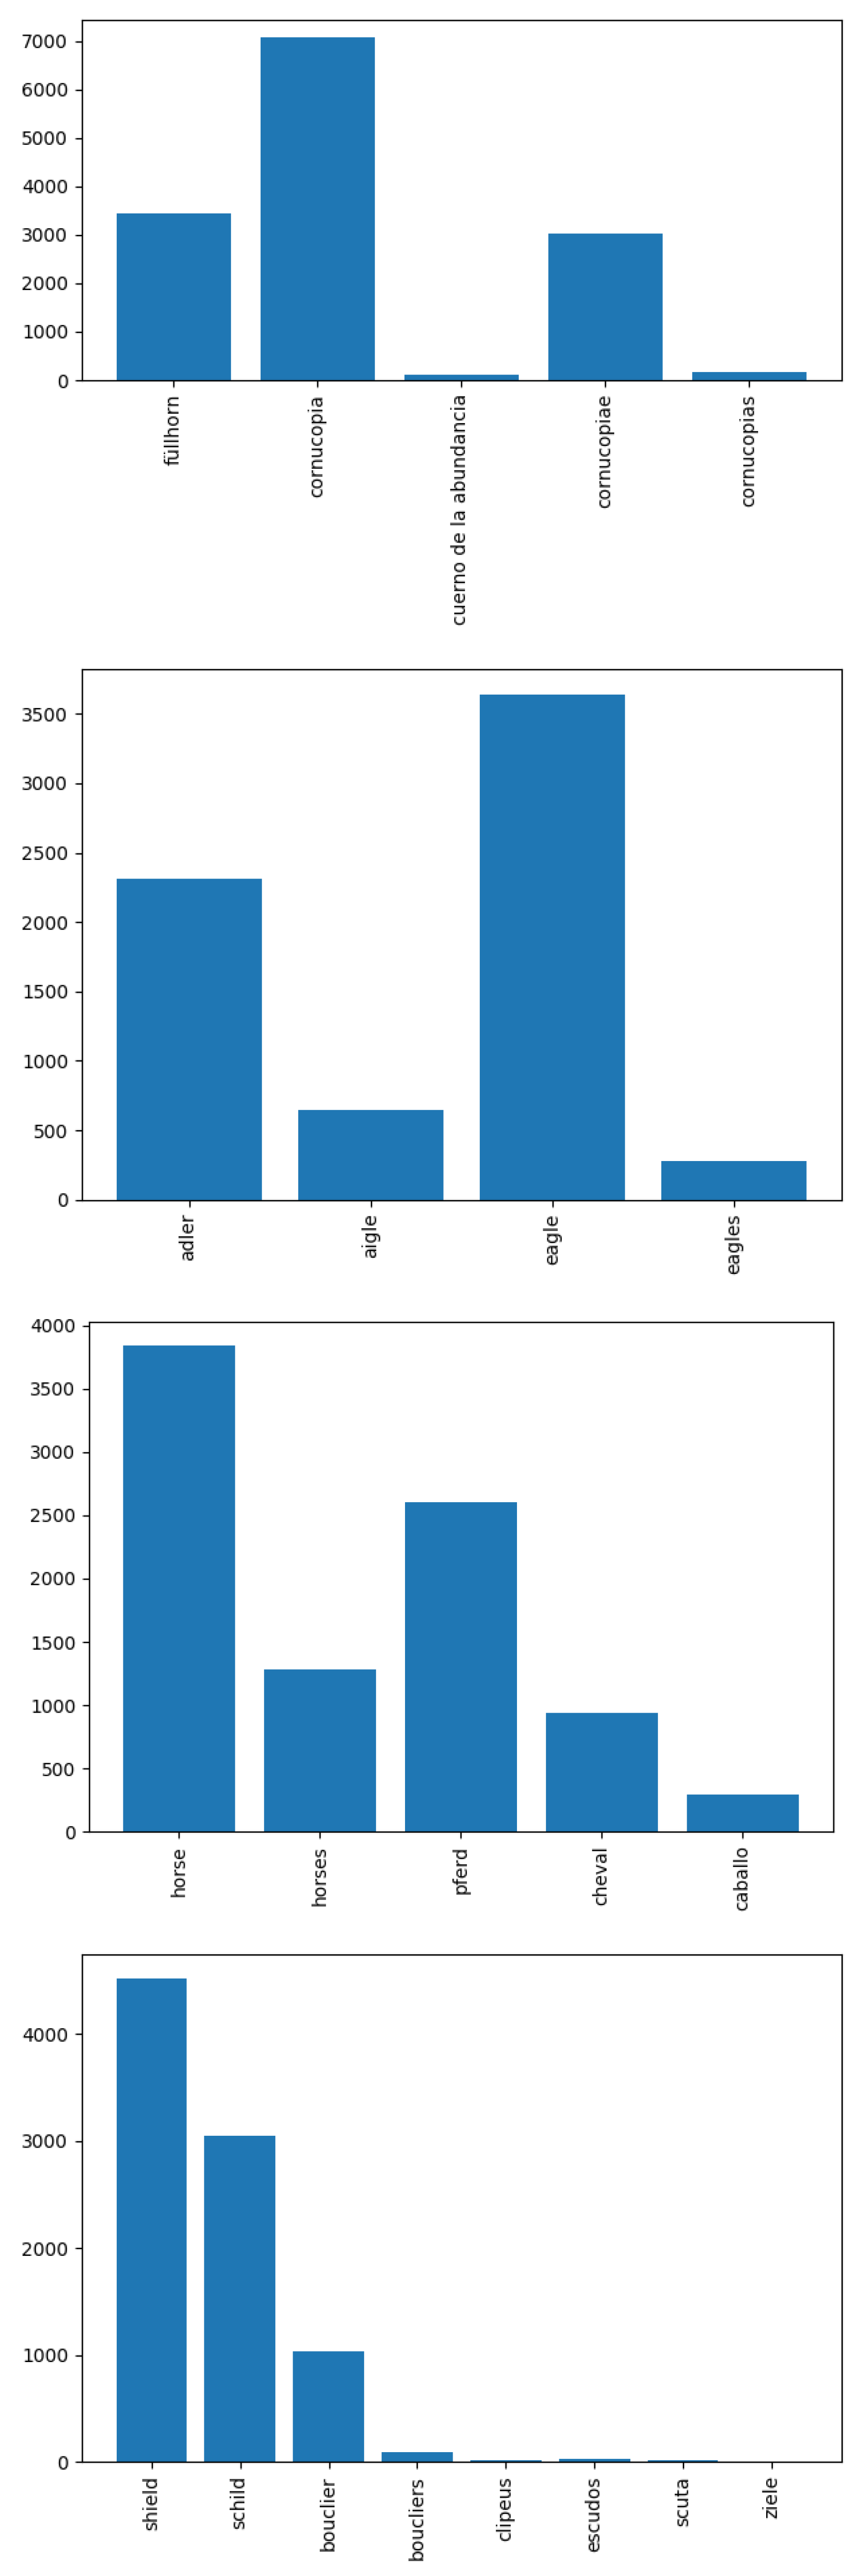
To label the data, we first clean the attribution text files to remove duplicate words and punctuation. Because the data included attributions in French, Spanish, German and English, we employ a translation API (googletrans) to generate translations of each keyword. Thus, when building the data set used to learn the concept of ‘horse’, images with associated text which contains the words ‘horse’, ‘caballo’, ‘cheval’ and ‘pferd’ are also included as positive examples, making better use of available data—see Figure 8. Plurals, synonyms and other words strongly associated with the concept in question (e.g., ‘horseman’), and their translations are also included.
2.2.3. Randomization and stratification
We shuffle the samples before building five training, validation and test sets—one for each of the selected elements. To address under-representation of positive examples (images which contain the element in question), we use stratified sampling to ensure equal class representation [18], matching the number of positive samples for each class with randomly selected negative samples (i.e. any image not containing the element). This provides us with datasets for each element of the following sizes:
‘horse’: 17,978; ‘cornucopia’: 13,956; ‘patera’: 5330; ‘eagle’: 14,028; ‘shield’: 17,546
each of which we split with a ratio of 70% training set, 15% validation set and 15% test set.
2.3. Errors in Data
In the context of the present problem as in most large scale, real-world applications of automatic data analysis, even after preprocessing, the resulting data will contain a certain portion of erroneous data. Errors range in nature from incorrect label assignments to incorrectly prepared images.
To give a specific example, we observed a number of instances in which the keyword used to label whether or not a given coin image contains the element in question was actually referring to the obverse of the coin, rather than the reverse, with which we are concerned. This ambiguity is most prevalent with shields, and leads to incorrect labelling when building the corresponding data sets. Our premise (later confirmed by empirical evidence) is that such incorrect labelling is not systematic in nature (c.f. RANSAC [19]) and thus that the cumulative effect of a relatively small number of incorrect labels will be overwhelmed by the coherence (visual and otherwise) of correctly labelled data.
We also found that some of the original (unprocessed) images were unusually laid out in terms of the positioning of the corresponding coin’s obverse and reverse, which thus end up distorted during preprocessing. However, these appear to be almost exclusively of the auction listing type described above, and as such would be labelled as negative samples and therefore cumulatively relatively unimportant.
3. Proposed Framework
In this paper we describe a novel deep convolutional neural network loosely based on AlexNet [20] as a means of learning the appearance of semantic elements and thus determining whether an unknown query coin contains the said element or not. Although we do not use this information in the present work for other purposes than the analysis of results, we are also able to determine the location of the element when it is present by generating heatmaps using the occlusion technique [17].
Model Topology
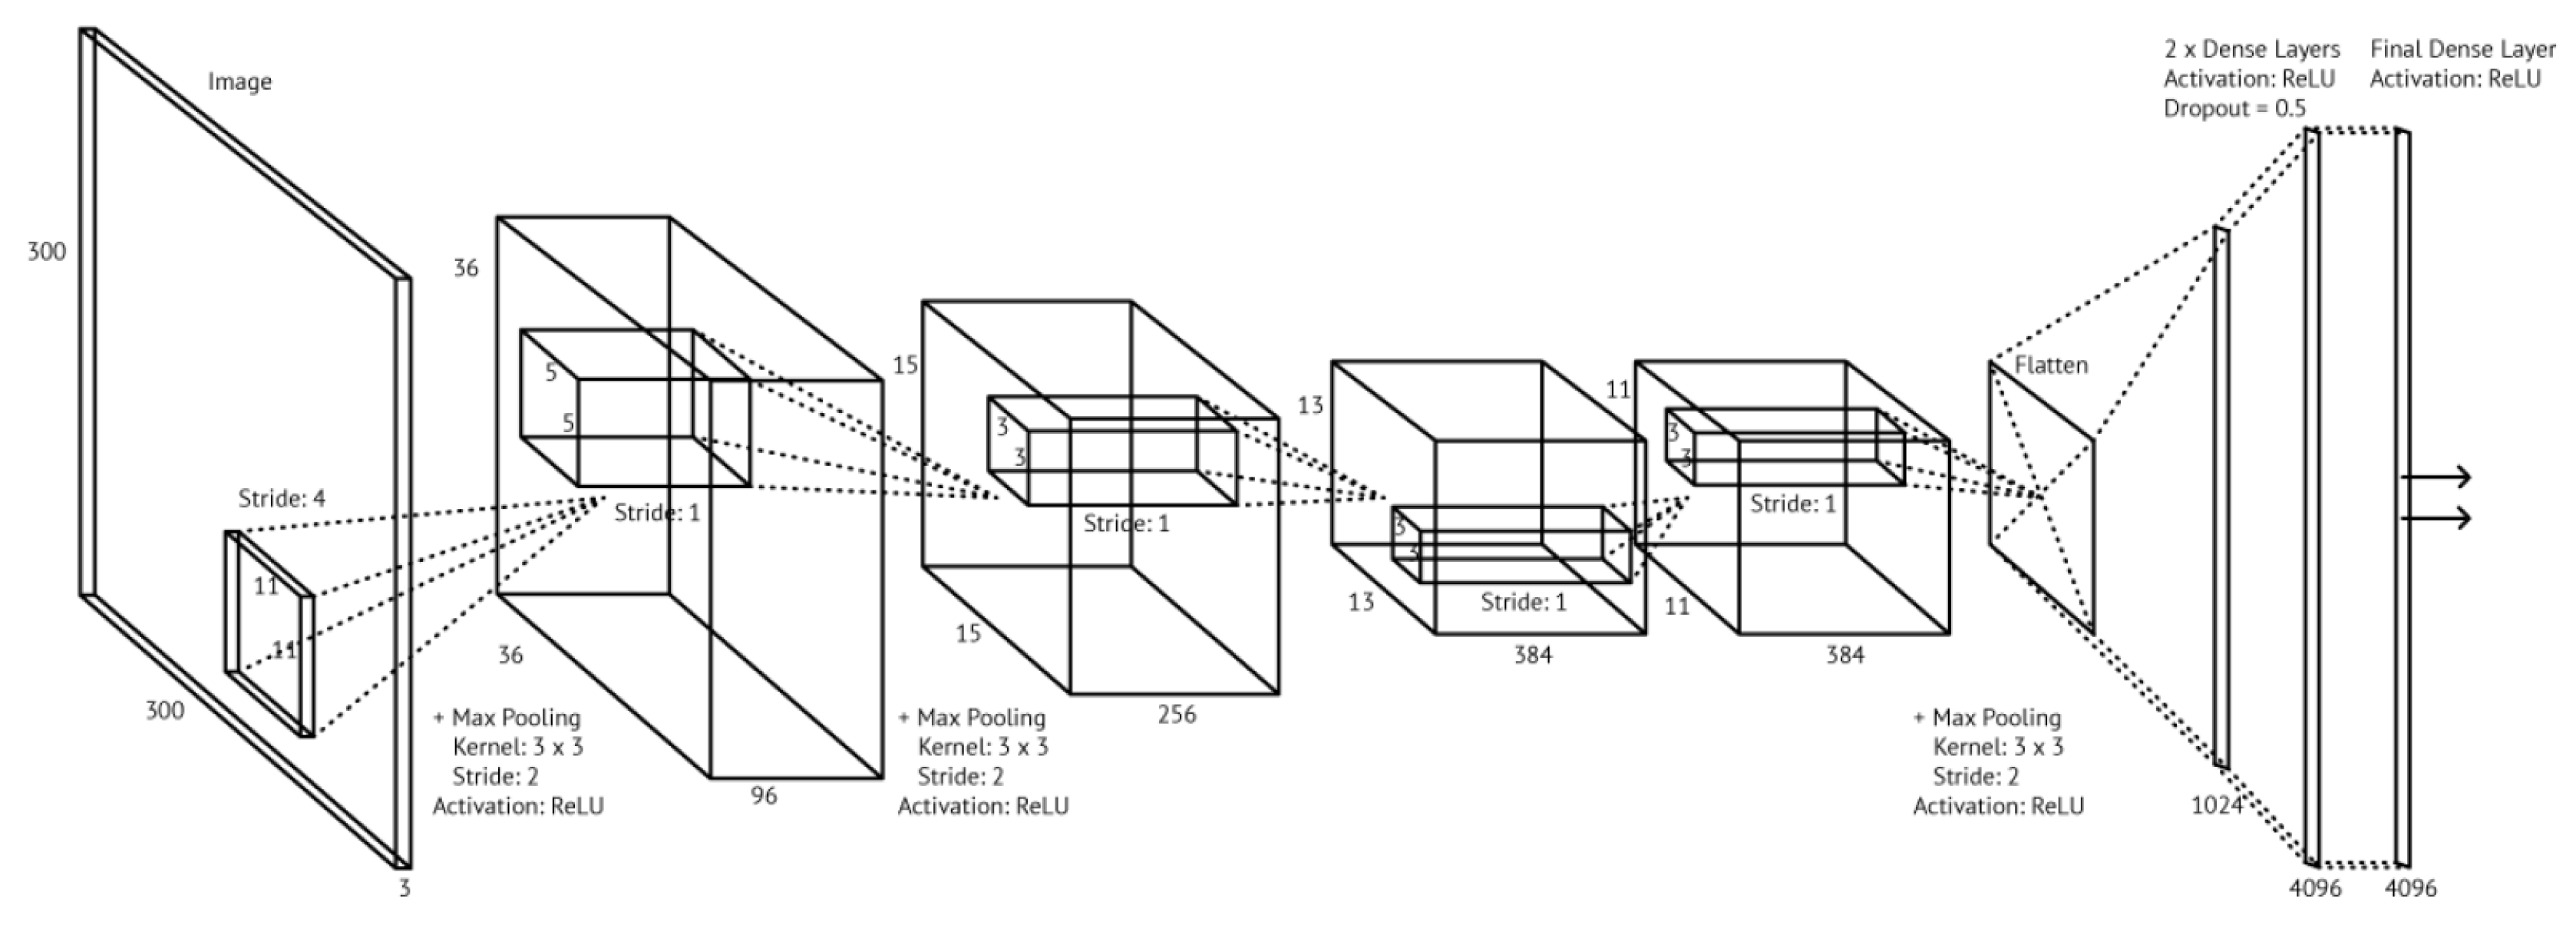
As summarized in Figure 9 and Table 1, our network consists of five convolutional layers (three of which are followed by a max pooling layer), after which the output is flattened and passed through three fully connected layers. The convolutional and pooling layers are responsible for detecting high level features in the input data, and the fully connected layers then use those features to generate a class prediction. We tried various permutations of this, increasing and decreasing the number and width of the layers, and found no improvement which led to the choice of the above topology for the reported experiments and results.
The convolutional layers enable location independent recognition of features in the data. The output of a convolutional layer is dependent on a number of hyperparameters which we specify for each layer. These are the stride, the number of kernels (also called the depth), the kernel size, and the padding. Using multiple kernels is necessary in order to learn a range of features. The complexity of the features we are able to detect depends on the number of convolutional layers present in a network—for example, one can reasonably expect to detect only simple, low-level features such as edges from the original ‘raw’ pixel inputs in the first layer, and then from those edges learn simple shapes in the second layer, and then more complex, higher level features from those simple shapes, and so on.
The pooling layers can be thought of as downsampling—the aim is to reduce the size of the output whilst retaining the most important information in each kernel. Pooling also decreases the complexity of the network by decreasing the number of parameters we need to learn. It also helps to make the network less sensitive to small variations, translations and distortions in the image input. Our design uses max-pooling, where the highest value in each kernel forms one element in the pooling layer output.
The dense layers (also called fully connected layers) transform the high level features learned by the previous layers into a class prediction. To avoid overfitting, the dense layers in our model employ dropout, a regularisation technique which combats overfitting by randomly removing nodes at each iteration. The number of nodes that are removed is determined by a hyperparameter which, guided by previous work on CNNs, we set to 0.5.
We use the batch size of 24, and the maximum number of epochs of 200 which we experimentally found to be more than sufficient, with training invariably ending well before that number is reached. At each epoch, we check if the loss is lower than 0.001, or if there have been 30 epochs in a row with no improvement in the loss (i.e., decrease thereof). If either of the conditions is fulfilled, training is terminated. This is done partly to avoid model overfitting, and partly to save time if a model or a certain set of hyperparameters are clearly not performing well.
The model is trained using adaptive moment estimation (Adam) optimization, a form of gradient descent. This differs from classical stochastic gradient descent, which uses a single learning rate for all weight updates, in that it maintains a moving average of the gradient and the squared gradient (taking two hyperparameters to control the decay rates of these) to compute individual adaptive learning rates for each weight. Adam optimization is computationally efficient and well suited to problems with noisy or sparse gradients, or large amounts of data as in our case [21].
4. Experiments
Experiments discussed in the present section were performed using Asus H110M-Plus motherboard powered by Intel Core i5 6500 3.2GHz Quad Core processor and NVidia GTX 1060 6GB GPU, 8GB RAM. Data comprised 100,000 images and their associated textual descriptions as described above, which were kindly provided to us by the Ancient Coin Search auction aggregator https://www.acsearch.info/. This is by far the largest dataset used to date for problems of this type.
4.1. Results and Discussion
As readily seen from Table 2, our approach achieves a high level of accuracy across training, validation, and test data. The validation and test scores are not significantly lower than the training scores, which suggests little evidence of overfit and indicates a well designed architecture and sufficient data set. The models used to identify cornucopiae and paterae are particularly successful, which is likely due to the low level of variance in artistic depictions of these elements—the orientation, position and style of shields, horses and eagles varies quite a bit, but cornucopiae and paterae are fairly constant in their depiction.
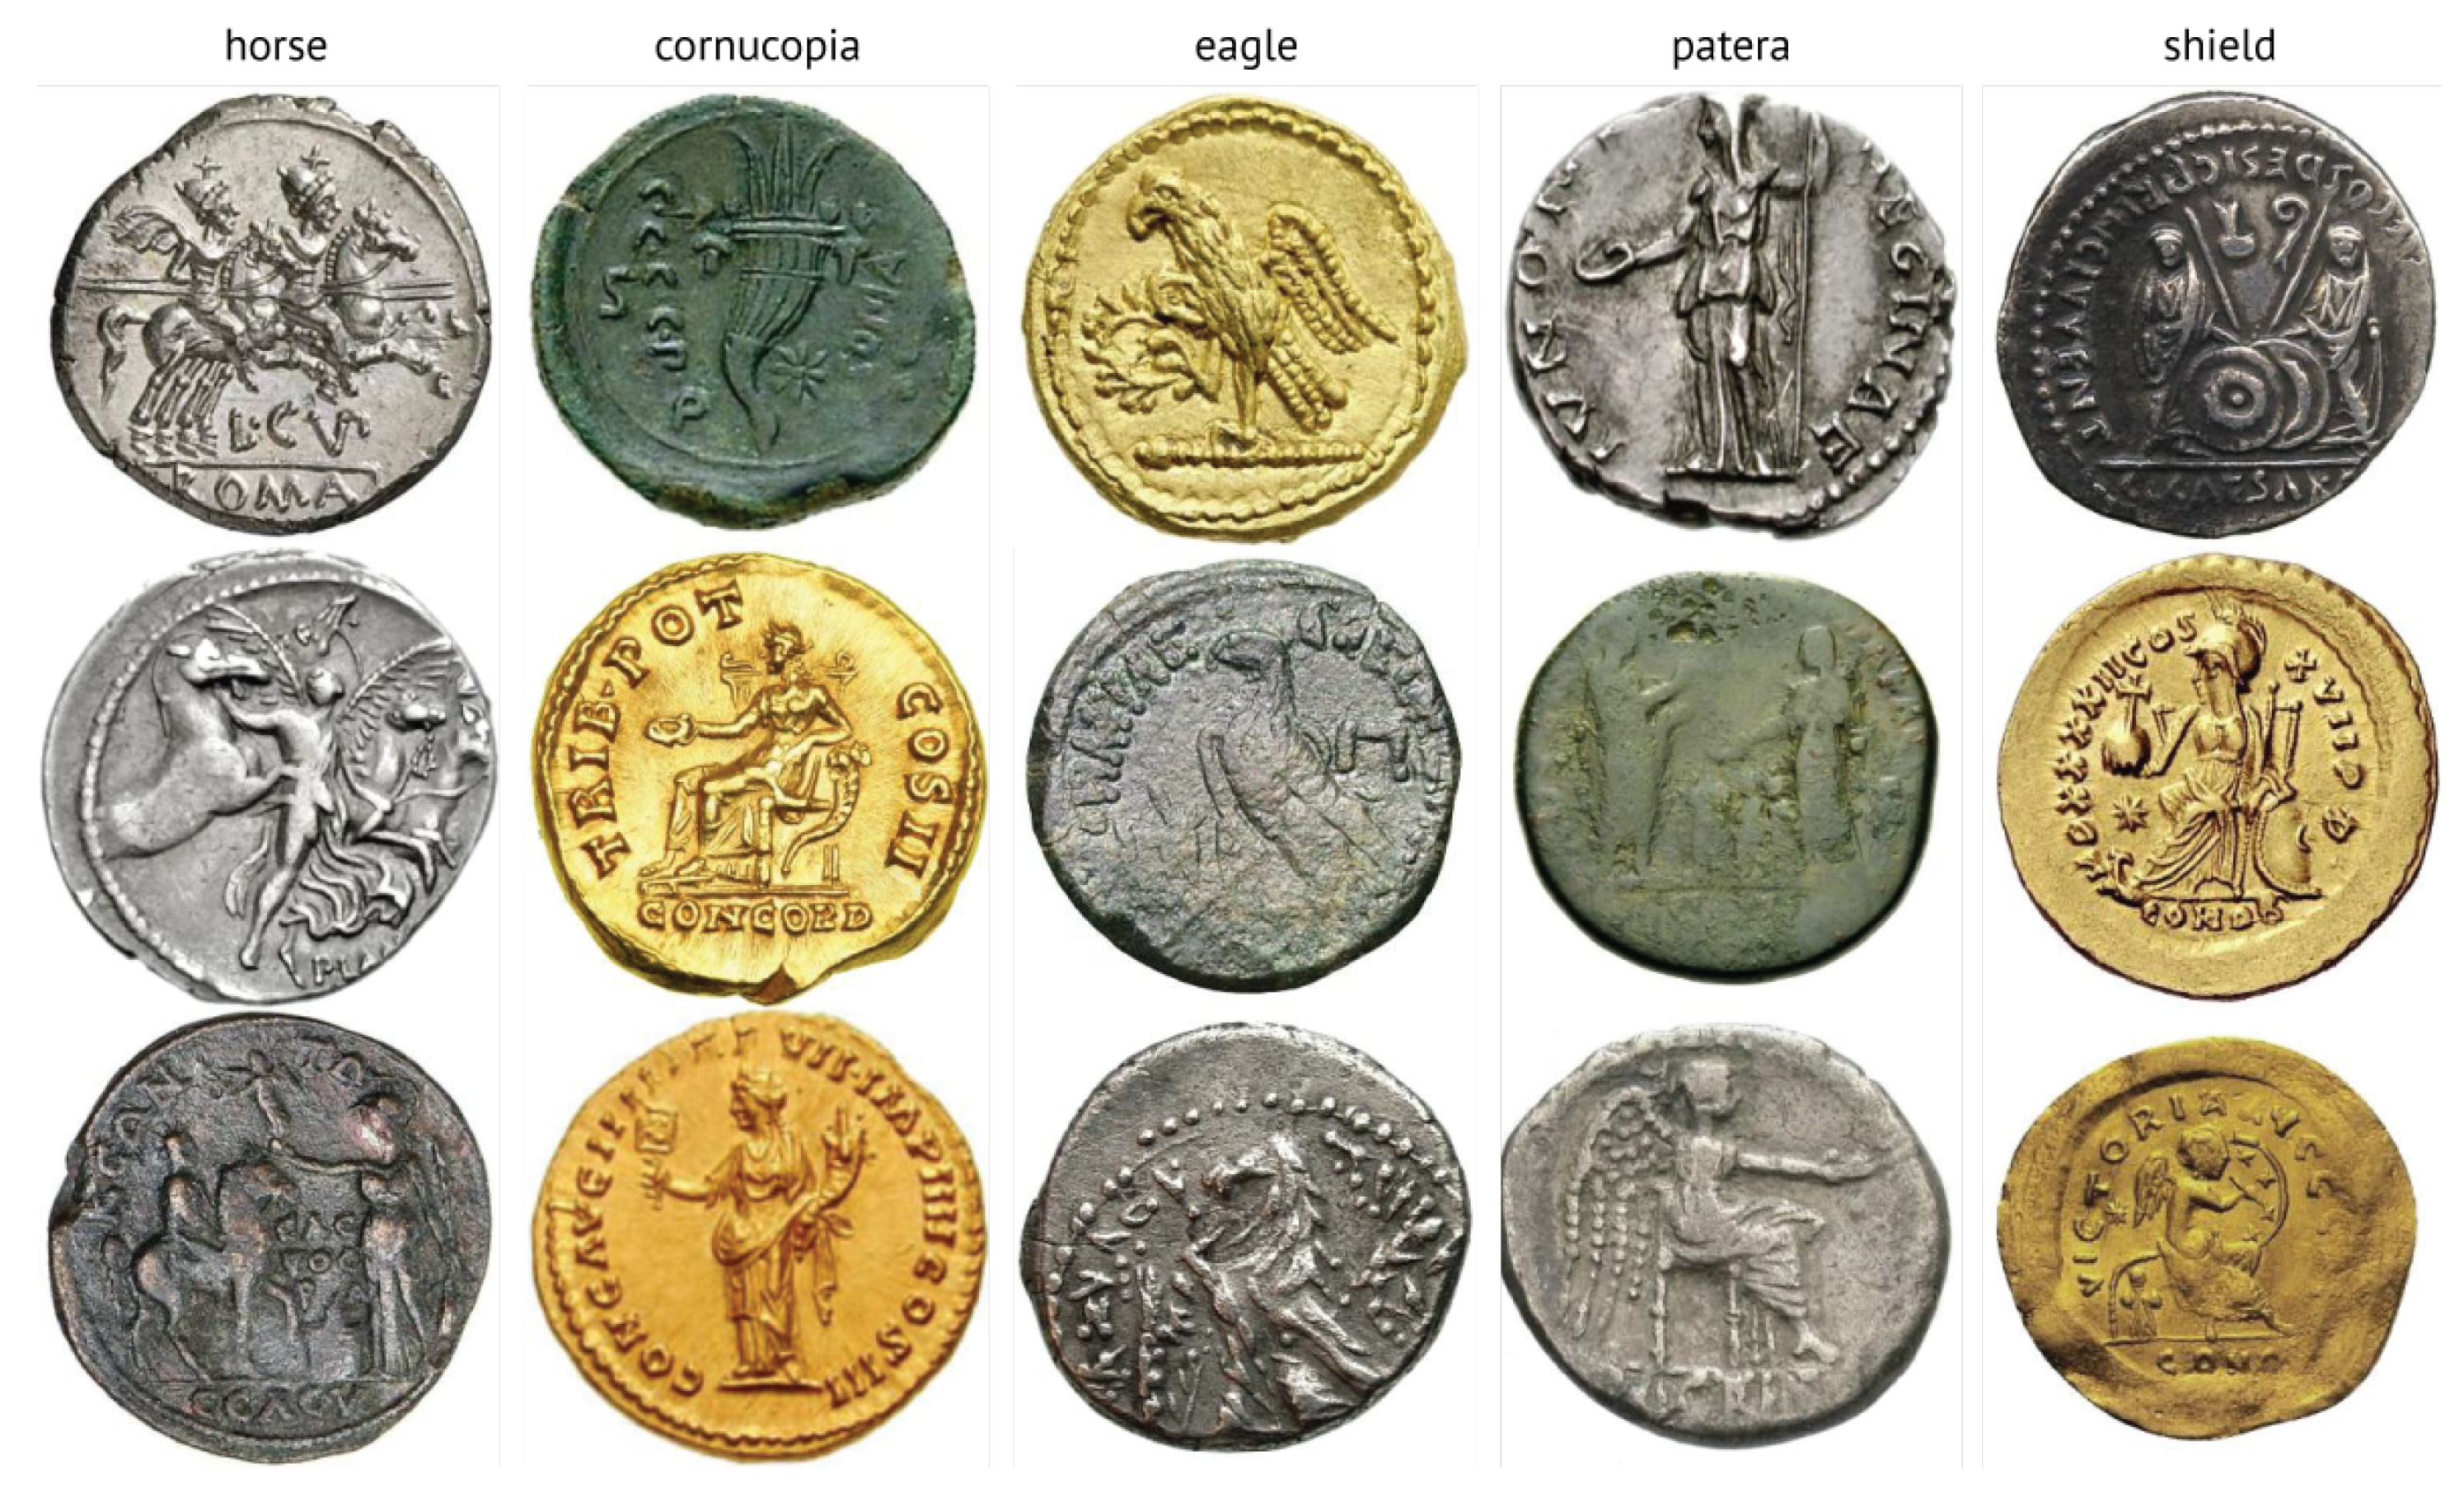
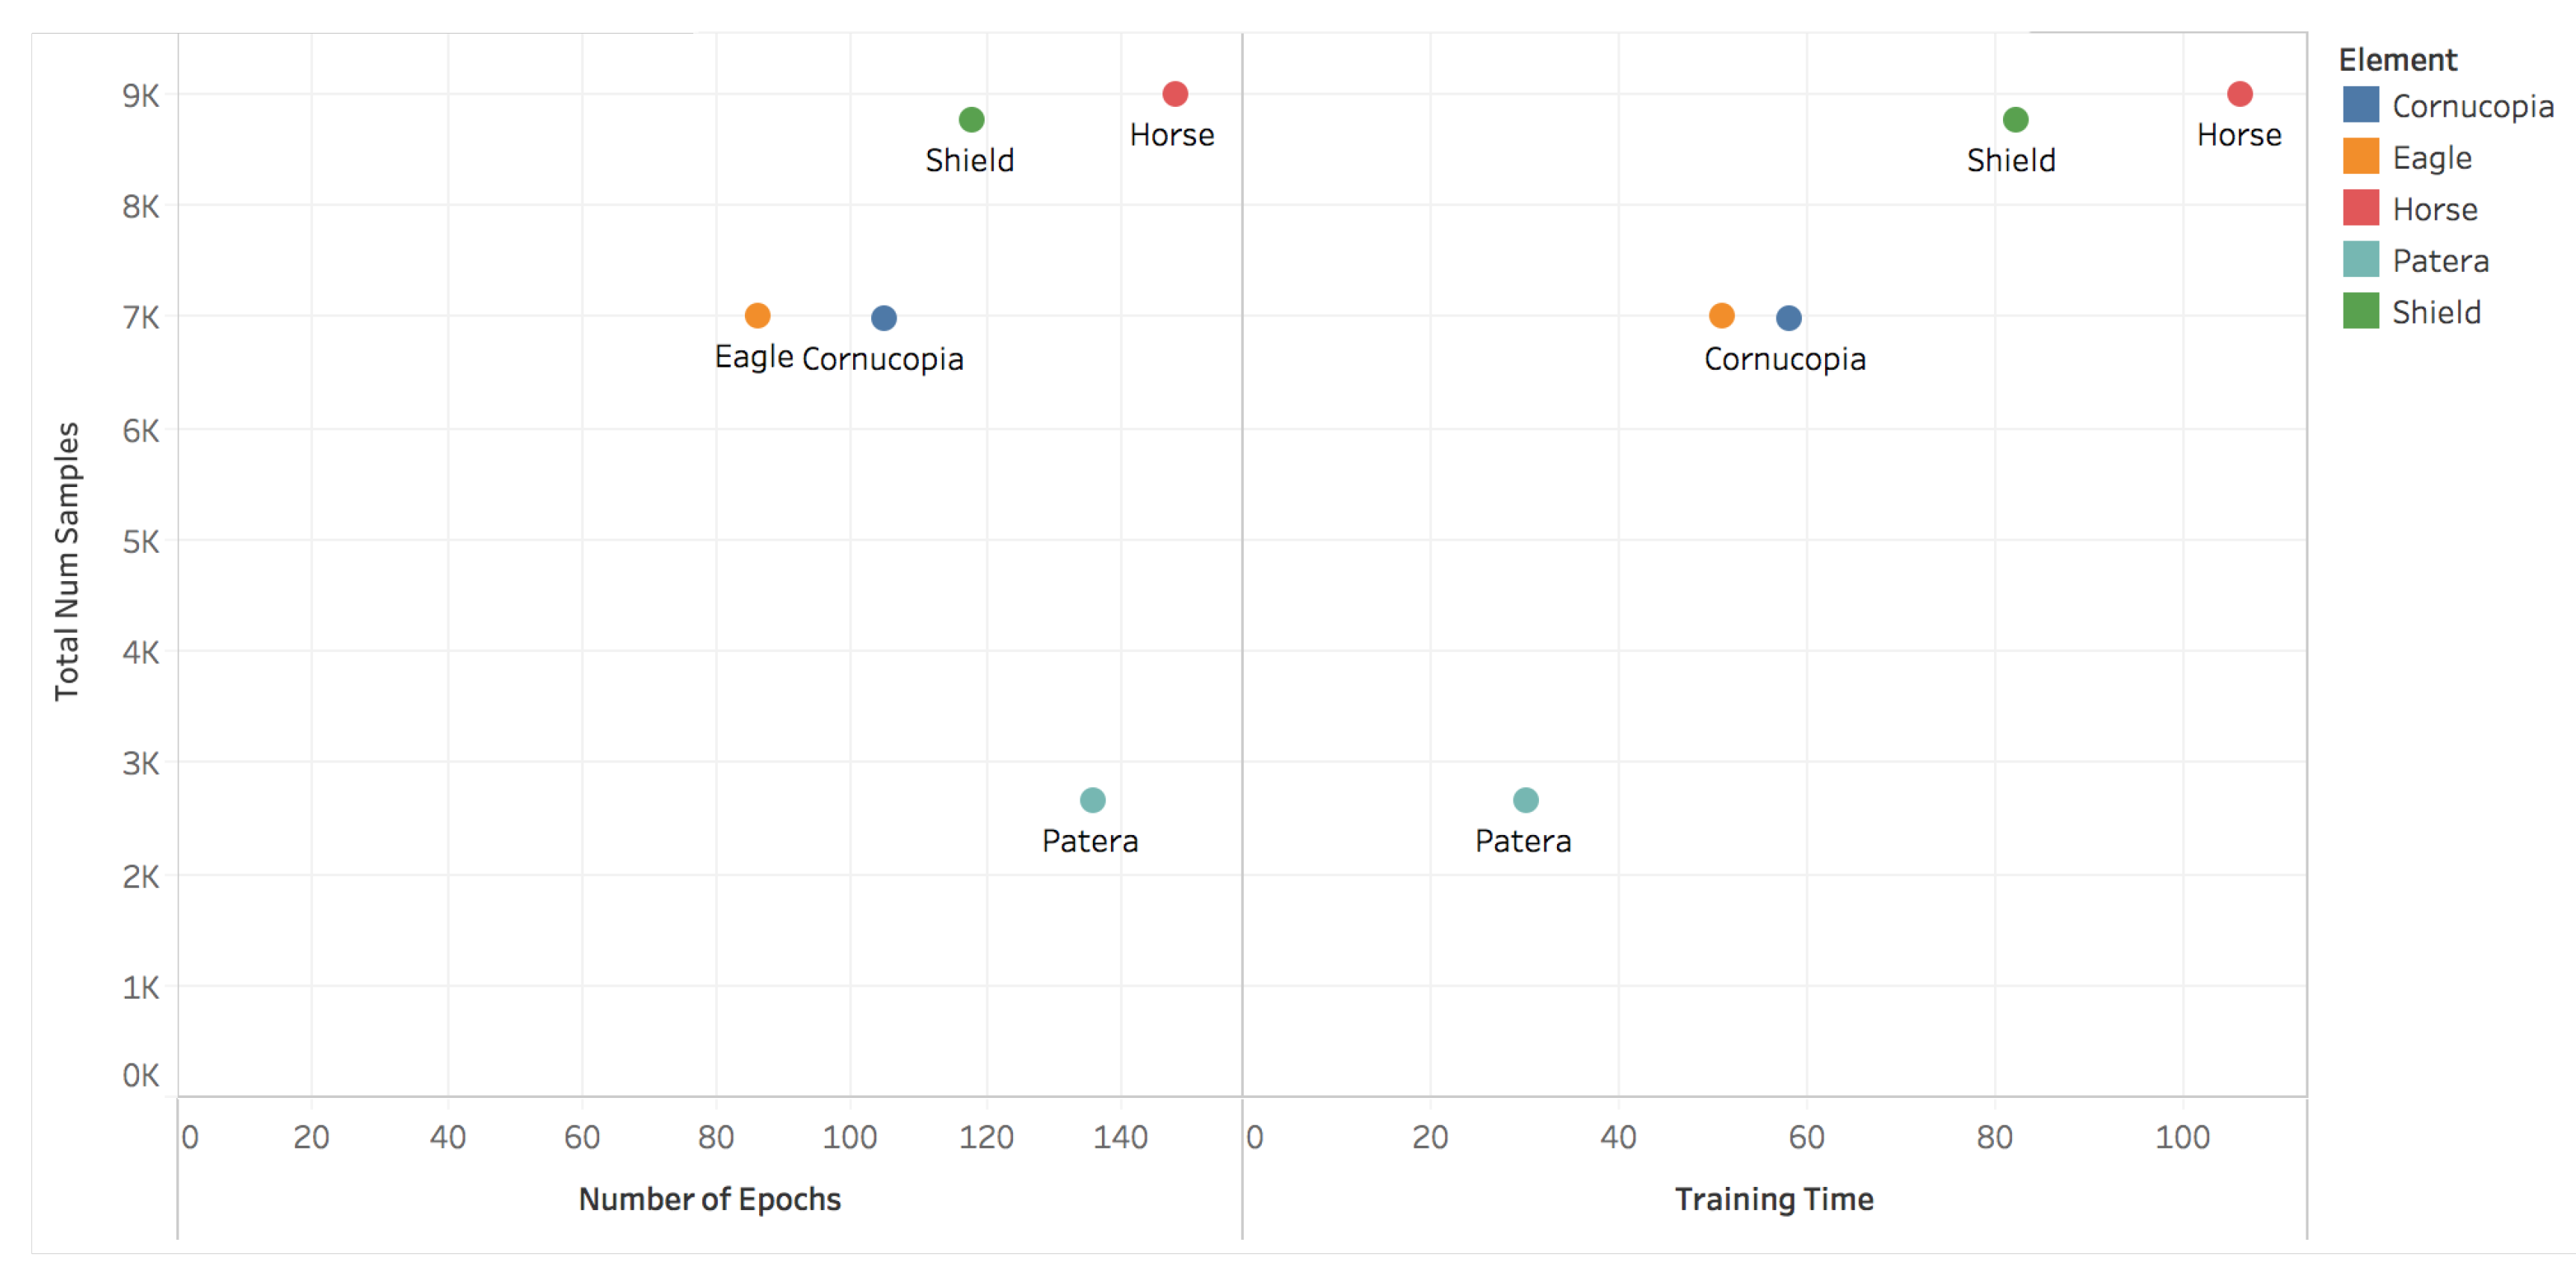
Figure 10 further demonstrates this—we can see that the visually simple patera is learned relatively quickly, while the more complex horse element which has much greater variability of depiction and is far more visually complex, quite reasonably takes much longer. The shield element is also somewhat costly to learn, likely due to the fact that it is depicted from a range of viewpoints—front-facing, sideways, on the ground, and carried in various positions which results in quite different visual appearances (see Figure 6).
4.2. Learnt Salient Regions
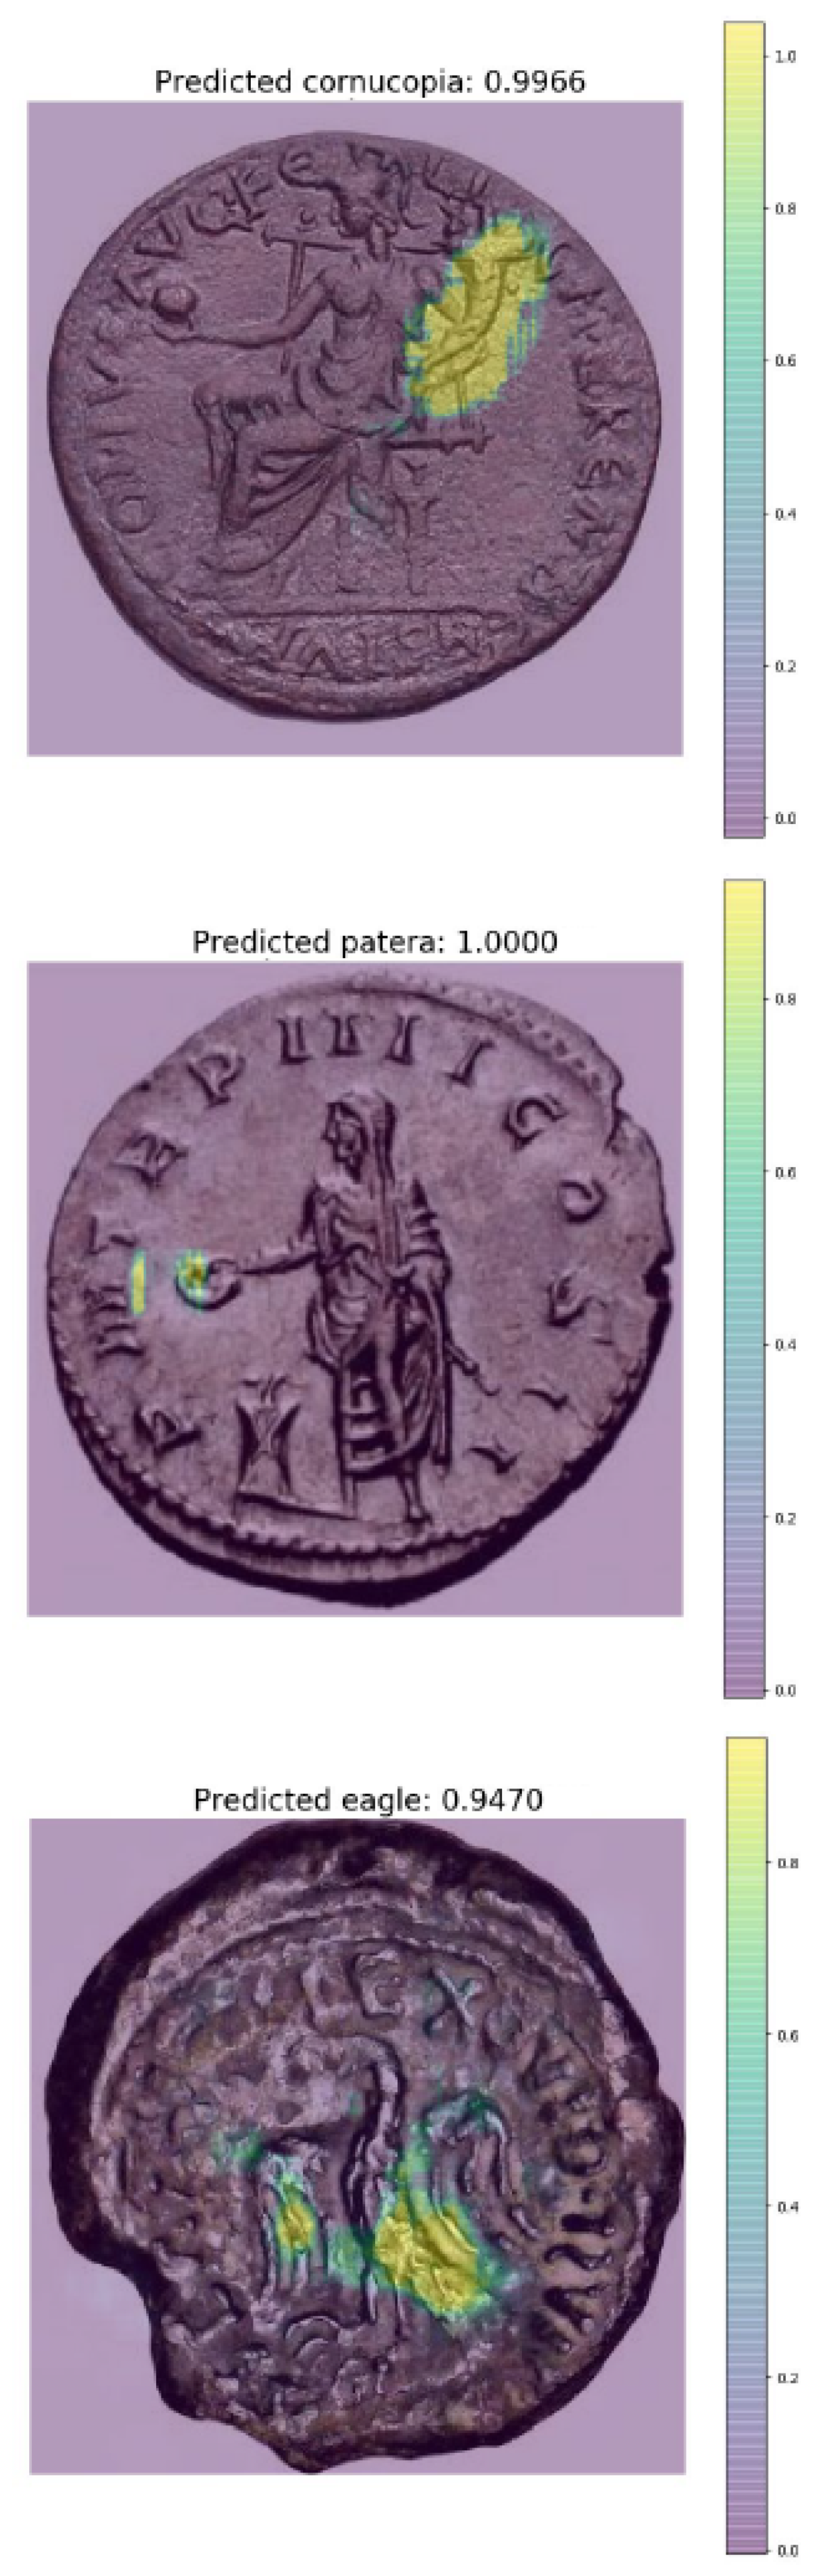
We use the occlusion technique [17] to quantify the importance of different image regions in the context of the specific task at hand. In brief, the process involves synthetic occlusion by a uniform kernel and the quantification of the corresponding classification performance differential between unoccluded and occluded inputs, with a higher difference suggesting higher importance. Previous work on computer vision based ancient coin analysis has demonstrated the usefulness of this technique in the interpretation of empirical results [17]. In order to ensure robustness to relative size (semantic element to coin diameter), in the present work we adopt the use of three kernel sizes, , , and pixels.
Typical examples of identified salient regions for different semantic elements are shown in Figure 11. It can be readily seen that our algorithm picks up the most characteristic regions of the elements well—the winding pattern of cornucopiae, the elliptical shape of paterae, and the feather patterns of eagles. Since, as we noted before and as is apparent from Table 2, the performance of our algorithm is somewhat worse on the task of shield detection, we used our occlusion technique to examine the results visually in more detail. Having done so, our conclusion is reassuring—our hypothesis is that shields are inherently more challenging to detect as they exhibit significant variability in appearance and the style of depiction (shown from the front they appear circular, whereas shown from the side they assume an arc-like shape) and the least amount of characteristic detail (both circular and arc-like shapes are commonly found in more complex semantic elements shown on coins).
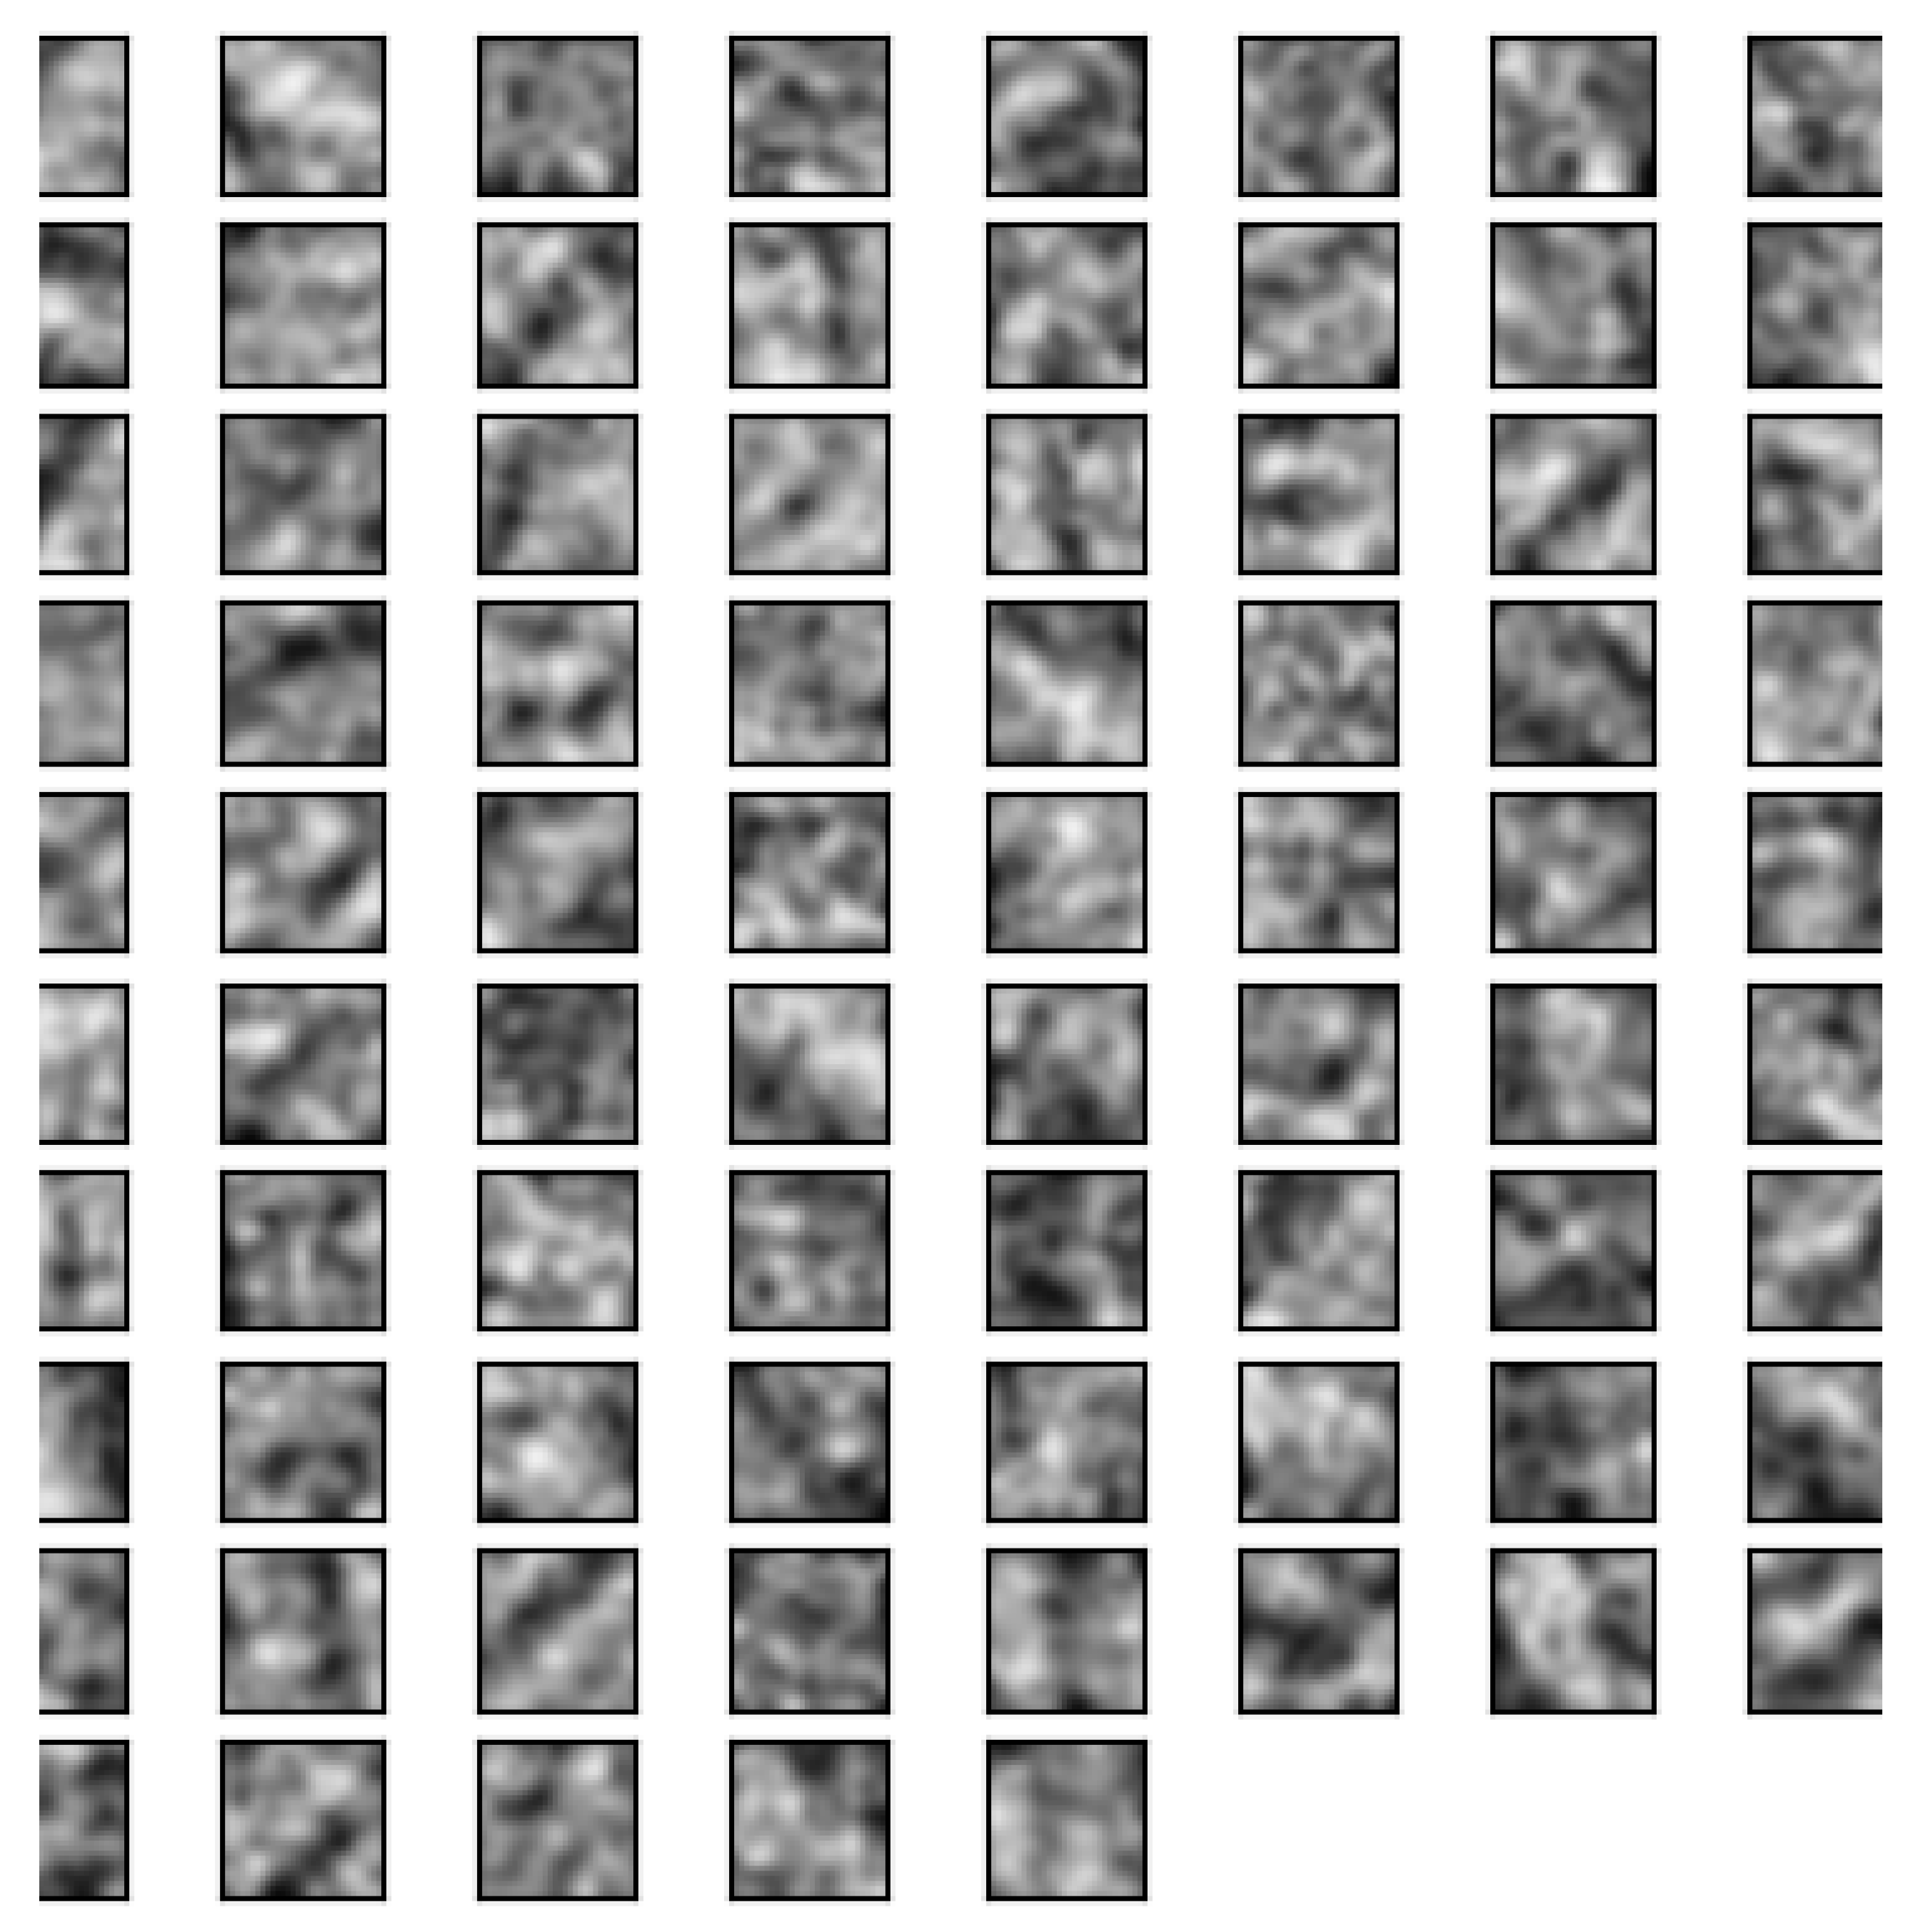
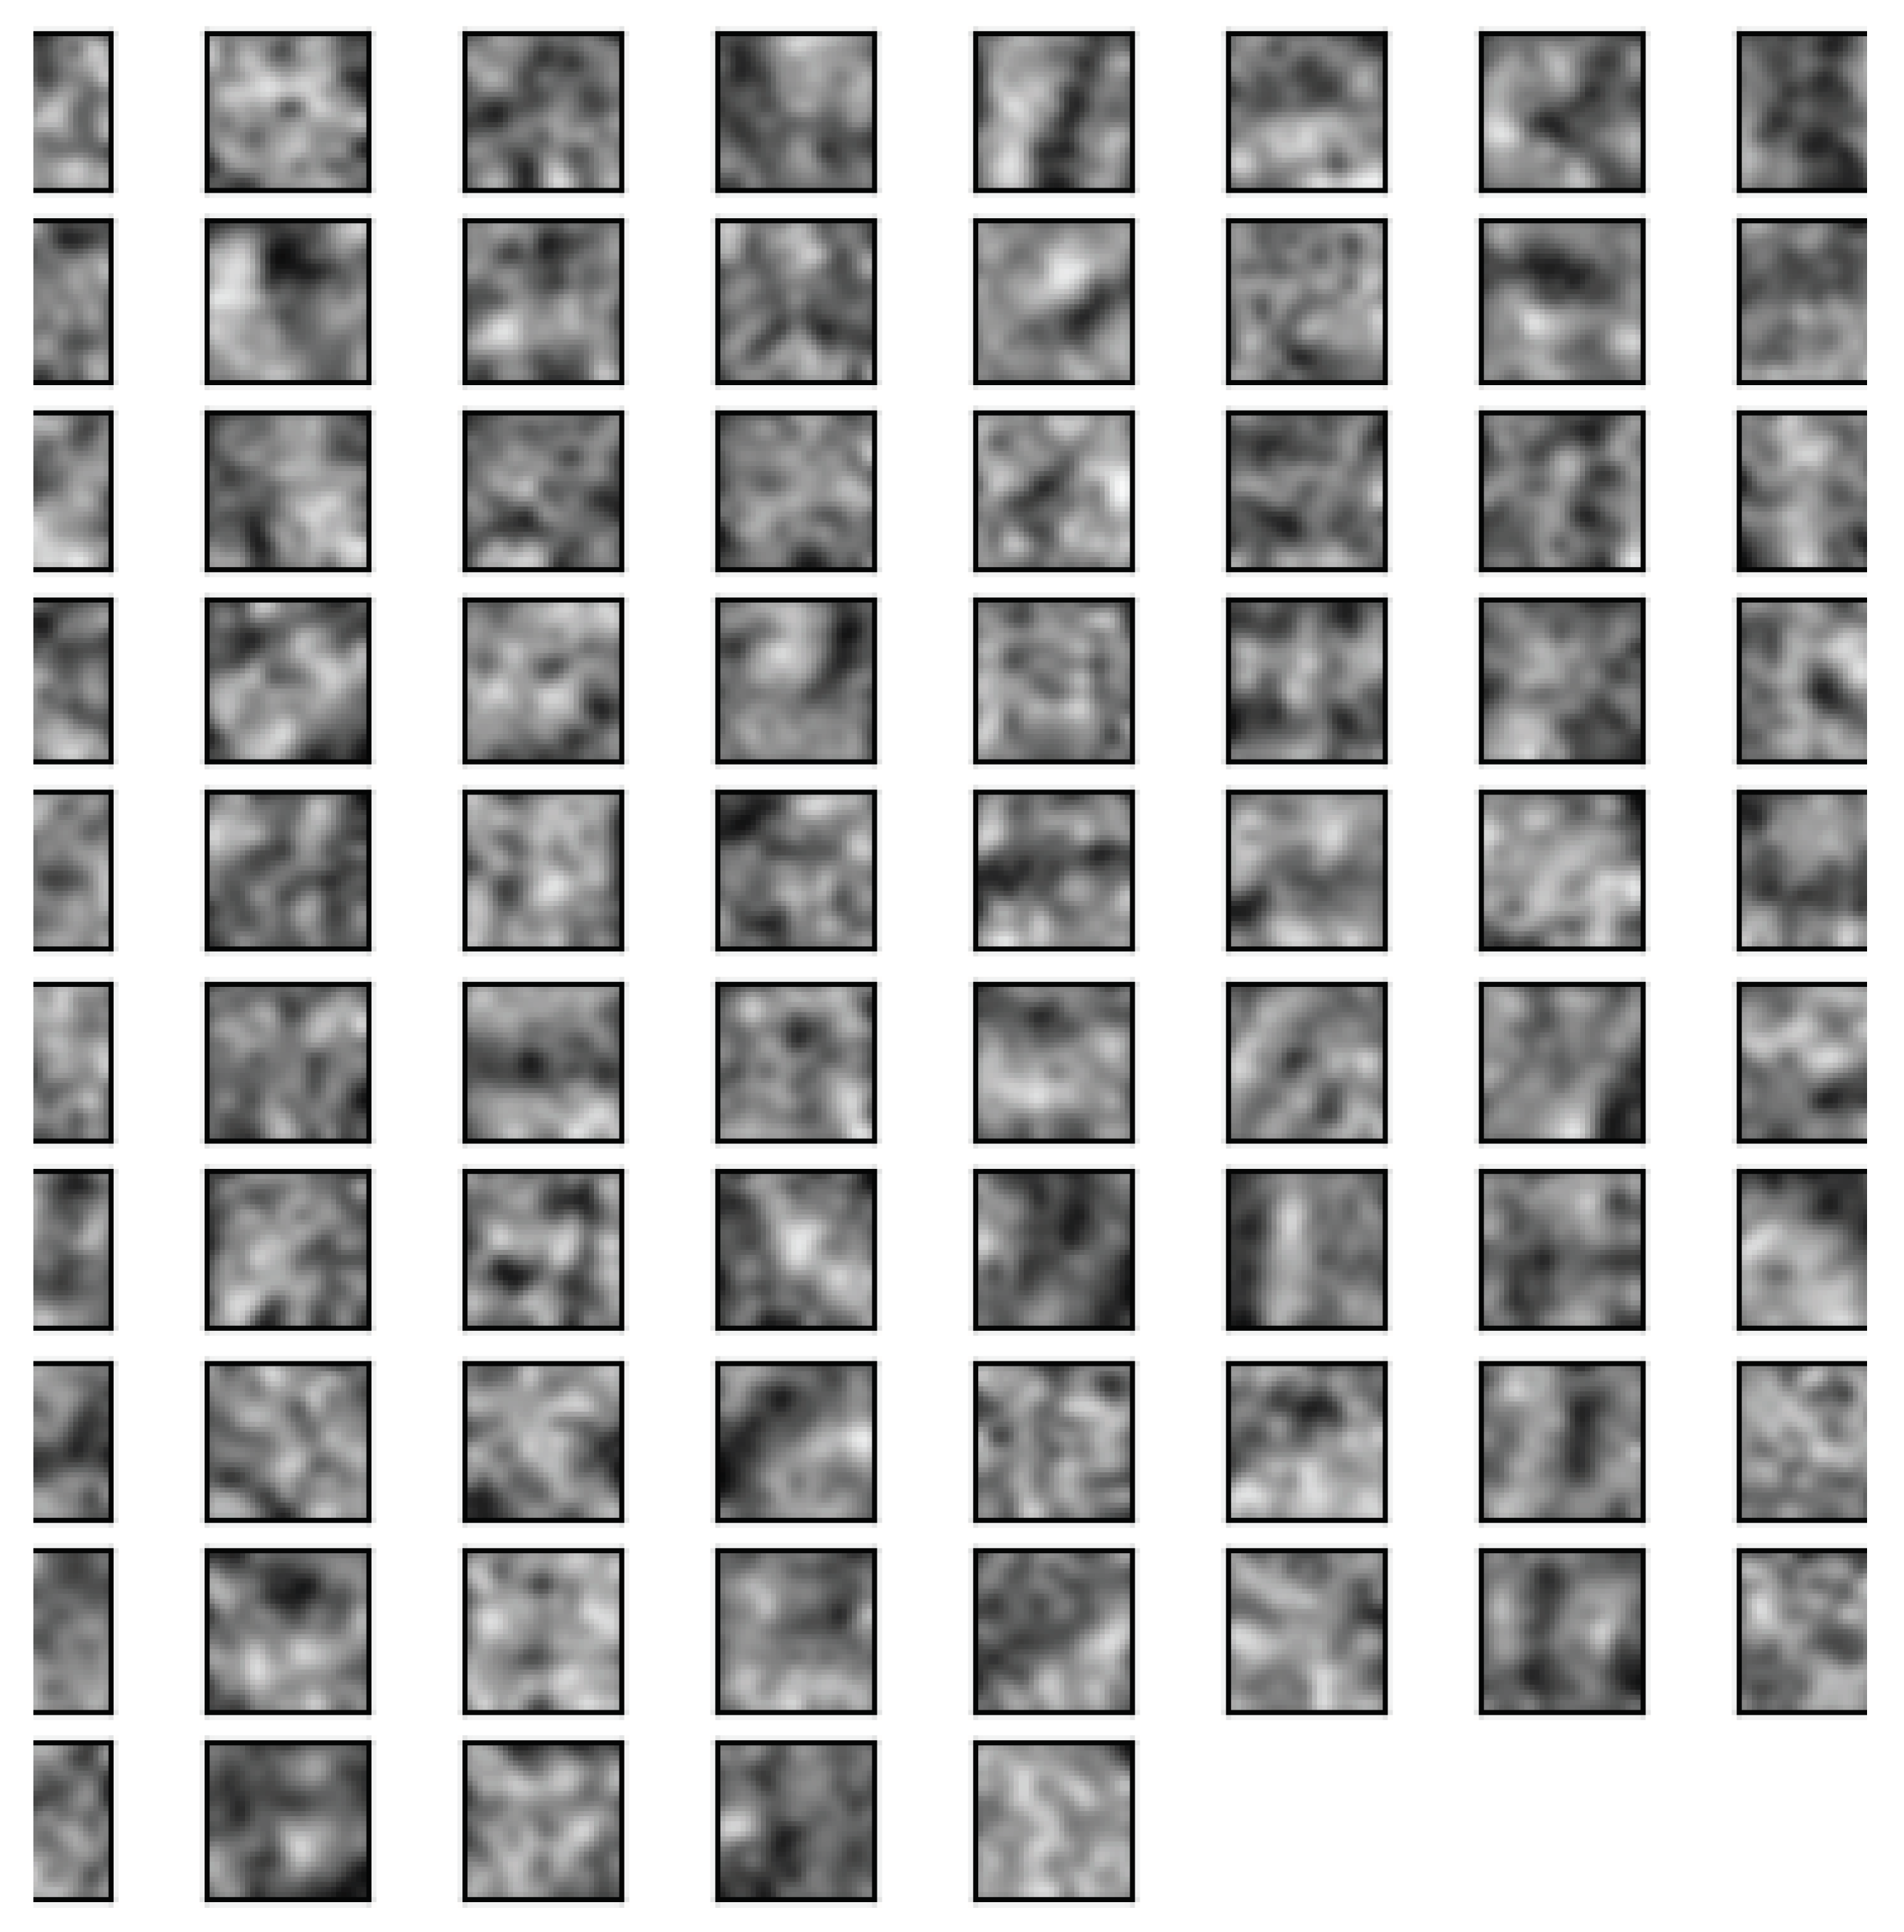
In addition, we can visualise the learned weights in the first convolutional layer’s filters as seen in Figure 12. This example is from the trained cornucopia network and shows a leaning towards recognising diagonal edges, as one would expect given the shape of the cornucopia. By contrast, Figure 13 demonstrates more curved shapes.
5. Summary and Conclusions
In this paper, we made a series of important contributions to the field of computer-vision-based analysis of ancient coins. Firstly, we put forward the first argument against the use of visual matching of ancient coin images, having explained its practical lack of value. Instead, we argued that efforts should be directed towards the semantic understanding of coin images and described the first attempt at this challenging task. Specifically, we described a novel approach which combines unstructured text analysis and visual learning using a convolutional neural network, to create weak associations between semantic elements found on ancient coins and the corresponding images, and hence learn the appearance of the aforementioned elements. We demonstrated the effectiveness of the proposed approach using images of coins extracted from 100,000 auction lots, making the experiment the largest in the existing literature. In addition to a comprehensive statistical analysis, we presented the visualization of learnt concepts on specific instances of coins, showing that our algorithm is indeed creating the correct associations. We trust that our contributions will serve to direct future work and open avenues for promising new research.
Author Contributions
O.A. and J.C. conceived and designed the experiments; J.C. performed the experiments; J.C. analyzed the data; O.A. and J.C. wrote the paper. All authors have read and agreed to the published version of the manuscript.
Funding
This research received no external funding.
Acknowledgments
The authors would like to express their gratitude to Simon Wieland of acsearch AG (www.acsearch.info) for kindly providing us with the data used in this research.
Conflicts of Interest
The authors declare no conflict of interest.
References
- Cooper, J.; Arandjelović, O. Visually understanding rather than merely matching ancient coin images. In Proceedings of the INNS Conference on Big Data and Deep Learning, Genova, Italy, 16–18 April 2019. [Google Scholar]
- Arandjelović, O. Automatic attribution of ancient Roman imperial coins. In Proceedings of the IEEE Conference on Computer Vision and Pattern Recognition, San Francisco, CA, USA, 13–18 June 2010; pp. 1728–1734. [Google Scholar]
- Lowe, D.G. Local feature view clustering for 3D object recognition. In Proceedings of the IEEE Conference on Computer Vision and Pattern Recognition, Kauai, HI, USA, 8–14 December 2001; pp. 682–688. [Google Scholar]
- Dalai, N.; Triggs, B. Histograms of oriented gradients for human detection. In Proceedings of the IEEE Conference on Computer Vision and Pattern Recognition, San Diego, CA, USA, 20–26 June 2005; Volume 1, pp. 886–893. [Google Scholar]
- Arandjelović, O. Object matching using boundary descriptors. In Proceedings of the British Machine Vision Conference, Guildford, UK, 3–7 September 2012. [Google Scholar] [CrossRef] [Green Version]
- Rieutort-Louis, W.; Arandjelović, O. Bo(V)W models for object recognition from video. In Proceedings of the International Conference on Systems, Signals and Image Processing, London, UK, 10–12 September 2015; pp. 89–92. [Google Scholar]
- Rieutort-Louis, W.; Arandjelović, O. Description transition tables for object retrieval using unconstrained cluttered video acquired using a consumer level handheld mobile device. In Proceedings of the IEEE International Joint Conference on Neural Networks, Vancouver, BC, Canada, 24–29 July 2016; pp. 3030–3037. [Google Scholar]
- Fare, C.; Arandjelović, O. Ancient Roman coin retrieval: A new dataset and a systematic examination of the effects of coin grade. In Proceedings of the European Conference on Information Retrieval, Aberdeen, UK, 8–13 April 2017; pp. 410–423. [Google Scholar]
- Arandjelović, O. Reading ancient coins: Automatically identifying denarii using obverse legend seeded retrieval. In Proceedings of the European Conference on Computer Vision, Florence, Italy, 7–13 October 2012; Volume 4, pp. 317–330. [Google Scholar]
- Conn, B.; Arandjelović, O. Towards computer vision based ancient coin recognition in the wild—Automatic reliable image preprocessing and normalization. In Proceedings of the IEEE International Joint Conference on Neural Networks, Anchorage, AK, USA, 14–19 May 2017; pp. 1457–1464. [Google Scholar]
- Zaharieva, M.; Kampel, M.; Zambanini, S. Image Based Recognition of Ancient Coins. In Proceedings of the International Conference on Computer Analysis of Images and Patterns, Vienna, Austria, 27–29 August 2007; pp. 547–554. [Google Scholar]
- Kampel, M.; Zaharieva, M. Recognizing ancient coins based on local features. In Proceedings of the International Symposium on Visual Computing, Las Vegas, NV, USA, 1–3 December 2008; Volume 1, pp. 11–22. [Google Scholar]
- Anwar, H.; Zambanini, S.; Kampel, M. Supporting Ancient Coin Classification by Image-Based Reverse Side Symbol Recognition. In Proceedings of the International Conference on Computer Analysis of Images and Patterns, York, UK, 27–29 August 2013; pp. 17–25. [Google Scholar]
- Anwar, H.; Zambanini, S.; Kampel, M. Coarse-grained ancient coin classification using image-based reverse side motif recognition. Mach. Vis. Appl. 2015, 26, 295–304. [Google Scholar] [CrossRef]
- Mattingly, H. The Roman Imperial Coinage; Spink: Hong Kong, China, 1966; Volume 7. [Google Scholar]
- Liu, W.; Wang, Z.; Liu, X.; Zeng, N.; Liu, Y.; Alsaadi, F.E. A survey of deep neural network architectures and their applications. Neurocomputing 2017, 234, 11–26. [Google Scholar] [CrossRef]
- Schlag, I.; Arandjelović, O. Ancient Roman coin recognition in the wild using deep learning based recognition of artistically depicted face profiles. In Proceedings of the IEEE International Conference on Computer Vision, Venice, Italy, 22–29 October 2017; pp. 2898–2906. [Google Scholar]
- Dimitriou, N.; Arandjelović, O.; Harrison, D.; Caie, P.D. A principled machine learning framework improves accuracy of stage II colorectal cancer prognosis. NPJ Digit. Med. 2019. [Google Scholar] [CrossRef] [PubMed] [Green Version]
- Fischler, M.A.; Bolles, R.C. Random sample consensus: A paradigm for model fitting with applications to image analysis and automated cartography. IEEE Trans. Comput. 1981, 24, 381–395. [Google Scholar] [CrossRef]
- Krizhevsky, A.; Sutskever, I.; Hinton, G.E. Imagenet classification with deep convolutional neural networks. Adv. Neural Inf. Process. Syst. 2012, 1097–1105. [Google Scholar] [CrossRef]
- Kinga, D.; Adam, J.B. A method for stochastic optimization. In Proceedings of the International Conference on Learning Representations, San Diego, CA, USA, 7–9 May 2015; Volume 5. [Google Scholar]
- Janocha, K.; Czarnecki, W.M. On loss functions for deep neural networks in classification. arXiv 2017, arXiv:1702.05659. [Google Scholar] [CrossRef]
- Agarap, A.F. Deep learning using rectified linear units (ReLU). arXiv 2018, arXiv:1803.08375. [Google Scholar]
Figure 1.
The key elements of most Roman Imperial coins’ obverses and reverses.

Figure 2.
Typical images used in the present work (obverses on the left, reverses on the right).

Figure 3.
Typical unstructured coin attributions.

Figure 4.
The amount of labour which would be required to provide pixel-level labelling (right) of different concepts is prohibitive, imposing the much more challenging task of having to perform learning from weakly annotated data (left).
Figure 4.
The amount of labour which would be required to provide pixel-level labelling (right) of different concepts is prohibitive, imposing the much more challenging task of having to perform learning from weakly annotated data (left).

Figure 5.
Cumulative frequency of image size in pixels.

Figure 6.
Examples of depictions of reverse motif elements the present work focuses on.

Figure 7.
Due to the great diversity of different semantic elements which appear on ancient coins, only a relatively small number of coins in the corpus as a whole contain the specific semantic elements which we attempt to learn herein, raising class imbalance issues which we address using stratified sampling (see main text for thorough explanation).

Figure 8.
Translated sample label frequency per element. N.B. The label ‘patera’ is not included, as the same Latin word is used in all languages considered.
Figure 8.
Translated sample label frequency per element. N.B. The label ‘patera’ is not included, as the same Latin word is used in all languages considered.

Figure 9.
Our model architecture: a global view.

Figure 10.
Per element number of training epochs and training time.

Figure 11.
Examples of automatically identified salient regions corresponding to a cornucopia, a patera, and an eagle.
Figure 11.
Examples of automatically identified salient regions corresponding to a cornucopia, a patera, and an eagle.

Figure 12.
Learnt filters from the first convolutional layer in the cornucopia network.

Figure 13.
Learnt filters from the first convolutional layer in the patera network.


Table 1.
Our convolutional neural network topology: a summary.
| Layer Type | Kernel Size | Stride | Kernel No. | Activation |
|---|---|---|---|---|
| Convolutional | 11 × 11 | 4 | 96 | ReLU |
| Max Pooling | 3 × 3 | 2 | ||
| Convolutional | 5 × 5 | 1 | 256 | ReLU |
| Max Pooling | 3 × 3 | 2 | ||
| Convolutional | 3 × 3 | 1 | 384 | ReLU |
| Convolutional | 3 × 3 | 1 | 384 | ReLU |
| Convolutional | 3 × 3 | 1 | 256 | ReLU |
| Max Pooling Layer | 3 × 3 | 2 | ||
| Flatten | ||||
| Outputs | Dropout | |||
| Dense | 4096 | 0.5 | ReLU | |
| Dense | 4096 | 0.5 | ReLU | |
| Dense | 2 | 0.5 | ReLU |
Table 2.
Summary of experimental settings and results.
| Cornucopia | Patera | Shield | Eagle | Horse | |
|---|---|---|---|---|---|
| Number of epochs | 105 | 136 | 118 | 86 | 148 |
| Training time (min) | 58 | 30 | 82 | 51 | 106 |
| Training accuracy | 0.71 | 0.83 | 0.75 | 0.88 | 0.88 |
| Validation accuracy | 0.85 | 0.86 | 0.73 | 0.73 | 0.82 |
| Validation precision | 0.86 | 0.85 | 0.72 | 0.71 | 0.82 |
| Validation recall | 0.83 | 0.86 | 0.75 | 0.81 | 0.84 |
| Validation F1 | 0.85 | 0.86 | 0.74 | 0.75 | 0.83 |
| Test accuracy | 0.84 | 0.84 | 0.72 | 0.73 | 0.82 |
| Test precision | 0.85 | 0.82 | 0.71 | 0.70 | 0.81 |
| Test recall | 0.83 | 0.87 | 0.74 | 0.81 | 0.82 |
| Test F1 | 0.84 | 0.84 | 0.72 | 0.75 | 0.82 |
© 2020 by the authors. Licensee MDPI, Basel, Switzerland. This article is an open access article distributed under the terms and conditions of the Creative Commons Attribution (CC BY) license (http://creativecommons.org/licenses/by/4.0/).
Share and Cite
MDPI and ACS Style
Cooper, J.; Arandjelović, O. Learning to Describe: A New Approach to Computer Vision Based Ancient Coin Analysis. Sci 2020, 2, 27. https://0-doi-org.brum.beds.ac.uk/10.3390/sci2020027
AMA Style
Cooper J, Arandjelović O. Learning to Describe: A New Approach to Computer Vision Based Ancient Coin Analysis. Sci. 2020; 2(2):27. https://0-doi-org.brum.beds.ac.uk/10.3390/sci2020027
Chicago/Turabian StyleCooper, Jessica, and Ognjen Arandjelović. 2020. "Learning to Describe: A New Approach to Computer Vision Based Ancient Coin Analysis" Sci 2, no. 2: 27. https://0-doi-org.brum.beds.ac.uk/10.3390/sci2020027