

Multimodal and Multidomain Feature Fusion for Emotion Classification Based on Electrocardiogram and Galvanic Skin Response Signals

Goa College of Engineering, Goa University, Ponda 403401, India
*
Author to whom correspondence should be addressed.
Sci 2024, 6(1), 10; https://0-doi-org.brum.beds.ac.uk/10.3390/sci6010010
Submission received: 18 December 2023
/
Revised: 30 January 2024
/
Accepted: 31 January 2024
/
Published: 4 February 2024
(This article belongs to the Special Issue Theory and Applications of Machine Learning and Artificial Intelligence)
Abstract
:Emotion classification using physiological signals is a promising approach that is likely to become the most prevalent method. Bio-signals such as those derived from Electrocardiograms (ECGs) and the Galvanic Skin Response (GSR) are more reliable than facial and voice recognition signals because they are not influenced by the participant’s subjective perception. However, the precision of emotion classification with ECG and GSR signals is not satisfactory, and new methods need to be developed to improve it. In addition, the fusion of the time and frequency features of ECG and GSR signals should be explored to increase classification accuracy. Therefore, we propose a novel technique for emotion classification that exploits the early fusion of ECG and GSR features extracted from data in the AMIGOS database. To validate the performance of the model, we used various machine learning classifiers, such as Support Vector Machine (SVM), Decision Tree, Random Forest (RF), and K-Nearest Neighbor (KNN) classifiers. The KNN classifier gives the highest accuracy for Valence and Arousal, with 69% and 70% for ECG and 96% and 94% for GSR, respectively. The mutual information technique of feature selection and KNN for classification outperformed the performance of other classifiers. Interestingly, the classification accuracy for the GSR was higher than for the ECG, indicating that the GSR is the preferred modality for emotion detection. Moreover, the fusion of features significantly enhances the accuracy of classification in comparison to the ECG. Overall, our findings demonstrate that the proposed model based on the multiple modalities is suitable for classifying emotions.
1. Introduction
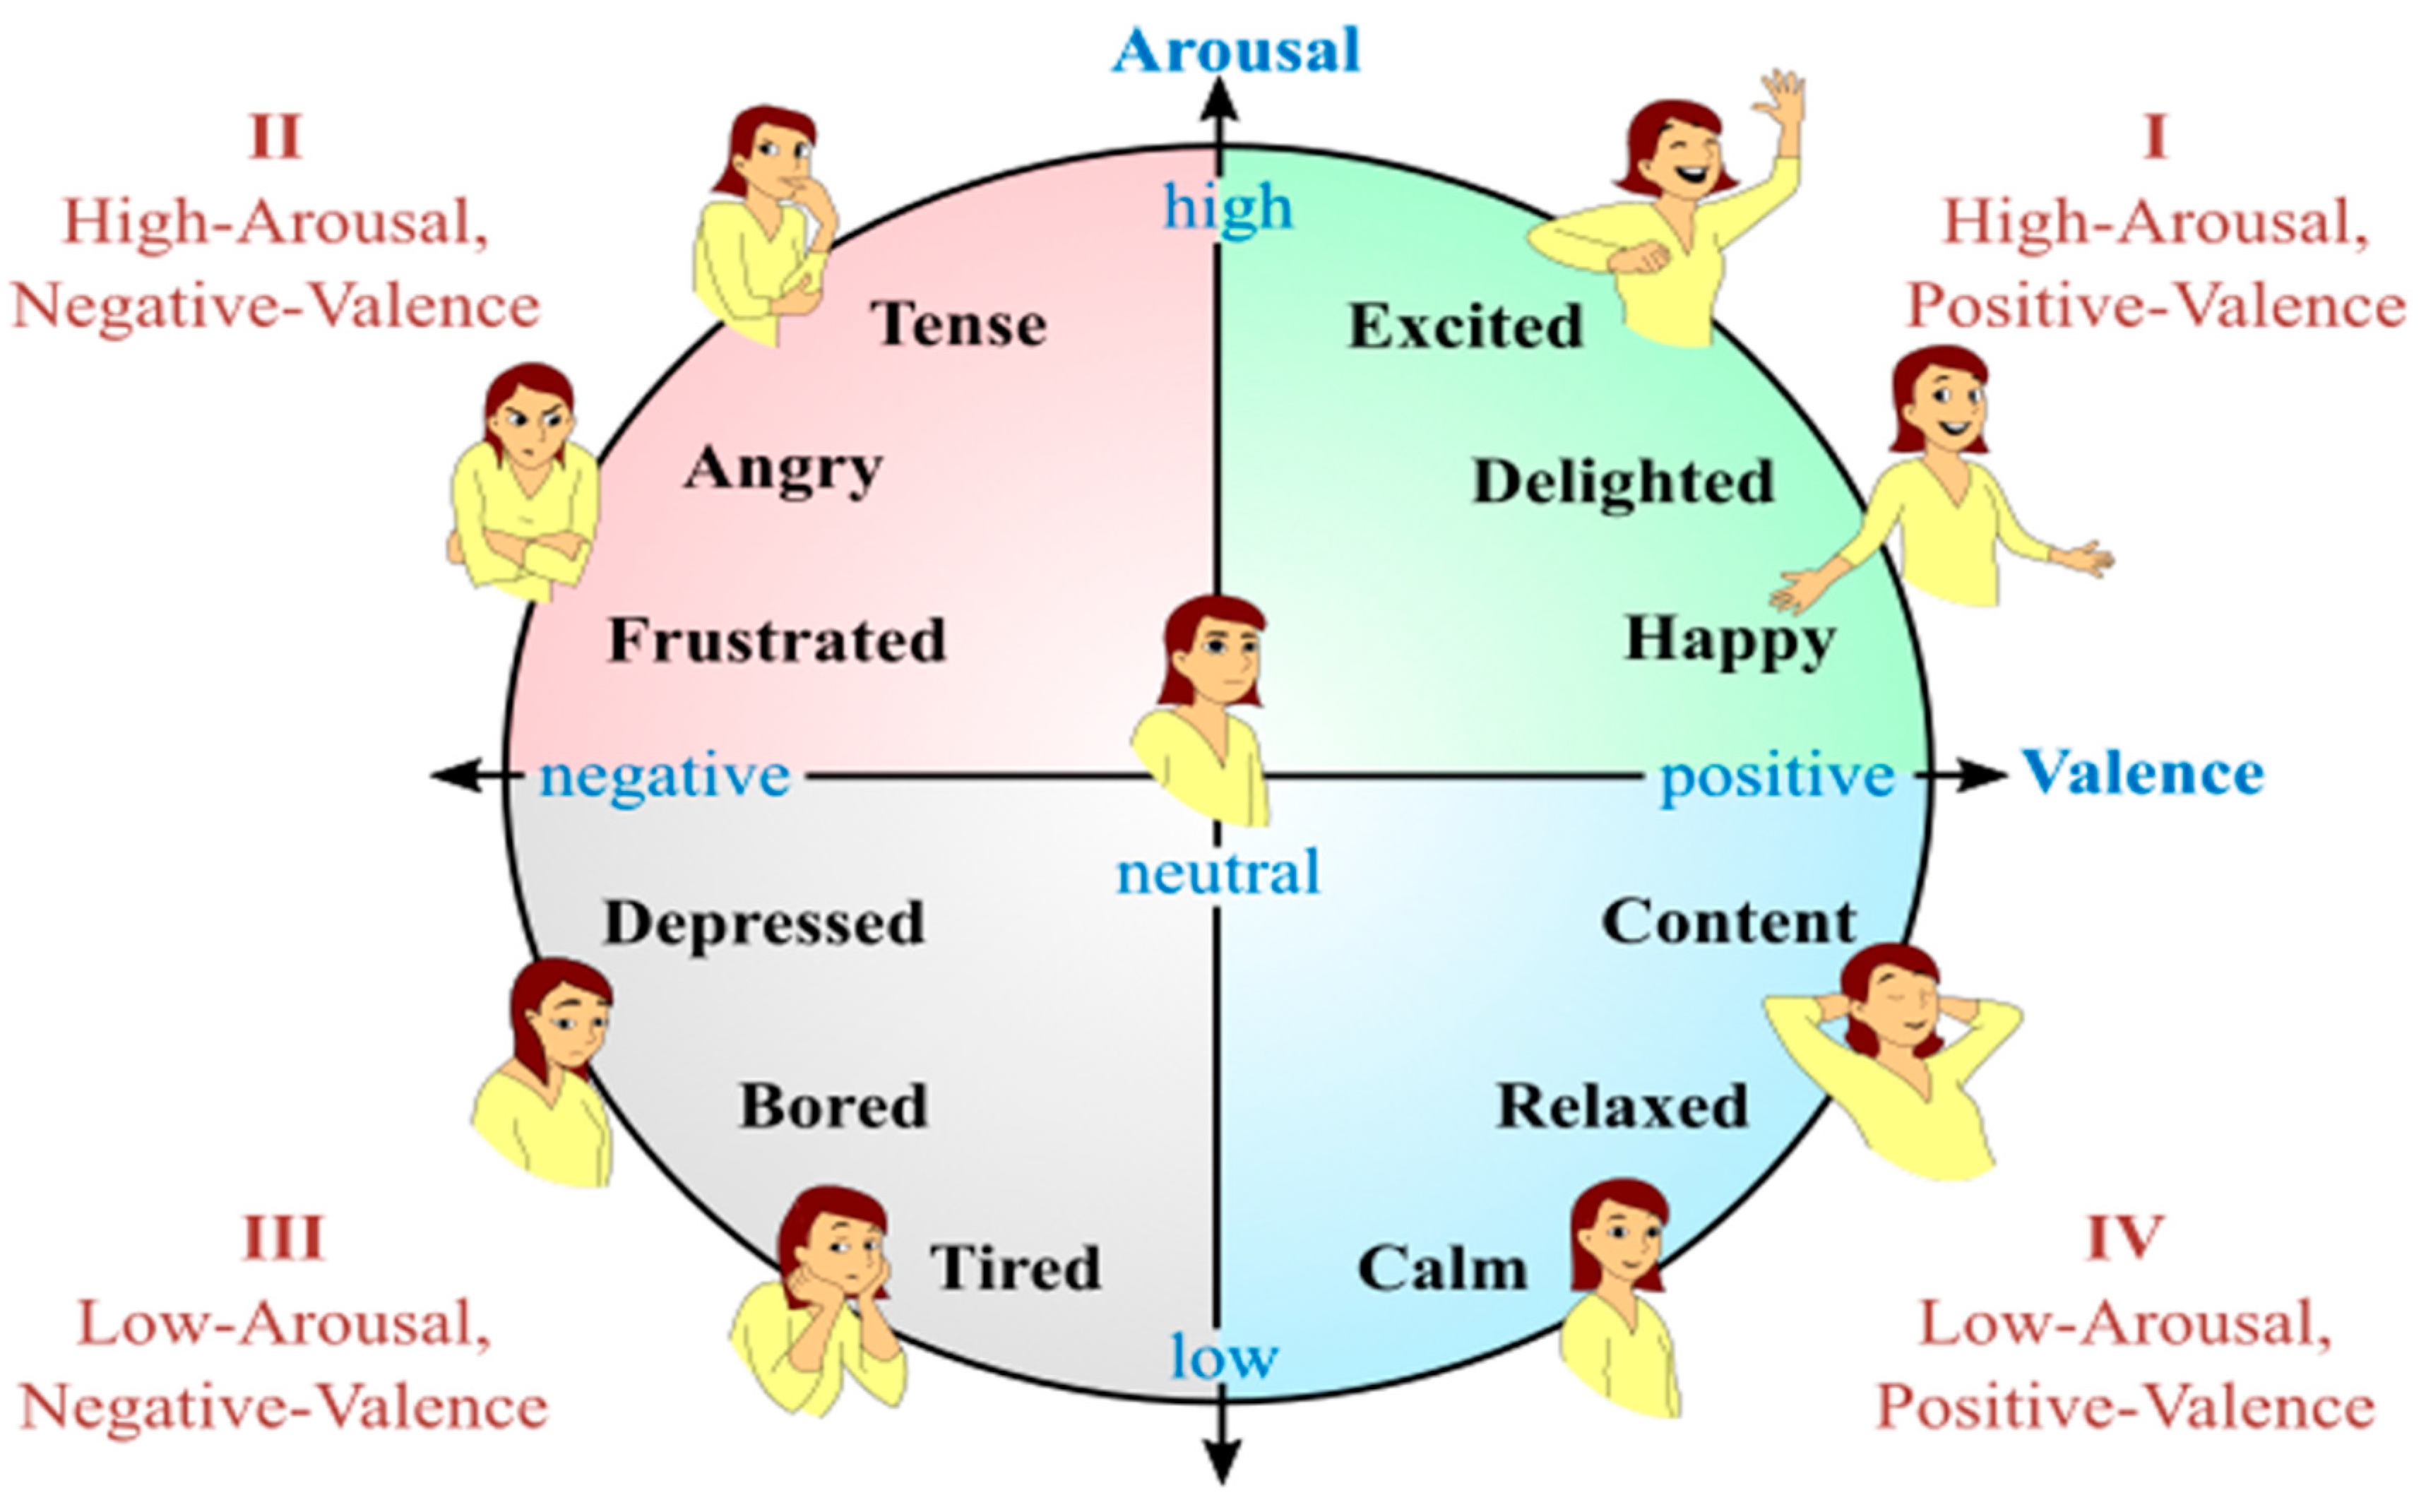
Emotions are brief feelings that help people communicate with others. A human–computer interaction system can recognize and interpret emotions such as disgust, fear, happiness, surprise, and sadness. Negative emotions like stress, anger, and fear should be identified and dealt with using appropriate counseling to maintain societal balance. Russell’s Circumplex Model categorizes emotions based on the two-dimensional Valence–Arousal scale. The neutral point is represented by the center, as shown in Figure 1 [1,2,3]. Valence indicates the pleasantness of emotions, and Arousal indicates the intensity of emotions. For instance, anger exhibits low Valence and high Arousal (LVHA), while happiness indicates high Valence and high Arousal (HVHA) [4].
Images and videos are used to trigger emotions, with video clips being more effective than other methods [5]. Emotions can be detected through speech [6], sentiment [7], and facial expressions [8]. However, an emerging area of research involves emotion classification using physiological signals. Biological parameters from the human body cannot be misinterpreted, making them more reliable [1,9]. Researchers have explored facial expressions, voice signals, and body gestures for emotion classification. Facial expressions account for 95% of the research, while only 5% focuses on other parameters [10].
Biological parameters such as ECG, GSR, Electroencephalograms (EEGs), and respiration rate can be used to detect emotions. However, using invasive respiratory sensors to collect data can be uncomfortable for participants [11]. Therefore, the use of non-invasive sensors could make the process more comfortable. Advanced sensors can also be used to collect data in a way that is less prone to motion [12]. While researchers have explored using EEG signals for emotion classification, this method is more suitable for clinical applications. ECG and GSR signals have been used less frequently for emotion classification compared to EEG signals [13]. An ECG records the heart’s electrical movement, while the GSR measures the skin’s electrical conductance. The Shimmer instrument detects electrical signals in the heart, while the GSR Shimmer instrument measures skin conductance using electrodes attached to the fingers [14]. ECG and GSR signals must be recorded when subjects are exposed to emotions in different quadrants of Russell’s model, and emotions must be classified appropriately. Standard databases are available for researchers to use in their studies [15,16,17,18]. However, raw ECG and GSR signals can be noisy and require suitable preprocessing techniques. Time and frequency domain features must be extracted from ECG and GSR signal recordings to obtain relevant information about different emotions [19]. Further, relevant features must be selected using various feature selection techniques before classification.
Moreover, fusion techniques can be used for emotion classification. Early feature fusion concatenates features obtained through various modalities before classification. Decision-level fusion combines the classifier outputs of individual modalities to obtain the final classification accuracy. While Miranda et al. performed decision-level fusion on ECG, GSR, and EEG features, they reported lower classification accuracy [18]. Dar et al. classified emotions using decision-level fusion based on deep learning techniques [20]. Additionally, Hasnul et al. noted the need to develop a universal model with improved classification accuracy [9]. Although several techniques have been proposed for emotion classification using ECG and GSR modalities, none have explored emotion classification based on the early fusion of the time and frequency features of ECG and GSR signals. To address this, we propose an early fusion technique that combines ECG and GSR features for improved accuracy using appropriate signal processing, feature selection, and classification techniques. Herein, we propose the creation of a multimodal and multidomain model for emotion classification. This model will be more robust than a single modality-based model. By using feature fusion techniques, we can capture data from different modalities, which will improve the performance and reliability of the classification. The main research contributions of this work are as follows:
- Developing an algorithm that utilizes suitable preprocessing, feature extraction, feature selection, and classification techniques to accurately classify emotions using ECG data.
- Developing an algorithm that utilizes suitable preprocessing, feature extraction, feature selection, and classification techniques to classify emotions using GSR data accurately.
- Emotion classification through the early fusion of ECG and GSR features.
2. Related Works
An outline of the emotion classification accuracies reported by the researchers using machine learning techniques is mentioned below. Egger et al. claimed that physiological signals are more adequate for emotion recognition than other techniques such as facial and voice recognition [1]. Bulagang et al. reviewed emotion classification techniques using ECG and GSR signals [2]. Dessai et al. reviewed articles on emotion classification that use ECG and GSR parameters based on machine learning and deep learning techniques [13]. The DEAP database provided physiological signals for emotional measurements for conducting research [15]. J. A. Miranda et al. contributed the first physiological signal database based on affect, personality traits, and mood. They performed a correlation analysis between individual and group settings when participants watched videos individually and in groups and between personality traits, PANAS, and social context [18]. Sayed Ismail et al. converted ECG data from the DREAMER database into images and obtained an accuracy of 63% for Valence and an accuracy of 58% for Arousal. Further obtained an accuracy of 79% for Valence and an accuracy of 69% for Arousal for numerical ECG data using the SVM classifier, proving that ECG numerical data give better classification accuracy than ECG images [21]. Romeo et al. classified emotions using the BVP signals from the DEAP database using multiple instances learning-based SVM classifier. They obtained classification accuracies of 68% and 69% for Valence and Arousal, respectively [22]. Bulagang et al. used a virtual reality headset to allow subjects to view 360-degree video stimuli. They recorded ECG signals from 20 participants using the Empatica E4 wristband. Inter-subject classification achieved 46.7% accuracy for SVM, 42.9% for KNN, and 43.3% for Random Forest [23]. An accuracy of 62.3% was obtained for ECG signals from the DREAMER for emotion classification [24]. Moreover, researchers have classified emotions using GSR parameters. Shukla et al. reported an accuracy of 85.75% for Arousal recognition and 83.9% for Valence recognition using the GSR data [25]. Soleymani et al. classified emotions using the SVM classifier and obtained classification accuracies of 46.2% and 45.5% for Arousal and Valence using ECG and GSR data from the MAHNOB database, respectively [16]. Subramanian et al. classified emotions using signals from the ASCERTAIN database using the SVM classifier and obtained classification accuracies of 56% and 57% for ECG signals for Valence and Arousal levels, respectively, and 64% accuracy for Valence and 61% accuracy for Arousal for GSR signals [17]. Miranda-Correa et al. obtained classification accuracies of 59.7% for Valence and 58.4% for Arousal using ECG data, as well as classification accuracies of 53.1% for Valence and 54.8% for Arousal using GSR data [18]. It has been observed that researchers mostly utilize the SVM classifier for carrying out classification tasks. Moreover, deep machine learning techniques improve classification accuracy [26,27,28,29,30,31,32,33,34]. Various studies have employed deep neural networks to automatically extract features and classify data. However, this approach has some drawbacks, such as being computationally expensive and requiring a large amount of data. Additionally, deep neural networks act as a “black-box” model, making it challenging to understand how the model makes predictions and which factors affect the predictions. Ahmad et al. mentioned a gap in the literature regarding using fusion techniques to improve classification accuracy. Moreover, no standard set of features works for all situations, and methods must be developed to select the best features automatically [35]. Khateeb et al. fused EEG signals’ time, frequency, and wavelet domain features using concatenation before classification. They extracted time, frequency, and wavelet features from EEG signals of the DEAP database and classified them using the SVM classifier [36]. Tan et al. utilized a spiking neural network that combines facial and peripheral data using both feature-level and decision-level fusion to classify emotions [10]. Wei et al. used a weighted fusion strategy to classify emotions by fusing multichannel data at the decision level using the SVM classifier [37]. Bota et al. [38] collected data from multiple modalities, such as ECG, blood volume pulse, respiration sensor, and electrodermal signals, to perform emotion recognition experiments on various databases by using machine learning classifiers. They fused and classified the data from multiple sensors and used the sequential forward feature selection technique to select the best features. However, the authors concluded that the performance of the classifiers varied depending on the datasets and the selected features [38]. Our study aimed to fuse data from only two modalities, ECG and GSR, using wearable sensors in a user-friendly environment to avoid complexity.
3. Methodology
Modalities such as skin temperature, EEG, and respiration rate are suitable for clinical measurements. ECG and GSR signal modalities are suitable for detecting emotions because these data can be easily collected using smart bands. In this study, we classified emotions under three scenarios:
- Scenario 1: Classifying emotions based on ECG data.
- Scenario 2: Classifying emotions based on GSR data.
- Scenario 3: Classifying emotions based on the fusion of ECG and GSR features.
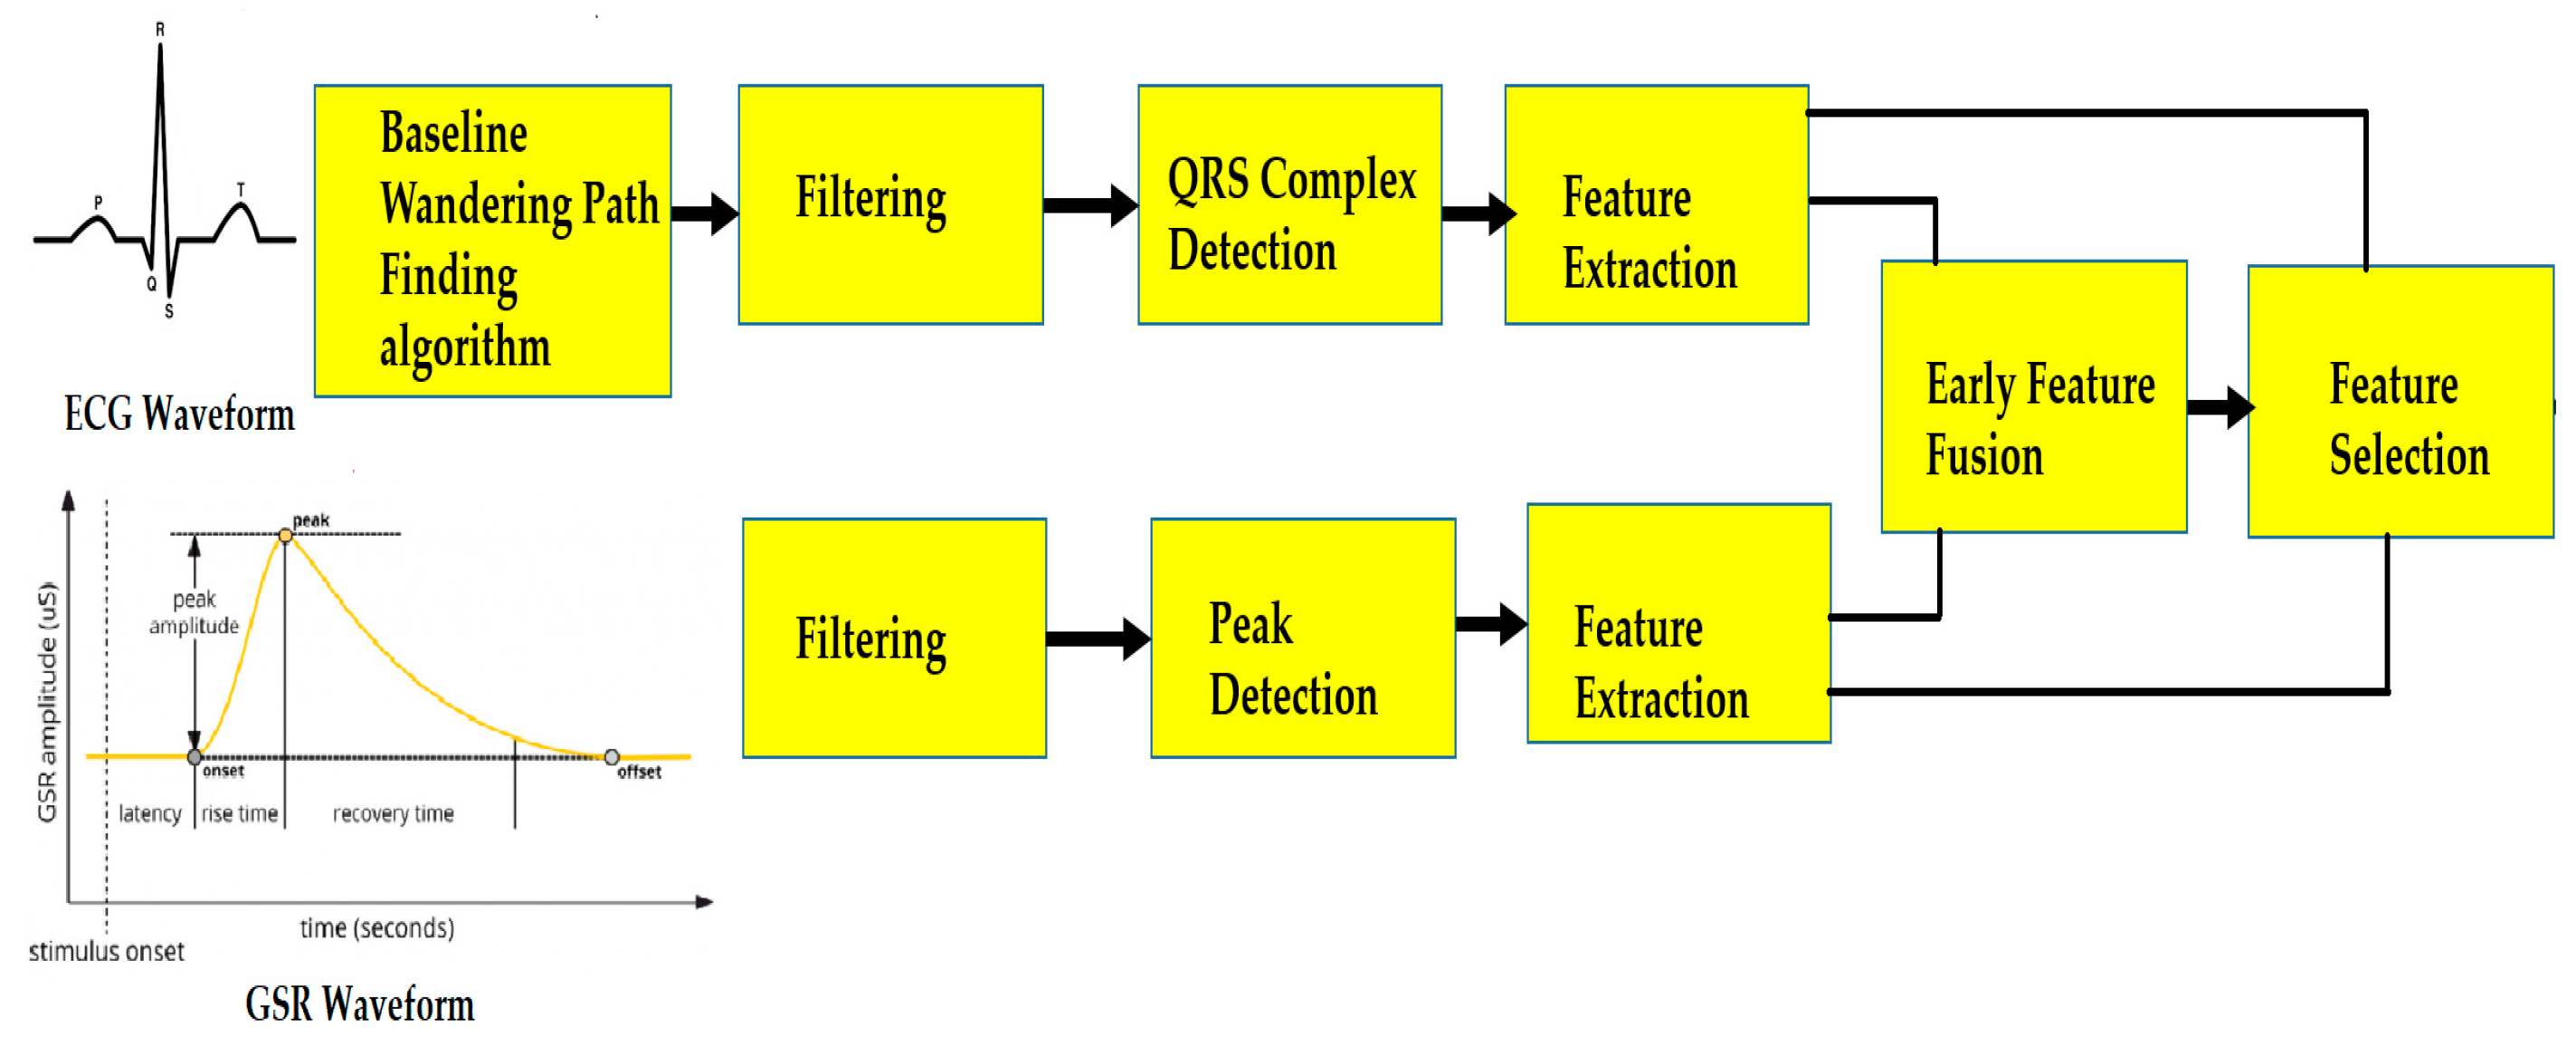
A block diagram for the preprocessing and feature fusion of ECG and GSR signals is shown in Figure 2. The selected features could be from either ECG or GSR modalities or the fusion of ECG and GSR features.
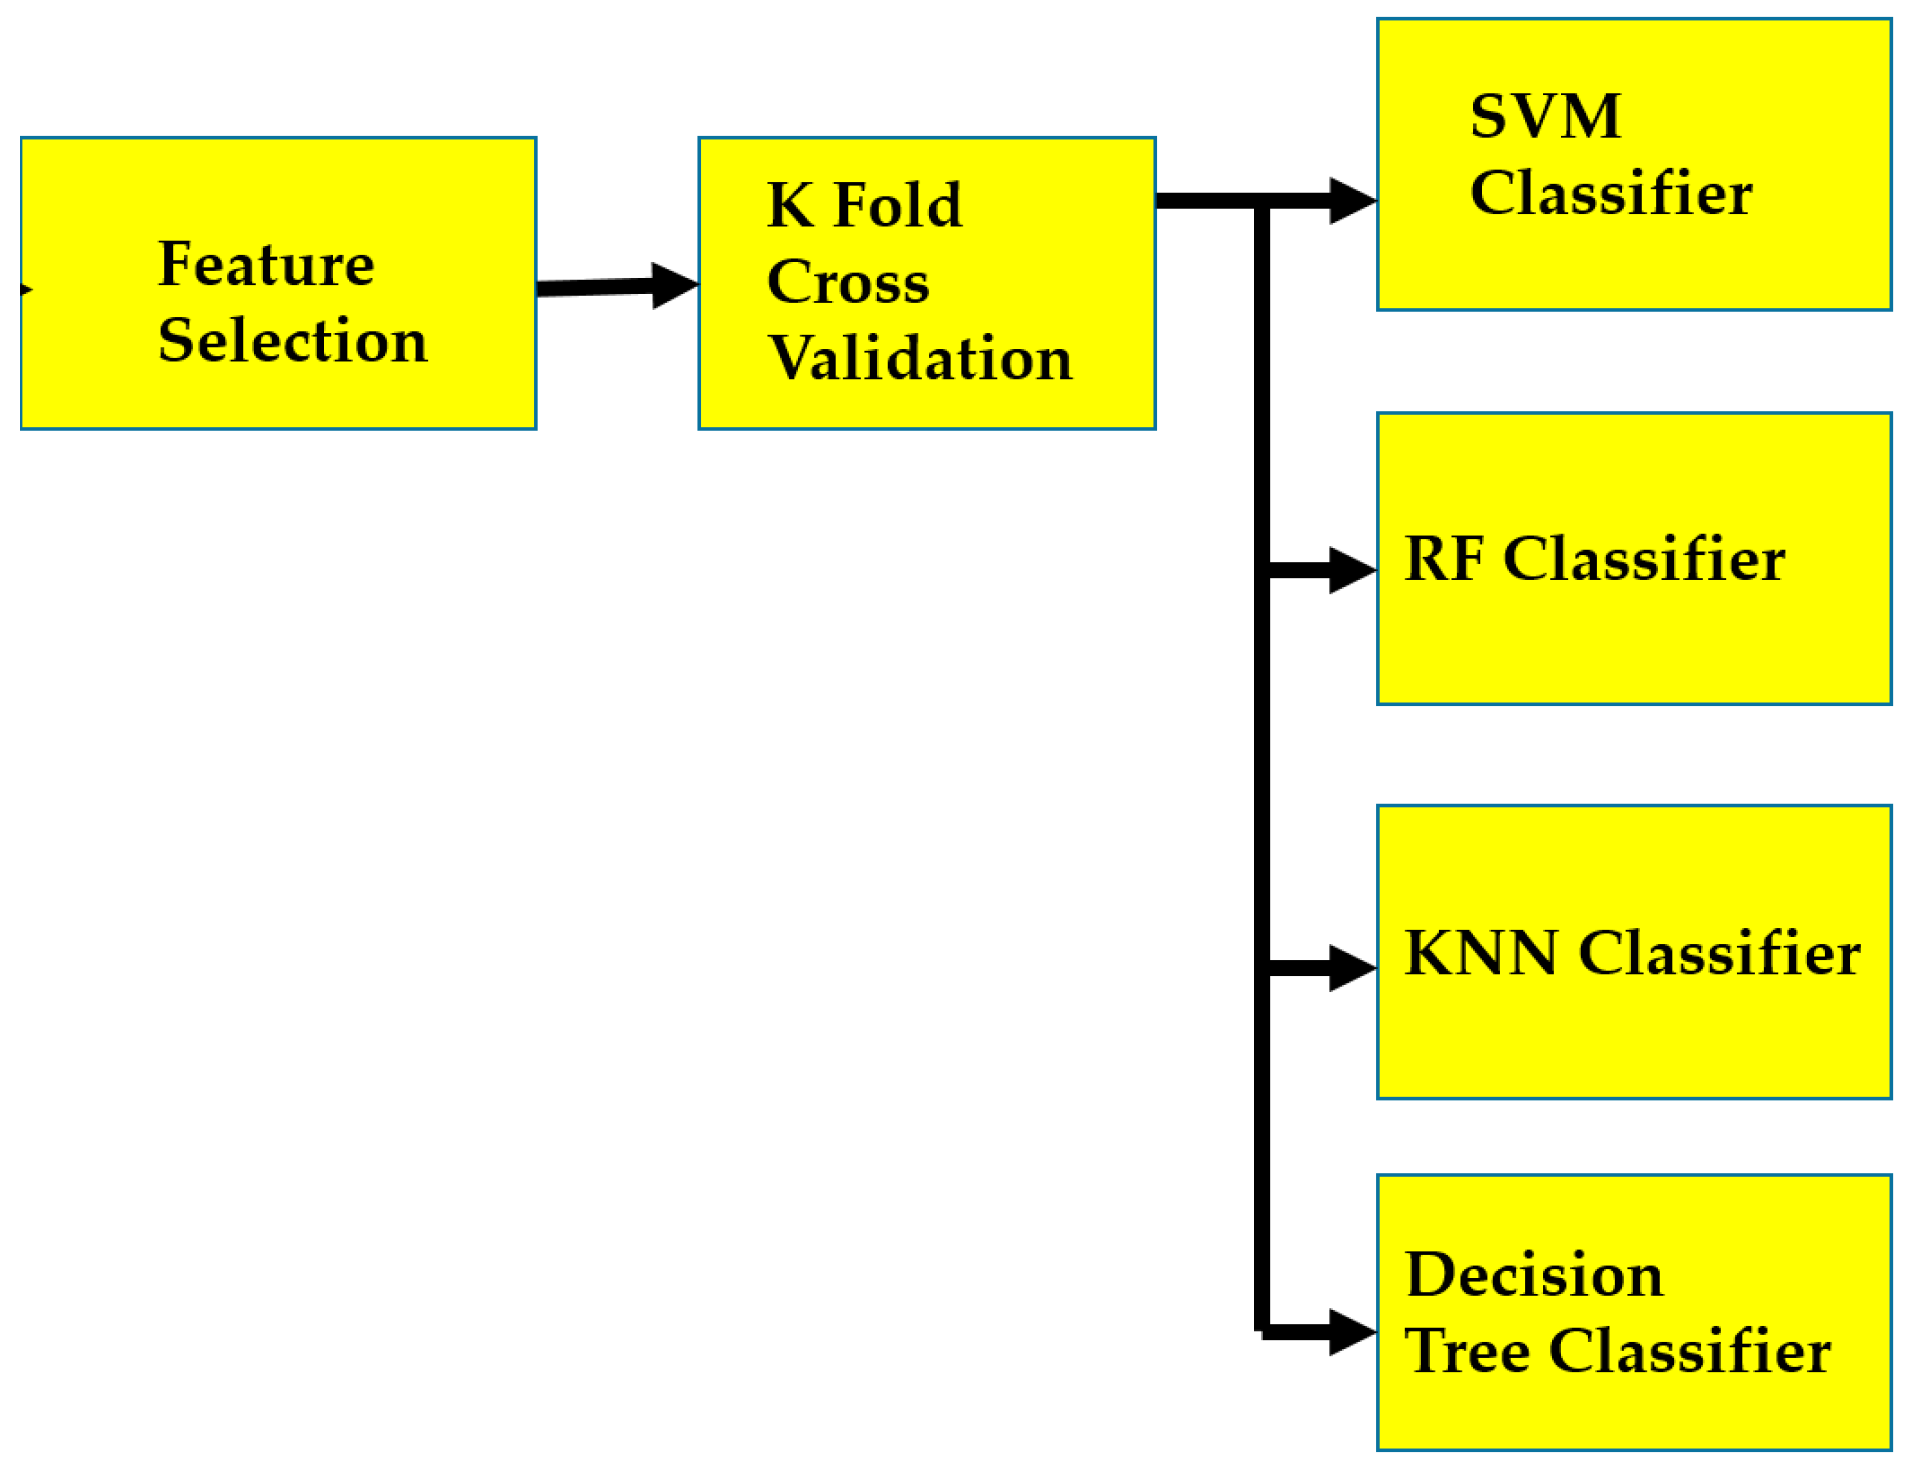
A block diagram for emotion classification using various machine learning classifiers is shown in Figure 3. The best features derived from ECG or GSR or the fusion of ECG and GSR were selected, and various machine learning classifiers were trained using the k-fold cross validation technique.
3.1. Database
The AMIGOS database is the first of its kind to explore the affect, mood, social context, and personality traits of subjects through ECG and GSR signal recordings. The database contains recordings of 40 participants while they watched 16 short videos [18]. However, we only used the ECG and GSR signal recordings of participants while watching the videos numbered 1, 6, 8, and 12 in our work [18,19]. These short videos are less than 1.5 min long, and each video represents a different quadrant of Russell’s model: Video 1 (HVLA), Video 6 (LVLA), Video 8 (LVHA), and Video 12 (HVHA). For valence classification, we considered the high-Valence data of videos 1 and 12 and the low-Valence data of videos 6 and 8. Moreover, we used high-Arousal data from videos 8 and 12 and low-Arousal data from videos 1 and 6 for the Arousal classification of emotions.
3.2. Preprocessing
To classify emotions, the noise from the ECG signal is eliminated using preprocessing techniques. Additionally, relevant information from the signal is extracted at this stage. The variations in the intervals of the ECG signal can help classify emotions. For instance, the skin conductance of GSR varies as per Arousal, with increased peaks indicating high Arousal [19]. The steps followed to carry out the preprocessing of ECG and GSR signals are explained further below.
3.2.1. Scenario 1: ECG Signal Preprocessing
The ECG waveform has a baseline that indicates no overall depolarization or repolarization. The atrial depolarization is represented by the P wave, which lasts for 80–100 ms. The ventricular depolarization is indicated by the QRS complex, which lasts for 80–120 ms [19]. The ventricular repolarization is specified by the T wave and lasts for 200 ms [14,19]. To eliminate noise in the raw ECG signals due to baseline drift, muscle artifacts, and electrode motion, a filtering technique and an algorithm are used. A low-pass Butterworth filter of 15 HZ is used to reduce electrical noise and muscle artifacts. In addition, Butterworth’s high-pass filter with a cut-off frequency of 0.5 Hz is employed to minimize motion artifacts in the ECG signals [19].
To eliminate baseline drift, a baseline wandered path-finding algorithm is employed. This algorithm splits the ECG signal into several segments, each of which contains one or more baseline wandered paths. Next, each segment is approximated by a polynomial with a variable , as shown in Equation (1) [19,39].
Deviance between the ECG signal segment and the poly-fitted signal, , is determined by increasing the polynomial order until the error is minimized [19,39]. Here, , , etc., indicate the polynomial coefficients, and is the polynomial degree [39]. It is crucial to extract relevant information from a preprocessed ECG signal. To retrieve the RR interval from the ECG signal, the QRS complex must be identified and extracted [19,40]. The Pan–Tompkins algorithm is used to detect the QRS complex, and from there, the RR interval is extracted [19,40]. As per the algorithm, the first derivative of the signal, d0(q), is obtained for the ECG amplitude ‘r’ and time instant ‘q’ using Equation (2) [19].
d0(q) = ABS[r(q + 1) − r(q − 1)], 3 < q < 8188
The first derivative is smoothened as shown in Equation (3).
d1(q) = [d0(q − 1) + 2d0(q) + d0(q + 1)]/4, 3 < q < 8188
The rectified second derivative, d2, is calculated in Equation (4).
d2(q) = ABS[s(q + 2) − 2s(q) + s(q − 2), 3 < q < 8188
The first and second derivatives are added to form Equation (5).
d3(q) = t1(q) + t2(q), 3 < q < 8188
The primary and secondary thresholds are obtained in Equations (6) and (7).
Primary threshold = 0.8max[d3(q)], 3 < q < 8188
Secondary threshold = 0.1max[d3(q)], 3 < q < 8188
Additionally, the smallest and largest positive valued elements of the array of sample points of the synthesized ECG in Equations (2)–(7) are 3 and 8188, respectively.
The ECG data of thirty-eight participants who were watching the above-mentioned four videos were preprocessed and filtered. To recognize a QRS candidate, an array of a sum of the first and second derivatives is checked against the primary threshold. Additionally, six points consecutively greater than the second threshold are required [19,40].
3.2.2. Scenario 2: GSR Signal Preprocessing
The sweat content of human skin can increase when individuals experience emotional Arousal [19,41]. To measure this response, the Galvanic Skin Response (GSR) signal is used. The GSR signal is filtered with a low-pass Butterworth filter with a cut-off frequency of 19 Hz, and the coefficients obtained from the original Butterworth filter are applied to the signal using a zero-phase digital filter [19,26]. The amplitude of the GSR waveform starts rising a few seconds after stimulation, with the peak amplitude indicating the maximum amplitude [41]. The GSR data of thirty-eight participants while watching short videos are used for classification.
3.3. Feature Extraction
The features are extracted from the preprocessed ECG and GSR signals as below. The early fusion of ECG and GSR signals based on concatenation is proposed in this model.
3.3.1. Scenario 1: ECG Feature Extraction
The time difference between two consecutive R peaks in the ECG waveform is defined as the RR interval [19]. To analyze this interval, various time domain features, such as the median RR interval, the standard deviation of the RR interval series, the mean RR interval, the coefficient of variation, the number of pairs of successive NNs that diverge by 50 ms, kurtosis, the root mean square of the differences of successive R-R interval (RMSD), and the mode are extracted. Additionally, frequency domain features such as the power spectral entropy (SE) and the power spectral density (PSD) are extracted from the ECG signal. PSD measures the power in the signal at different frequency components. The root mean square of the differences of successive R-R intervals (RMSD), standard deviation, and coefficient of variation (CV) are given in Equation (8), Equation (9), and Equation (10), respectively [19].
where i indicates the interval at index i, and indicates the number of samples.
Standard deviation (S) of interval series:
Coefficient of variation (CV):
3.3.2. Scenario 2: GSR Feature Extraction
The time domain GSR signals are used to extract statistical measures such as standard deviation, maximum value, mean, kurtosis, and variance. Kurtosis is a statistical measure that defines how different the tails of a distribution are from a normal distribution, as shown in Equation (11) [19].
where is the standard deviation, and is the number of samples.
Frequency domain features such as power spectral entropy are also extracted.
3.4. Feature Selection
Our algorithm selects the most optimal features required for classification by measuring the entropy of the features and calculating the dependency between the two variables [42]. In addition, we used a mutual information gain of 10% to determine the total number of features to be retained. Our algorithm also eliminates duplicate features, thereby eliminating redundancy. Once the features were selected, we partitioned the corresponding dataset into training and test sets using the five-fold cross-validation technique [43]. The k-fold cross-validation technique divides the dataset into K-equal sets. We trained the network over (K − 1) sets with one set under test each time [43]. We used the same dataset for both training and testing, making it a subject-dependent classification method.
3.5. Feature Fusion
Fusion is a process of combining information from multiple sources. There are different fusion techniques, including early fusion and decision-level fusion. In early fusion, features from different sources are combined by concatenation, and the best features are chosen for further processing. In decision-level fusion, the outputs of classifiers trained on individual sources are combined by weighting to make the final classification. Feature-level fusion can be used if the features from multiple sensors can be combined in the same feature vector. Moreover, feature-level fusion reduces the complexity of the task by eliminating the need for additional algorithms for decision making. In our model, we used feature fusion-based Arousal classification and feature fusion-based Valence classification. For Arousal classification, we used the power spectral entropy and kurtosis of the GSR data, and for Valence classification, we used the standard deviation of the GSR data.
3.6. Classification
The model’s performance was validated using different classifiers, such as SVM, RF, KNN, and Decision Tree classifiers. KNN classifies a sample based on its proximity to the neighbors [44]. We found that classification based on three neighbors gives the best accuracy for our model. The training data are stored in the memory of the KNN classifier, which makes it easy to adjust to new data. SVM uses a kernel technique to classify non-linear data. We optimized the performance of the SVM classifier by using a radial basis function (RBF) hyperparameter. The Decision Tree classifier is a tree-based model that is suitable for non-linear data but may not be appropriate for unseen data [45]. The RF classifier with multiple Decision Trees performs classification based on the majority voting by all the trees [46]. We used Matlab software (https://www.mathworks.com/products/matlab.html, accessed on 30 January 2024) for signal processing and feature extraction, while Python software (https://www.python.org/, accessed on 30 January 2024) was used for implementing machine learning techniques.
4. Results
The model uses the mutual information technique for feature selection and various classifiers, such as SVM, KNN, RF, and Decision Tree classifiers, to train the model using the data obtained from preprocessed ECG and GSR signals. The model’s performance was evaluated based on F1 score, precision, recall, and accuracy for three different scenarios [33].
4.1. Scenario 1: Emotion Classification Using ECG Data
4.2. Scenario 2: Emotion Classification Using GSR Data
4.3. Scenario 3: Emotion Classification via the Fusion of ECG and GSR Features
Fused features are classified based on the Valence–Arousal scale. Table 5 and Table 6 present values for 5-fold accuracy, average accuracy, precision, recall, and F1 score, respectively.
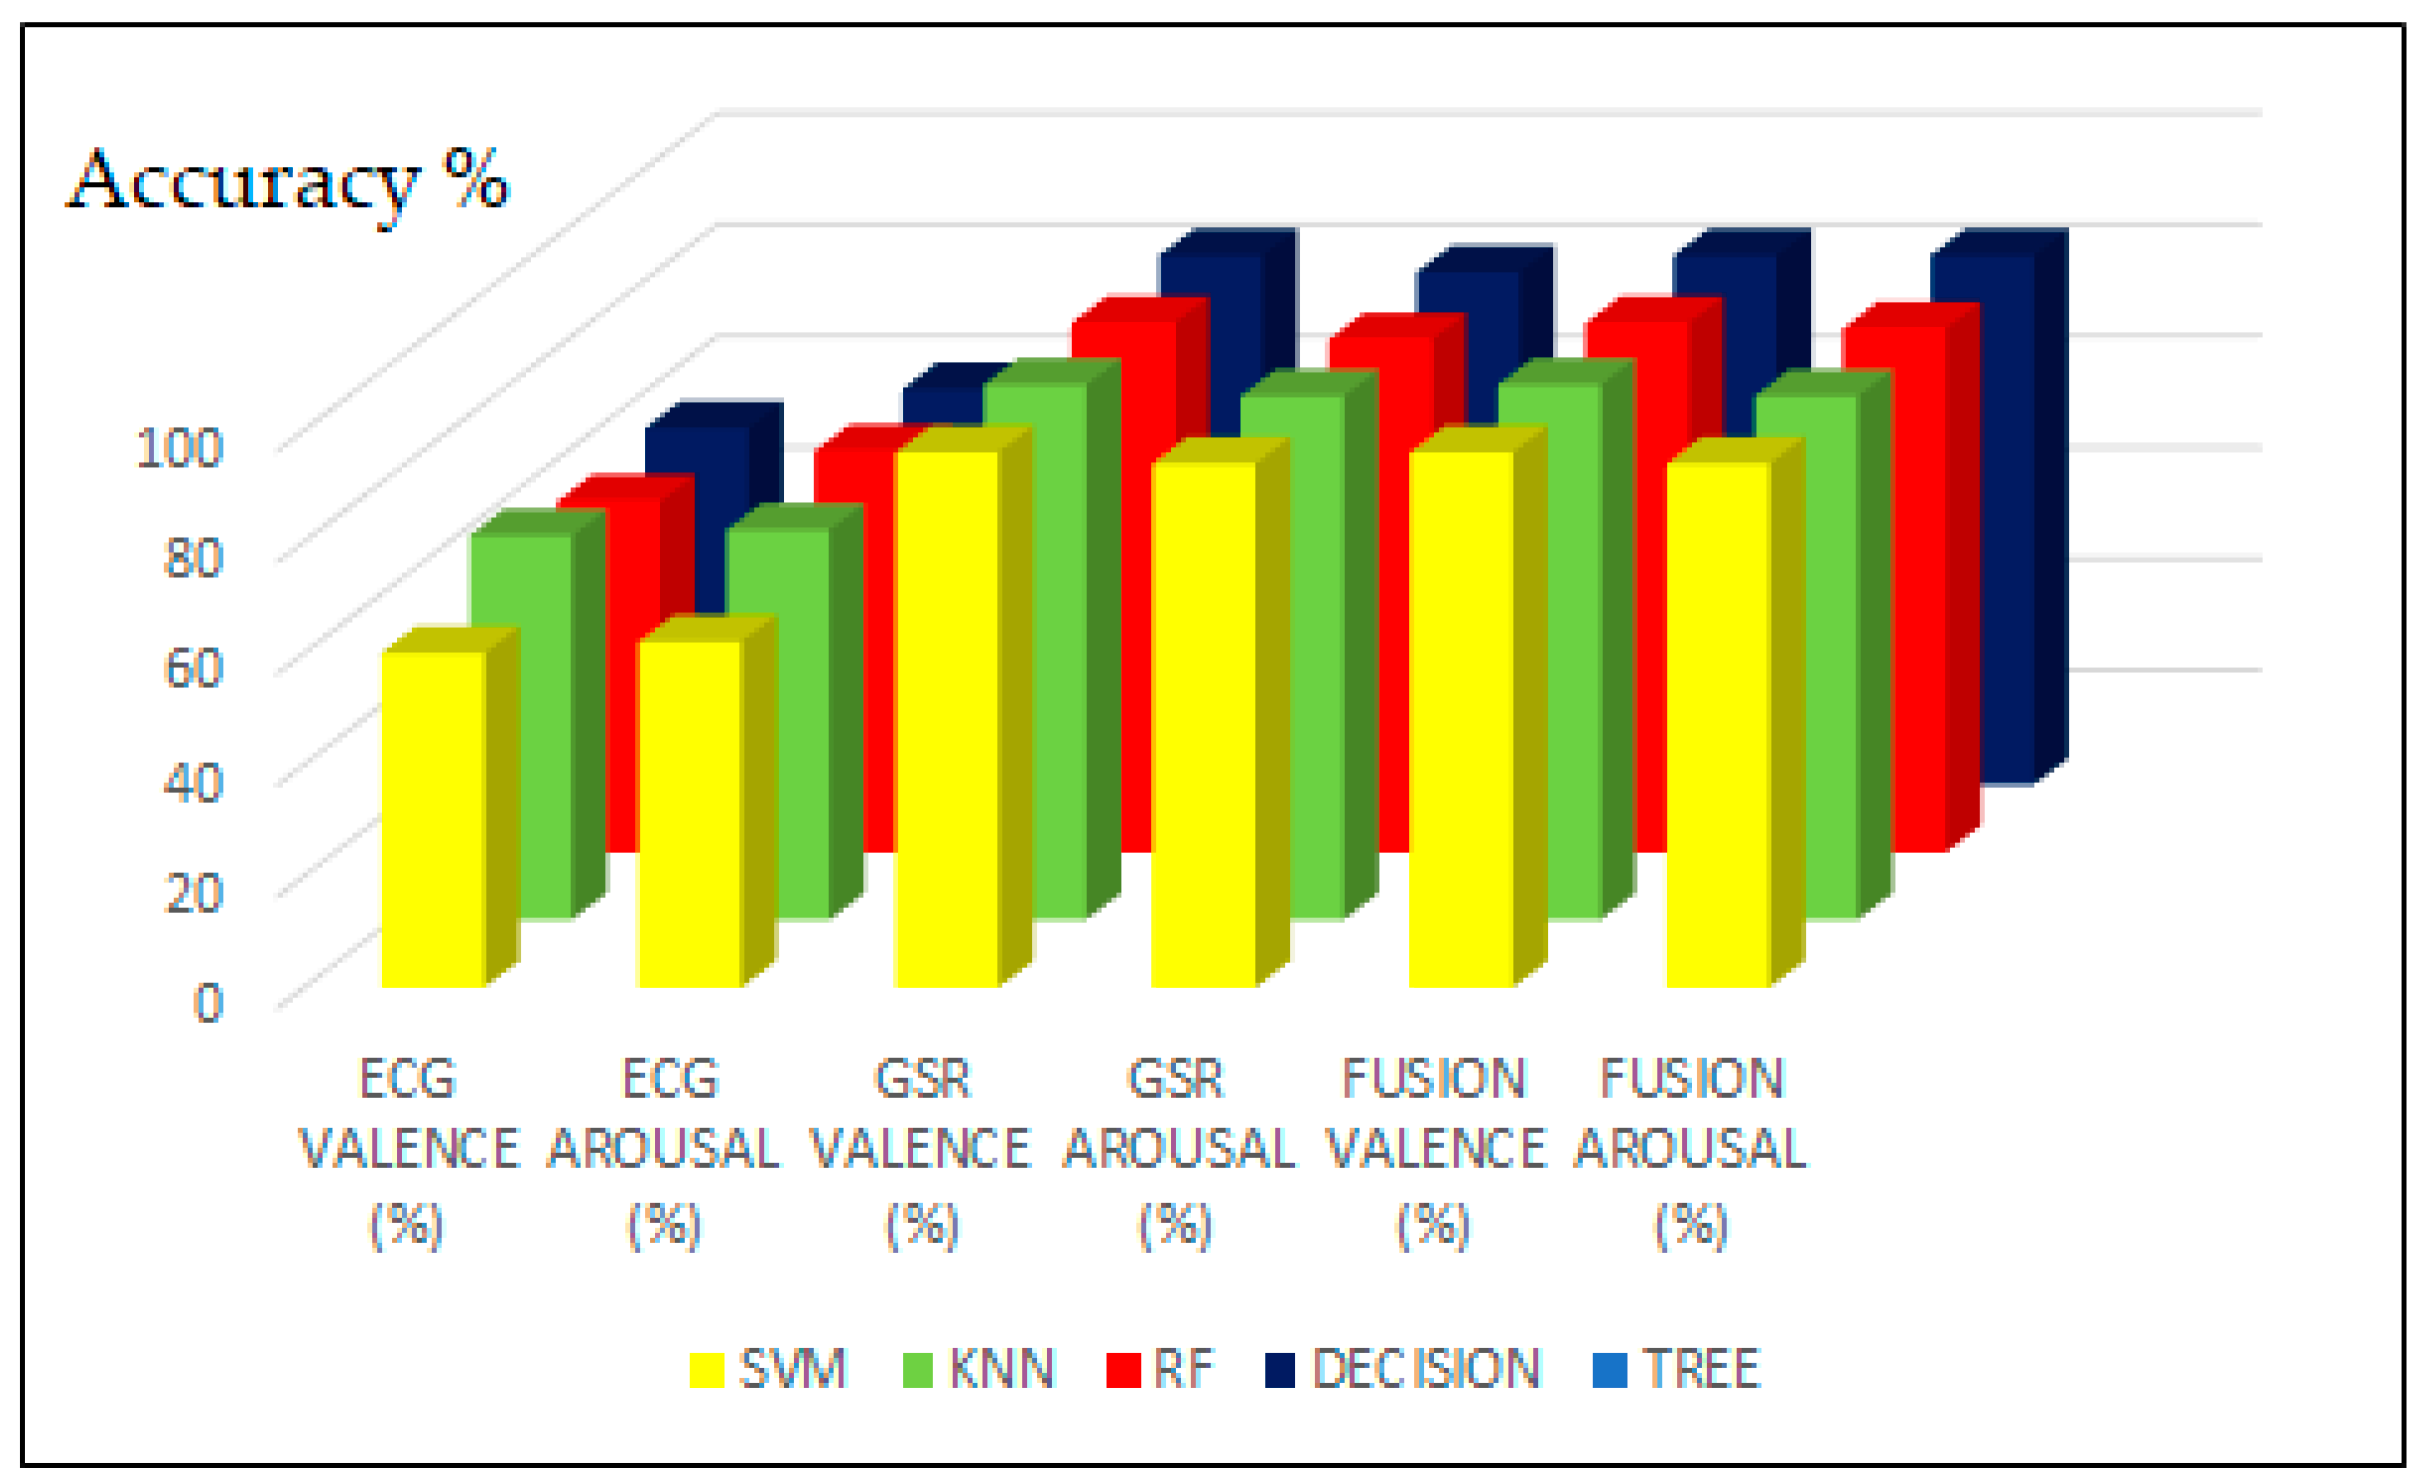
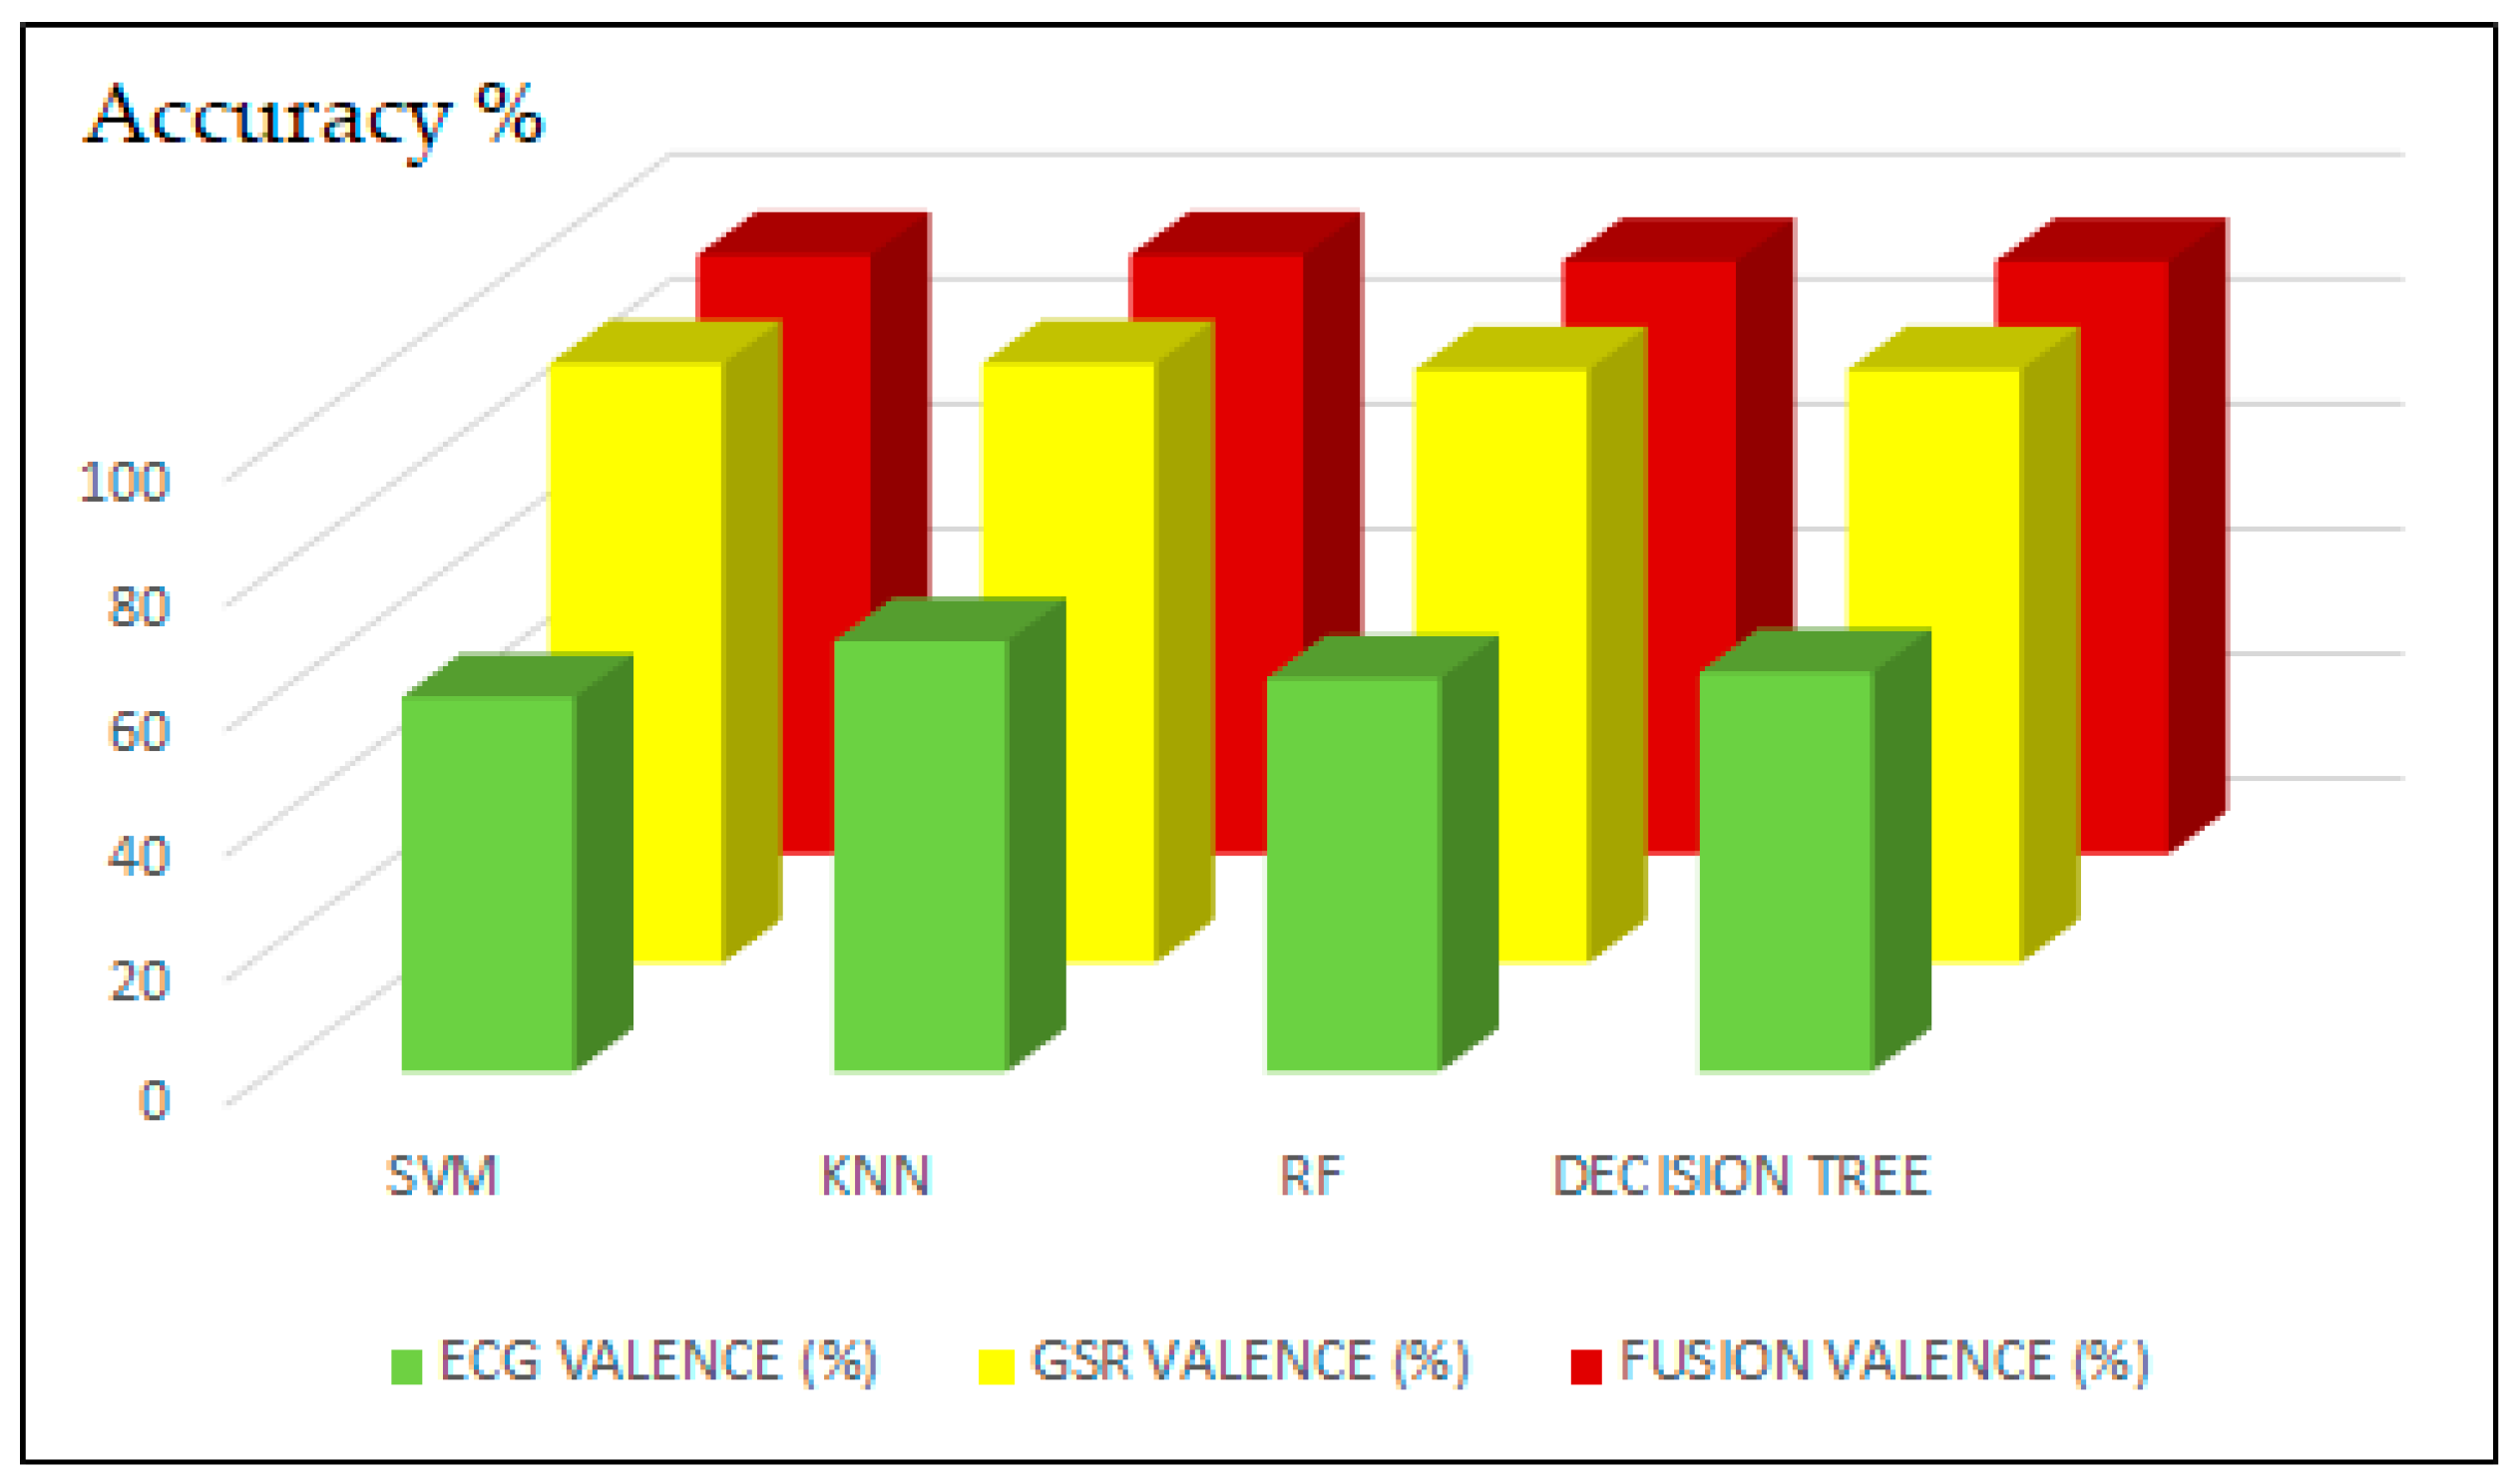
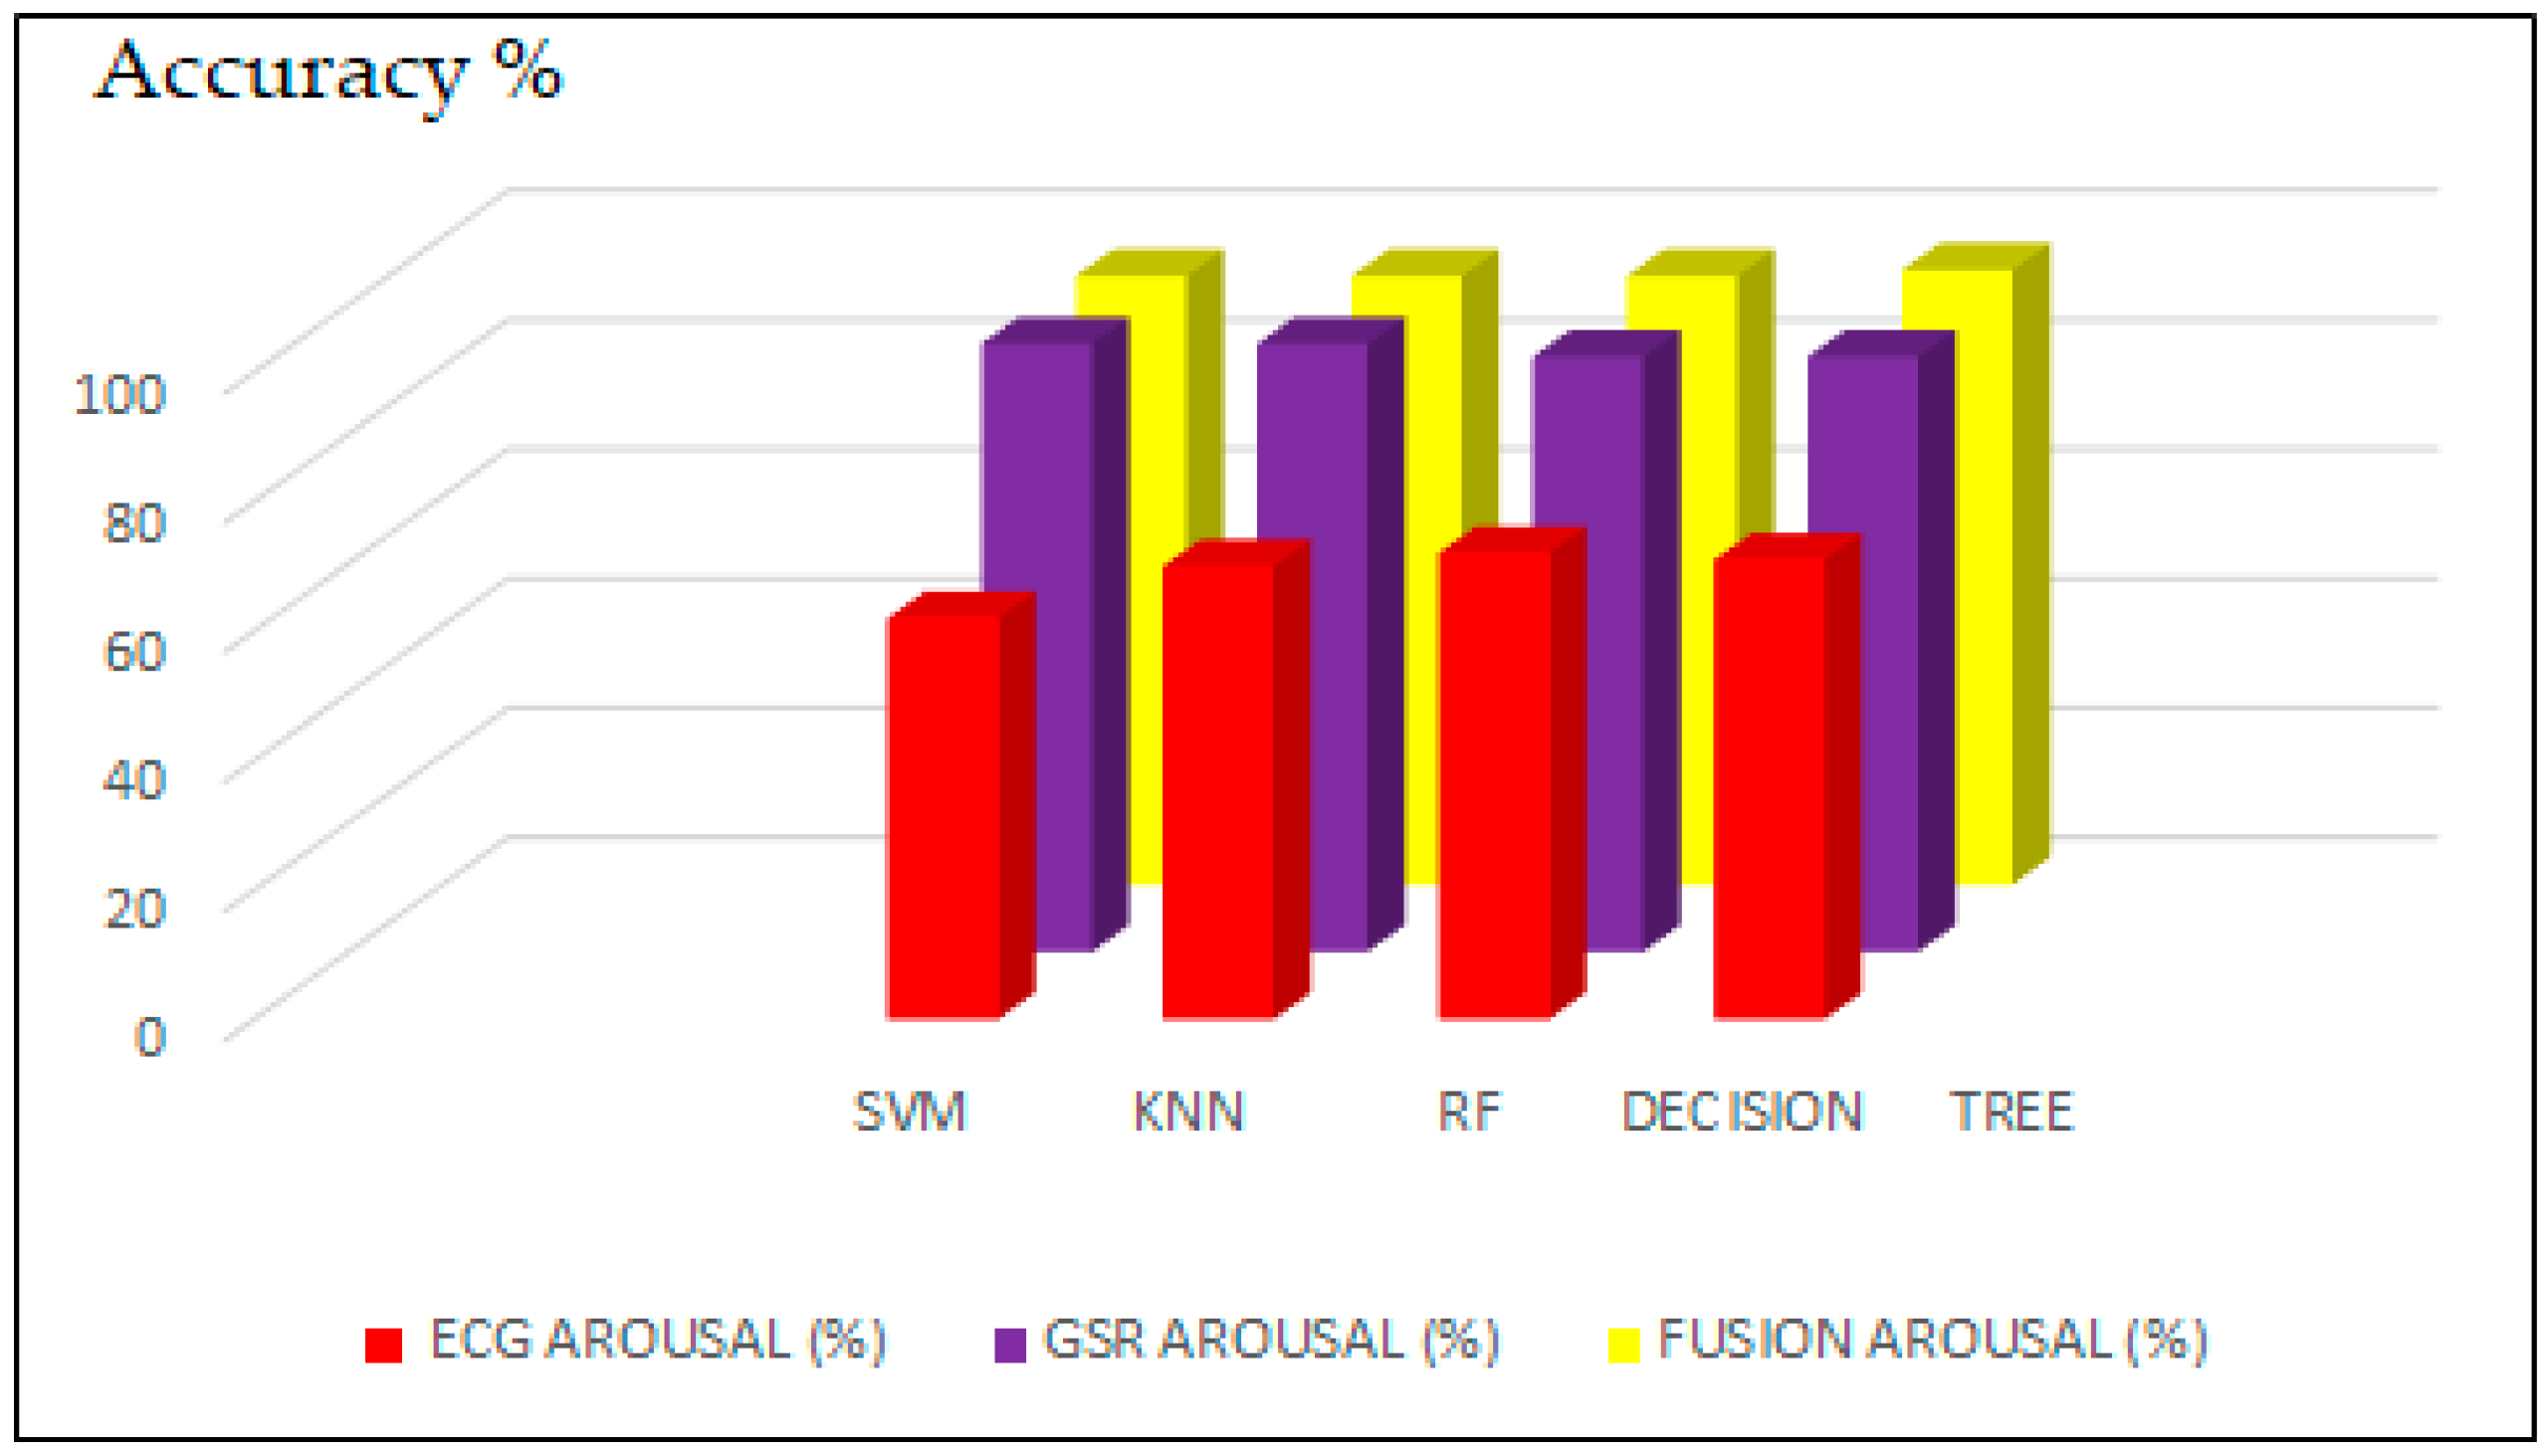
The model’s performance was evaluated and validated using multiple modalities and various machine learning classifiers, which are presented in Table 7 and Figure 4. Comparisons of the accuracy percentages achieved by the classifiers for Valence and Arousal are shown in Figure 5 and Figure 6, respectively. The KNN classifier achieved the highest accuracy for Valence and Arousal classification, with values of 69% and 70% for ECG and 96% and 94% for both GSR and early Fusion, respectively, as shown in Table 7.
Figure 4, Figure 5 and Figure 6 indicate that GSR is a more effective modality for emotion classification compared to the ECG. The fusion of ECG and GSR features significantly increases the classification accuracy in comparison to the ECG. The performance measures are similar for all the classifiers. However, the KNN classifier outperforms all others in all scenarios.
5. Discussion
Table 8, Table 9 and Table 10 compare the classification accuracies for the three scenarios described above with those reported in the literature. The relevant features were selected from preprocessed ECG and GSR signals using the mutual information feature selection technique. The model’s performance was validated through the use of various classification techniques and multiple modalities.
Table 8 demonstrates that using the mutual information technique for feature selection, k-fold for cross-validation, and KNN for classification improves the accuracy of emotion classification for ECG data. Similarly, Table 9 shows that using k-fold for cross-validation and KNN for classification enhances the accuracy of classification. Moreover, Table 10 shows that implementing a novel technique of early fusion can lead to an improvement in classification accuracy. Therefore, this study contributes to the literature by establishing a more accurate model that is suitable for classification and uses both unimodal and multimodal data. The proposed model’s enhancements are mainly due to appropriate preprocessing, feature extraction, feature selection, and classification techniques. This study confirms that GSR is a preferred modality for emotion classification. J. A. Miranda-Correa et al. combined the classification outcomes of ECG, GSR, and EEG data and achieved Valence–Arousal classification accuracies of 57% and 58.5% using decision-level fusion techniques. However, decision-level fusion did not enhance the results compared to the individual modalities [18]. Our study’s limitations include the fact that the manual extraction of time and frequency features and subject-dependent classification were employed. Additionally, the same dataset was utilized for both training and testing. Therefore, the model’s accuracy may slightly deviate when exposed to unseen data.
6. Conclusions
Most researchers have focused on building emotion recognition models using a single modality. However, this study proposes a model suitable for multiple modalities to enhance classification accuracy. The model demonstrates the effectiveness of ECG and GSR modalities for emotion classification. Additionally, this study showcases a novel technique based on the early fusion of ECG and GSR features. Although all classifiers performed similarly, KNN outperformed the others, giving the highest accuracies for Valence and Arousal, with accuracies of 69% and 70% for ECG and 96% and 94% for GSR, respectively. The classification accuracy obtained with the GSR modality outperformed other modalities for emotion detection, verifying that GSR is better suited for emotion classification. The fusion of ECG and GSR features significantly improved classification accuracy compared to the use of ECG alone. The proposed model, built on multiple modalities, demonstrates reliability and improved classification accuracy. The performance of the model was validated using multiple modalities and various machine learning classifiers used for emotion classification. Machine learning techniques based on handcrafted feature extraction have the advantage of being less complex in terms of hardware and computing facility requirements. In the future, subject-independent classification can be achieved to make the system free of biasing effects. Furthermore, using the recently published databases on ECG and GSR signals, the proposed model can be applied to classify emotions.
Author Contributions
A.D. and H.V. contributed equally to the work related to this manuscript. All authors have read and agreed to the published version of the manuscript.
Funding
This research received no external funding.
Institutional Review Board Statement
Not applicable.
Informed Consent Statement
Not applicable.
Data Availability Statement
The data are available upon approval at http://www.eecs.qmul.ac.uk/mmv/datasets/amigos/index.html (publicly available database for research), accessed on 15 June 2022.
Acknowledgments
The authors are thankful to the Goa College of Engineering, affiliated with Goa University, for supporting the work carried out in this study.
Conflicts of Interest
The authors declare no conflicts of interest.
References
- Egger, M.; Ley, M.; Hanke, S. Emotion recognition from physiological signal analysis: A review. Electron. Notes Theor. Comput. Sci. 2019, 343, 35–55. [Google Scholar] [CrossRef]
- Bulagang, A.F.; Weng, N.G.; Mountstephens, J.; Teo, J. A review of recent approaches for emotion classification using electrocardiography and electrodermography signals. Inform. Med. Unlocked 2020, 20, 100363. [Google Scholar] [CrossRef]
- Sepúlveda, A.; Castillo, F.; Palma, C.; Rodriguez-Fernandez, M. Emotion recognition from ECG signals using wavelet scattering and machine learning. Appl. Sci. 2021, 11, 4945. [Google Scholar] [CrossRef]
- Dessai, A.; Virani, H. Emotion Classification using Physiological Signals: A Recent Survey. In Proceedings of the 2022 IEEE International Conference on Signal Processing, Informatics, Communication and Energy Systems (SPICES), Trivandrum, India, 10–12 March 2022; IEEE: Piscataway, NJ, USA, 2022; Volume 1, pp. 333–338. [Google Scholar]
- Li, K.; Shen, X.; Chen, Z.; He, L.; Liu, Z. Effectiveness of Emotion Eliciting of Video Clips: A Self-report Study. In The International Conference on Natural Computation, Fuzzy Systems and Knowledge Discovery; Springer International Publishing: Cham, Switzerland, 2020; pp. 523–542. [Google Scholar]
- Bhangale, K.; Kothandaraman, M. Speech Emotion Recognition Based on Multiple Acoustic Features and Deep Convolutional Neural Network. Electronics 2023, 12, 839. [Google Scholar] [CrossRef]
- Velu, S.R.; Ravi, V.; Tabianan, K. Multi-Lexicon Classification and Valence-Based Sentiment Analysis as Features for Deep Neural Stock Price Prediction. Sci 2023, 5, 8. [Google Scholar] [CrossRef]
- Alonazi, M.; Alshahrani, H.J.; Alotaibi, F.A.; Maray, M.; Alghamdi, M.; Sayed, A. Automated Facial Emotion Recognition Using the Pelican Optimization Algorithm with a Deep Convolutional Neural Network. Electronics 2023, 12, 4608. [Google Scholar] [CrossRef]
- Hasnul, M.A.; Aziz NA, A.; Alelyani, S.; Mohana, M.; Aziz, A.A. Electrocardiogram-based emotion recognition systems and their applications in healthcare—A review. Sensors 2021, 21, 5015. [Google Scholar] [CrossRef]
- Tan, C.; Ceballos, G.; Kasabov, N.; Puthanmadam Subramaniyam, N. Fusionsense: Emotion classification using feature fusion of multimodal data and deep learning in a brain-inspired spiking neural network. Sensors 2020, 20, 5328. [Google Scholar] [CrossRef] [PubMed]
- Shahzad, H.F.; Saleem, A.A.; Ahmed, A.; Ur KS, H.; Siddiqui, R. A Review on Physiological Signal Based Emotion Detection. Ann. Emerg. Technol. Comput. 2021, 5. [Google Scholar] [CrossRef]
- Saganowski, S. Bringing emotion recognition out of the lab into real life: Recent advances in sensors and machine learning. Electronics 2022, 11, 496. [Google Scholar] [CrossRef]
- Dessai, A.U.; Virani, H.G. Emotion Detection and Classification Using Machine Learning Techniques. In Multidisciplinary Applications of Deep Learning-Based Artificial Emotional Intelligence; IGI Global: Hershey, PA, USA, 2023; pp. 11–31. [Google Scholar]
- DevTeam, Shimmer. Shimmer Solicits Clinical Research Community Input on Expanded Open Wearables Initiative (OWEAR). Shimmer Wearable Sensor Technology. Available online: https://shimmersensing.com/shimmer-solicits-clinical-research-community-input-on-expanded-open-wearables-initiative-owear/ (accessed on 24 August 2021).
- Koelstra, S.; Muhl, C.; Soleymani, M.; Lee, J.S.; Yazdani, A.; Ebrahimi, T.; Patras, I. Deap: A database for emotion analysis; using physiological signals. IEEE Trans. Affect. Comput. 2011, 3, 18–31. [Google Scholar] [CrossRef]
- Soleymani, M.; Lichtenauer, J.; Pun, T.; Pantic, M. A multimodal database for affect recognition and implicit tagging. IEEE Trans. Affect. Comput. 2011, 3, 42–55. [Google Scholar] [CrossRef]
- Subramanian, R.; Wache, J.; Abadi, M.K.; Vieriu, R.L.; Winkler, S.; Sebe, N. ASCERTAIN: Emotion and personality recognition using commercial sensors. IEEE Trans. Affect. Comput. 2016, 9, 147–160. [Google Scholar] [CrossRef]
- Miranda-Correa, J.A.; Abadi, M.K.; Sebe, N.; Patras, I. Amigos: A dataset for affect, personality and mood research on individuals and groups. IEEE Trans. Affect. Comput. 2018, 12, 479–493. [Google Scholar] [CrossRef]
- Dessai, A.; Virani, H. Emotion detection using physiological signals. In Proceedings of the 2021 International Conference on Electrical, Computer and Energy Technologies (ICECET), Cape Town, South Africa, 9–10 December 2021; IEEE: Piscataway, NJ, USA, 2021; pp. 1–4. [Google Scholar]
- Dar, M.N.; Akram, M.U.; Khawaja, S.G.; Pujari, A.N. CNN and LSTM-based emotion charting using physiological signals. Sensors 2020, 20, 4551. [Google Scholar] [CrossRef] [PubMed]
- Ismail SN, M.S.; Aziz NA, A.; Ibrahim, S.Z.; Nawawi, S.W.; Alelyani, S.; Mohana, M.; Chun, L.C. Evaluation of electrocardiogram: Numerical vs. image data for emotion recognition system. F1000Research 2021, 10, 1114. [Google Scholar] [CrossRef]
- Romeo, L.; Cavallo, A.; Pepa, L.; Bianchi-Berthouze, N.; Pontil, M. Multiple instance learning for emotion recognition using physiological signals. IEEE Trans. Affect. Comput. 2019, 13, 389–407. [Google Scholar] [CrossRef]
- Bulagang, A.F.; Mountstephens, J.; Teo, J. Multiclass emotion prediction using heart rate and virtual reality stimuli. J. Big Data 2021, 8, 12. [Google Scholar] [CrossRef]
- Katsigiannis, S.; Ramzan, N. DREAMER: A database for emotion recognition through EEG and ECG signals from wireless low-cost off-the-shelf devices. IEEE J. Biomed. Health Inform. 2017, 22, 98–107. [Google Scholar] [CrossRef]
- Shukla, J.; Barreda-Angeles, M.; Oliver, J.; Nandi, G.C.; Puig, D. Feature extraction and selection for emotion recognition from electrodermal activity. IEEE Trans. Affect. Comput. 2019, 12, 857–869. [Google Scholar] [CrossRef]
- Santamaria-Granados, L.; Munoz-Organero, M.; Ramirez-Gonzalez, G.; Abdulhay, E.; Arunkumar NJ, I.A. Using deep convolutional neural network for emotion detection on a physiological signals dataset (AMIGOS). IEEE Access 2018, 7, 57–67. [Google Scholar] [CrossRef]
- Hammad, D.S.; Monkaresi, H. Ecg-based emotion detection via parallel-extraction of temporal and spatial features using convolutional neural network. Trait. Du Signal 2022, 39, 43. [Google Scholar] [CrossRef]
- Lee, M.; Lee, Y.K.; Lim, M.T.; Kang, T.K. Emotion recognition using convolutional neural network with selected statistical photoplethysmogram features. Appl. Sci. 2020, 10, 3501. [Google Scholar] [CrossRef]
- Aslan, M. CNN based efficient approach for emotion recognition. J. King Saud Univ.-Comput. Inf. Sci. 2022, 34, 7335–7346. [Google Scholar] [CrossRef]
- Han, E.-G.; Kang, T.-K.; Lim, M.-T. Physiological Signal-Based Real-Time Emotion Recognition Based on Exploiting Mutual Information with Physiologically Common Features. Electronics 2023, 12, 2933. [Google Scholar] [CrossRef]
- Lee, M.S.; Lee, Y.K.; Pae, D.S.; Lim, M.T.; Kim, D.W.; Kang, T.K. Fast emotion recognition based on single pulse PPG signal with convolutional neural network. Appl. Sci. 2019, 9, 3355. [Google Scholar] [CrossRef]
- Filippini, C.; Di Crosta, A.; Palumbo, R.; Perpetuini, D.; Cardone, D.; Ceccato, I.; Di Domenico, A.; Merla, A. Automated Affective Computing Based on Bio-Signals Analysis and Deep Learning Approach. Sensors 2022, 22, 1789. [Google Scholar] [CrossRef] [PubMed]
- Dessai, A.; Virani, H. Emotion Classification Based on CWT of ECG and GSR Signals Using Various CNN Models. Electronics 2023, 12, 2795. [Google Scholar] [CrossRef]
- Al Machot, F.; Elmachot, A.; Ali, M.; Al Machot, E.; Kyamakya, K. A deep-learning model for subject-independent human emotion recognition using electrodermal activity sensors. Sensors 2019, 19, 1659. [Google Scholar] [CrossRef] [PubMed]
- Ahmad, Z.; Khan, N. A survey on physiological signal-based emotion recognition. Bioengineering 2022, 9, 688. [Google Scholar] [CrossRef] [PubMed]
- Khateeb, M.; Anwar, S.M.; Alnowami, M. Multi-domain feature fusion for emotion classification using DEAP dataset. IEEE Access 2021, 9, 12134–12142. [Google Scholar] [CrossRef]
- Wei, W.; Jia, Q.; Feng, Y.; Chen, G. Emotion recognition based on weighted fusion strategy of multichannel physiological signals. Comput. Intell. Neurosci. 2018, 2018, 5296523. [Google Scholar] [CrossRef] [PubMed]
- Bota, P.; Wang, C.; Fred, A.; Silva, H. Emotion assessment using feature fusion and decision fusion classification based on physiological data: Are we there yet? Sensors 2020, 20, 4723. [Google Scholar] [CrossRef]
- Kaur, M.; Singh, B.; Seema. Comparisons of Different Approaches for Removal of Baseline Wander from ECG Signal. In Proceedings of the International Conference and workshop on Emerging Trends in Technology (ICWET), Mumbai, India, 25–26 February 2011; Volume 5, pp. 30–34. [Google Scholar]
- Friesen, G.M.; Jannett, T.C.; Jadallah, M.A.; Yates, S.L.; Quint, S.R.; Nagle, H.T. A comparison of the noise sensitivity of nine QRS detection algorithms. IEEE Trans. Biomed. Eng. 1990, 37, 85–98. [Google Scholar] [CrossRef]
- Galvanic Skin Response (GSR): The Complete Pocket Guide—Imotions. 2020. Available online: https://imotions.com/blog/learning/research-fundamentals/galvanic-skin-response/ (accessed on 25 February 2020).
- Available online: https://guhanesvar.medium.com/feature-selection-based-on-mutual-information-gain-for-classification-and-regression (accessed on 20 November 2023).
- Gupta, Prashant. Cross-Validation in Machine Learning. Towards Data Science. 2017. Available online: https://towardsdatascience.com/cross-validation-in-machine-learning-72924a69872f (accessed on 20 November 2023).
- Available online: https://www.ibm.com/topics/knn (accessed on 20 November 2023).
- Available online: https://towardsdatascience.com/a-complete-view-of-decision-trees-and-svm-in-machine-learning-f9f3d19a337b (accessed on 20 November 2023).
- Available online: https://builtin.com/data-science/random-forest-algorithm (accessed on 20 November 2023).
Figure 1.
Russel’s Circumplex Model [3].
Figure 1.
Russel’s Circumplex Model [3].

Figure 2.
Block diagram for the preprocessing and feature fusion of ECG and GSR signals.

Figure 3.
Block diagram for emotion classification.

Figure 4.
Valence and Arousal classification accuracies.

Figure 5.
Valence classification accuracies.

Figure 6.
Arousal classification accuracies.


Table 1.
Performance evaluation of ECG Valence classification.
| Sr. No. | ECG Valence Classifier | 5-Fold Accuracy | ECG Valence Accuracy (%) | Precision | Recall | F1 Score |
|---|---|---|---|---|---|---|
| 1 | SVM | [0.60, 0.60, 0.67, 0.46, 0.63] | 60 | 0.56 | 0.89 | 0.68 |
| 2 | KNN | [0.64, 0.71, 0.68, 0.75, 0.66] | 69 | 0.69 | 0.68 | 0.68 |
| 3 | RF | [0.57, 0.53, 0.78, 0.64,0.63] | 63 | 0.65 | 0.59 | 0.62 |
| 4 | DECISION TREE | [0.57, 0.53,0.86, 0.60,.63] | 64 | 0.64 | 0.62 | 0.63 |
Table 2.
Performance evaluation of ECG Arousal classification.
| Sr. No. | ECG Arousal Classifier | 5-Fold Accuracy | ECG Arousal Accuracy (%) | Precision | Recall | F1 Score |
|---|---|---|---|---|---|---|
| 1 | SVM | [0.78, 0.53, 0.46, 0.64, 0.66] | 62 | 0.66 | 0.54 | 0.59 |
| 2 | KNN | [0.78, 0.64, 0.71, 0.71, 0.63] | 70 | 0.70 | 0.74 | 0.72 |
| 3 | RF | [0.78, 0.71, 0.68, 0.68, 0.74] | 72 | 0.71 | 0.77 | 0.74 |
| 4 | DECISION TREE | [0.71, 0.75, 0.71, 0.68, 0.70] | 71 | 0.68 | 0.80 | 0.73 |
Table 3.
Performance evaluation of GSR Valence classification.
| Sr. No. | GSR Valence Classifier | 5-Fold Accuracy | GSR Valence Accuracy (%) | Precision | Recall | F1 Score |
|---|---|---|---|---|---|---|
| 1 | SVM | [1.0, 0.96, 0.96, 0.89, 1.0] | 96 | 0.94 | 0.99 | 0.96 |
| 2 | KNN | [1.0, 0.96, 0.96, 0.89, 1.0] | 96 | 0.94 | 0.99 | 0.96 |
| 3 | RF | [0.98, 0.96, 0.96, 0.89, 0.98] | 95 | 0.93 | 0.98 | 0.95 |
| 4 | DECISION TREE | [0.98, 0.96, 0.96, 0.89, 0.98] | 95 | 0.93 | 0.98 | 0.95 |
Table 4.
Performance evaluation of GSR Arousal classification.
| Sr. No. | GSR Arousal Classifier | 5-Fold Accuracy | GSR Arousal Accuracy (%) | Precision | Recall | F1 Score |
|---|---|---|---|---|---|---|
| 1 | SVM | [0.89, 0.93, 0.96, 0.928, 1.0] | 94 | 0.92 | 0.97 | 0.94 |
| 2 | KNN | [0.92, 0.93, 0.94, 0.96, 0.96] | 94 | 0.92 | 0.96 | 0.94 |
| 3 | RF | [0.89, 0.85, 0.96, 0.93, 0.96] | 92 | 0.92 | 0.93 | 0.92 |
| 4 | DECISION TREE | [0.89, 0.85, 0.96, 0.93, 0.96] | 92 | 0.92 | 0.93 | 0.92 |
Table 5.
Performance evaluation of fusion Valence classification.
| Sr. No. | Classifier | 5-Fold Accuracy | GSR Valence Accuracy (%) | Precision | Recall | F1 Score |
|---|---|---|---|---|---|---|
| 1 | SVM | [1.0, 0.96, 0.96, 0.89, 1.0] | 96 | 0.94 | 0.99 | 0.96 |
| 2 | KNN | [1.0, 0.96, 0.96, 0.89, 1.0] | 96 | 0.94 | 0.99 | 0.96 |
| 3 | RF | [0.98, 0.96, 0.96, 0.89, 0.98] | 95 | 0.93 | 0.98 | 0.95 |
| 4 | DECISION TREE | [0.98, 0.96, 0.96, 0.89, 0.98] | 95 | 0.93 | 0.98 | 0.95 |
Table 6.
Performance evaluation for fusion Arousal classification.
| Sr. No. | Classifier | 5-Fold Accuracy | Fusion Arousal Accuracy (%) | Precision | Recall | F1 Score |
|---|---|---|---|---|---|---|
| 1 | SVM | [0.89, 0.93, 0.96, 0.93, 1.0] | 94 | 0.93 | 0.96 | 0.94 |
| 2 | KNN | [0.93, 0.93, 0.93, 0.93, 0.96] | 94 | 0.92 | 0.96 | 0.94 |
| 3 | RF | [0.88, 0.88, 0.96, 0.93, 1.0] | 94 | 0.94 | 0.93 | 0.93 |
| 4 | DECISION TREE | [0.89, 0.93, 1.0, 0.93, 1.0] | 95 | 0.96 | 0.93 | 0.94 |
Table 7.
Classification accuracies.
| Sr. No. | Classifier | ECG Valence (%) | ECG Arousal (%) | GSR Valence (%) | GSR Arousal (%) | Fusion Valence (%) | Fusion Arousal (%) |
|---|---|---|---|---|---|---|---|
| 1 | SVM | 60 | 62 | 96 | 94 | 96 | 94 |
| 2 | KNN | 69 | 70 | 96 | 94 | 96 | 94 |
| 3 | RF | 63 | 72 | 95 | 92 | 95 | 94 |
| 4 | DECISION TREE | 64 | 71 | 95 | 92 | 95 | 95 |
Table 8.
Classification accuracies for ECG signals.
| Sr. No. | Reference No. | Database | Feature Selection | Cross Validation Technique | Classifier | Accuracy |
|---|---|---|---|---|---|---|
| 1 | Present work | AMIGOS | Mutual information | K-fold | KNN | Valence: 69% |
| Arousal: 70% | ||||||
| 2 | [3] | AMIGOS | _ | K-fold | Decision Tree | Valence: 59.2% |
| Arousal: 60.6% | ||||||
| 3 | [18] | AMIGOS | Fisher’s linear discrimination | Leave one participant out | Linear SVM | Valence: 57.6% |
| Arousal: 59.2% |
Table 9.
Classification accuracies for GSR signals.
| Sr. No. | Reference | Database | Feature Selection | Classifier | Accuracy |
|---|---|---|---|---|---|
| 1 | Present work | AMIGOS | Mutual information | KNN | Valence: 96% Arousal: 94% |
| 2 | [18] | AMIGOS | Fisher’s linear discriminant | Linear SVM | Valence: 53.1% Arousal: 54.8% |
| 3 | [25] | AMIGOS | Mutual information | Non-linear SVM | Valence: 83.9% Arousal: 85.71% |
Table 10.
Fusion of ECG and GSR signals.
| Sr. No. | Reference | Database | Feature Fusion Technique | Feature Selection | Classifier | Accuracy |
|---|---|---|---|---|---|---|
| 1 | Present work | AMIGOS | Early fusion | Mutual information | KNN | Valence: 96% Arousal: 94% |
| 2 | [18] | AMIGOS | Decision-level fusion | Fisher’s linear discriminant | Linear SVM | Valence: 57% Arousal: 58.5% |
Disclaimer/Publisher’s Note: The statements, opinions and data contained in all publications are solely those of the individual author(s) and contributor(s) and not of MDPI and/or the editor(s). MDPI and/or the editor(s) disclaim responsibility for any injury to people or property resulting from any ideas, methods, instructions or products referred to in the content. |
© 2024 by the authors. Licensee MDPI, Basel, Switzerland. This article is an open access article distributed under the terms and conditions of the Creative Commons Attribution (CC BY) license (https://creativecommons.org/licenses/by/4.0/).
Share and Cite
MDPI and ACS Style
Dessai, A.; Virani, H. Multimodal and Multidomain Feature Fusion for Emotion Classification Based on Electrocardiogram and Galvanic Skin Response Signals. Sci 2024, 6, 10. https://0-doi-org.brum.beds.ac.uk/10.3390/sci6010010
AMA Style
Dessai A, Virani H. Multimodal and Multidomain Feature Fusion for Emotion Classification Based on Electrocardiogram and Galvanic Skin Response Signals. Sci. 2024; 6(1):10. https://0-doi-org.brum.beds.ac.uk/10.3390/sci6010010
Chicago/Turabian StyleDessai, Amita, and Hassanali Virani. 2024. "Multimodal and Multidomain Feature Fusion for Emotion Classification Based on Electrocardiogram and Galvanic Skin Response Signals" Sci 6, no. 1: 10. https://0-doi-org.brum.beds.ac.uk/10.3390/sci6010010