
Mood Profile Clusters among Greek Exercise Participants and Inactive Adults


1
School of Psychology & Wellbeing, Centre for Health Research, University of Southern Queensland, Toowoomba 4350, Australia
2
Laboratory of Social Research on Physical Activity, Department of Physical Education and Sport Science at Serres, Aristotle University of Thessaloniki, 62122 Serres, Greece
3
Psychological Research Centre, School of Psychology, University of Wolverhampton, Wolverhampton WV1 1LY, UK
*
Author to whom correspondence should be addressed.
Sci 2024, 6(2), 18; https://0-doi-org.brum.beds.ac.uk/10.3390/sci6020018
Submission received: 12 January 2024
/
Revised: 15 February 2024
/
Accepted: 21 March 2024
/
Published: 26 March 2024
(This article belongs to the Special Issue Feature Papers—Multidisciplinary Sciences 2023)
Abstract
:Mood profile clusters have previously been identified in several cultural contexts. In the present study, six mood profile clusters referred to as the iceberg, inverse Everest, inverse iceberg, shark fin, submerged, and surface profiles, were investigated in a Greek population. The names of the mood profiles reflect how they appear after raw scores for Tension, Depression, Anger, Vigor, Fatigue, and Confusion (in that order), are converted to T-scores and depicted graphically. A Greek translation of the Brunel Mood Scale (BRUMS-Greek) was completed by 1786 adults, comprising 1417 exercise participants and 369 physically inactive adults (male = 578, female = 1208) aged 18–64 years (M = 34.73 ± 11.81 years). Although the male–female ratio emphasized females, sample sizes of over 500 suggest some degree of representativeness. Seeded k-means cluster analysis clearly identified the six hypothesized mood profiles. Men were over-represented for the iceberg profile. For age, the 18–25 years group were under-represented for the iceberg profile, whereas the 46–55 and 56+ years groups were over-represented. The 56+ years group were under-represented for the inverse Everest, and the 18–25 years group were over-represented for the shark fin profile. For body mass index (BMI), participants in the obese weight category were over-represented for the inverse iceberg and shark fin profiles and under-represented for the submerged profile. Active participants were over-represented for the iceberg and submerged profiles, and under-represented for the inverse Everest, inverse iceberg, and surface profiles. Findings supported the cross-cultural equivalence of the mood profile clusters and confirmed the link between physical inactivity, obesity, and negative mood profiles.
1. Introduction
Affective states, including moods and emotions, provide a valuable barometer of mental health status and psychological well-being [1]. It is estimated that about 12.5% of people across the globe live with some form of mental health disorder, most commonly depression and anxiety [2], and therefore sustaining mental health represents a significant societal challenge. Mental wellbeing is a particular challenge in Greece, which currently sits in the top six countries globally for depression rate [3] with an ingrained, albeit declining, prevalence of mental health stigma within Greek culture that discourages seeking professional help [4]. The development of simple methods of monitoring mental health status, including the recently translated version of the Brunel Mood Scale (BRUMS) [5,6] into Greek [7], increases the options available for screening individuals and groups for mental health risk.
For the purposes of our study, we defined mood as “a set of feelings, ephemeral in nature, varying in intensity and duration, and usually involving more than one emotion” [8]. Moods are seen to be of lesser intensity and longer duration than emotions, and emotions have an identifiable cause, whereas moods often do not [9,10]. Mood profiling is a technique pioneered by Morgan and colleagues [11,12] that involves converting raw scores into standard T-scores with reference to appropriate normative data [13,14,15] and then plotting the scores graphically. This technique has been used widely in mental health contexts, including monitoring cardiac rehabilitation patients in Brazil [16] and ballet dancers in Japan [17], evaluating suicide risk among American adolescents [18], and screening South African military personnel for post-traumatic stress disorder [19].
Several distinct mood profiles have been described in the literature. The most well-established profile, referred to as the iceberg profile, has been associated with positive mental health for several decades [11]. The iceberg profile reflects an above average Vigor score, and below average scores for Anger, Confusion, Depression, Fatigue, and Tension. The profile derives its name from the fact that most of a real iceberg sits below the waterline, represented metaphorically by the normative mean score. Additional profiles have been described, mostly continuing with a nautical theme. The surface profile [20] reflects mood scores at, or close to, the normative mean, and the submerged profile [20] reflects below average scores on all six mood dimensions. A profile characterized by a very high Fatigue score combined with below average scores on the other mood dimensions has been termed the shark fin profile [20]. Two other profiles, both of which indicate heightened risk of mental health issues, are referred to as the inverse iceberg [21,22] and inverse Everest profile [20]. The former profile reflects a below average score for Vigor combined with above average scores for other mood dimensions, whereas the latter profile is characterized by very high Depression, Anger, and Confusion scores, above average Tension and Fatigue scores, and a below average Vigor score [20]. The six profiles described above have been identified in a range of language and cultural contexts, including Brazilian [23], Chinese [24], English [20,25], Italian [26], Lithuanian [27], and Singaporean [28], but have yet to be investigated in a Greek context.
The prevalence of mood profiles has been shown to vary according to demographic characteristics. For example, a study of nearly 16,000 participants [15] showed men to be over-represented for the iceberg and surface profiles, and women to be over-represented for the inverse Everest, inverse iceberg, shark fin, and submerged profiles. These differences are consistent with the tendency for women to be diagnosed with mood disorders and other mental health disorders at almost twice the rate of men [29,30]. Based on this prior evidence, differences in the prevalence of mood profiles by biological sex were explored among a Greek sample.
Further, several age-related differences were reported by Terry et al. [15], the most prominent of which are that (a) older participants (46–56+ years) were over-represented for the iceberg profile, and younger participants (18–35 years) were under-represented, (b) the 25–45 years groups were over-represented for the inverse Everest profile, and the 18–24 years group was under-represented, (c) the 25–35 years group was over-represented for the inverse iceberg profile, and the 46–55 years group was under-represented, and (d) the 18–24 years group was over-represented for the shark fin profile, and the 25–35 years, 46–55 years, and 56+ years groups were under-represented. Explanations for age-related differences in moods typically focus on use of more effective emotion- and mood-regulation strategies among older adults [31,32,33]. Given this evidence, the effects of age on mood profile prevalence were also explored.
Other potential influences on mood profile prevalence examined in the present study related to BMI and exercise participation. There is evidence of a link between being overweight or obese and experiencing mood disorders and other types of mental ill-health [34,35]. Similarly, mental health status has been shown to be linked to levels of physical activity and sedentary behavior [36,37]. For example, data derived from more than 1.2 million American adults showed that those people who exercised experienced more than 40% fewer days of poor mental health than their non-exercising counterparts [36]. Moreover, sedentary behavior has been shown to affect mental health negatively, independent of physical activity levels [37].
The first aim of the present study was to assess whether six mood profile clusters reported previously, namely, the iceberg, inverse Everest, inverse iceberg, shark fin, submerged, and surface profiles, would also be identified in Greek-speaking participants. Given the robustness of these profiles in previous samples [20,23,24,25,26,27,28], it was hypothesized that all six clusters would be evident among a sample of the Greek population (H1). The second aim of the study was to quantify the relative prevalence of the six mood profiles, and examine whether their prevalence varied by a range of demographic and lifestyle variables. Based on previously accrued evidence [15,31,32,33,34,35,36,37], it was hypothesized that significant between-group differences in the prevalence of mood profile clusters would be identified according to sex (H2), age (H3), BMI (H4), and physical activity status (H5).
2. Materials and Methods
2.1. Participants
A total of 1786 Greek adults participated, comprising 1417 who identified as exercise participants and 369 who identified as physically inactive. Exercise participants were those who took part in group-based indoor exercise programs or individual athletic activities. There were 1133 participants (80%) who attended private fitness centers and 284 who attended community fitness centers (20%). Participants reported that they exercised an average of 3.41 times per week (M = 3.41, SD = 1.42). Daily average exercise duration was 64 min, 57 s (SD = 24 min, 10 s) (M = 64.95, SD = 24.17), with nearly all participants reporting a duration between 20 and 120 min. All exercise activities were performed in the context of fitness centers where participants were contacted. No sports participation was involved. Data were collected across the whole year, excluding the December and January period and excluding the July to September period due to reduced numbers of participants because of holiday and vacation periods, respectively. Data were collected both during morning and evening times, all days of the week. Inactive participants were those who had not exercised for a period of 12 consecutive months or longer. Table 1 shows a summary of the sex, age, BMI, and exercise status of the participants. The exercise group should be viewed as heterogeneous in terms of physical activity levels, given the difficulty of verifying the intensity and duration of self-reported exercise. There is less contention in terms of the range of exercise in the non-exercise group.
2.2. Measurement of Mood
Mood was assessed using the BRUMS-Greek [7], a 24-item scale comprising six subscales of four items each, measuring Anger, Confusion, Depression, Fatigue, Tension, and Vigor. Respondents indicated “How do you feel right now?” on a 5-point Likert-type scale (0 = not at all, 1 = a little, 2 = moderately, 3 = quite a bit, 4 = extremely). The four item scores were summed to generate six subscale scores, with a possible range from 0 to 16. The BRUMS-Greek has demonstrated adequate factorial validity, concurrent validity, known-groups validity and internal consistency [7]. In the present study, all Cronbach alpha coefficients exceeded the traditional benchmark of 0.70 [38], ranging from 0.77 to 0.85 (Table 2).
2.3. Procedure
Recruitment of exercise participants occurred at fitness centers in northern Greece. Following permission from fitness center directors to collect data, initial contact with participants occurred in the reception area. The purpose of the study was explained, and their right to discontinue participation at any time emphasized. Data were collected prior to participation in an exercise class, overseen by a research assistant. All participants gave written informed consent and completed the questionnaire in a quiet area. Data collection took approximately 10 min, and no incentives for participation were offered.
Physically inactive participants were recruited using snowball sampling [39]. Both samples were non-probability samples. Participants were treated in accordance with the ethical guidelines of the American Psychological Association, and were given assurances of confidentiality and anonymity. The research ethics committee of the Department of Physical Education and Sport Science at Serres, Aristotle University of Thessaloniki in Greece, provided approval of the research protocol (Approval #ERC-018/2020).
2.4. Data Analysis
SPSS for Windows, Version 29, IBM Corporation, Armonk, NY, USA [40], was used for all analyses. Cluster analysis techniques were applied to the data to examine if the six mood profile clusters identified in the literature, referred to as the iceberg, inverse Everest, inverse iceberg, shark fin, submerged, and surface profiles [20] were evident among a Greek sample. Given the aim of confirming known clusters, seeded k-means clustering was used in preference to hierarchical clustering, as recommended by Wagstaff et al. [41], and the resultant clusters were compared to those previously described [23,24,25,26,27,28] to assess external validity [42,43]. A discriminant function analysis was then conducted to assess the strength of the cluster structures and classification accuracy. Finally, chi-squared analyses were used to test if the prevalence of clusters varied significantly by sex (male/female), age (18–25 years/26–35 years/36–45 years/46–55 years/56+ years), BMI (normal weight/obese), and exercise participation (active/inactive).
3. Results
3.1. Data Screening and Descriptive Statistics
Data screening for non-normal distributions was conducted. The distribution of scores for negative mood dimensions, especially for Anger, Confusion, and Depression, showed positive skewness and kurtosis (Table 2). This deviation from normal distribution was explained by the large number of very low scores with fewer scores at the upper end, which is the typical distribution for negative mood dimensions [5,6]. A total of 13 multivariate outliers were identified using the Mahalanobis statistic (p < 0.001). Further scrutiny of individual cases showed response patterns to be plausible and free of response bias [44,45], and hence they were retained in the dataset. Given the recommendation of Nevill and Lane [46] that self-report measures should not be transformed because scales operate at an interval rather than a ratio level, no data transformations occurred. Participants who score highly on negative mood dimensions are of particular interest in studies related to mental health, and therefore all outliers were retained and a sample of 1786 cases was analyzed. The full range of scores (0–16) was recorded for all subscales, and descriptive statistics are shown in Table 2.
3.2. Cluster Analysis
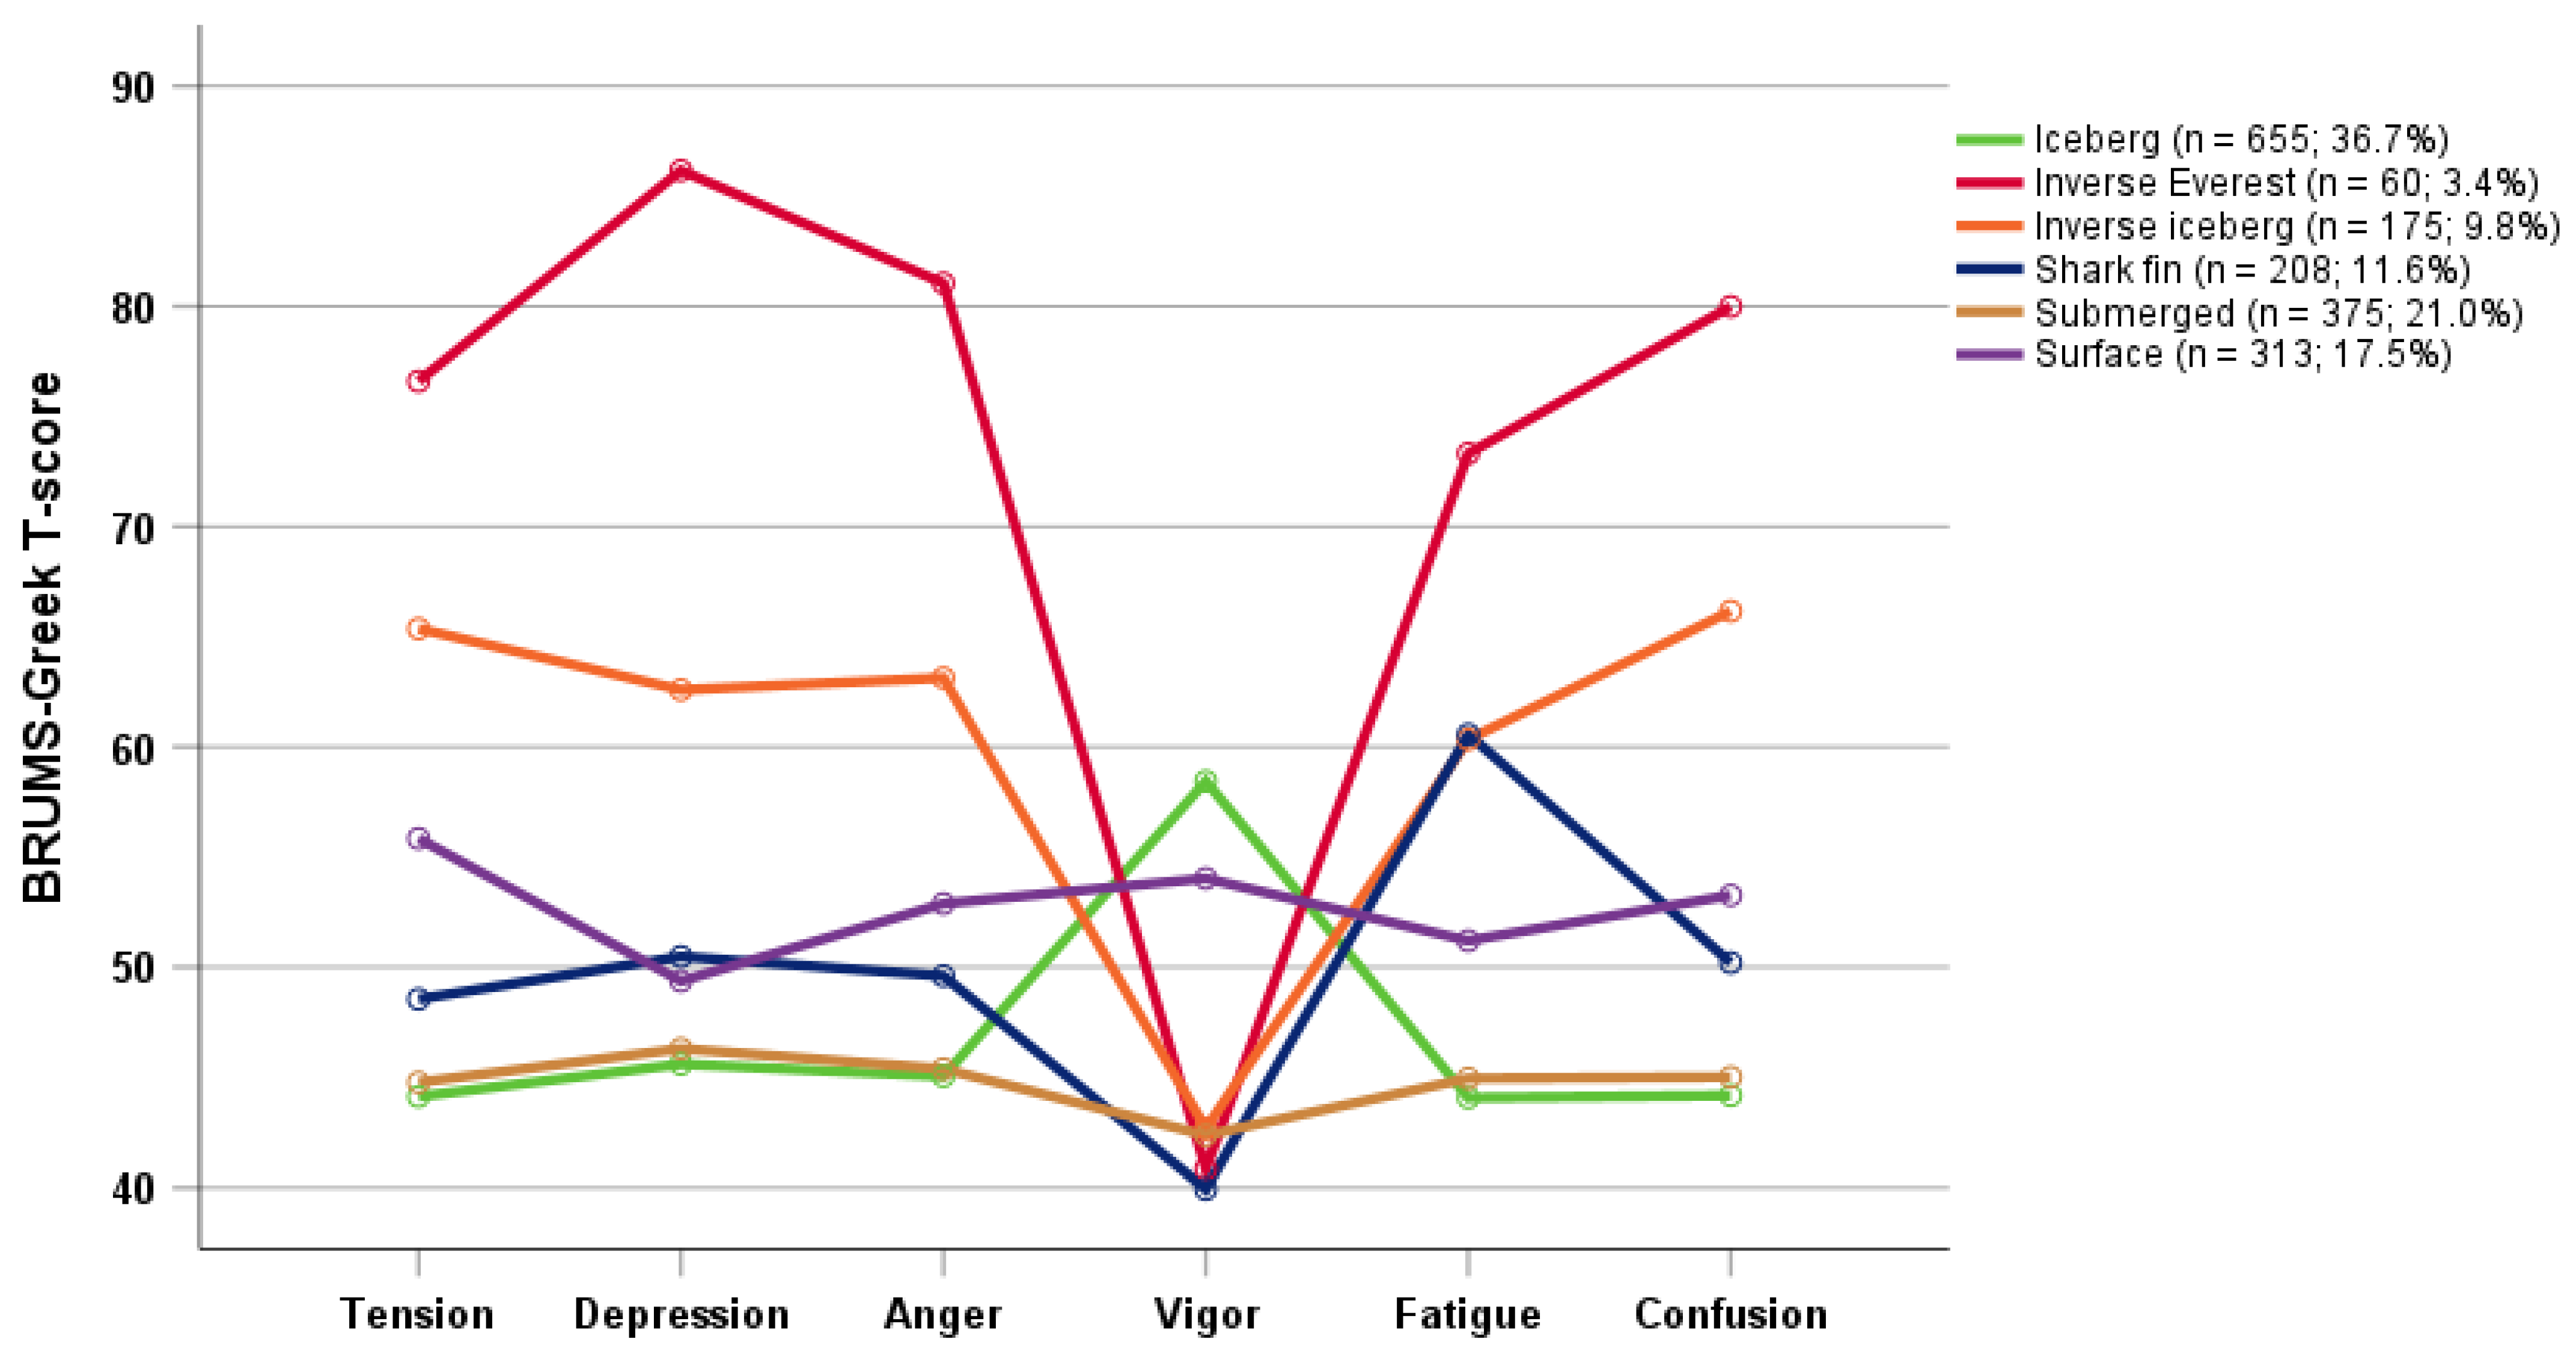
To explore how mood responses grouped together, we utilized a seeded k-means cluster analysis to form six distinct clusters. Our results align closely with previous findings [20,23,24,25,26,27,28], with all six hypothesized profiles (i.e., iceberg, inverse Everest, inverse iceberg, shark fin, submerged, and surface) identified clearly. Descriptive statistics for these clusters in the form of T-scores are provided in Table 3, while Figure 1 provides a visual representation of the final cluster solution and the prevalence of each cluster.
3.3. Cluster Strength
A discriminant function analysis was used to verify the strength of the cluster structures. Results showed that cluster membership overall was predicted with 92.9% accuracy (Table 4). The iceberg profile was the most accurately identified, with 100% of participants being correctly classified, whereas participants in the shark fin cluster (84.1% accuracy) were sometimes predicted to be in the submerged cluster or, to a lesser extent, in the surface cluster. Notably, those in the inverse Everest cluster were correctly classified with 93.3% accuracy (56/60), with the remaining four participants predicted to be in the inverse iceberg cluster, which similarly reflects elevated risk of mental health issues.
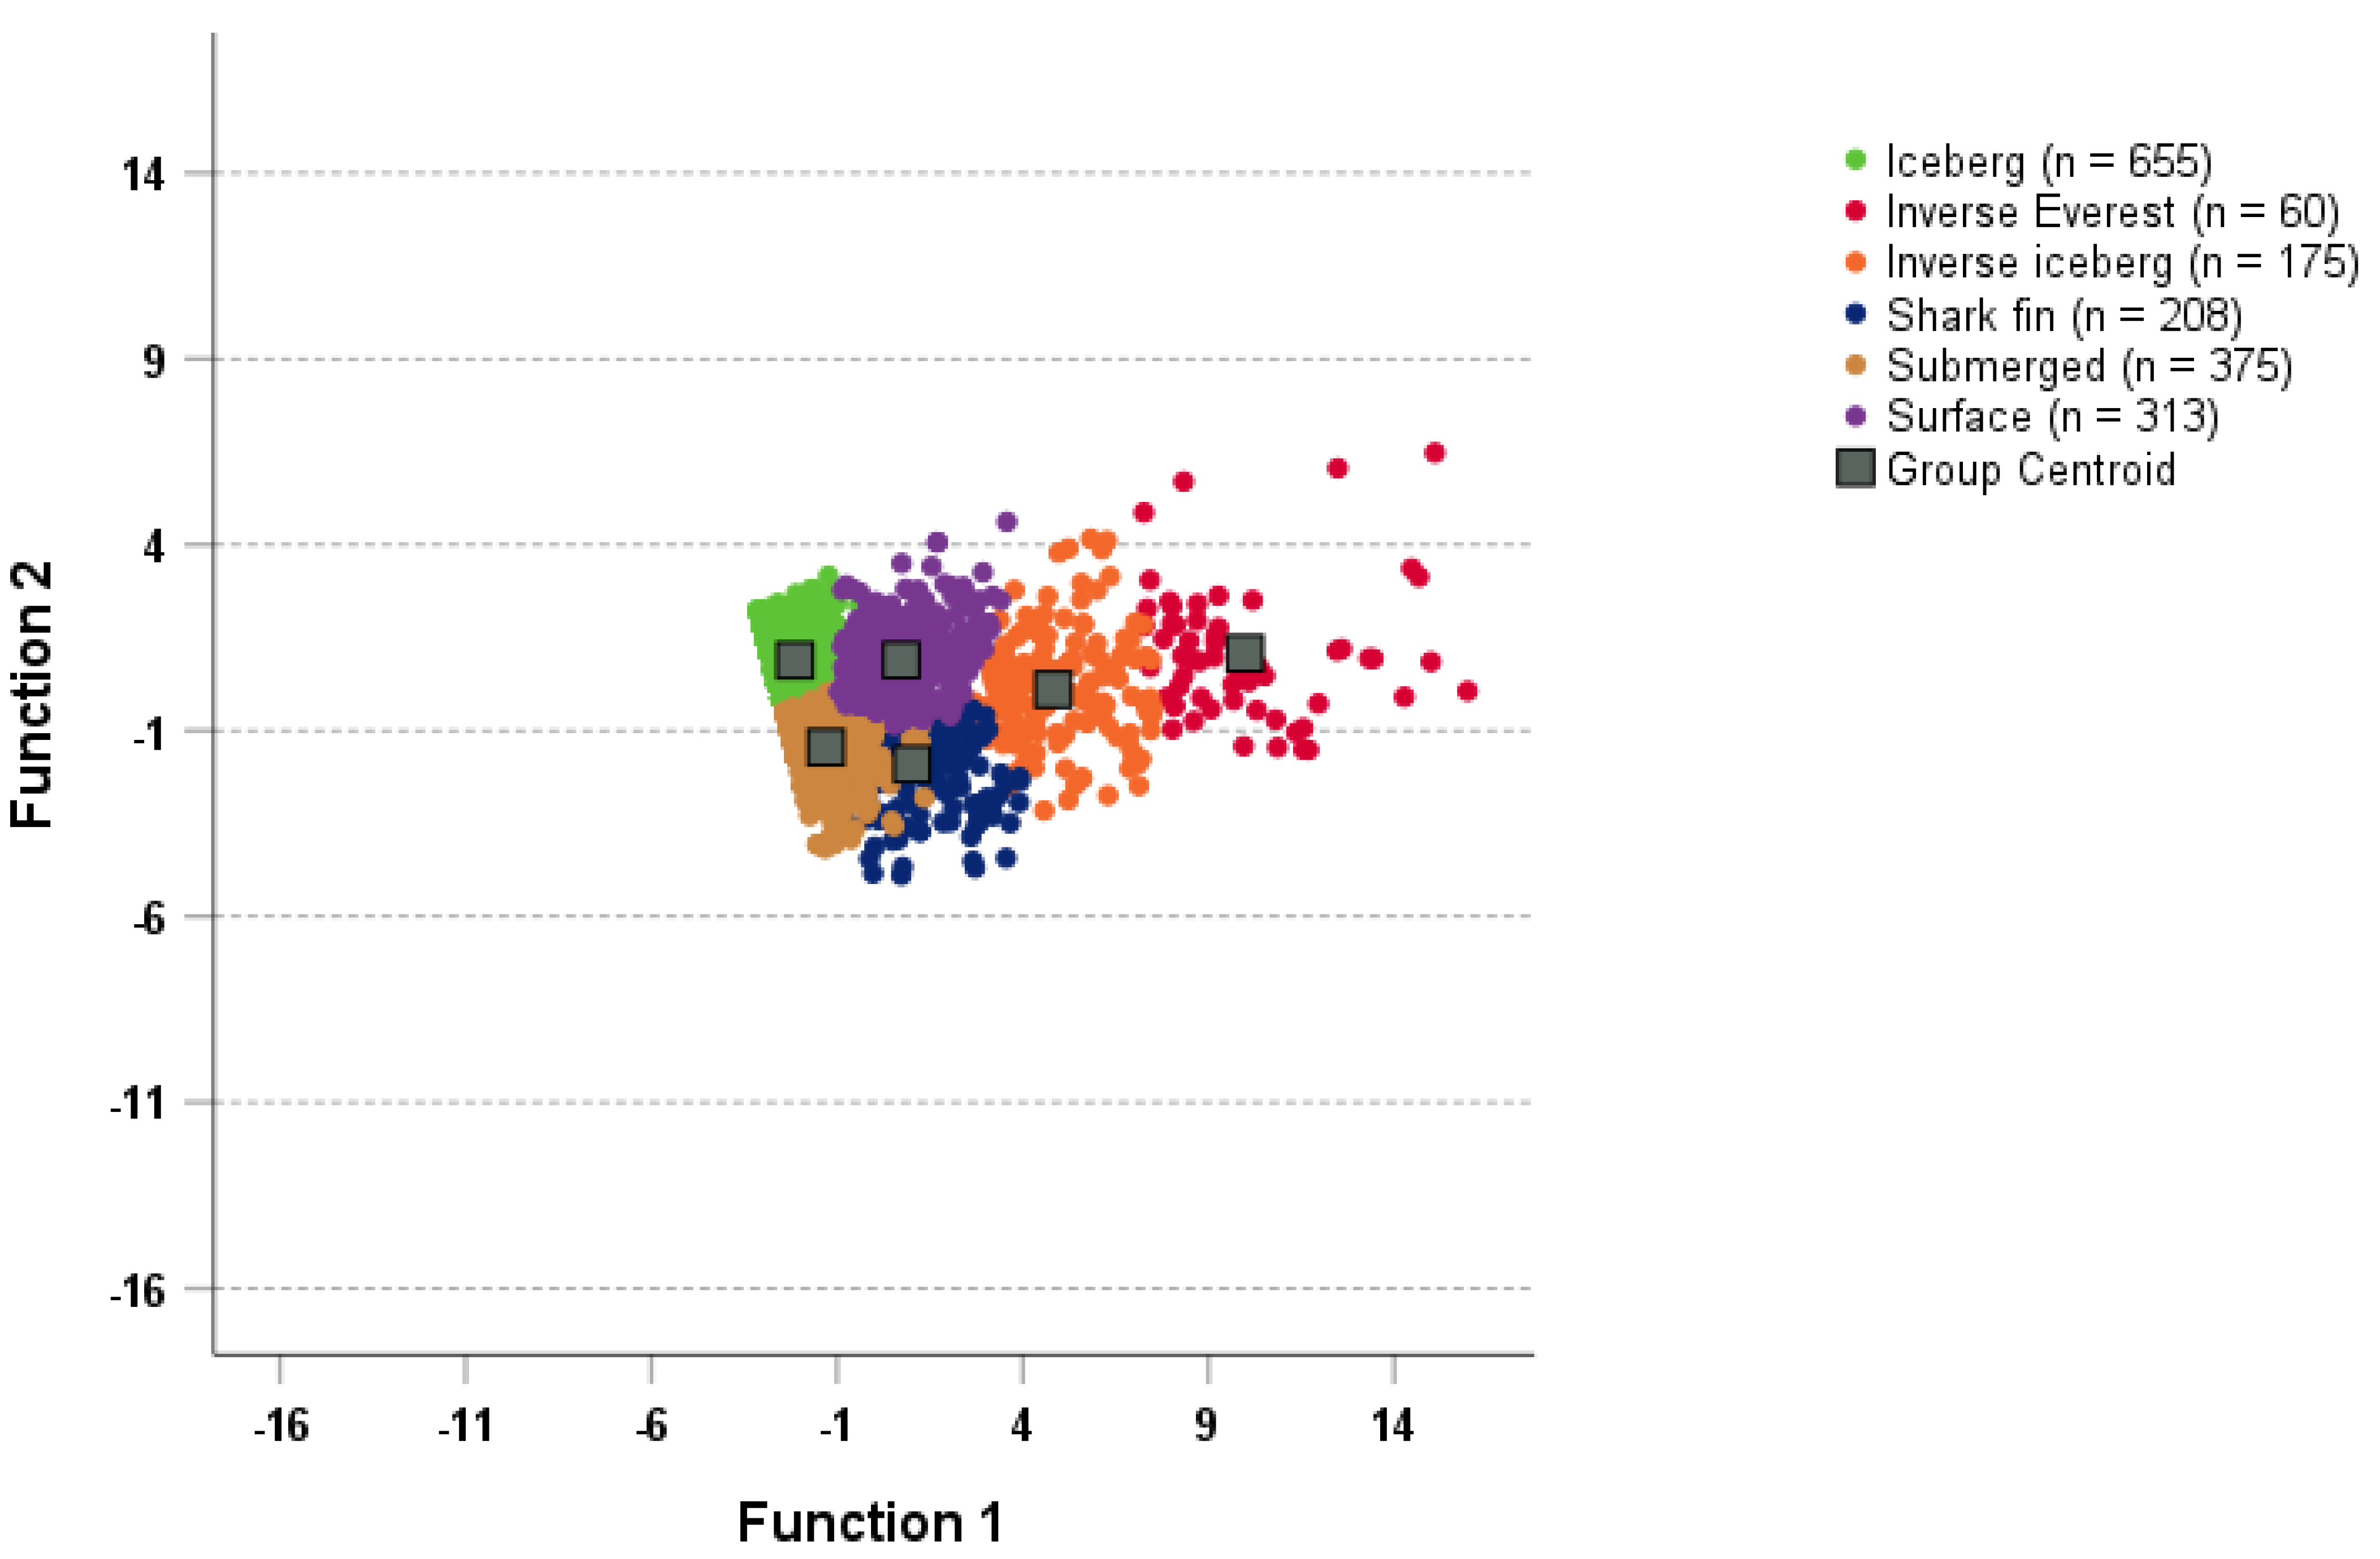
Figure 2 is a graphical representation of how the first two discriminant functions, which accounted for 95.3% of the total variance, discriminated between the mood profile clusters. The scatterplot shows the iceberg and submerged profiles being tightly clustered around the group centroids, indicating that these two profiles were the most clearly delineated. By comparison, the remaining profiles, especially the inverse Everest and inverse iceberg profiles, were relatively dispersed from the cluster centroid, indicating they were less well delineated.
3.4. Cluster Prevalence
Chi-squared analyses were used to compare observed vs. expected frequencies within each cluster according to demographic variables (Table 5). Statistically significant associations were identified using critical values of ±1.96, ±2.58, and ±3.29, corresponding to p-values of 0.05, 0.01, 0.001, respectively [47]. The overall distribution of clusters did not vary significantly by sex, although, at an individual cluster level, the prevalence of the iceberg profile was significantly higher among men (40.0%) than women (35.1%). For age, the prevalence of the iceberg profile increased steadily from the younger to older age groups, with the 18–25 years group (31.1%) under-represented and the 46–55 years (42.3%) and 56+ years (46.2%) groups over-represented. The 56+ years group (0%) were under-represented in the inverse Everest cluster, the 18–25 years group (14.1%) were over-represented in the shark fin cluster, and the 26–35 years group (20.3%) were over-represented in the surface cluster, whereas the 46–55 years group (11.6%) were under-represented. For BMI, significantly different prevalence rates were identified for three of the six clusters. Participants in the obese weight category were over-represented in the inverse iceberg (18.2%) and shark fin mood profiles (16.7%) and under-represented in the submerged mood profile (13.6%). For exercise participation, significant differences were identified for five of the six clusters. Active participants were over-represented in the iceberg (39.5%) and submerged mood profiles (23.1%), and under-represented in the inverse Everest (2.3%), inverse iceberg (7.2%), and surface mood profiles (16.4%).
4. Discussion
The aims of the present study were twofold. The first aim was to investigate whether the six mood profile clusters described in the literature, referred to as the iceberg, inverse Everest, inverse iceberg, shark fin, submerged, and surface profiles [20,23,24,25,26,27,28], would be identified among a sample of 1786 Greek adults using the recently validated BRUMS-Greek measure [7]. The second aim was to investigate the extent of differences between groups related to the sex, age, BMI, and exercise status of the participants in terms of the prevalence of specific mood profile clusters.
As hypothesized (H1), results of a seeded k-means cluster analysis clearly identified the six mood profile clusters found previously in English-speaking samples [20,25,28], and among speakers of Brazilian Portuguese [23], Chinese [24], Italian [26], and Lithuanian [27]. The clusters were robust, with 92.9% of participants correctly classified into their predicted cluster. Notably, 100% of participants reporting the iceberg profile, which is indicative of positive mental health [11,22], were correctly classified. Participants reporting mood profiles associated with elevated risk of mental health issues [15,19,21], namely the inverse Everest and inverse iceberg profiles, were identified with 93.3% and 95.4% accuracy, respectively. These findings suggest that, as a screening tool with potential use among large swathes of the Greek population, the BRUMS-Greek provides a rapid yet sensitive tool for screening mental ill-health risk. Vlachopoulos and colleagues provided a preliminary table of normative data for the BRUMS-Greek and a profile sheet for plotting the mood profile for individuals or groups [7]. However, to maximize the effectiveness of the measure, future research should seek to develop specific tables of normative data and associated profile sheets derived from various populations of interest.
The prevalence of the six mood profile clusters in the present study varied from test norms, with a lower prevalence of profiles that associate with mental health issues found among Greek participants than English-speaking populations. For example, the inverse Everest profile was reported by only 3.4% of the sample, compared to the normative rate of 4.6%, the inverse iceberg profile was reported by 9.8% of participants, compared to the normative rate of 11.8%, and the shark fin profile was reported by 11.6% compared to the normative rate of 15.5% [15]. Conversely, the prevalence of the iceberg profile, which is associated with positive mental health [11,22], was 36.7% among the Greek participants compared to a prevalence rate of 28.5% found in the normative sample [15]. Overall, these prevalence rates point to a relatively low risk of mental health problems among the Greek sample, although it should be noted that the sample included a high proportion of participants who were physically active (79.3%), who typically report more positive mood profiles than population norms [14,48].
Regarding between-group differences in cluster prevalence, as hypothesized (H2), the sex of participants influenced mood profiles, with a higher prevalence of the iceberg profile reported for men than women. Women typically report more negative moods than men [25,27] and are more commonly diagnosed with mood disorders [49]. Such differences have been explained by a combination of biological factors, such as immune system differences [49] and hormonal fluctuations [50]; sociological factors, including systemic disadvantage in the areas of family, education, and careers [51]; and psychological factors, such as lower self-esteem and greater interpersonal stress [52]. Age similarly affected the prevalence of specific mood profiles. The most prominent findings were that, as hypothesized (H3), the prevalence of the iceberg profile increased with participant age, which mirrors findings from a Lithuanian population [27]. Also, prevalence of the two most negative profiles (inverse Everest and inverse iceberg) was lowest among the oldest group (56+ years) of participants, which is also consistent with previous findings [20]. Although not all the age-group differences in mood cluster prevalence previously reported in the literature [25] were found in the present study, those differences that did emerge are consistent with the extant literature. Age-related mood differences are usually explained by older people having better developed and more effective mood-regulation strategies [31,32,33]. Given that the present sample was comprised exclusively of adults, and cognizant of the recent thrust to improve young people’s access to mental health services in Greece [53,54], use of the BRUMS-Greek to investigate the prevalence of mood profile clusters within youth populations would be a promising avenue for future research.
Results pertaining to BMI showed that, as hypothesized (H4), significant between-group differences were found. Compared to participants of normal weight, those individuals with obesity were more likely to report an inverse iceberg or shark fin mood profile and less likely to report a submerged mood profile. Large scale population studies [55,56] have provided compelling evidence that obesity is linked to a range of mental health conditions, notably depression and anxiety. Our participant sample included 35.3% who were overweight or obese, which is close to the global prevalence for adults of 39% [57], although somewhat lower than for the population of Greece overall [58]. We focused our analyses on a comparison of mood profile clusters between individuals of normal weight and those with obesity, given that those categories of participants have yielded the largest between-group differences in previous research [55,56]. Obesity rates in Greece sit at about the European Union average, although the prevalence of childhood obesity has grown steadily in recent years [58], pointing to the potential benefit of future research into mood profiles as a screening mechanism for youth mental health.
Significant differences between groups also emerged for exercise participation. Those participants who engaged in exercise were more likely to report an iceberg or submerged profile than those who were inactive, and less likely to report an inverse Everest, inverse iceberg, or surface profile. In short, exercise participation was associated with reduced risk of mental health issues in our sample of Greek adults. Evidence related to the prophylactic and curative benefits of physical activity, even light exercise, on mental health has grown considerably [59,60,61], and our results add to that body of evidence. Levels of physical activity in Greece have been low for several decades [62], and in 2022 the country recorded the second lowest rate of exercise participation in Europe (behind only Portugal), with 68% of the population indicating they never exercised or played sport [63]. The COVID-19 pandemic, which had a widespread negative impact on mood [64,65,66] also reduced physical activity levels, with 35% of Greeks cutting back on exercise and 14% discontinuing exercise completely [63], a trend replicated internationally [67]. To date, exercise and mood research among Greek participants is very limited, with just a few investigations having been conducted into, for example, the impact of physical activity on mood among cancer patients [68], yoga participants [69], and prison inmates [70]. Hence, it appears that future research to monitor the mood benefits and reduced risk of mental ill-health resulting from physical activity is particularly germane. We acknowledge that the exercise group in the present study was heterogeneous in terms of the intensity and duration of exercise participants completed. We argue that further research is needed to explore the dose response to doing exercise in order to experience positive mood states among Greek samples.
In terms of applying the present findings, an obvious corollary to identifying negative mood profiles is finding effective strategies to enhance moods. The regulation of moods and emotions, defined in general terms as the processes people use to manage and respond to their emotional experiences in appropriate and adaptive ways [71], is a much-researched area of psychology [71,72], and different process models are available to assist individuals to identify effective regulation strategies [73,74]. There is much scope for further research in a Greek context to evaluate the efficacy of emotion regulation strategies in transforming mood profiles associated with mental health deficits, notably the inverse Everest and inverse iceberg profiles, into an iceberg profile associated with positive mental health.
One line of enquiry that would appear to be particularly fruitful is examination of the role of physical activity as a strategy to regulate moods and emotions. Physical activity has not only a direct effect on moods and emotions, but also an indirect one via effects on physical health and management of bodyweight [75,76]. Physical activity is defined by the World Health Organization as “any bodily movement produced by skeletal muscles that requires energy expenditure” [75] (p. 14), and therefore is not limited to organized exercise sessions or sports, but also includes everyday activities such as walking, gardening, and housework. Research has begun to develop and evaluate robust interventions to assess, for example, the dose response to physical activity intensity and the concomitant effects on moods and emotions [77], giving due consideration to individual differences such as previous exercise experience and enjoyment of physical activity.
There has been a recent move away from traditional diagnostic systems that focus on identifying specific psychopathologies [78] towards transdiagnostic approaches that “better represent the clinical and scientific reality of mental health problems” [79] (p. 1). The identification of mood profile clusters in the present study should be viewed in the context of transdiagnosis, in that mood profiles reflect one part of a constellation of psychological wellbeing indicators rather than being tied to a particular mental health diagnosis.
Some limitations of the present study related to the demographic composition of the sample are acknowledged. First, the sample was mainly female, and therefore results may generalize more to women than men. Second, most participants were aged 18–45 years, with a much smaller proportion in the 46–64 years age range. Therefore, the study findings may generalize more to younger and middle-aged people than to older middle-aged and senior individuals. Third, most participants were engaged in physical activity, with only a small minority being inactive. Hence, findings may generalize more to exercise participants than sedentary individuals.
5. Conclusions
In conclusion, the present study confirmed the presence of six mood profile clusters in a Greek population, referred to as the iceberg, inverse Everest, inverse iceberg, shark fin, submerged, and surface profiles. These mood profiles have been found in several other nationalities including Brazilian, Chinese, English, Italian, Lithuanian, and Singaporean. The absence of research that has focused on mood among Greek participants emphasizes the novelty and significance of this work, especially as mood states offer insights into mental health. The iceberg profile, which is associated with positive mental health, was more prevalent in men than women, among those who were physically active than those who were inactive, and among those aged 46 years and over than among younger groups. Profiles associated with elevated risk of mental ill-health, namely, the inverse Everest and inverse iceberg profiles, were less prevalent among people of normal weight than among individuals with obesity, and among those who were physically active than those who were inactive.
Author Contributions
All authors conceptualized and designed the study; S.P.V. performed data collection; R.L.P.-S. and P.C.T. conducted formal analysis. All authors contributed to writing, review and editing, which was led by P.C.T. All authors have read and agreed to the published version of the manuscript.
Funding
This research received no external funding.
Institutional Review Board Statement
The study was conducted in accordance with the Declaration of Helsinki and received approval from the research ethics committee of the Department of Physical Education and Sport Science at Serres, Aristotle University of Thessaloniki in Greece (Approval #ERC-018/2020).
Informed Consent Statement
Informed consent was obtained from all participants involved in the study.
Data Availability Statement
Data are available from the third author on written request.
Conflicts of Interest
The authors declare no conflicts of interest.
References
- Gross, J.J.; Uusberg, H.; Uusberg, A. Mental illness and well-being: An affect regulation perspective. World Psychiatry 2019, 18, 130–139. [Google Scholar] [CrossRef] [PubMed]
- Dattani, S.; Rodés-Guirao, L.; Ritchie, H.; Roser, M. Mental Health. Available online: https://ourworldindata.org/mental-health (accessed on 21 November 2023).
- World Population Review. Depression Rates by Country 2023. Available online: https://worldpopulationreview.com/country-rankings/depression-rates-by-country (accessed on 21 November 2023).
- Tzouvara, V.; Papadopoulos, C.; Randhawa, G. Systematic review of the prevalence of mental illness stigma within the Greek culture. Int. J. Soc. Psychiatry 2016, 62, 292–305. [Google Scholar] [CrossRef] [PubMed]
- Terry, P.C.; Lane, A.M.; Lane, H.J.; Keohane, L. Development and validation of a mood measure for adolescents. J. Sports Sci. 1999, 17, 861–872. [Google Scholar] [CrossRef] [PubMed]
- Terry, P.C.; Lane, A.M.; Fogarty, G.J. Construct validity of the Profile of Mood States–Adolescents for use with adults. Psychol. Sport Exerc. 2003, 4, 125–139. [Google Scholar] [CrossRef]
- Vlachopoulos, S.P.; Lane, A.M.; Terry, P.C. A Greek translation of the Brunel Mood Scale: Initial validation among exercise participants and inactive adults. Sports 2023, 11, 234. [Google Scholar] [CrossRef] [PubMed]
- Lane, A.M.; Terry, P.C. The nature of mood: Development of a conceptual model with a focus on depression. J. Appl. Sport Psychol. 2000, 12, 16–33. [Google Scholar] [CrossRef]
- Beedie, C.J.; Terry, P.C.; Lane, A.M. Distinctions between emotion and mood. Cogn. Emot. 2005, 19, 847–878. [Google Scholar] [CrossRef]
- Siemer, M. Mood experience: Implications of a dispositional theory of moods. Emot. Rev. 2009, 1, 256–263. [Google Scholar] [CrossRef]
- Morgan, W.P. Selected psychological factors limiting performance: A mental health model. In Limits of Human Performance; Clarke, D.H., Eckert, H.M., Eds.; Human Kinetics: Champaign, IL, USA, 1985; pp. 70–80. [Google Scholar]
- Morgan, W.P.; Brown, D.R.; Raglin, J.S.; O’Connor, P.J.; Ellickson, K.A. Psychological monitoring of overtraining and staleness. Br. J. Sports Med. 1987, 21, 107–114. [Google Scholar] [CrossRef]
- McNair, D.M.; Lorr, M.; Droppelman, L.F. Manual for the Profile of Mood States; Educational and Industrial Testing Services: San Diego, CA, USA, 1971. [Google Scholar]
- Terry, P.C.; Lane, A.M. Normative data for the Profile of Mood States for use with athletic samples. J. Appl. Sport Psychol. 2000, 12, 93–109. [Google Scholar] [CrossRef]
- Terry, P.C.; Parsons-Smith, R.L. Mood profiling for sustainable mental health among athletes. Sustainability 2021, 13, 6116. [Google Scholar] [CrossRef]
- Sties, S.W.; Gonzáles, A.I.; Netto, A.S.; Wittkopf, P.G.; Lima, D.P.; De Carvalho, T. Validation of the Brunel Mood Scale for cardiac rehabilitation program. Rev. Bras. Med. Esporte 2014, 20, 281–284. [Google Scholar] [CrossRef]
- Yatabe, K.; Yui, N.; Kasuya, S.; Fujiya, H.; Tateishi, K.; Terawaki, F.; Yoshida, A.; Yoshioka, H.; Terauchi, K.; Miyano, H.; et al. Anxiety and Mood among Ballet Dancers: A Pilot Study on Effects of a Medical Approach Involving Periodic Intervention. 2014. Available online: https://www.researchgate.net/publication/272791152 (accessed on 4 January 2024).
- Gould, M.S.; Marrocco, F.A.; Kleinman, M.; Thomas, J.G.; Mostkoff, K.; Côté, J.; Davies, M. Evaluating iatrogenic risk of youth suicide screening programs: A randomized controlled trial. J. Am. Med. Assoc. 2005, 29, 1635–1643. [Google Scholar] [CrossRef] [PubMed]
- Van Wijk, C.H.; Martin, J.H.; Hans-Arendse, C. Clinical utility of the Brunel Mood Scale in screening for post-traumatic stress risk in a military population. Mil. Med. 2013, 178, 372–376. [Google Scholar] [CrossRef] [PubMed]
- Parsons-Smith, R.L.; Terry, P.C.; Machin, M.A. Identification and description of novel mood profile clusters. Front. Psychol. 2017, 8, e1958. [Google Scholar] [CrossRef] [PubMed]
- Budgett, R. Fatigue and underperformance in athletes: The overtraining syndrome. Br. J. Sports Med. 1988, 32, 107–110. [Google Scholar] [CrossRef] [PubMed]
- Raglin, J.S. Psychological factors in sport performance: The mental health model revisited. Sports Med. 2001, 31, 875–890. [Google Scholar] [CrossRef] [PubMed]
- Brandão, R.F.; Correa, M.; Sermarine, M.; Angelo, D.L.; Parsons-Smith, R.L.; Terry, P.C. Psychometric re-evaluation of the Brazil Mood Scale and evidence of mood profile clusters among youth athletes in Brazil. Int. J. Sport Exerc. Psychol. 2021, 19, S183–S184. [Google Scholar]
- Terry, P.C.; Parsons-Smith, R.L.; Zhang, C.Q.; Si, G.; Chung, P.K. Mood profile clusters among Chinese athletes and nonathletes. Int. J. Sport Exerc. Psychol. 2021, 19, S182–S183. [Google Scholar] [CrossRef]
- Terry, P.C.; Parsons-Smith, R.L.; King, R.; Terry, V.R. Influence of sex, age, and education on mood profile clusters. PLoS ONE 2021, 16, e0245341. [Google Scholar] [CrossRef]
- Quartiroli, A.; Parsons-Smith, R.L.; Fogarty, G.J.; Kuan, G.; Terry, P.C. Cross-cultural validation of mood profile clusters in a sport and exercise context. Front. Psychol. 2018, 9, e1949. [Google Scholar] [CrossRef]
- Terry, P.C.; Parsons-Smith, R.L.; Skurvydas, A.; Lisinskienė, A.; Majauskienė, D.; Valančienė, D.; Cooper, S.; Lochbaum, M. Physical activity and healthy habits influence mood profile clusters in a Lithuanian population. Sustainability 2022, 14, 10006. [Google Scholar] [CrossRef]
- Han, C.; Parsons-Smith, R.L.; Terry, P.C. Mood profiling in Singapore: Cross-cultural validation and potential applications of mood profile clusters. Front. Psychol. 2020, 11, e665. [Google Scholar] [CrossRef] [PubMed]
- Australian Bureau of Statistics. National Survey of Mental Health and Wellbeing: Summary of Results. 2008. Available online: https://www.abs.gov.au/AUSSTATS/[email protected]/Lookup/4326.0Main+Features32007? (accessed on 4 January 2024).
- Yu, S. Uncovering the hidden impacts of inequality on mental health: A global study. Transl. Psychiatry 2018, 8, e98. [Google Scholar] [CrossRef] [PubMed]
- Aldao, A.; Nolen-Hoeksema, S.; Schweizer, S. Emotion-regulation strategies across psychopathology: A meta-analytic review. Clin. Psychol. Rev. 2010, 30, 217–237. [Google Scholar] [CrossRef] [PubMed]
- Remmers, C.; Topolinski, S.; Koole, S.L. Why being mindful may have more benefits than you realize: Mindfulness improves both explicit and implicit mood regulation. Mindfulness 2016, 7, 829–837. [Google Scholar] [CrossRef]
- Ford, C.G.; Wilson, J.M.; Altman, N.; Strough, J.; Shook, N.J. Profiles of mindfulness across adulthood. Mindfulness 2020, 11, 1557–1569. [Google Scholar] [CrossRef]
- Frank, P.; Jokela, M.; Batty, G.D.; Lassale, C.; Steptoe, A.; Kivimaki, M. Overweight, obesity, and individual symptoms of depression: A multi-cohort study with replication in UK Biobank. Brain Behav. Immun. 2022, 105, 192–200. [Google Scholar] [CrossRef] [PubMed]
- Mansur, R.B.; Brietzke, E.; McIntyre, R.S. Is there a “metabolic-mood syndrome”? A review of the relationship between obesity and mood disorders. Neurosci. Biobehav. Rev. 2015, 52, 89–104. [Google Scholar] [CrossRef]
- Chekroud, S.R.; Gueorguieva, R.; Zheutlin, A.B.; Paulus, M.; Krumholz, H.M.; Krystal, J.H.; Chekroud, A.M. Association between physical exercise and mental health in 1.2 million individuals in the USA between 2011 and 2015: A cross-sectional study. Lancet Psychiatry 2018, 5, 739–746. [Google Scholar] [CrossRef]
- de Rezende, L.F.; Rodrigues Lopes, M.; Rey-López, J.P.; Matsudo, V.K.; Luiz, O. Sedentary behavior and health outcomes: An overview of systematic reviews. PLoS ONE 2014, 9, e105620. [Google Scholar] [CrossRef] [PubMed]
- Tabachnick, B.L.; Fidell, L.S. Using Multivariate Statistics, 7th ed.; Pearson Education: Boston, MA, USA, 2019. [Google Scholar]
- Emerson, R.W. Convenience sampling, random sampling, and snowball sampling: How does sampling affect the validity of research? J. Vis. Impair. Blind. 2015, 109, 164–168. [Google Scholar] [CrossRef]
- IBM Corp. IBM SPSS Statistics for Windows, Version 29.0; IBM Corp: Armonk, NY, USA, 2022. [Google Scholar]
- Wagstaff, K.; Cardie, C.; Rogers, S.; Schroedl, S. Constrained k-means clustering with background knowledge. Int. Conf. Mach. Learn. 2001, 1, 577–584. Available online: http://www.cs.cmu.edu/~./dgovinda/pdf/icml-2001.pdf (accessed on 1 February 2022).
- Bair, E. Semi-supervised clustering methods. Wiley Interdisc. Rev. Comput. Stat. 2013, 5, 349–361. [Google Scholar] [CrossRef] [PubMed]
- Jain, A.K. Data clustering: 50 years beyond k-means. Pattern Recognit. Lett. 2010, 31, 651–666. [Google Scholar] [CrossRef]
- Leiner, D.J. Too fast, too straight, too weird: Non-reactive indicators for meaningless data in internet surveys. Surv. Res. Meth. 2019, 13, e7403. [Google Scholar] [CrossRef]
- Meisenberg, G.; Williams, A. Are acquiescent and extreme response styles related to low intelligence and education? Personal. Individ. Differ. 2008, 44, 1539–1550. [Google Scholar] [CrossRef]
- Nevill, A.M.; Lane, A.M. Why self-report “Likert” scale data should not be log-transformed. J. Sports Sci. 2007, 25, 1–2. [Google Scholar] [CrossRef] [PubMed]
- Field, A. Discovering Statistics Using SPSS, 3rd ed.; Sage: London, UK, 2009. [Google Scholar]
- Terry, P.C.; Parsons-Smith, R.L. Identification and incidence of mood profile clusters among sport participants. J. Sci. Med. Sport 2019, 22, S100. [Google Scholar] [CrossRef]
- Rainville, J.R.; Hodes, G.E. Inflaming sex differences in mood disorders. Neuropsychopharmacology 2019, 44, 184–199. [Google Scholar] [CrossRef]
- Amin, Z.; Canli, T.; Epperson, C.N. Effect of estrogen-serotonin interactions on mood and cognition. Behav. Cogn. Neurosci. Rev. 2005, 4, 43–58. [Google Scholar] [CrossRef] [PubMed]
- Dorius, S.F.; Firebaugh, G. Trends in global gender inequality. Soc. Forces 2010, 88, 1941–1968. [Google Scholar] [CrossRef] [PubMed]
- Kuehner, C. Why is depression more common among women than among men? Lancet Psychiatry 2017, 4, 146–158. [Google Scholar] [CrossRef] [PubMed]
- Koumoula, A.; Marchionatti, L.E.; Caye, A.; Karagiorga, V.E.; Balikou, P.; Lontou, K.; Arkoulaki, V.; Simioni, A.; Serdari, A.; Kotsis, K.; et al. The science of child and adolescent mental health in Greece: A nationwide systematic review. Eur. Child Adolesc. Psychiatry. [CrossRef] [PubMed]
- Stavros Niarchos Foundation. Understanding Priorities and Needs for Child and Adolescent Mental Health in Greece: A Landscape Analysis. 2024. Available online: https://childmind.org/global/child-adolescent-mental-health-initiative/ (accessed on 9 January 2024).
- de Wit, L.; Have, M.t.; Cuijpers, P.; de Graaf, R. Body Mass Index and risk for onset of mood and anxiety disorders in the general population: Results from the Netherlands Mental Health Survey and Incidence Study-2 (NEMESIS-2). BMC Psychiatry 2022, 22, e522. [Google Scholar] [CrossRef] [PubMed]
- Scott, K.; Bruffaerts, R.; Simon, G.; Alonso, J.; Angermeyer, M.; de Girolamo, G.; Demyttenaere, K.; Gasquet, I.; Haro, J.M.; Karam, E.; et al. Obesity and mental disorders in the general population: Results from the world mental health surveys. Int. J. Obes. 2008, 32, 192–200. [Google Scholar] [CrossRef] [PubMed]
- Jackson, S.E.; Llewellyn, C.H.; Smith, L. The obesity epidemic—Nature via nurture: A narrative review of high-income countries. SAGE Open Med. 2020, 8, 2050312120918265. [Google Scholar] [CrossRef] [PubMed]
- OECD/European Observatory on Health Systems and Policies. Greece: Country Health Profile 2021, State of Health in the EU; OECD Publishing: Paris, France, 2021. [Google Scholar] [CrossRef]
- Biddle, S. Physical activity and mental health: Evidence is growing. World Psychiatry 2016, 15, 176–177. [Google Scholar] [CrossRef] [PubMed]
- Schuch, F.B.; Vancampfort, D. Physical activity, exercise, and mental disorders: It is time to move on. Trends Psychiatry Psychother. 2021, 43, 177–184. [Google Scholar] [CrossRef]
- Smith, P.J.; Merwin, R.M. The role of exercise in management of mental health disorders: An integrative review. Annu. Rev. Med. 2021, 27, 45–62. [Google Scholar] [CrossRef]
- Tzormpatzakis, N.; Sleap, M. Participation in physical activity and exercise in Greece: A systematic literature review. Int. J. Public Health 2007, 52, 60–71. [Google Scholar] [CrossRef] [PubMed]
- European Union. Eurobarometer: Sport and Physical Activity. 2022. Available online: https://europa.eu/eurobarometer/surveys/detail/2668 (accessed on 10 January 2024).
- Ciacchella, C.; Campedelli, V.; Veneziani, G.; Pellicano, G.R.; Sambucini, D.; Lai, C. Editorial: Impact of the coronavirus pandemic (COVID-19) on mood disorders and suicide. Front. Psychiatry 2022, 28, e846112. [Google Scholar] [CrossRef] [PubMed]
- Green, K.H.; van de Groep, S.; Sweijen, S.W.; Becht, A.I.; Buijzen, M.; de Leeuw, R.N.H.; Remmerswaal, D.; van der Zanden, R.; Engels, R.C.M.E.; Crone, E.A. Mood and emotional reactivity of adolescents during the COVID-19 pandemic: Short-term and long-term effects and the impact of social and socioeconomic stressors. Sci. Rep. 2021, 11, e11563. [Google Scholar] [CrossRef] [PubMed]
- Terry, P.C.; Parsons-Smith, R.L.; Terry, V.R. Mood responses associated with COVID-19 restrictions. Front. Psychol. 2020, 11, e589598. [Google Scholar] [CrossRef] [PubMed]
- Karageorghis, C.I.; Bird, J.M.; Hutchinson, J.C.; Hamer, M.; Delevoye-Turrell, Y.N.; Guérin, S.M.R.; Mullin, E.M.; Mellano, K.T.; Parsons-Smith, R.L.; Terry, V.R.; et al. Physical activity and mental well-being under COVID-19 lockdown: A cross-sectional multination study. BMC Public Health 2021, 21, e988. [Google Scholar] [CrossRef] [PubMed]
- Papastergiou, D.; Kokaridas, D.; Bonotis, K.; Diggelidis, N.; Patsiaouras, A. Exercise, supportive group therapy, and mood profile of Greek cancer patients: Intervention effect and related comparisons. Support. Care Cancer 2018, 26, 3571–3578. [Google Scholar] [CrossRef] [PubMed]
- Κούλη, O.; Ρόκκα, Σ.; Κούλη, Ε.H. H επίδραση των προγραμμάτων yoga στην ψυχική διάθεση ενήλικων γυναικών [Effects of yoga exercise programs on mood states among adult women]. Aθλητική Ψυχολογία [Sports Psychol.] 2007, 18, 59–71. [Google Scholar]
- Psychou, D.; Kokaridas, D.; Koulouris, N.; Theodorakis, Y.; Krommidas, C.; Psychos, C. Impact of exercise intervention on anxiety levels and mood profile of Greek prison inmates. J. Hum. Sport Exerc. 2021, 16, 147–156. [Google Scholar] [CrossRef]
- McRae, K.; Gross, J.J. Emotion regulation. Emotion 2020, 20, 1–9. [Google Scholar] [CrossRef]
- Parkinson, B.; Totterdell, P.; Briner, R.B.; Reynolds, S. Changing Moods: The Psychology of Mood and Mood Regulation; Longman: London, UK, 1996. [Google Scholar]
- Beedie, C.J.; Lane, A.M.; Udberg, R.; Terry, P.C. The 4R model of mood and emotion for sustainable mental health in organisational settings. Sustainability 2022, 14, 11670. [Google Scholar] [CrossRef]
- Gross, J.J.; Thompson, R.A. Emotion regulation: Conceptual foundations. In Handbook of Emotion Regulation; Gross, J.J., Ed.; Guildford Press: New York, NY, USA, 2007; pp. 3–24. [Google Scholar]
- World Health Organization. More Active People for a Healthier World; World Health Organization: Geneva, Switzerland, 2018; Available online: https://www.who.int/health-topics/physical-activity (accessed on 11 January 2024).
- Posadzki, P.; Pieper, D.; Bajpai, R.; Makaruk, H.; Könsgen, N.; Neuhaus, A.L.; Semwal, M. Exercise/physical activity and health outcomes: An overview of Cochrane systematic reviews. BMC Public Health 2020, 20, 1724. [Google Scholar] [CrossRef] [PubMed]
- Teixeira, D.S.; Ekkekakis, P.; Andrade, A.J.; Bastos, V.; Palmeira, A.L. Exploring the impact of individualized pleasure-oriented exercise sessions in a health club setting: Protocol for a randomized controlled trial. Psychol. Sport Exerc. 2023, 67, e102424. [Google Scholar] [CrossRef] [PubMed]
- American Psychiatric Association. Diagnostic and Statistical Manual of Mental Disorders: DSM-5™, 5th ed.; American Psychiatric Publishing: Washington, DC, USA, 2022. [Google Scholar] [CrossRef]
- Dalgleish, T.; Black, M.; Johnston, D.; Bevan, A. Transdiagnostic approaches to mental health problems: Current status and future directions. J. Consult. Clin. Psychol. 2020, 88, 179–195. [Google Scholar] [CrossRef] [PubMed]
Figure 1.
Graphical representation of the 6-cluster solution (N = 1786).

Figure 2.
Graphical representation of the canonical discriminant functions (N = 1786).


Table 1.
Demographic characteristics of the sample (N = 1786).
| Variable | Group | |
|---|---|---|
| Sex | Male (%) | 578 (32.4) |
| Female (%) | 1208 (67.6) | |
| Age | Range | 18–64 |
| Mean (SD) (%) | 34.7 (11.8) | |
| 18–25 years | 511 (28.6) | |
| 26–35 years | 543 (30.4) | |
| 36–45 years | 316 (17.7) | |
| 46–55 years | 310 (17.4) | |
| 56–64 years | 106 (5.9) | |
| Body Mass Index (BMI) | Range | 15.9–43.5 |
| Mean (SD) (%) | 24.2 (3.7) | |
| Underweight | 56 (3.1) | |
| Normal weight | 1099 (61.5) | |
| Overweight | 499 (27.9) | |
| Persons with obesity | 132 (7.4) | |
| Exercise Participation | Exercise participants | 1417 (79.3) |
| Inactive adults | 369 (20.7) |
Table 2.
Raw score descriptive statistics for BRUMS-Greek subscales (n = 1786).
| BRUMS Factor | M | SD | Skewness | Kurtosis | α |
|---|---|---|---|---|---|
| Anger | 1.62 | 2.60 | 2.34 | 6.56 | 0.77 |
| Confusion | 2.21 | 3.15 | 1.79 | 3.15 | 0.82 |
| Depression | 1.14 | 2.37 | 2.99 | 10.46 | 0.85 |
| Fatigue | 3.21 | 3.18 | 1.21 | 1.25 | 0.78 |
| Tension | 2.62 | 3.16 | 1.43 | 1.71 | 0.80 |
| Vigor | 9.40 | 3.76 | −0.36 | −0.42 | 0.85 |
Table 3.
T-score descriptive statistics of the 6-cluster solution (N = 1786).
| Source | Iceberg (n = 655; 36.7%) | Inverse Everest (n = 60; 3.4%) | Inverse Iceberg (n = 175; 9.8%) | ||||||
|---|---|---|---|---|---|---|---|---|---|
| M | SD | 95% CI | M | SD | 95% CI | M | SD | 95% CI | |
| Tension | 44.13 | 3.66 | [43.84, 44.10] | 76.60 | 7.70 | [74.61, 78.59] | 65.37 | 8.20 | [64.14, 66.59] |
| Depression | 45.60 | 1.65 | [45.47, 45.72] | 86.16 | 13.75 | [82.61, 89.72] | 62.59 | 10.29 | [61.05, 64.12] |
| Anger | 45.04 | 2.98 | [44.82, 45.27] | 81.05 | 13.57 | [77.54, 84.55] | 63.13 | 10.31 | [61.59, 64.67] |
| Vigor | 58.44 | 4.91 | [58.06, 58.81] | 40.85 | 10.66 | [38.10, 43.61] | 42.67 | 8.42 | [41.42, 43.93] |
| Fatigue | 44.07 | 5.09 | [43.68, 44.46] | 73.72 | 9.72 | [70.81, 75.83] | 60.34 | 9.60 | [58.90, 61.77] |
| Confusion | 44.17 | 2.51 | [43.98, 44.36] | 79.99 | 8.21 | [77.87, 82.11] | 66.16 | 7.55 | [65.03, 67.29] |
| Source | Shark Fin (n = 208; 11.6%) | Submerged (n = 375; 21.0%) | Surface (n = 313; 17.5%) | ||||||
| M | SD | 95% CI | M | SD | 95% CI | M | SD | 95% CI | |
| Tension | 48.55 | 5.99 | [47.73, 49.37] | 44.77 | 4.11 | [44.35, 45.18] | 55.84 | 6.46 | [55.12, 56.56] |
| Depression | 50.48 | 6.22 | [49.63, 51.33] | 46.30 | 3.19 | [45.97, 46.62] | 49.37 | 5.99 | [48.70, 50.03] |
| Anger | 49.60 | 6.67 | [48.69, 50.51] | 45.38 | 3.18 | [45.06, 45.70] | 52.88 | 7.08 | [52.09, 53.67] |
| Vigor | 39.93 | 7.38 | [38.92, 40.94] | 42.37 | 6.08 | [41.75, 42.98] | 54.03 | 5.54 | [53.41, 54.64] |
| Fatigue | 60.56 | 7.67 | [59.52, 61.61] | 44.95 | 4.43 | [44.50, 45.40] | 51.20 | 6.41 | [50.49, 51.91] |
| Confusion | 50.20 | 6.37 | [49.33, 51.07] | 45.01 | 3.65 | [44.64, 45.38] | 53.26 | 6.33 | [52.56, 53.96] |
Table 4.
Classification of discriminant functions (N = 1786).
| Cluster | Predicted Group Membership | N | % | |||||
|---|---|---|---|---|---|---|---|---|
| 1 | 2 | 3 | 4 | 5 | 6 | |||
| 1 | 655 | 0 | 0 | 0 | 0 | 0 | 655 | 100 |
| 2 | 0 | 56 | 4 | 0 | 0 | 0 | 60 | 93.3 |
| 3 | 0 | 1 | 167 | 0 | 0 | 7 | 175 | 95.4 |
| 4 | 2 | 0 | 1 | 175 | 22 | 8 | 208 | 84.1 |
| 5 | 38 | 0 | 0 | 0 | 334 | 3 | 375 | 89.1 |
| 6 | 28 | 0 | 4 | 2 | 6 | 273 | 313 | 87.2 |
Note. 1 = Iceberg, 2 = Inverse Everest, 3 = Inverse iceberg, 4 = Shark fin, 5 = Submerged, 6 = Surface.
Table 5.
Distribution of clusters by demographic variables (N = 1786).
| Source | Cluster | |||||||||||
|---|---|---|---|---|---|---|---|---|---|---|---|---|
| 1 | % | 2 | % | 3 | % | 4 | % | 5 | % | 6 | % | |
| Sex χ2(5) = 6.82, ns | ||||||||||||
| Male (n = 578) | 231 *+ | 40.0 | 22 | 3.8 | 46 | 8.0 | 62 | 10.7 | 118 | 20.4 | 99 | 17.1 |
| Female (n = 1208) | 424 | 35.1 | 38 | 3.1 | 129 | 10.7 | 146 | 12.1 | 257 | 21.3 | 214 | 17.7 |
| Age group (year) χ2(20) = 41.00 § | ||||||||||||
| 18–25 (n = 511) | 159 §− | 31.1 | 23 | 4.5 | 52 | 10.2 | 72 *+ | 14.1 | 109 | 21.3 | 96 | 18.8 |
| 26–35 (n = 543) | 192 | 35.4 | 16 | 2.9 | 49 | 9.0 | 64 | 11.8 | 112 | 20.6 | 110 *+ | 20.3 |
| 36–45 (n = 316) | 124 | 39.2 | 14 | 4.4 | 33 | 10.4 | 28 | 8.9 | 70 | 22.2 | 47 | 14.9 |
| 46–55 (n = 310) | 131 *+ | 42.3 | 7 | 2.3 | 36 | 11.6 | 34 | 11.0 | 66 | 21.3 | 36 §− | 11.6 |
| 56+ (n = 106) | 49 *+ | 46.2 | 0 *− | 0.0 | 5 | 4.7 | 10 | 9.4 | 18 | 17.0 | 24 | 22.6 |
| BMI χ2(5) = 18.31 § | ||||||||||||
| Normal (n = 1099) | 403 | 36.7 | 34 | 3.1 | 100 †− | 9.1 | 119 *− | 10.8 | 239 *+ | 21.7 | 204 | 18.6 |
| Persons with obesity (n = 132) | 41 | 31.1 | 5 | 3.8 | 24 | 18.2 | 22 | 16.7 | 18 | 13.6 | 22 | 16.7 |
| Exercise participation χ2(5) = 104.32 † | ||||||||||||
| Active (n = 1417) | 560 †+ | 39.5 | 33 †− | 2.3 | 102 †− | 7.2 | 161 | 11.4 | 328 †+ | 23.1 | 233 *− | 16.4 |
| Inactive (n = 369) | 95 | 25.7 | 27 | 7.3 | 73 | 19.8 | 47 | 12.7 | 47 | 12.7 | 80 | 21.7 |
Note. 1 = Iceberg, 2 = Inverse Everest, 3 = Inverse iceberg, 4 = Shark fin, 5 = Submerged, 6 = Surface; + = over-represented, − = under-represented; † p < 0.001; § p < 0.01; * p < 0.05.
Disclaimer/Publisher’s Note: The statements, opinions and data contained in all publications are solely those of the individual author(s) and contributor(s) and not of MDPI and/or the editor(s). MDPI and/or the editor(s) disclaim responsibility for any injury to people or property resulting from any ideas, methods, instructions or products referred to in the content. |
© 2024 by the authors. Licensee MDPI, Basel, Switzerland. This article is an open access article distributed under the terms and conditions of the Creative Commons Attribution (CC BY) license (https://creativecommons.org/licenses/by/4.0/).
Share and Cite
MDPI and ACS Style
Terry, P.C.; Parsons-Smith, R.L.; Vlachopoulos, S.P.; Lane, A.M. Mood Profile Clusters among Greek Exercise Participants and Inactive Adults. Sci 2024, 6, 18. https://0-doi-org.brum.beds.ac.uk/10.3390/sci6020018
AMA Style
Terry PC, Parsons-Smith RL, Vlachopoulos SP, Lane AM. Mood Profile Clusters among Greek Exercise Participants and Inactive Adults. Sci. 2024; 6(2):18. https://0-doi-org.brum.beds.ac.uk/10.3390/sci6020018
Chicago/Turabian StyleTerry, Peter C., Renée L. Parsons-Smith, Symeon P. Vlachopoulos, and Andrew M. Lane. 2024. "Mood Profile Clusters among Greek Exercise Participants and Inactive Adults" Sci 6, no. 2: 18. https://0-doi-org.brum.beds.ac.uk/10.3390/sci6020018