1. Introduction
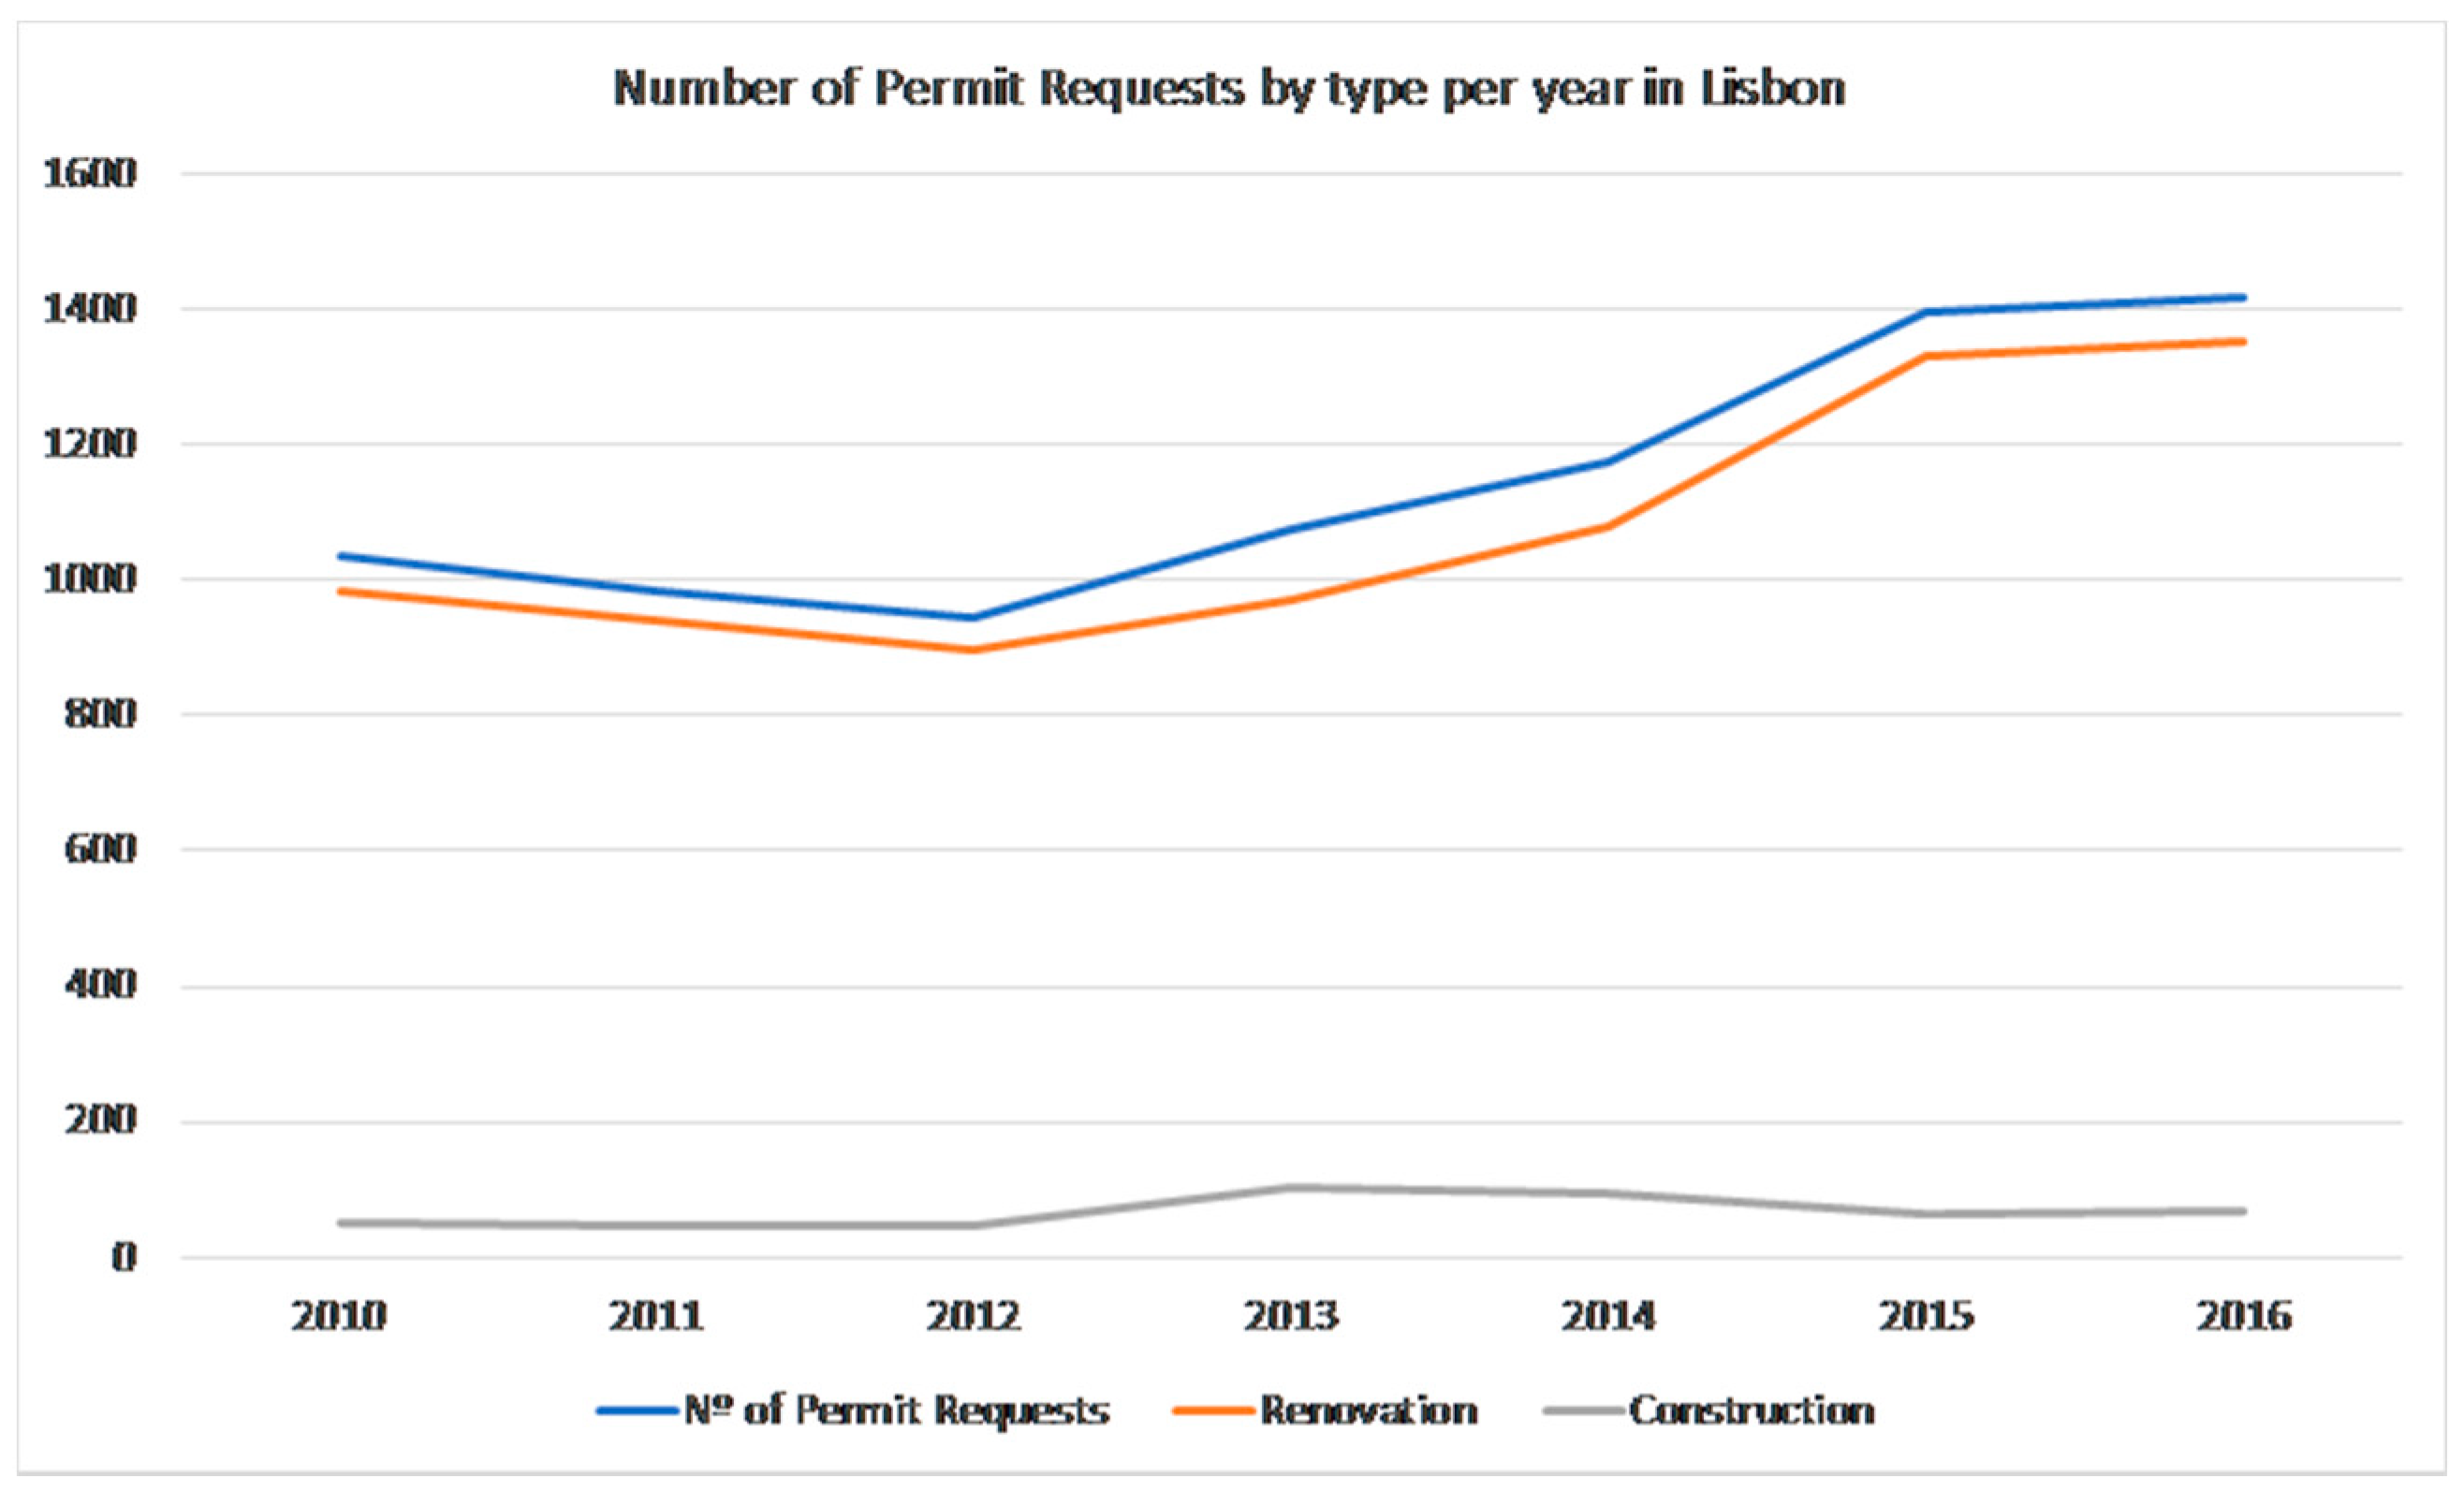
Building renovation has gained increasing relevance in the Portuguese context (
Figure 1), particularly in its two major cities, Porto and Lisbon, in a context of decreasing activity of the building construction sector [
1]. This urban renewal process appears to be concentrated on historic city centers and city 19th century and early 20th century expansions. It differs from traditional top-down urban renewal processes in the sense that there has been no public or privately led large scale expropriation or demolitions to give way to redevelopments. Instead, it is composed of a large amount of small interventions in existing structures that maintain the existing plot morphology. These interventions mostly comprise:
additions to the original building volume;
alterations to the plan typology or spatial distribution;
small subsets of façade refurbishment or maintenance; and
reconstruction.
This is mostly a bottom-up privately led urban renewal process whose spatially asymmetric and local nature eludes traditional city level statistical tools. Renovation has become one of the key fields of Portuguese economic transformation. Measuring this phenomenon, assessing the local intensity of these processes, preferably at the neighborhood scale, is of great usefulness for all city stakeholders, particularly to city planning officials, architects, or real estate agents.
Understanding urban complexity and describing it are related and complex issues. An urban planner/designer must first produce a synthesis of the city to plan/design over that synthesis. An important step towards that kind of approach was taken by Kevin Lynch [
2], with the creation of a synthesis of spatial relationships in the city through mental maps. Those mental maps are a group of five elements:
paths;
edges;
districts;
nodes; and
landmarks.
That concept, combined with Alexander’s hierarchical systems [
3] or Gehl’s [
4] idea of complexity of the urban space between buildings, evolved to what Salingaros calls the “theory of urban web” [
5] or to Michael Batty’s Complexity Theory in Cities and Planning [
6]. Batty is also protagonist of important research in modelling the city complexity [
7].
Providing better ways of modelling urban phenomena at the onset of a planning process or a project is important, it is when that information can be more helpful for architects and urban planners. Models or statistical methods can assist in obtaining insights over future changes in an area of interest for a project or a plan.
Using computational tools, it is possible to generate maps that correlate city hall databases of building permit applications with georeferenced data. In previous work [
8], while using Lisbon and Toronto’s City Hall databases of building permit applications, between 2010 and 2016, and georeferenced vector information, we focused on generating maps that lend themselves to analytical study, developing a process of georeferencing building permit application processing times. Those processing times came directly from city hall databases that stored both permit application day as well as permit issuing day. Toronto was selected as a benchmark because the city discloses permit records since 2000, which are available as open data. This database contains similar information and follows similar rules to the data gathered by the city of Lisbon. Furthermore, the permit types in Toronto can be clearly grouped in Construction or Renovation, as in the city of Lisbon. While those analytical maps are useful at a neighborhood level, at the city scale they become harder to visualize. Also, they represent the occurrence of renovation, but do not compare it with the underlying density of the urban morphology. Additionally, city hall building permit databases do not account for all renovation work, because some renovations are exempt, and others proceed illegally.
Statistical methods, such as Kernel Density Estimation (KDE) [
9,
10], have the capacity to overcome incomplete data, providing estimations on the continuous density of the observed phenomenon. Its use is adequate in informal investigation of the properties of datasets, providing information about skewness and multimodality [
11]. Other advantages of these methods are the capacity to provide readability at the city scale. Multivariate KDE has been widely used to estimate the distribution of diverse events over bi-dimensional urban space, such as to examine associations between neighborhood destination intensity, walking and physical activity [
12] or to study the urban sprawl in China [
13]. With the implementation of open data policies by city halls across major European and North American cites, this method is a convenient approach to investigate the properties and determine their distribution on a large volume of data [
14,
15]. It is also useful in presenting analysis of complex data [
11]. A limitation of directly applying KDE to building renovation is that the city has an underlying density that may skew the observed patterns or otherwise hide areas of high incidence of renovation in low-density areas. This is particularly important in cities such as Lisbon where there is a wide difference in density between the city historical center and the several 19th century and 20th century expansions. To overcome these issues, Dual KDE has been used to compare the density of the observed phenomenon against the density of a population, which is in this case the existing buildings. This methodology has been used to analyze the incidence of disease across a country, comparing the number of cases against the population [
16], or the distribution of low-income family settlement patterns in a metropolitan area [
17]. When compared to KDE, this method yields higher precision [
11,
17,
18] and allows for direct comparison with local level geographic data [
17]. This paper presents preliminary research on the application of Dual KDE to determine the intensity of building renovation on the city of Lisbon. Intensity, in this context, is understood as the proportion of renovated buildings over the total number of existing buildings in an area. To estimate intensity a Dual KDE is tested. A GIS software is used to produce reference intensity estimations while using a KDE plugin. The methodology is transposed to a parametric modelling environment, which is more familiar amongst architects, and the results are compared. The limitations of the Dual KDE are then discussed and alternatives for improving the accuracy of the estimates are proposed.
2. Materials and Methods
In order to measure the intensity in Lisbon neighbourhood building renovation, the Dual KDE was chosen for a better visualization, as well as a diachronic comparison of the different time frames. This allows for comparing the density of two different variables: the density of building renovation; and the density of the city.
2.1. Dataset
The analyses are based on data obtained from Lisbon City Hall at the beginning of 2017. The supplied data is composed of georeferenced vector information, in shapefile format, and a database with application admission, approval, and issuing dates of building permits; administrative proceeding and building permit types; a building unique ID; building type amongst other types of administrative specific information. In 2018, a dataset containing most of that data was made publicly available by Lisbon City Hall [
19]. Yet, as compared to the database that we were provided, this dataset is missing some fields, namely the date of permit approval and of permit issuing. This latter field is available in a separate dataset, also available as open data [
20].
The Lisbon City Hall cartographic base has a unique GIS ID (codigo SIG) for each building, used across the shapefile and the alphanumeric building permits database. All buildings in the city, whether public or privately owned, are referenced. This allows for cross-referencing the information distributed amongst several databases and map many of the city hall activities, such as:
Although the permit database has been in use since 2003, it was not until 2009 that all the building permit types were systematically stored with correct use of the GIS IDs. Thus, to assure data consistency, only entries between 2010 and 2016 were considered. We filtered the database following two different sets of criteria to produce two datasets, one containing all of the permit requests in the period of 2010–2016, the other containing all the permits issued between 2010 and 2016. The first set can be considered the intentions of renovation, while the second is the renovation that effectively occurred. The remaining filtering criteria are identical in both datasets. First remove all permits whose purpose is other than building renovation, according to building permit type, then remove all the duplicate entries. The large majority of duplicate GIS ID entries is a result of simultaneous processes for the same GIS ID. The reason behind this duplication is that each GIS ID is attributed to a building, whether it is in a vertical or horizontal property regime. Thus, in the latter case, all privately held units of the building share the same code. When these duplicate entries are simultaneous, it means that a permit is requested for two separate units in the same building by the same proprietor. When this is the case, the permits share the same process code. Since there are other causes for duplicate GIS ID entries, such as permit applications for the same building either for different units or for the same property at different times, we filtered the duplicates by the process code. These datasets contain information for all the permits within the Lisbon city border and also for municipal properties outside of the city limits. As these latter municipal properties are not adjacent to the city limits they were not included in the analyses. The final set of issued permits in the period contains 5499 entries in which 4587 are unique GIS IDs, and the final set of permit requests contains 8160 entries in which 6146 correspond to unique GIS IDs.
2.2. Building Renovation
The building permit type is the key information that distinguishes permit applications for new buildings from renovation permits. Overall there are 12 categories that can be divided into three groups:
renovation;
construction; and
others.
The first group contains four categories:
alteration;
expansion or addition;
reconstruction; and
conservation.
An alteration is a change to the existing building maintaining its volume, but not either its structure, stairs, facades or infrastructure. All other types of interior refurbishment, like changing the dimensions of compartments, aren’t required to submit for a building permit. An expansion or addition is a change of the building original volume and/or plan, and a reconstruction is demolishing the existing structure, maintaining or not the existing façade, and rebuilding it within the same volume and plan. Whereas, conservation works are those required to return the structure’s exterior envelope to its original condition. The construction group only contains new building permits and the others group is comprised of administrative procedures without urbanistic relevance, that make changes to ongoing permits or that cannot be included in the previous groups. In this study, only the renovation group is considered, and all of its subcategories are joined into one set. The final set of issued permits contains 5116 points, and the set of permit requests contains 7553 points for the 2010–2016 period.
2.3. Kernel Density Estimation
KDE is a method of estimating the smooth probability density function of discontinuous spatially distributed underlying data [
9,
10,
11,
18]. When compared to other methods, such as histograms or naïve estimators, the estimation that it produces is not influenced by the choice of an origin and a direction of the analysis grid. This is particularly useful in urban contexts, as it is not necessary to impose arbitrary grids that would inevitably involve compromises and eventually obscure patterns in the data. In two-dimensional analysis, as in our case, it produces a three-dimensional surface that is smooth and continuous, improving its readability and making it easier to generate contour diagrams. Furthermore, it is a widely available method in GIS software. A kernel estimator with kernel
K for the bivariate case is defined by (1)
where
h is the window width or bandwidth,
n is the number of events, and
are the point coordinates.
The use of KDE requires points as inputs representing the location of events, a choice of type of kernel function, a window or bandwidth, and the definition of the analysis mesh. Since we are dealing with buildings, any point that falls within or on the boundaries of the building’s polygon could be considered. We choose to use the centroid of the polygon, as this point can be retrieved accurately for all buildings, both in GIS or the parametric environment. There are several options for Kernel functions, being the most common the Gaussian or normal kernel and the Epanechnikov quadratic kernel (2). We selected the later [
11], because it is less computationally expensive and it evaluates to zero if the distance of the event is larger than the window. This means that it is a more local measure than the normal kernel. The Epanechnikov kernel that we used is defined as:
Since the aim here is to produce a Dual KDE, which is the result of the division of a density estimate of renovation by the density estimate of the existing buildings, great care as to be taken to avoid the denominator being negative or equal to zero. In our case, the geographical coordinates are positive quantities, and there are no observations near zero, so all estimates integrate to unity [
11]. Yet, since the study area contains large areas with few buildings and we are using a quadratic kernel which evaluates to 0 for distances larger than the window, a sufficiently large window must be selected. This value is dependent on the real density of the data and, as we are comparing several sets, the optimal window for each set can be different. To avoid over-smoothing the estimates an adaptive KDE is recommended [
11,
18]. With this method, an adaptive window is used to ensure that a minimum number of points is found within the kernel. This has the advantage of providing constant precision over the entire area. We adopt an adaptive KDE following the algorithm that is described in [
11]:
Find a pilot estimate for kde(x), using the previously defined Functions (1) and (2), that satisfies kde(Xi) > 0 for all i.
Define local bandwidth factors λi by (3) where g is the geometric mean of kde(Xi), and α is the sensitivity parameter, a number satisfying 0 ≤ α ≤ 1.
Define the adaptive kernel estimate
kde(
x) by (4).
The sensitivity parameter determines the amount of smoothing applied and we set it to ½ [
11].
After the adaptive KDE is calculated for the renovation in both datasets, permit requests, and permit issues, and for all the existing buildings in the city, each of the first two estimates is divided by the second to produce a Dual KDE. The resulting surface is the intensity of building renovation in the existing urban form.
2.4. Parametric Modelling
Parametric modelling emerges has powerful tool by describing a range of possibilities. This process based on algorithmic thinking enables encoding a relationship between intent and response by defining parameters and rules. Visual programming environment Grasshopper for Rhino3D is a particularly interesting parametric modelling approach to integrating system dynamics simulation at various scales.
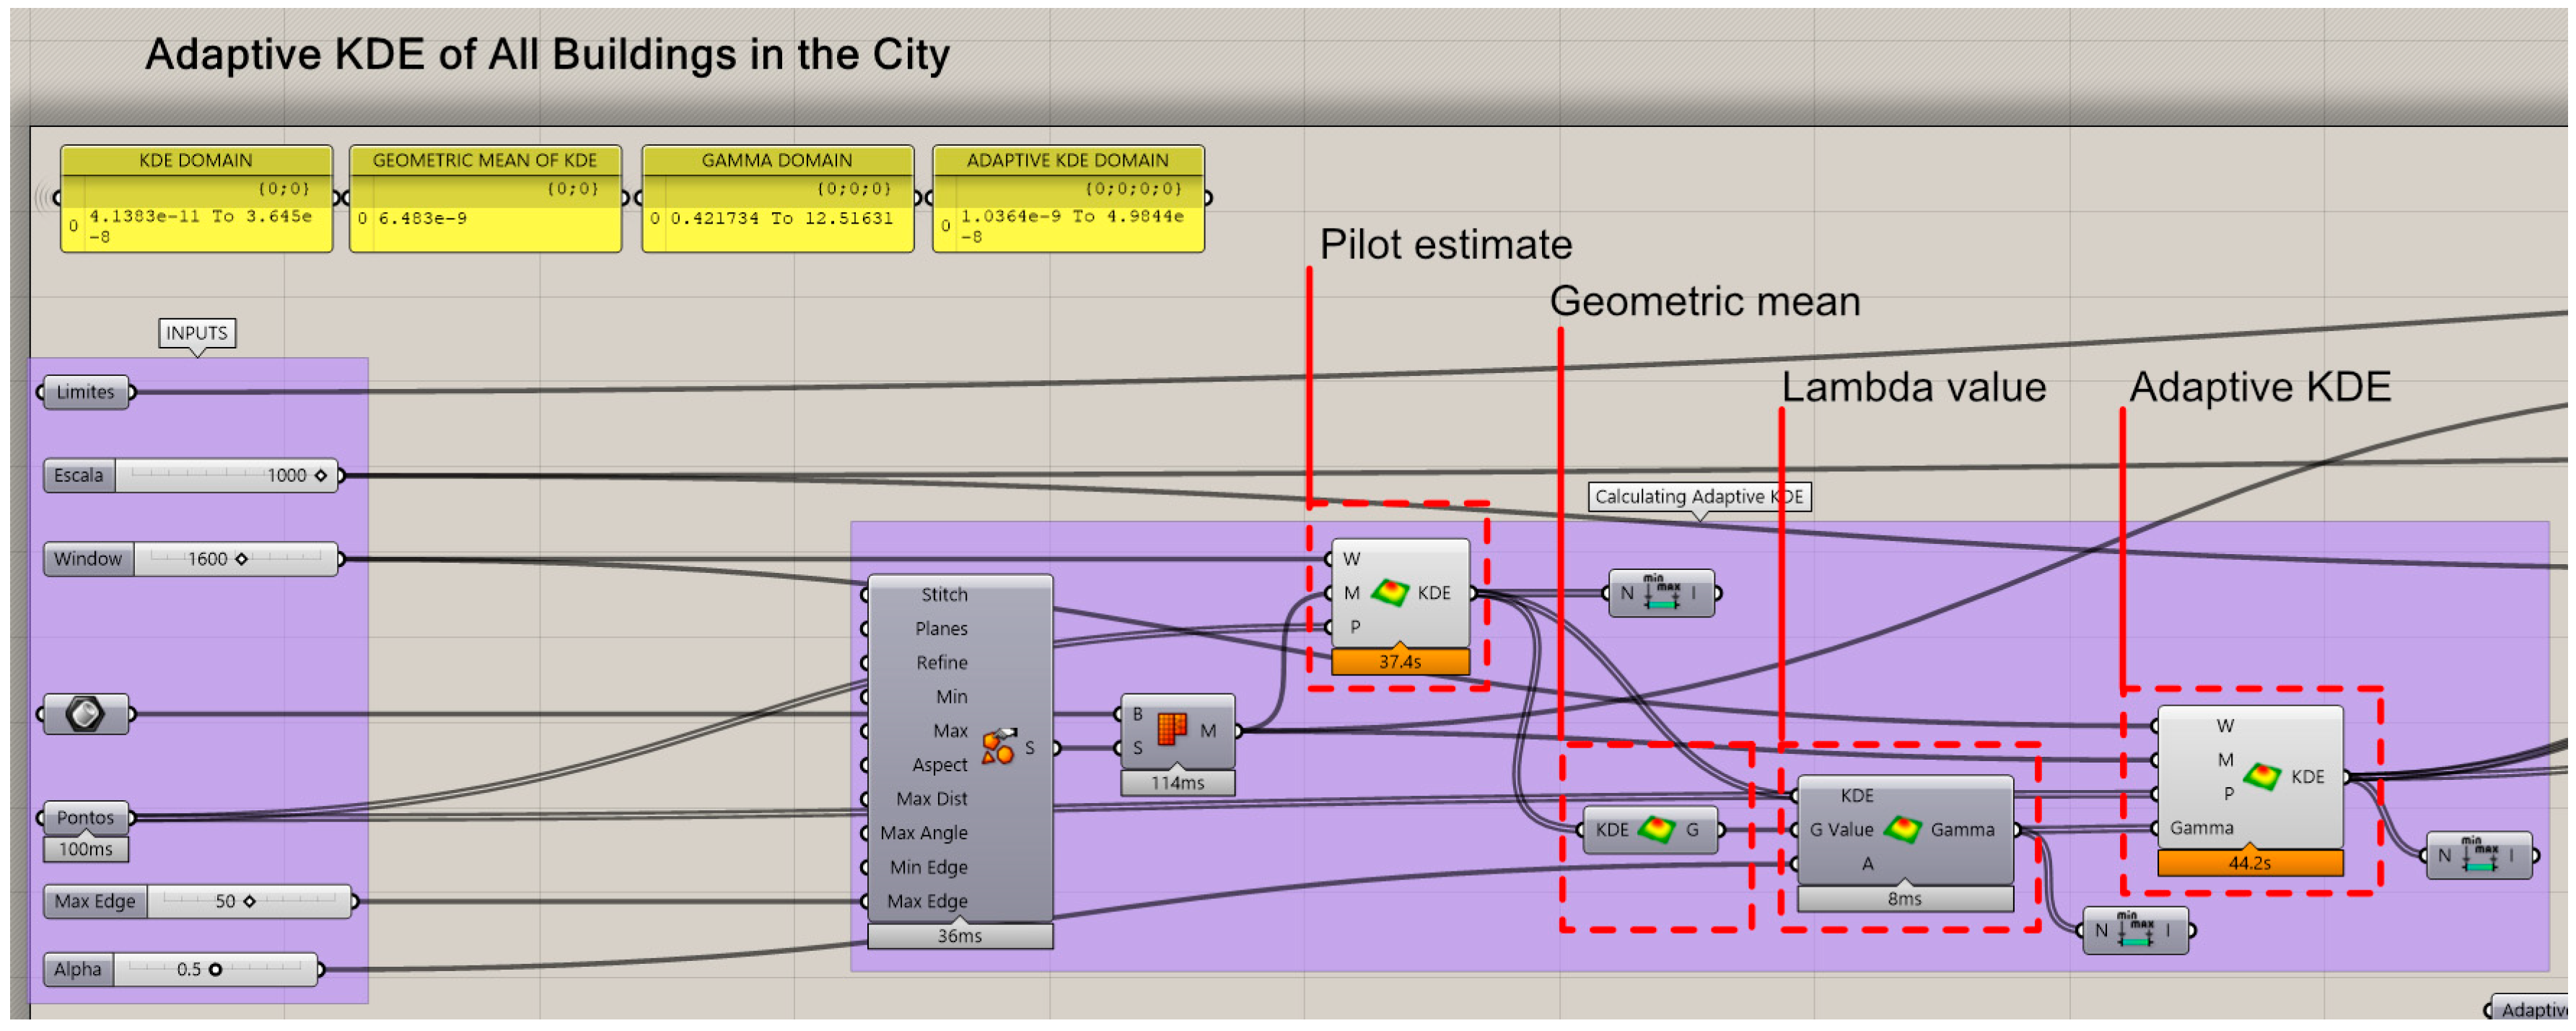
Therefore, we adapted the methodology to parametric modelling environment in the following way (
Figure 2). First, a mesh that encompasses the council border is generated, the mesh subdivision determines the definition of the resulting KDE, we used maximum size of 50 m and an area that is larger than the city boundaries. A pilot estimate is produced with a sufficiently large window. Then, the previously described algorithm is implemented to produce as estimate for each of the vertices of the mesh. Finally, each estimation is assigned to the respective Z coordinate of vertex in the mesh. The scripts used to calculate the KDE are available at [
21,
22]. The inversely proportional nature of KDE in regard to distance means that the longer the points are apart the smaller is the estimate. A high concentration of points results in high KDE values. For viewing purposes, the last steps are scaling the surface Z coordinates, coloring the mesh and producing contours every 10%.
3. Results
The adopted data-driven analysis method allowed implementations of adaptive KDE using a visual-programming implementation environment and GIS software. We produced adaptive KDE estimates for each of the datasets. He used a window or bandwidth h of 1800 m for the permit requests and the issued permits, and a window h of 1600 m for the existing buildings. The results of the adaptive KDE of permit requests and all existing buildings are presented in this section to highlight the effects of the application of the method. Then, the results of both permit requests and issued permits Dual KDE’s are presented and compared. We further divided the sets into yearly periods to determine whether the permit requests intensities can be used to predict the intensities of issued permits of the following year.
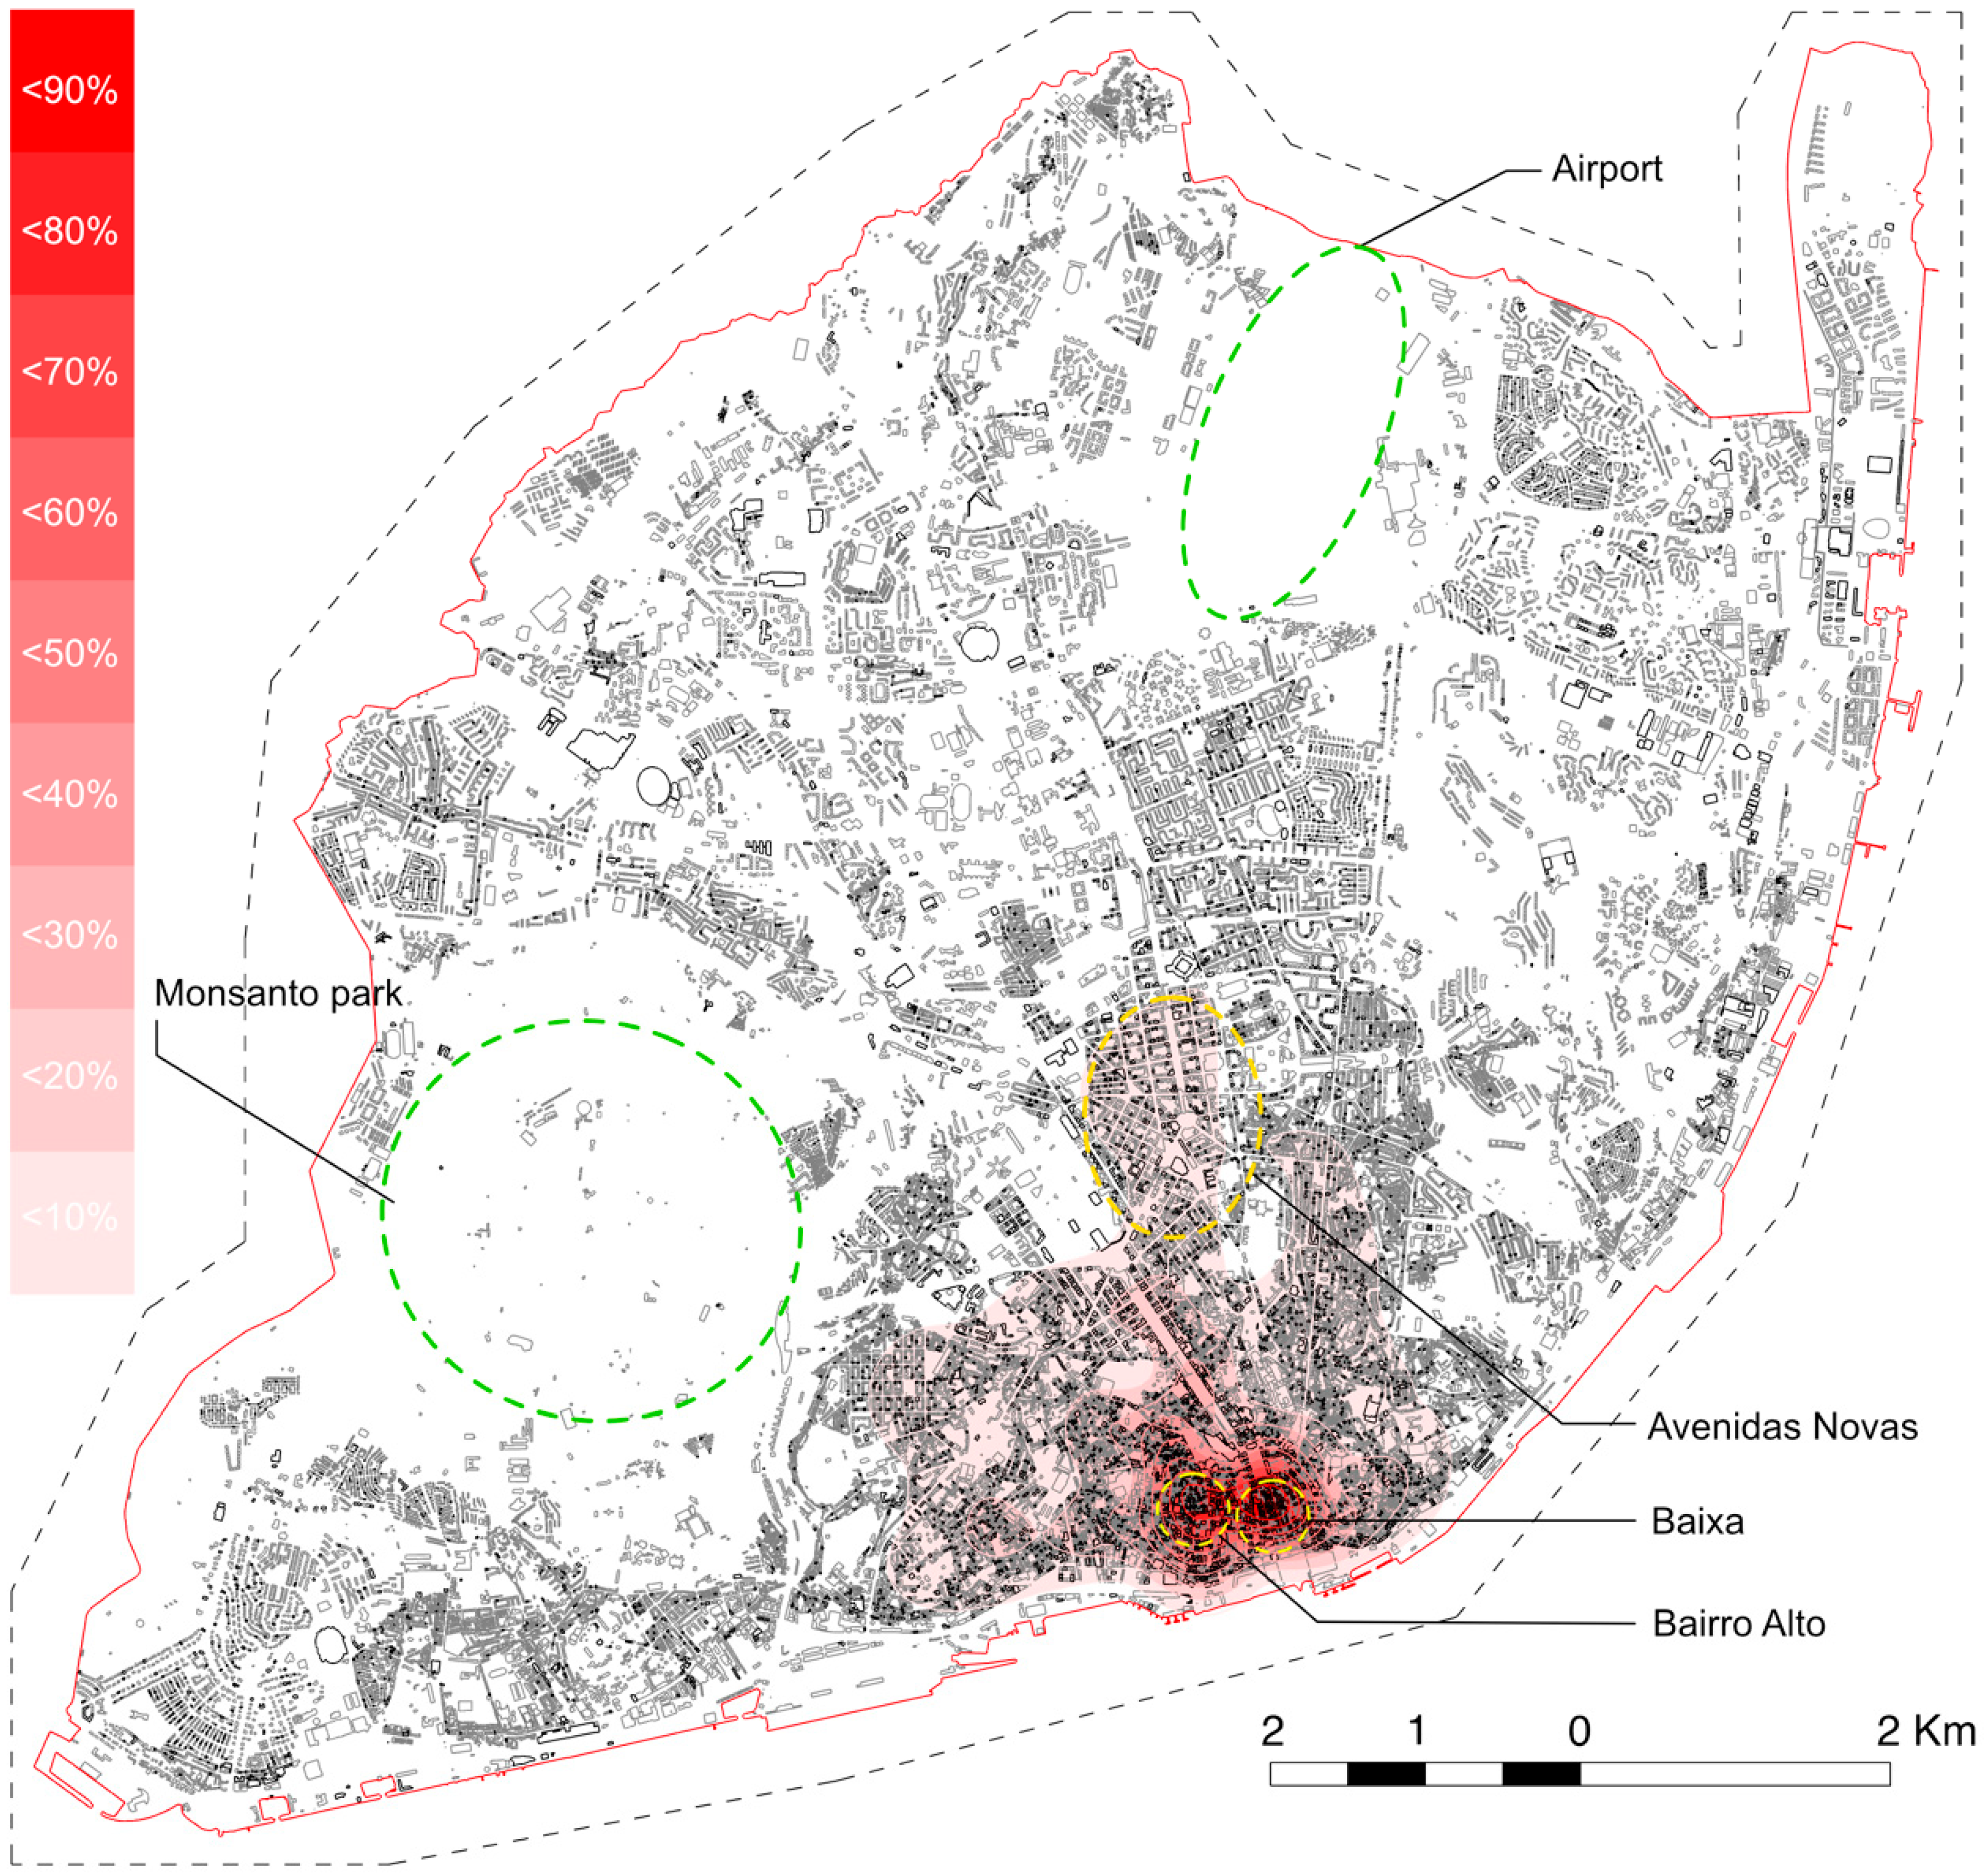
Figure 3 is an example of an adaptive KDE that only considers Renovation events of permit requests. The dashed polygon is the limits of the analysis mesh. There is a higher concentration of renovation permits in the historic center with two distinct focus points, one over
Baixa area and the other on Bairro Alto. From there spreads in all directions, but particularly so towards
Avenidas Novas area, a 20th century expansion. Areas with very low building density or no buildings at all are the Airport and the Monsanto park. The higher concentration of renovation can partly be explained by the city’s morphology. Central areas have smaller plots, whereas in more recent areas the buildings are more spaced apart.
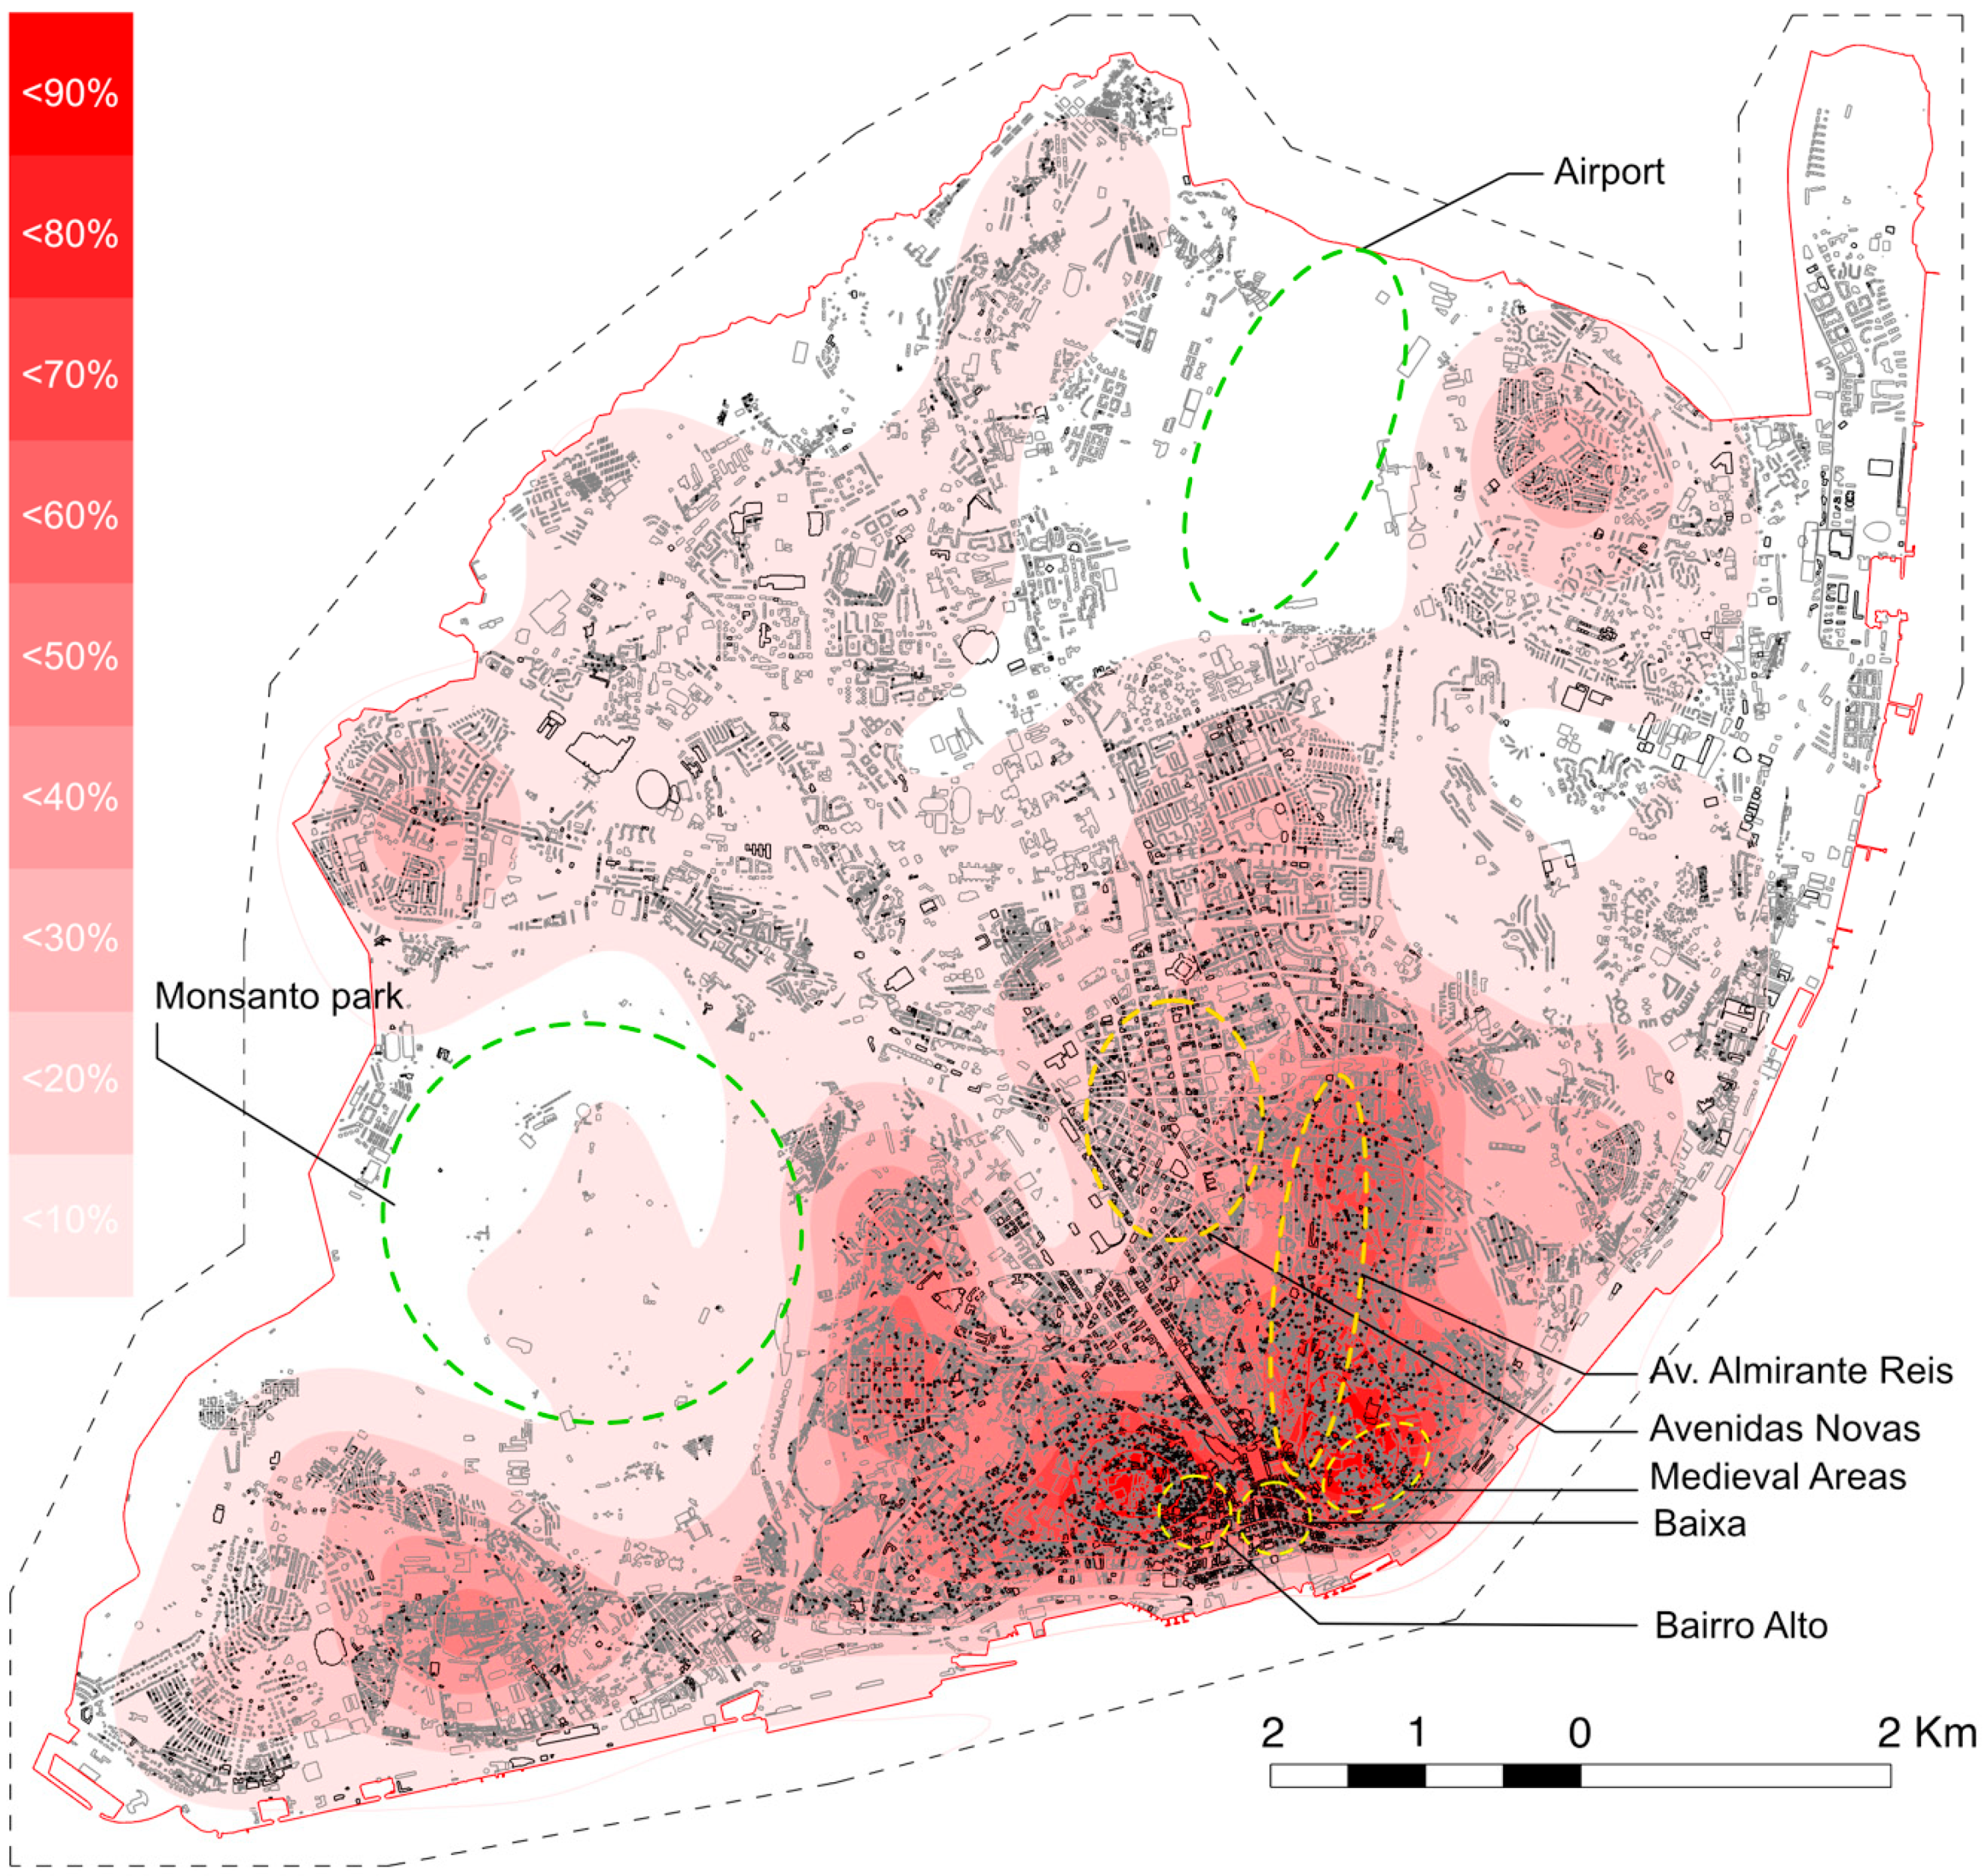
Figure 4 presents the adaptive KDE for all of the buildings in the city. It is visible that the
Baixa area is not a high-density area according to this metric. High density areas concentrate on medieval neighborhoods to the east of
Baixa and along Avenida Almirante Reis to the North. Bairro Alto is confirmed to be a high-density area.
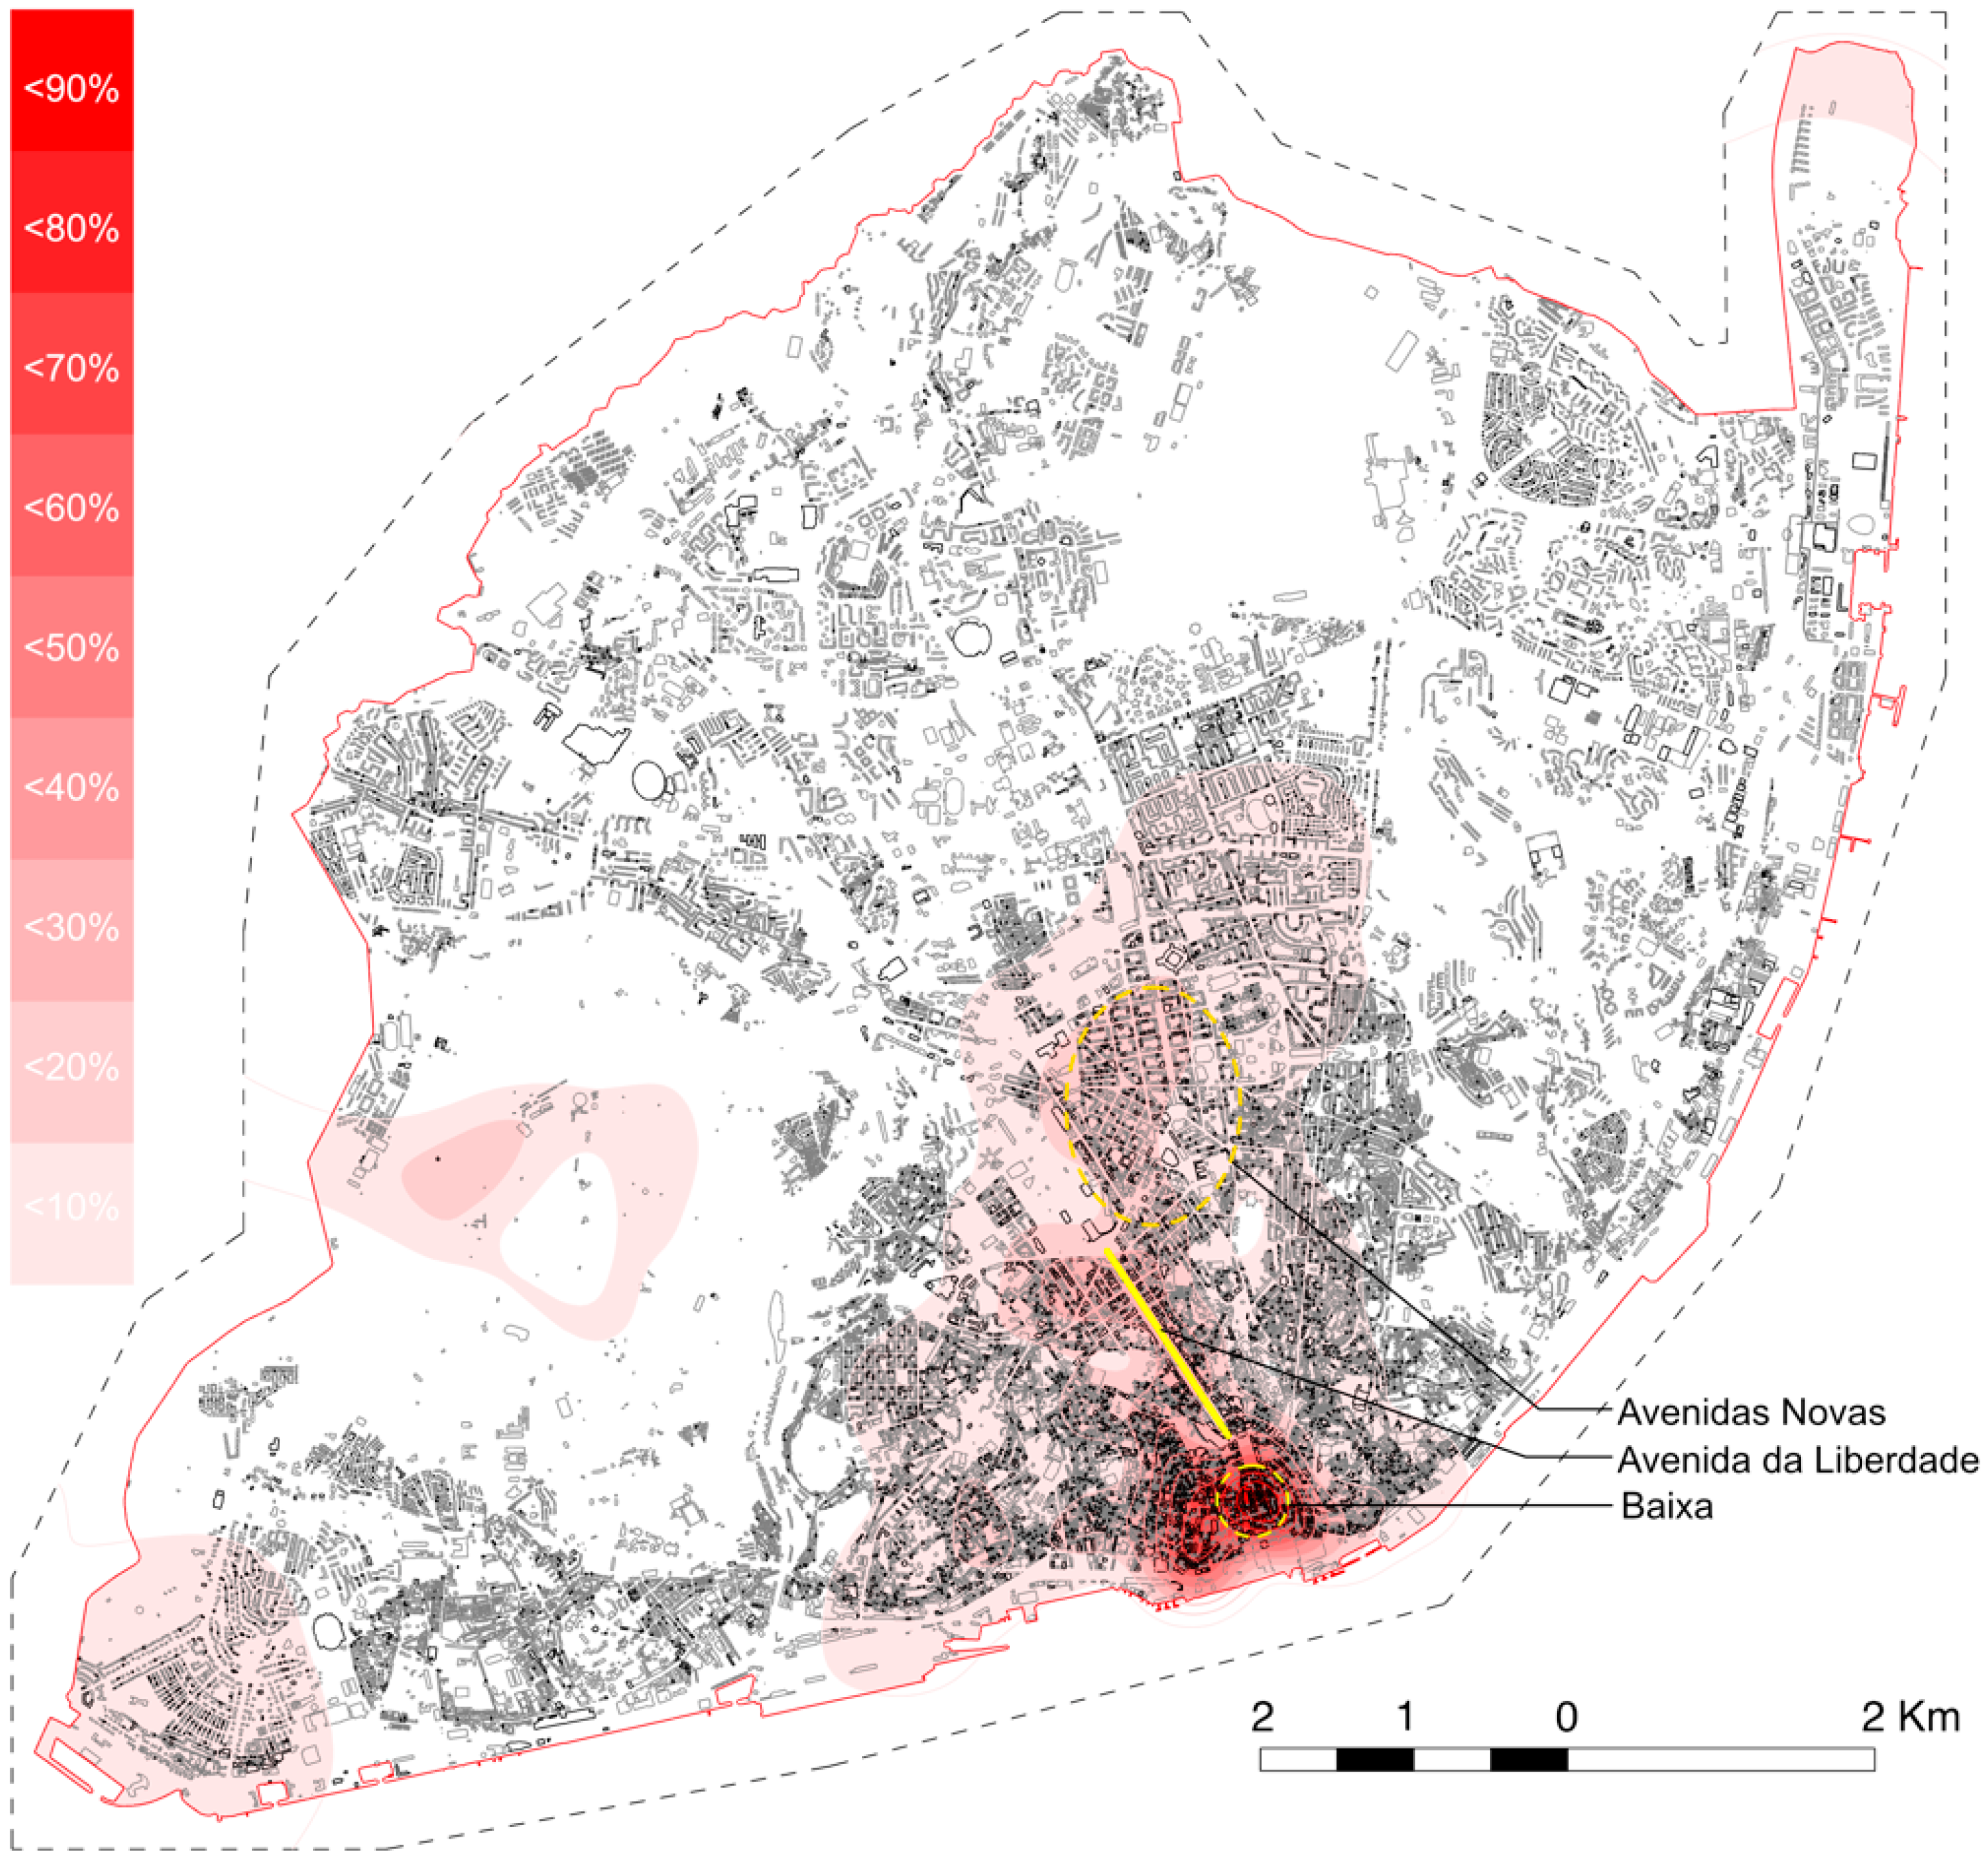
The Dual KDE sidesteps some of the previous referred issues. By dividing the KDE of renovation by the KDE of all existing buildings we are no longer determining the density in an abstract space. Instead, we are comparing the renovation permits with the existing 55,385 buildings. A higher value means that a higher proportion of buildings in a given area have been renovated, consequently it is a relative measure of intensity. The results of the division of the estimates in
Figure 3 by the estimates in
Figure 4 are shown in
Figure 5. The areas of large intensity have clearly shifted. Bairro Alto is no longer a location of higher intensity. The downtown central area axis, called
Baixa-Chiado, maintains the higher intensity. Also, the area along Avenida da Liberdade has increased intensity (above 30–40%), and the
Avenidas Novas area is now above the 20% level. A small spot above 20% appears inside Monsanto park where the only building in the area was renovated. There are also some noticeable artifacts on the peninsula to the Northeast of the city, where there are no cases of renovation.
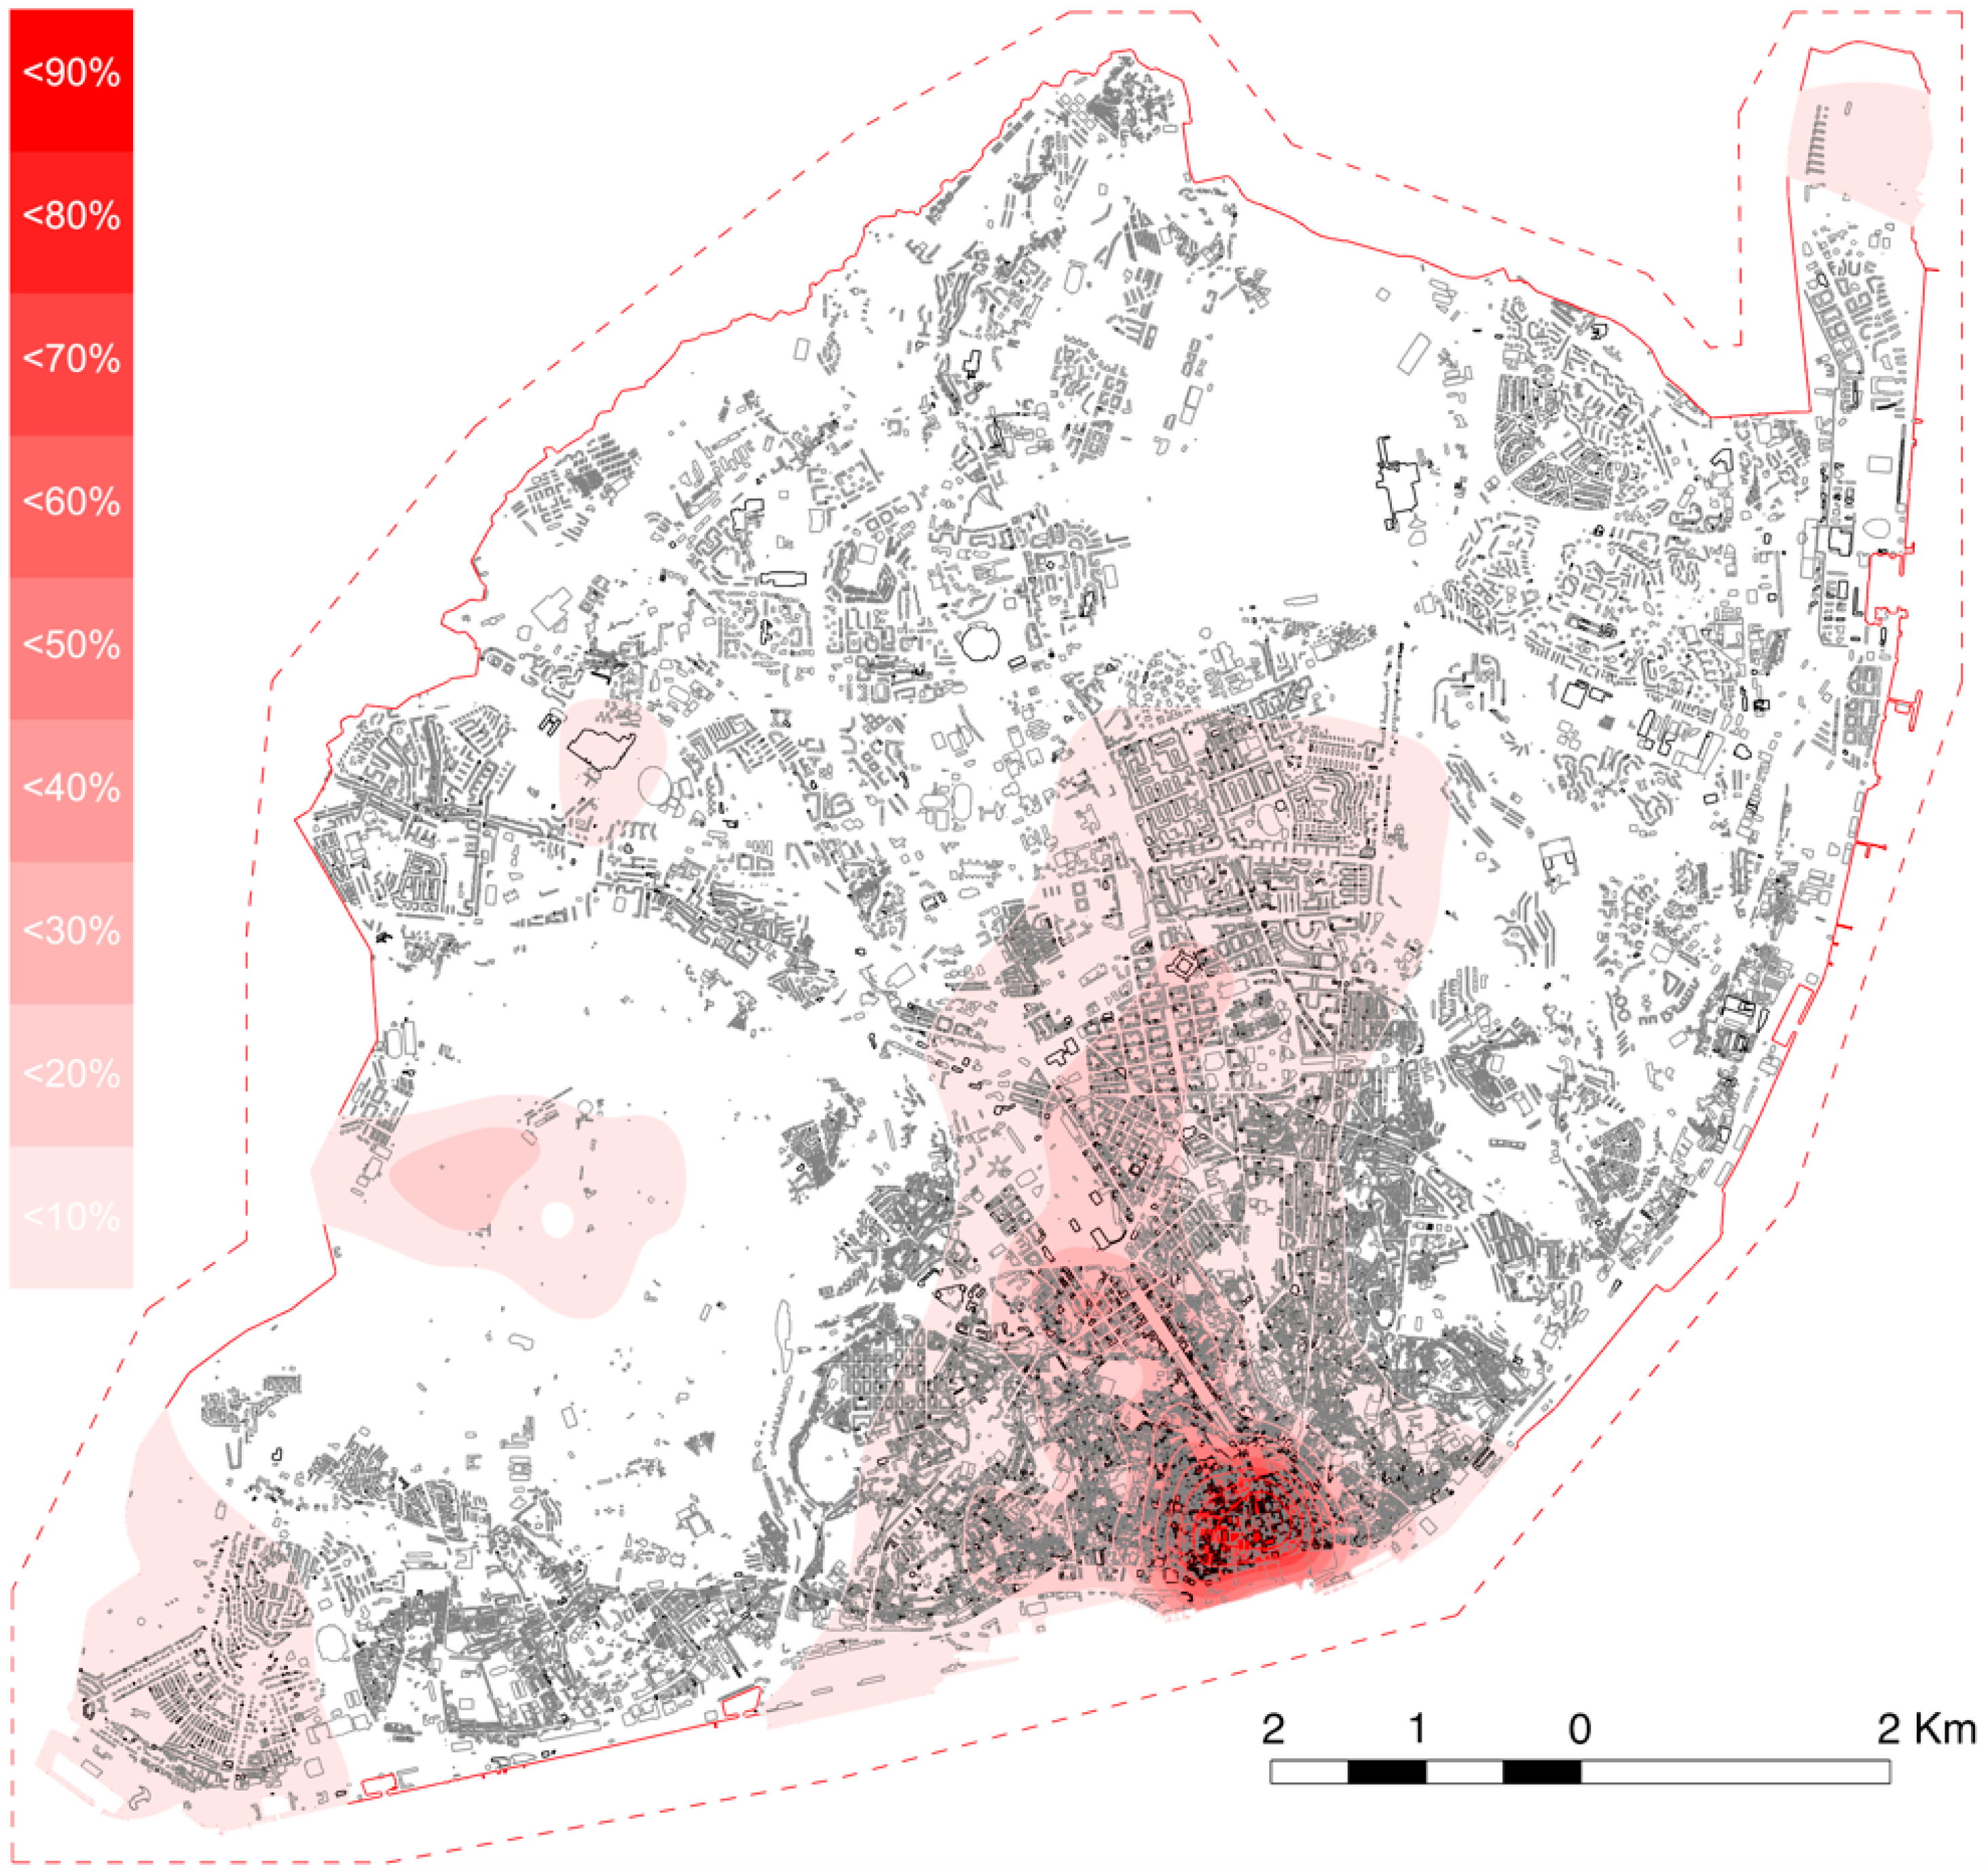
Figure 6 presents the Dual KDE of issued permits for building renovation. There is a strong similarity between issued permits estimates and the permit requests estimates.
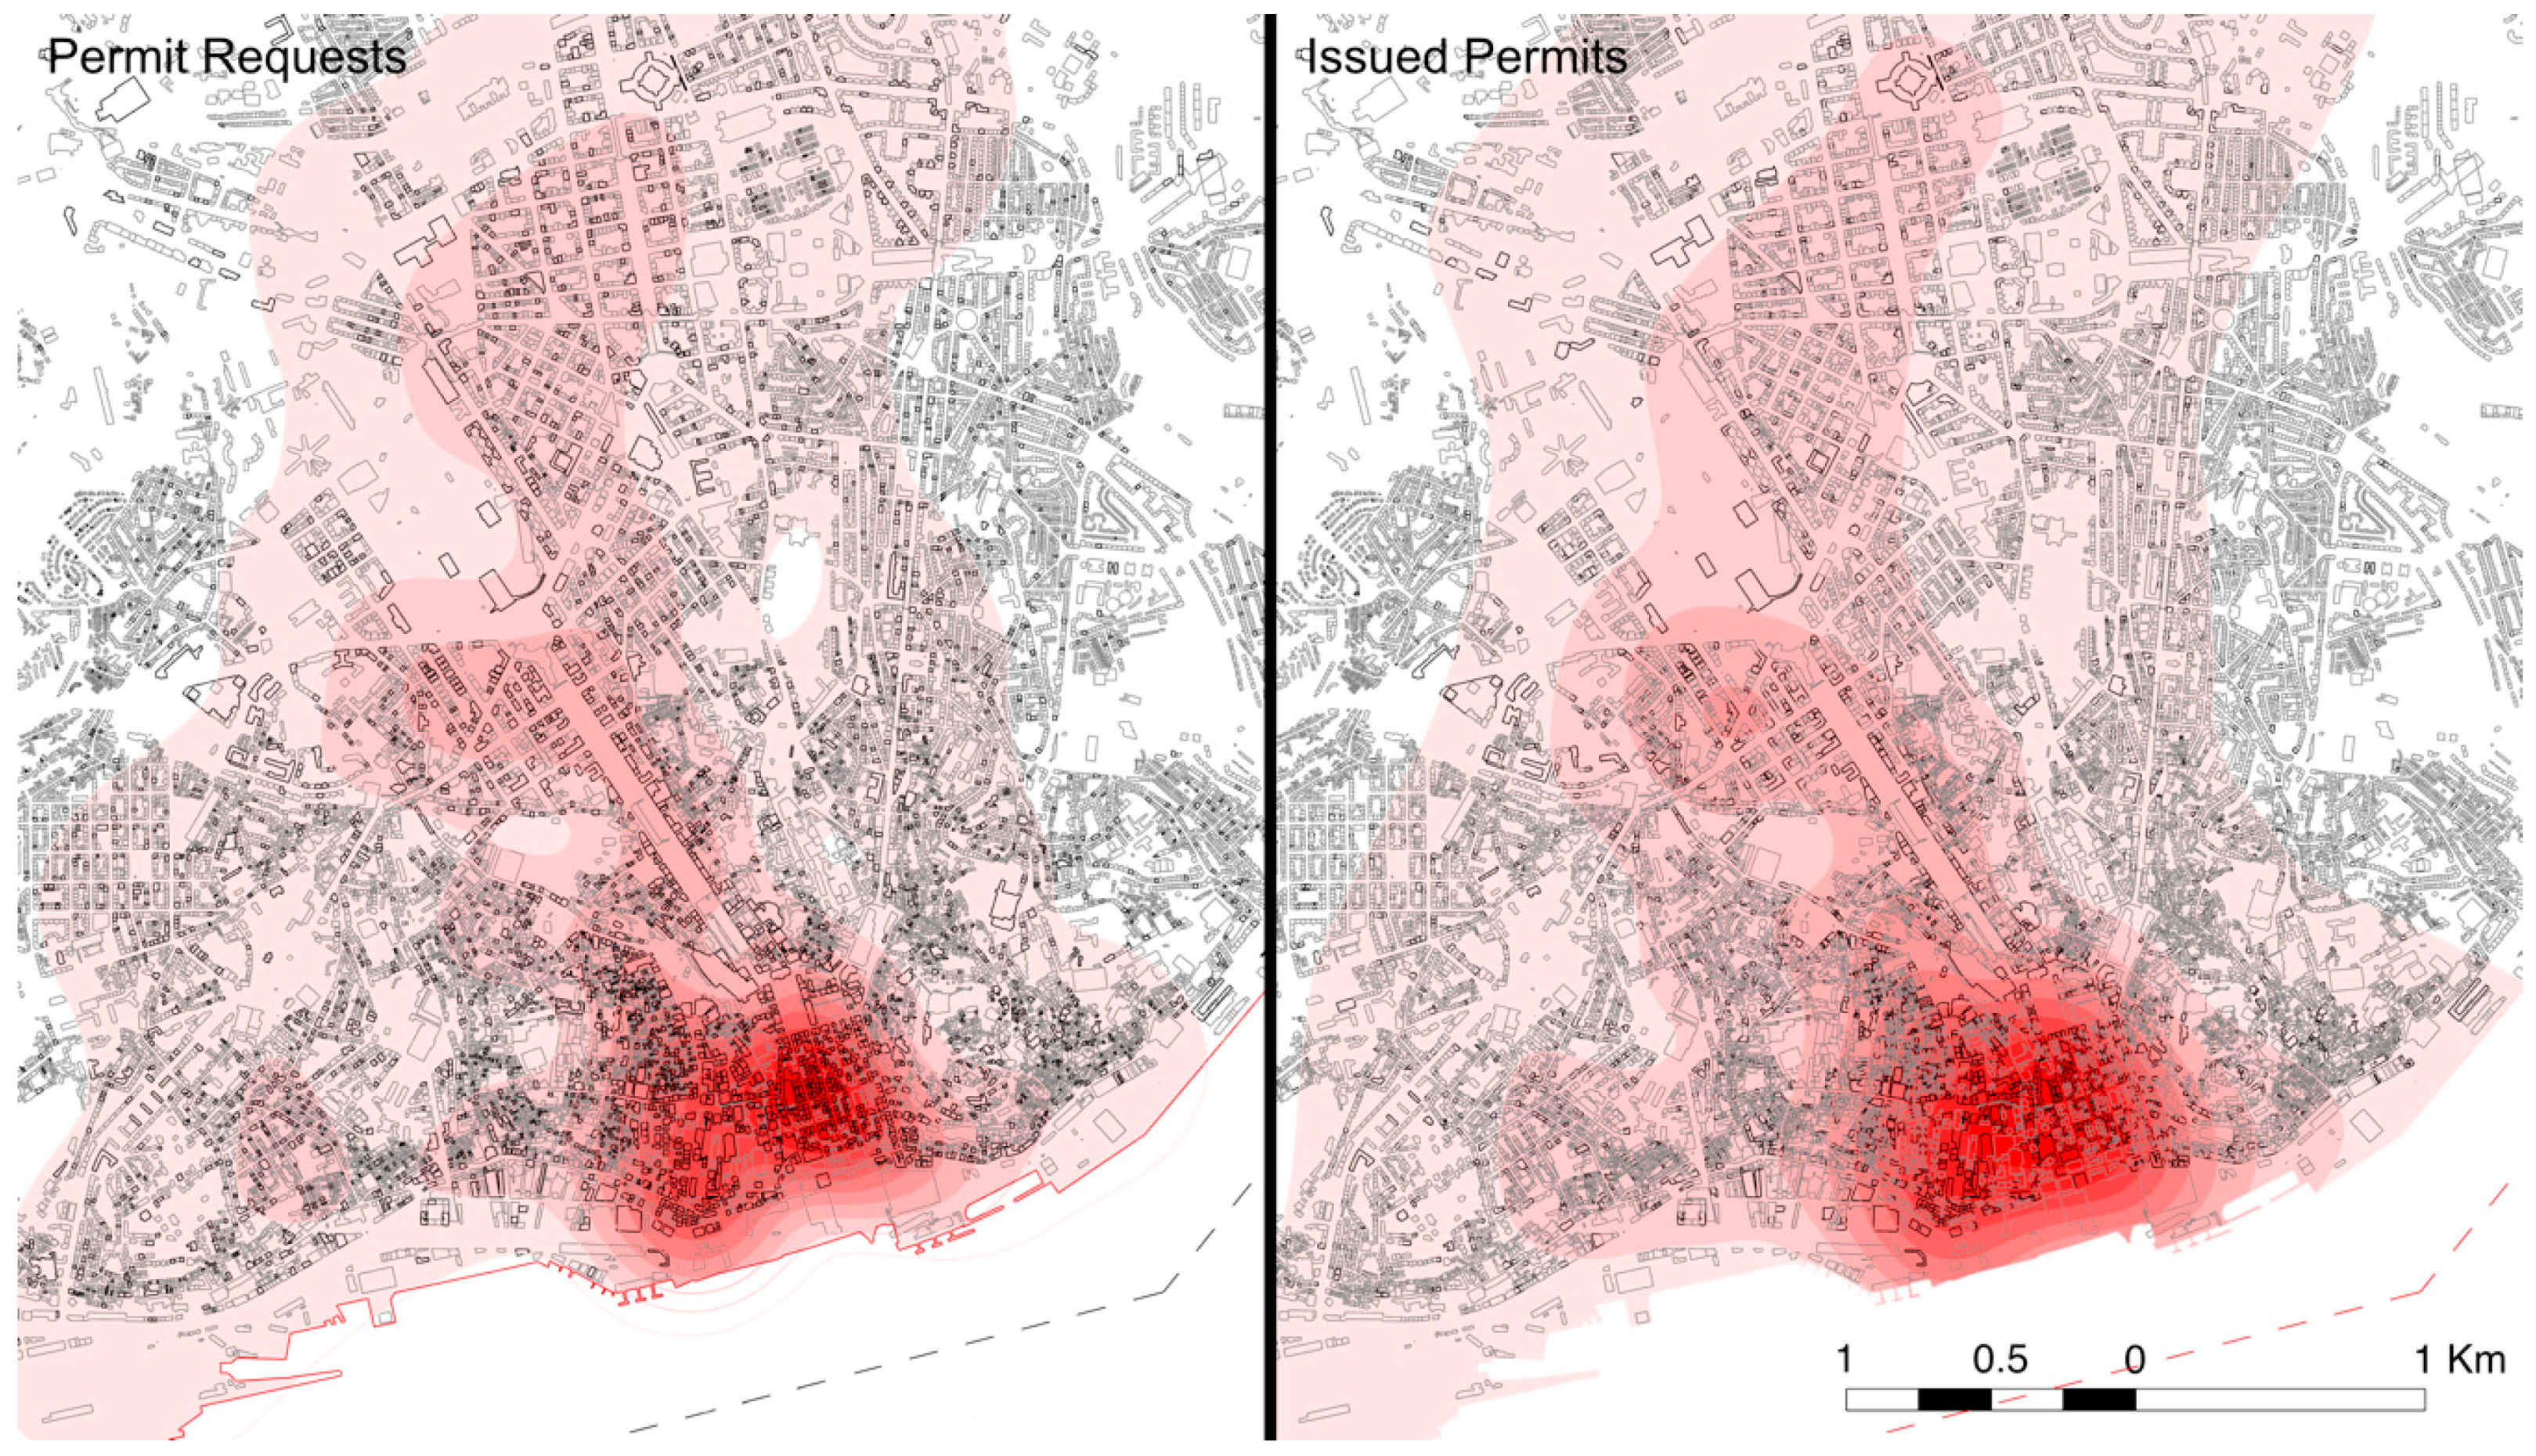
Figure 7 shows a zoom over the higher intensity areas over the city center when comparing the issued permits with the permit requests. There are some differences in the intensities particularly below 50%. There is a small cluster west of the north end of
Avenida da Liberdade that has increased in intensity to over 40%, and most of the areas bellow 30% and 20% seem wider in the issued permits. Yet, the general location of the intensity areas hoovers over the same areas of the city.
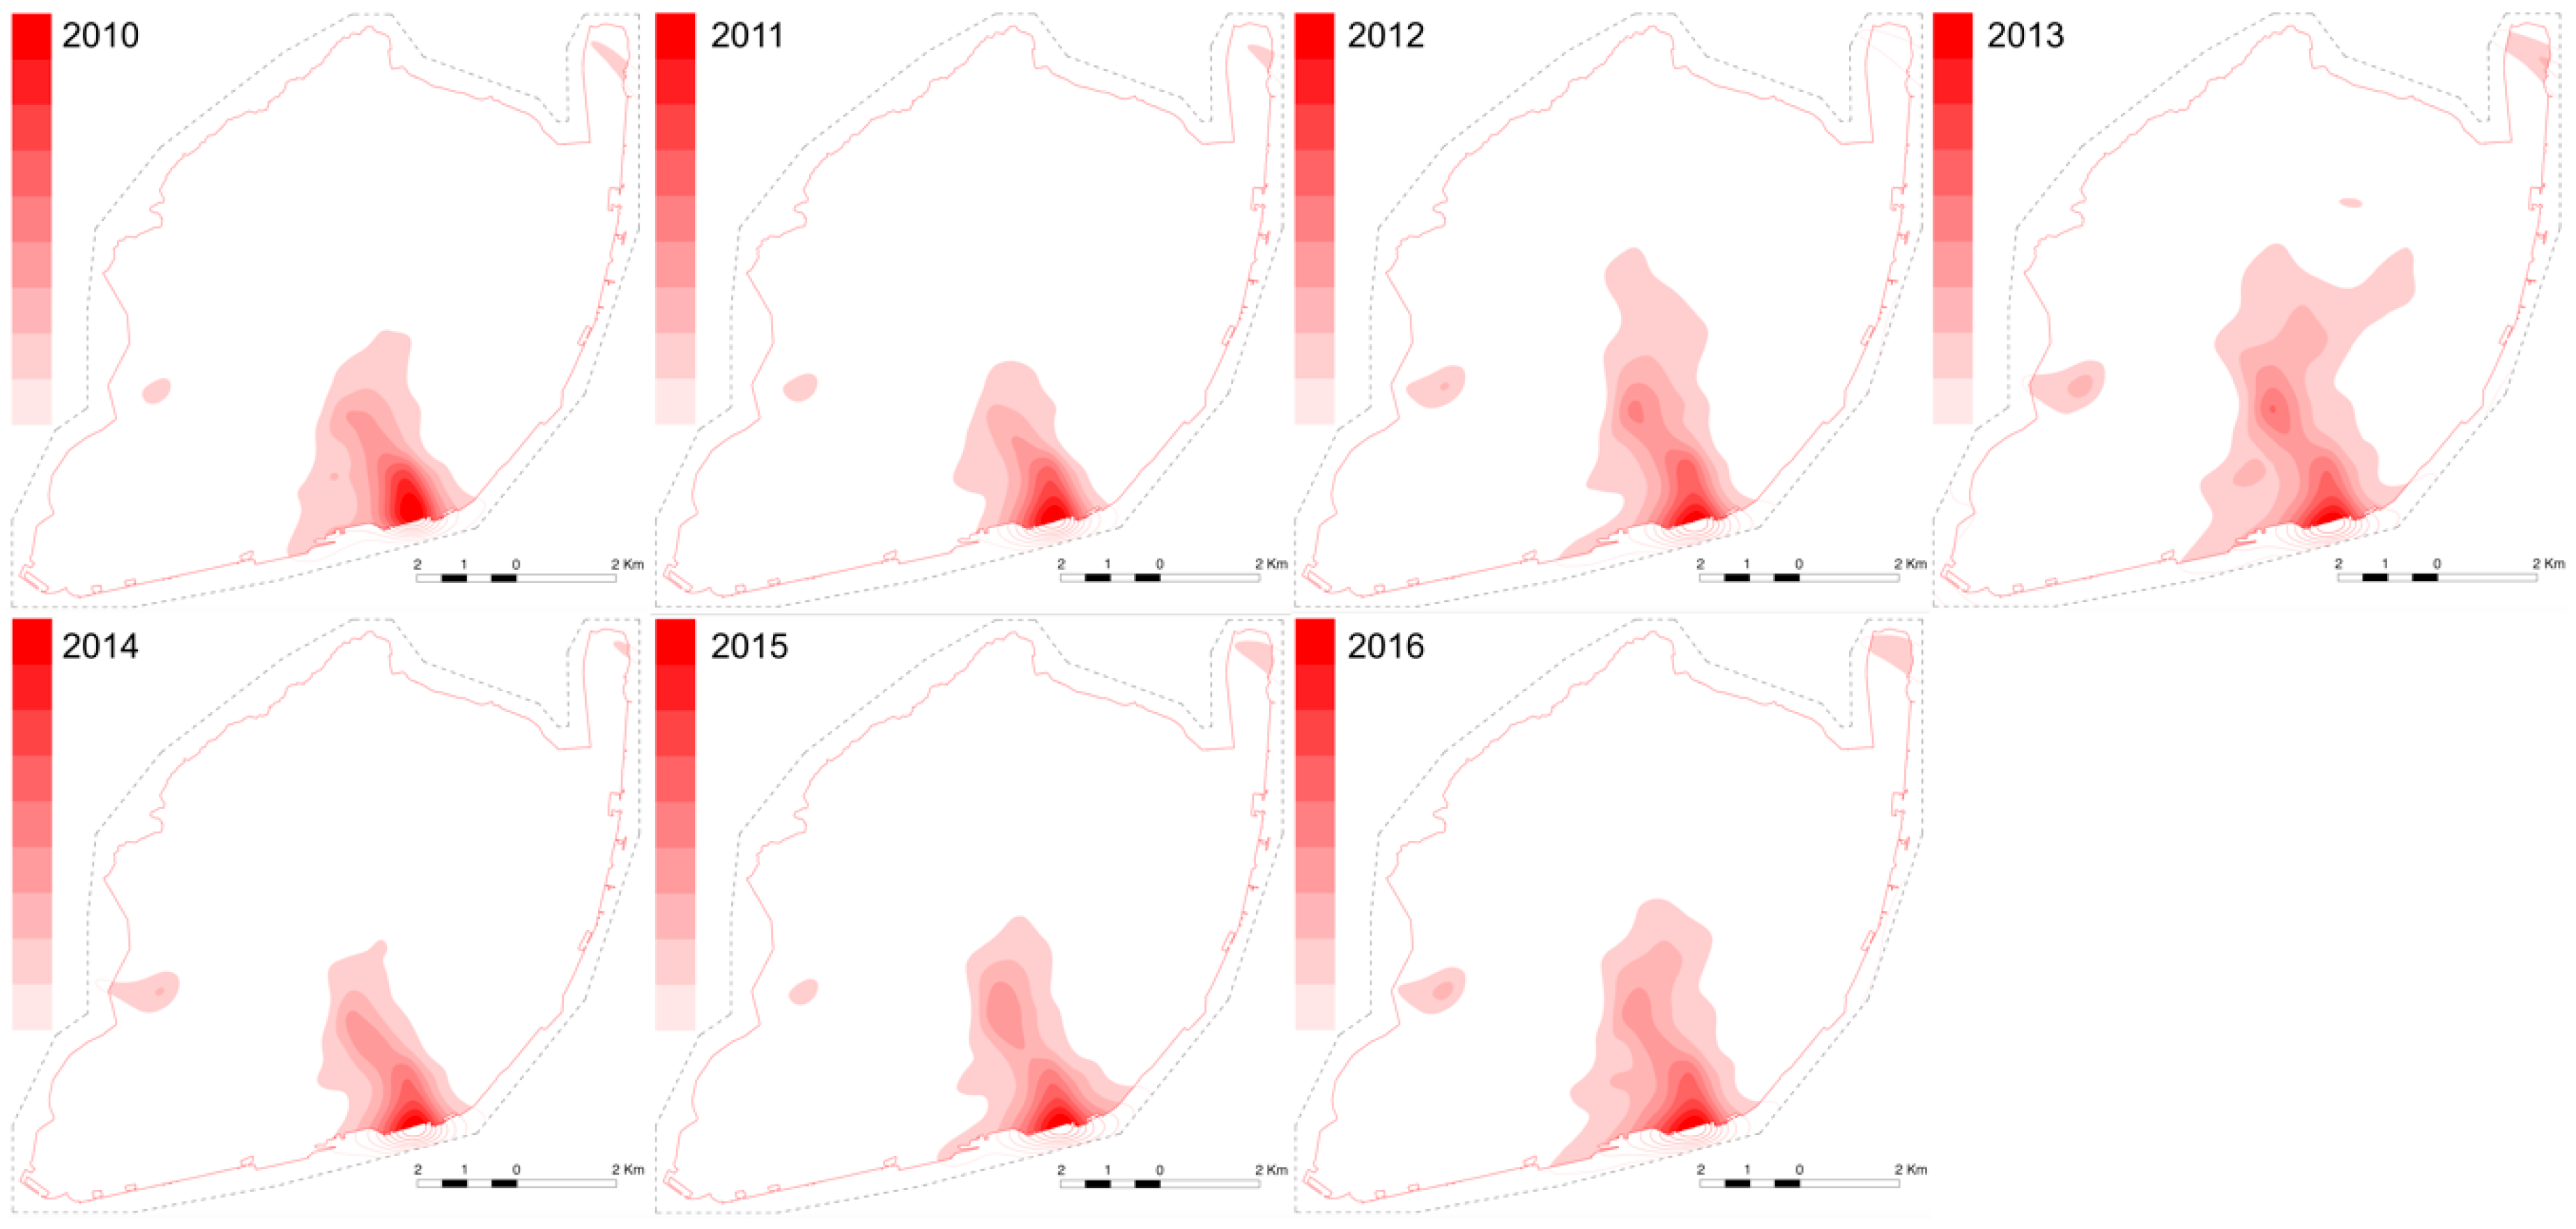
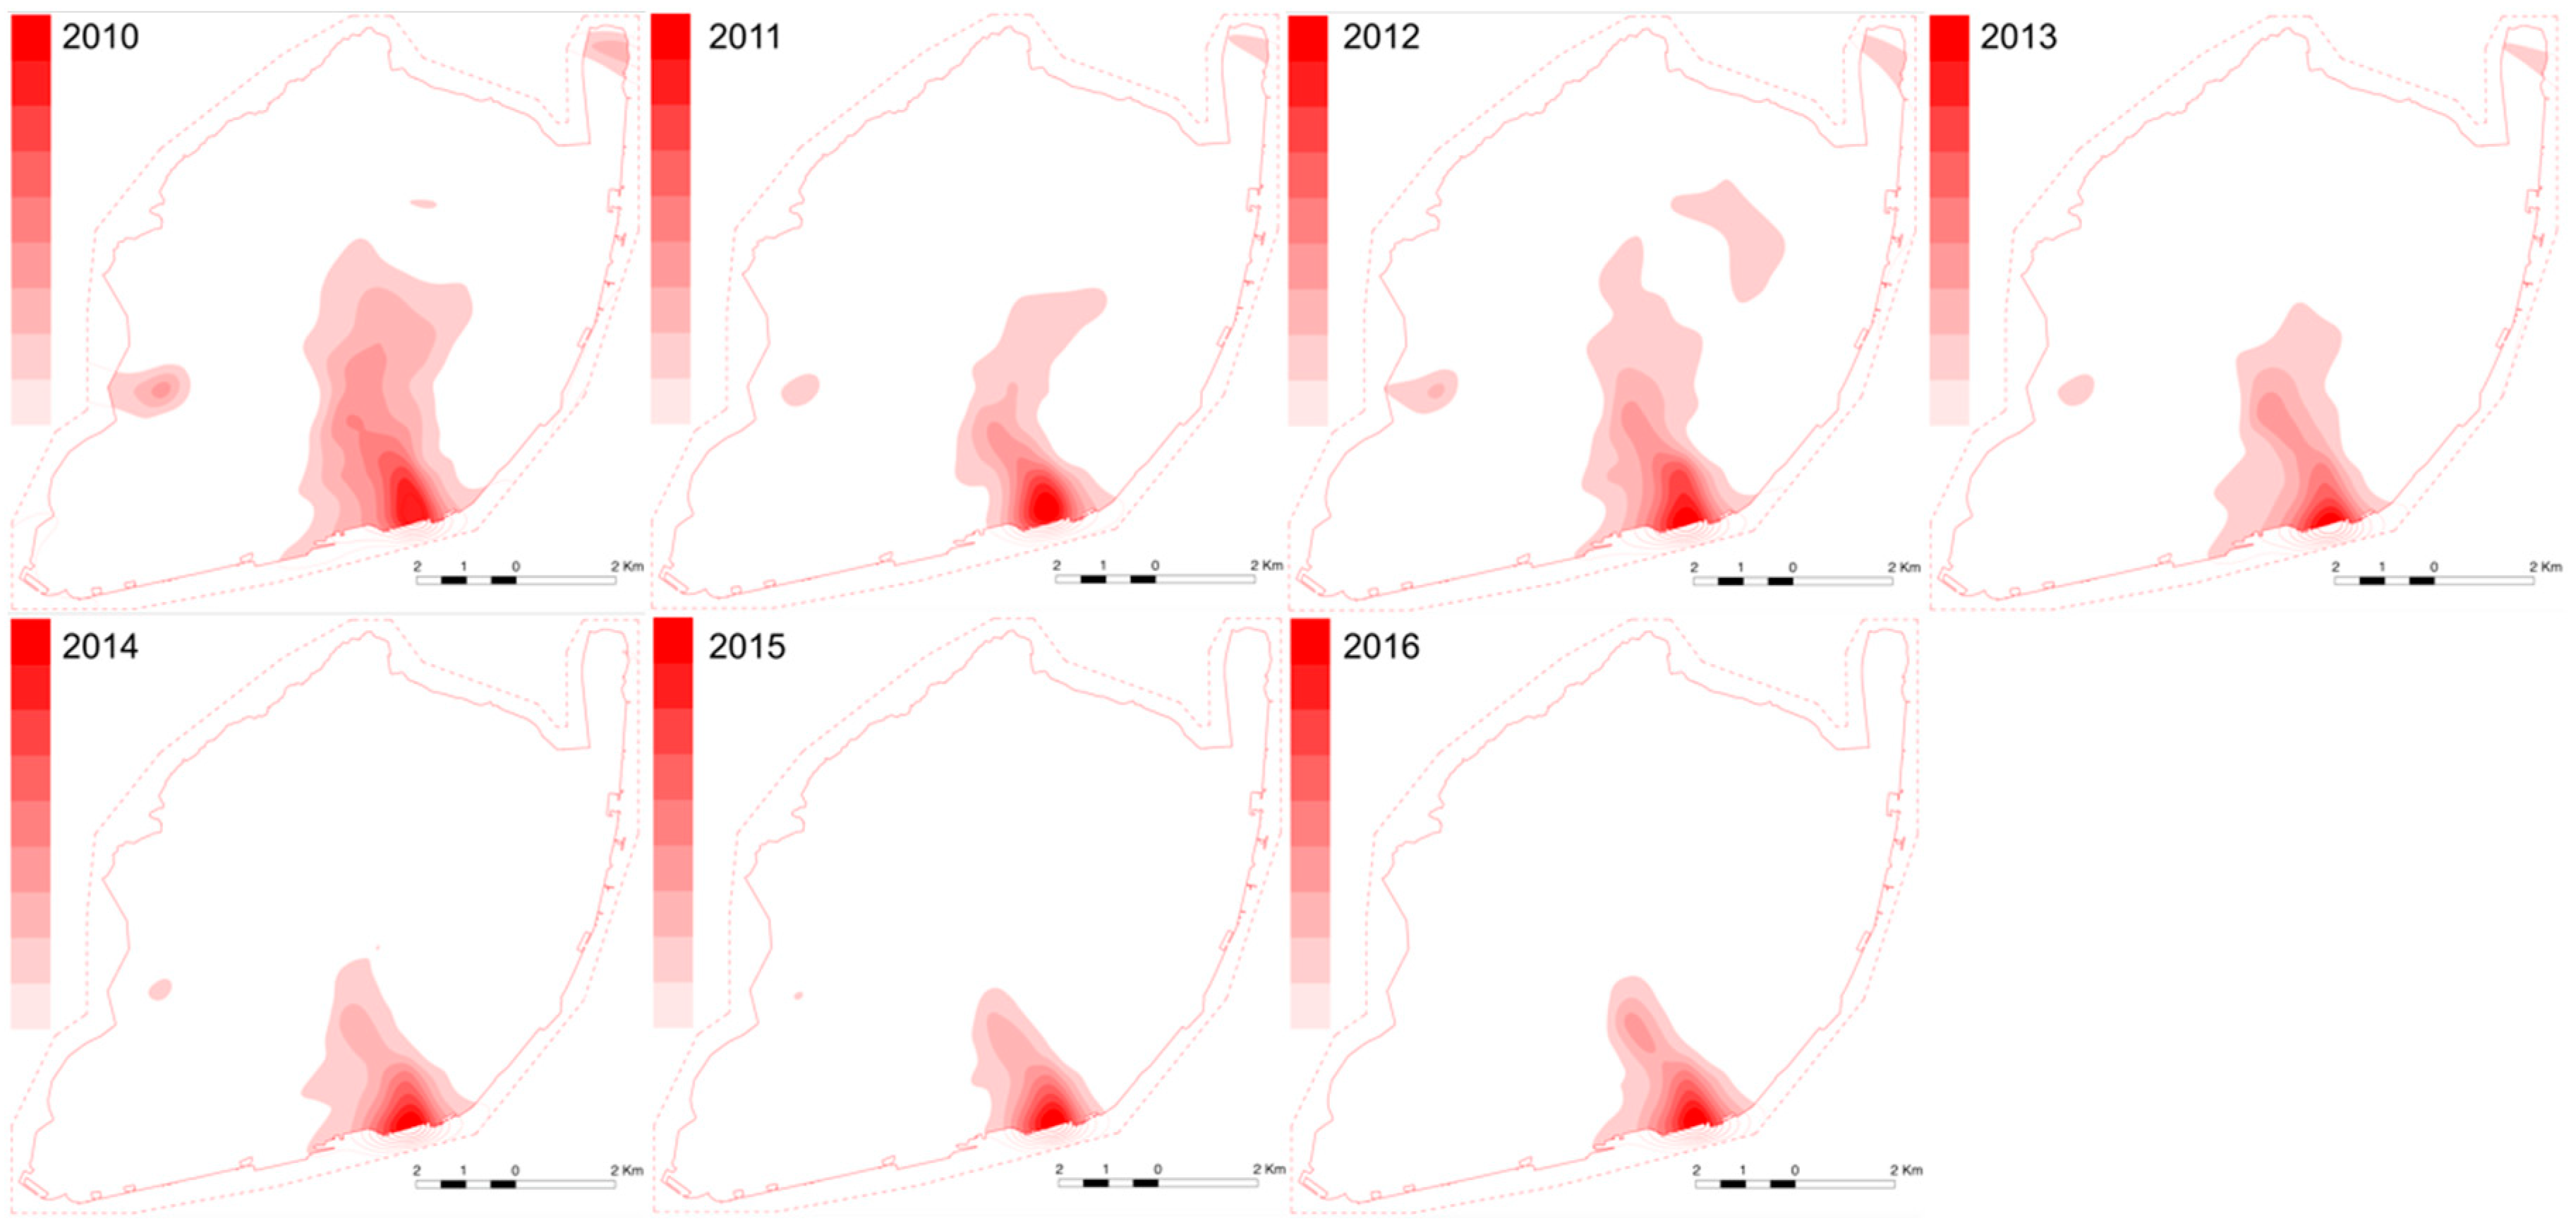
Figure 8 presents the yearly Dual KDE estimations for permit requests. Each year contains all the permits requests that were submitted to the city hall for building renovation. For greater clarity the building polygons where removed from the figures.
Figure 9 represents the intensity of issued building permits and can be compared with
Figure 8. Both sets use the same adaptive KDE estimate of building density and analysis boundaries as the Dual KDE estimates for the 2010–2016 period. Yet, as the yearly sets of events are smaller, a larger window is needed for the pilot estimate. As is observable in the figures, the high intensity areas partly overlap the river to the South. Using a larger boundary does reduce this effect, but it requires an even larger window on the pilot estimate and produces more artifacts over the river below the 20–30% intensity levels.
4. Discussion and Conclusions
The results indicate that building renovation in Lisbon is focused on
Baixa-Chiado area where the intensity of the Dual KDE is higher, spreading with more intensity along
Avenida da Liberdade, as shown in
Figure 5. These results support empirical perception of city dwellers on the areas where renovation is more intense. Furthermore, both the intentions of renovation, which are measured by the permit requests (
Figure 5), and the issued permits (
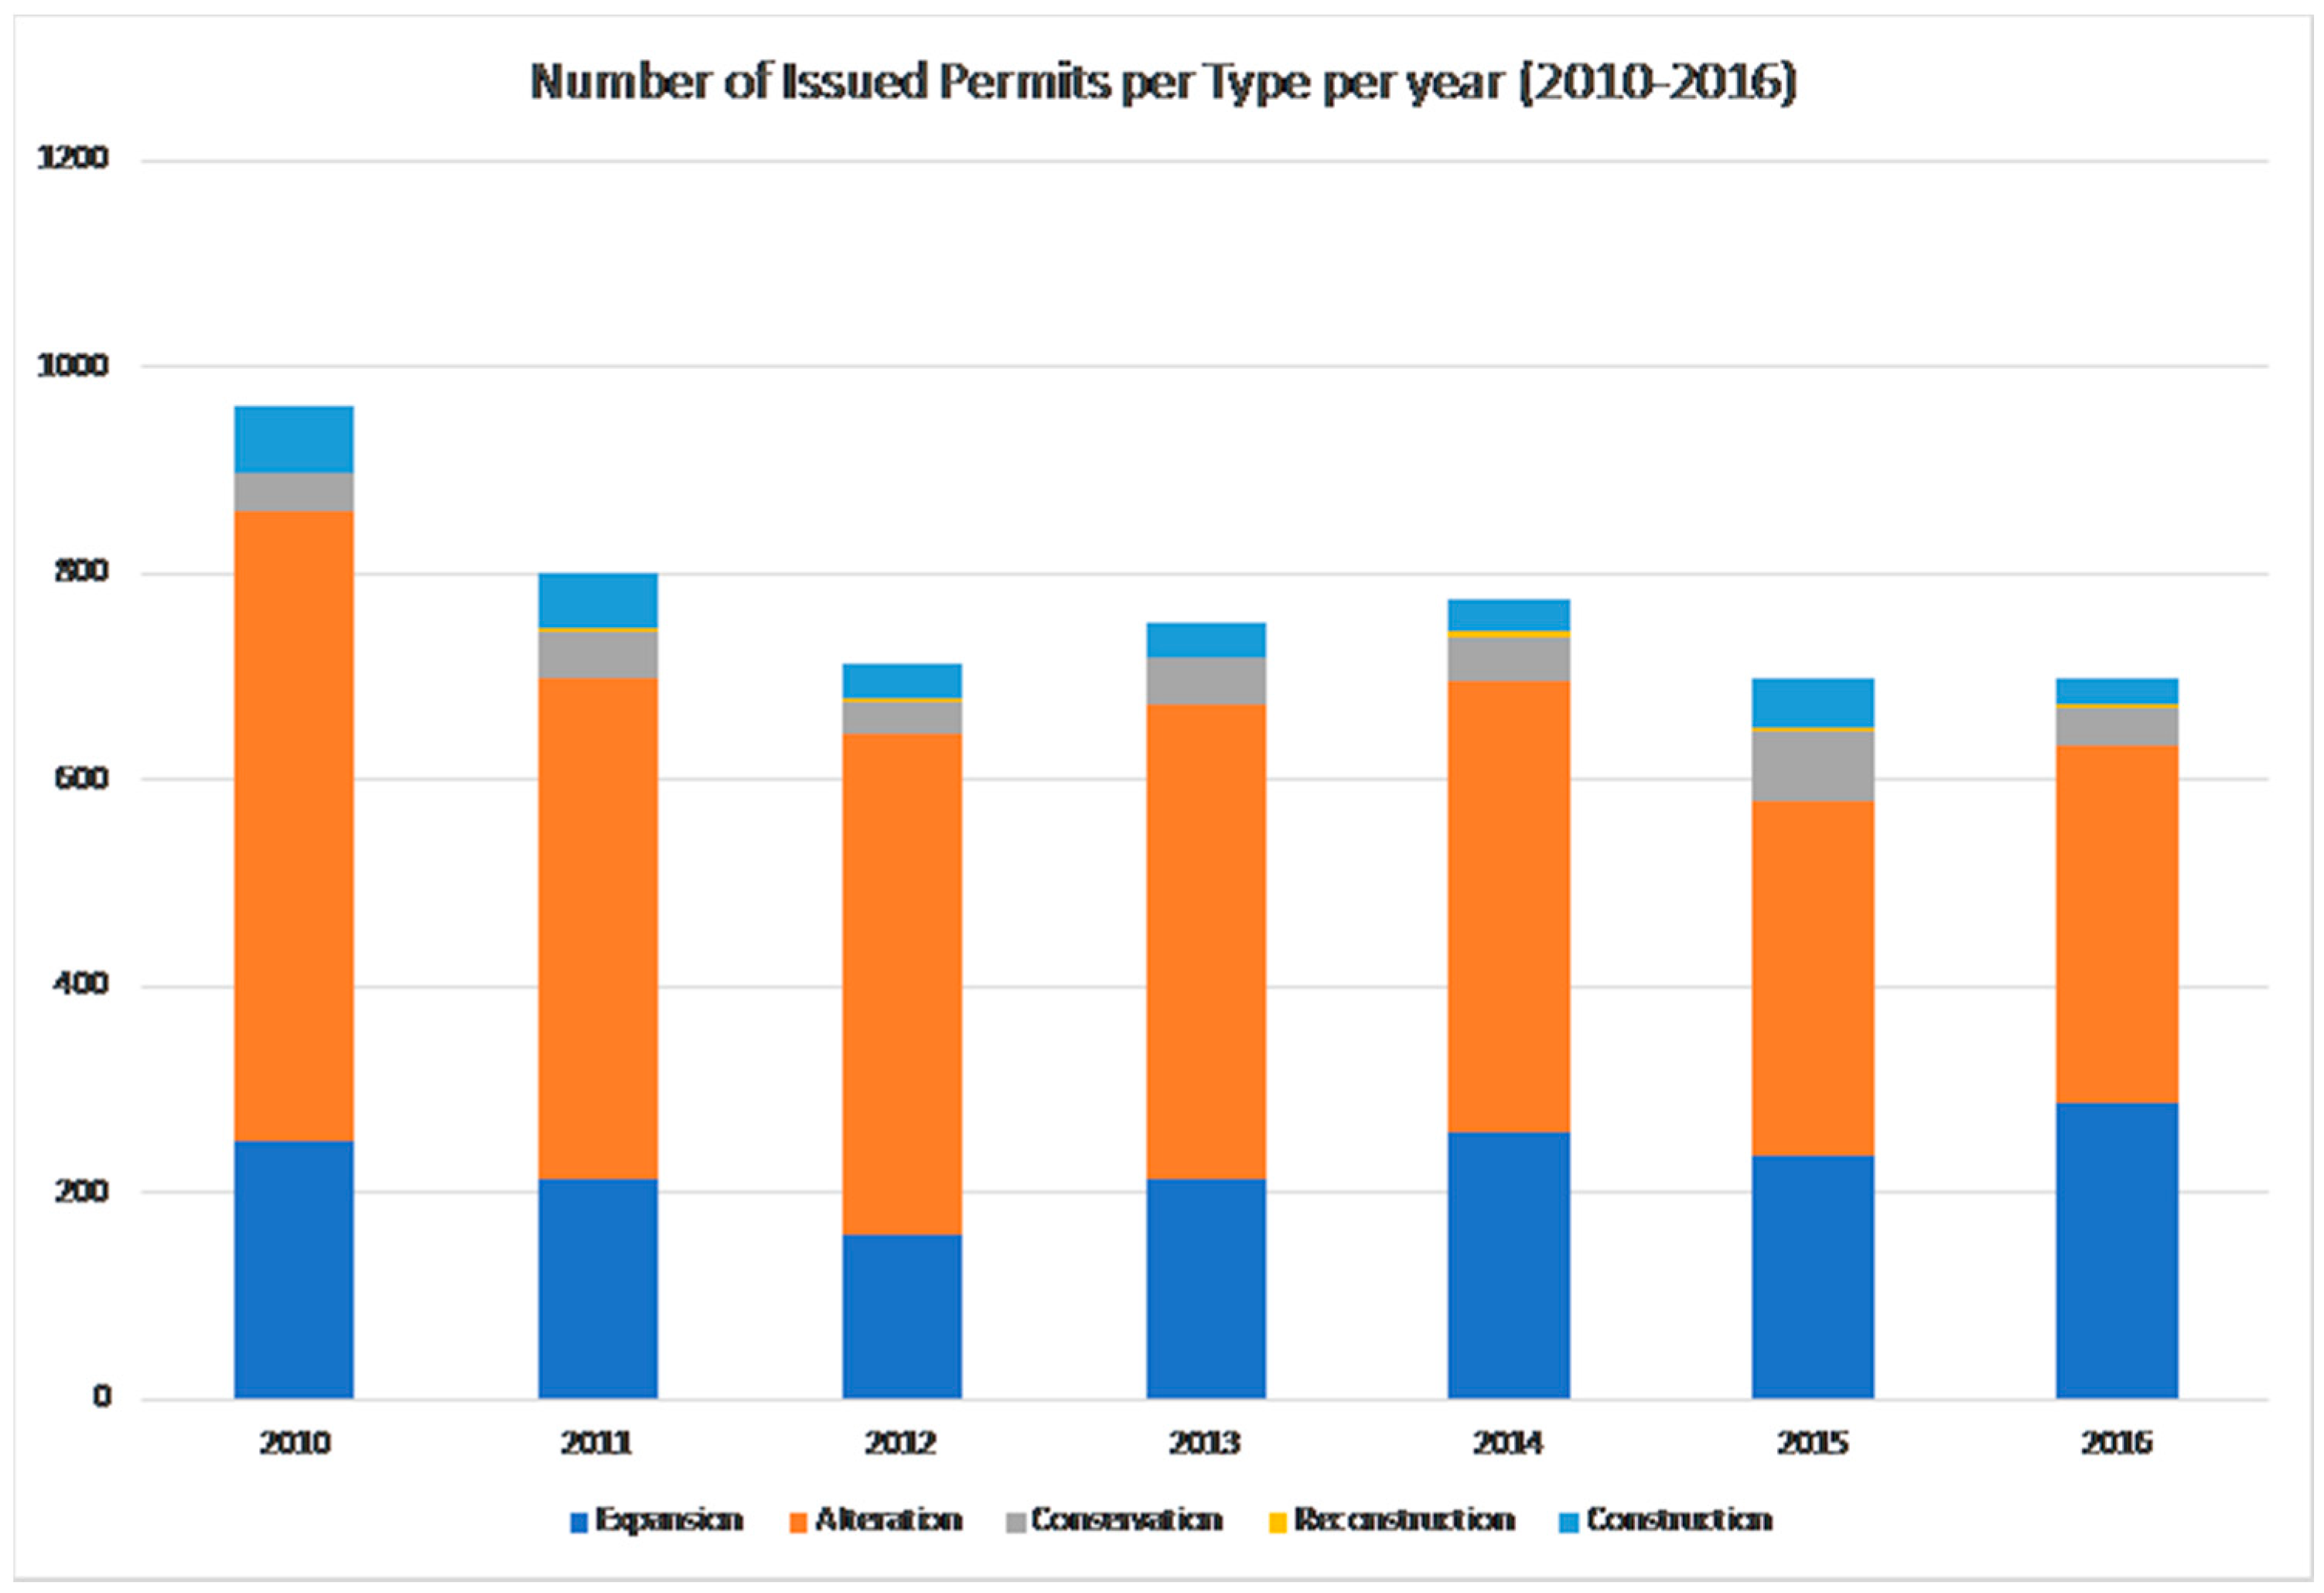
Figure 6), which effectively translate to building activity, roughly align over the same areas of the city in the high intensity levels over the period. This seems to indicate that it would be possible to use the first metric as an estimator of the second. It must be noted that although there is an increasing number of permit requests year-on-year over the studied period, as shown in
Figure 1, the same is not true for issued building permits that show an inverse tendency (
Figure 10). The causes of this divergence are out of the scope of this paper, but the similarity of both intensities in the presence of this divergence demonstrates the robustness of the method. On the other hand, it underlines the importance of combining different methods when analyzing complex urban phenomena, to ensure a more nuanced understanding. The graph in
Figure 10 demonstrates that, contrary to public perception, there is actually a decrease of building renovation year-on-year in the whole city. Also, there is an increase of building expansions and a decrease of alterations, which indicate that building renovation works have increased visibility and impact on the city. Conversely, the yearly KDE of building permits indicate an increasing concentration of these permits in a smaller area. The combination of these insights leads us to conclude that the perception of increasing urban renewal might be an effect of the combination of increased impact and concentration on an area with higher historical and cultural relevance that had fallen into disrepair. Comparing the yearly result for building renovation intentions intensity (
Figure 8) to the next year of issued building permits intensity (
Figure 9) seems to support the hypothesis of using the first metric as an indicator of the second, particularly so if only levels above 40% are considered. Yet, the comparison of the year 2013 of
Figure 8 with the year 2014 of the
Figure 9 does not follow that pattern. Also, the yearly intensities show a greater sensitivity to the boundaries as a result of using less events. Further comparisons are needed with larger periods and with case studies that display shifting of the intensity hotspots to different areas of the city. Similarly, we compared the intensity of one year with the next, yet, basing the time difference between comparisons on statistics of processing times of requests, such as the mode, intuitively seems to be an appropriate way to follow.
Nonetheless, there were several limitations that were detected in this method related with the fact that distances are being measured on a two-dimensional space. Even though an adaptive KDE method was used, it is inevitable that some overflow occurs when there are neighboring low and high-density areas. Also, in this analysis, we noticed that this method is not appropriate for block level definition. Important avenues may have back streets, sometimes less than 100 m away, which have much less intensity of renovation. Since we are using the centroids of building polygons the issue can be aggravated. An alternative would be to use points on the building border. That of course requires a sound method of determining in every instance to which street a building belongs to. In future research we aim to investigate a method of using the main addresses that are registered on the city hall database to retrieve these points. Another way of dealing with this problem is to think of the city as a network of streets, which is, as some researchers have suggested [
23], a more accurate way of modelling the city. There is already some research on using KDE in primal networks to determine centrality [
24,
25].
Another important limitation we detected was that the proposed method only considers the distance between points as measure of density. A solution would be to attribute a weight to each point based on the building area. Yet, in the database, we were provided that there is no information regarding the building area, or the area where renovation effectively occurred, which can be different since there is no horizontal property subdivision. These areas could be estimated for the building multiplying the area of the building polygon by the number of floors, but this can produce gross overestimations, particularly in buildings where the first floor is larger than the remaining ones. Another problem with using building areas to determine the intensity of renovation is that renovation includes a wider range of levels of intervention than building construction. Which compounded with the fact that there is no horizontal property subdivision on the permits database, it can lead to a different type of overestimations.
An important limitation of this database is that, while it includes all of the new construction activity in the city, the same is not true for Renovation. Two reasons concur to this fact. First, renovations of interior layouts, which do not change the building structure or infrastructure, are not required to submit for building permit. This exemption excludes all interior conservation and refurbishment work from the city hall database; Second, the ambiguous nature of this definition provides leeway to an unknown number of renovation work, which would otherwise have to apply for a building permit, to proceed without doing so. Consequently, the city hall building permit database can be considered a biased sample of all building renovation that effectively happens in the city, since it does not include one of its subsets, it is incomplete on the alterations, while it likely includes all reconstructions. Yet, as a working hypothesis, we assume this dataset to be an unbiased sample of the real renovation work. The reasons are that building renovation is deeply influenced by the location and building age. While it is outside the scope of this article to demonstrate these assumptions, tourism and foreign investment are widely identified as the main drivers of the current urban renewal phenomenon. These two drivers coincide in seeking central locations, which is precisely where the buildings are older in our case study. To improve the accuracy of the results, indirect methods of collecting more points could be used to obtain locations of renovation works that do not require building permits, such as the location of scaffolding permits for refurbishments and minor alterations that are exempted from building permit requirements.
In conclusion, this paper presents a method of cross-referencing city hall’s alphanumerical and spatial databases, which are frequently kept apart, and producing a measure of intensity of renovation that can be visualized on a map. We propose two approaches, a GIS and a visual-programming implementation. Furthermore, the same methodology can be applied to different types of information, such as the distribution of specific types of services, offices, or shops.
The Dual KDE strikes a balance between analytic and synthetic representations, without the loss of the underlying spatial information. Furthermore, this method is capable of continuous estimations of the underlying density of a given phenomenon based on finite random samples. Additionally, the described method does not require deep knowledge of statistics to be used. There are sound mathematical methods in the literature to support the choice of kernel and the window width as these depend on the sample that is being analyzed. Yet, it is also possible to arrive at an acceptable window width by simple experimentation and visual feedback. If the purpose is gathering intuition about urban trends, absolute precision is not paramount, and for a designer this is a more natural way. Furthermore, a parametric modelling environment allows for almost real-time experimentation of settings.
Cities are in continuous transformation, speculating on alternatives to determine if there are areas of the city where building renovation is more intense can enrich the patterns of social and urban analysis concerning planning tools and urban projects, providing a useful tool for all of the stakeholders in city. The findings derived from this study would be helpful in supporting public policy-making and urban planning at the city hall level. Using the Dual KDE method on yearly renovation permits; it was possible to demonstrate the increasing intensity of building renovation on Baixa-Chiado and neighboring areas, an insight on the point or shape data that would otherwise be difficult to spot. By providing spatial distribution of the intensity of a phenomenon when considering the form of the city, this metric allows for urban planning and policies to be adapted quicker and in a more precise manner to specific parts of the city. Renovation zoning areas or tax exemptions can be revised to support under renovated areas. Public investment in infra-structure, public spaces or buildings can be directed either to support high intensity areas or to correct imbalances in the city in a more precise manner. While the results of this study are not sufficient to demonstrate that permit requests can be used to predict the intensity of permit issues, this prospect that it might be possible is quite enticing. It would allow for even more lead time for policy and planning changes to city halls.
The availability of datasets and the use of existing tools also provides the opportunity for private investors, architects, or real-estate agents of replicating these analyses in decision support.
The spatial distribution of the building permits provides an important motivation for architects and urban designers to rethink the process of building renovation design. Unlike in a new building, a renovation project acts upon an existing structure that is gradually degrading and this kind of analysis sheds new data to better understand city renovation in a short period of time with everyday design tools and with free open data.


