1. Introduction
A hedonic price model (HPM) is a statistical method to estimate monetary value on a set of characteristics of a good, typically housing, and it is commonly used as a basis in policy making [
1,
2,
3]. Location is a key part of valuation of housing and if we consider the location of a dwelling as the geographical position in relation to its surroundings, accessibility is an obvious and often used way to measure it. Therefore, measures of accessibility are key variables in HPM. However, how measures of accessibility are specified differ amongst models. Inherited in this is a potential of negative impact on the results, first in terms of model robustness and second in terms of theoretical foundation. An example of the first is the impact of aggregation of geographical data, which strongly relates to the specification of accessibility, often referred to as the modifiable areal unit problem (MAUP) [
4]. The second relates to the notion that the specification of accessibility measures should be supported theoretically where the perception of access or distance should be central, as we will discuss in more detail later [
3,
5]. However, choices are often highly influenced by pragmatic reasons, such as lack of data or data, which is not in an appropriate format. Both have an effect on the empirical findings and potentially bias the coefficients in HPM [
6].
The aim of this paper is to examine how accessibility is specified in contemporary HPM studies and analyse the specifications through the lens of the second potential negative impact. To do so, we systematically review the specification of accessibility measures that are used in hedonic price models, which to the extent of our knowledge has not been done before. This paper limits its scope to the actual specifications of accessibility, disregarding field of research, geographical origin, or other plausible denominators for one or the other preference of specification. From the results, we draw conclusions that are based on the distributions of different accessibility specifications and discuss this from the point of view of the theoretical foundation of HPM. More specifically, we look at the specifications in the light of the importance to consider seller’s and buyer’s perception of locational variables, with perception being one of the theoretical underpinnings of HPM [
5,
7].
2. Literature Review
The method of HPM is based on the assumption that dwellings consist of a bundle of characteristics that are individually valued by the consumer [
8]. Typically, the characteristics in a HPM are divided into structural, neighbourhood, environmental, and locational. By treating these characteristics as explanatory variables in a multiple regression with the selling price as a response variable, the implicit price for all characteristics can be estimated. This is a way to value goods that are not traded on a market but for which monetary values are of interest. Structural characteristics are house specific (e.g., number of bathrooms, number of floors) while the other three characteristics (neighbourhood, environment, and location) are often described using measures of accessibility [
9].
Accessibility, however, has no one common definition, and even though for example Hansen [
10] refers to a common definition, “intensity of the possibility of interaction”, he uses his own, “potential of opportunities for interaction”, in the same paper. Furthermore, he describes accessibility in general terms as “a measurement of the spatial distribution of activities about a point, adjusted for the ability and the desire of people or firms to overcome spatial separation”. Another central text in the field by Ingram [
11] defines accessibility as “inherent characteristic (or advantage) of a place with respect to overcoming some form of a spatially operating source of friction (for example, time and/or distance)”.
At a glance, these definitions seem to have some similarities that can be defined as components in the specification of accessibility. Opportunities and activities are referring to the same thing, and, together with the “potential of interaction” from the second definition or “overcoming of spatial separation” from the third; it might refer to the “intensity of the possibility” in the first definition. Geurs and van Wee [
12] argues that there are four inter-related components: a land-use, transport, temporal, and individual component, which together compose different types of accessibility measures.
In a review of accessibility, Bhat et al. [
13] categorizes measures of accessibility into five types: spatial separation, cumulative opportunities, gravity, utility, and time-space, which are all fully described in the next section.
Operationalizing Accessibility Measures and Perception
Scholars, although few, have shown how the variation in the measurement of accessibility can affect the results of empirical studies, for instance, when it comes to spatial equity [
14]. Furthermore, it can be concluded that the specification of measure affects conclusions about the existence of inequity and it is not farfetched to assume the same will apply for housing valuation, indicated by Lee et al. and Fotheringham and Wong [
6,
15]. Another examples is Bach [
16], who, through rigorous computations, concludes that the level of aggregation affects the result of accessibility measures in a profound way.
According to Apparicio et al. [
17], operationalizing and computing geographical accessibility measures depend on the definition of geographical areas in some instances and the method of aggregation, in addition to the three aspects that we are focusing on.
A very important note on the hedonic price model methodology, which was mentioned in the introduction, is that the environmental characteristics, in our case defined as accessibility measures, has to be perceived by the consumers in order to affect the property prices [
5]. As a practical example, Palmquist [
7] suggests that, even though pollution frequently has been associated with decreases in house prices in hedonic models, it is perhaps only confounding with other characteristic that actually can be perceived. Instead, the negative effect, since consumers mostly cannot perceive pollution, might be noise from the same source as the pollution, e.g., a highway or industry. However, Rosen [
8] states that the variables should be objectively measured, even though consumers might subjectively value them differently. This suggests that the environmental characteristics should be objectively measured but correspond to consumer perception and that we should look at the environmental characteristics as either perceived or scientifically measured, and that the scientifically measured characteristics should correspond to peoples’ perceptions. On this topic, Baranzini et al. [
5] investigates the difference between perceived and scientifically measured noise and concludes that the scientifically measured corresponds well with the perceived. Similar studies with similar results regarding water quality has been investigated by Michael et al. and Poor et al. [
18,
19].
Based on the same logic but closer to the scope of this paper, Alexander [
20] proposes in a review paper concerning density that measured density should be distinguished from notions such as physical and perceived density. Measured density would then be the amount of buildings per square meter, while physical density includes, following Alexander, design aspects (e.g., character of buildings and lighting levels), and issues of land use (e.g., presence of shops, pubs). Perceived density also incorporates individual cognitive and socio-cultural factors [
21]. When distance to amenities is considered, the Euclidean distance is perhaps the most objective and it would be described, according to Alexander [
20], as measured distance. The shortest path measured through the street network includes some design aspects, resulting in what Alexander calls physical distance [
20]. This physical distance can be experienced as very long for someone never walking and not long at all for someone who is used to walking long distances on a daily basis. By including such individual backgrounds, we arrive at what Alexander describes as perceived distance that only can be measured with interviews or surveys [
20]. One can describe the distance, or more generally denoted as ability or desire by Hansen [
10], as the impedance; the resistance to overcome access, may it be by distance, cognitive resistance, or time.
The impedance, which the operationalizing and computing of geographical accessibility measures is dependent on, according to Apparicio et al. [
17]. They also suggest that the definition of areas and the method of aggregation have the same dependency, and consequently are highly sensitive to the modifiable areal unit problem (MAUP). There are two issues of concern that are related to MAUP: the scale effect and the zoning effect [
22]. The scale effect is attributed to variation in numerical results, owing strictly to the number of areal units that is used in the analysis of a given area (ibid). The zoning effect is attributed to changes in numerical results owing strictly to the manner in which the areas are defined, or in other words, how the area boundary is drawn (ibid). When it comes to accessibility, the MAUP highly depends on the specification of accessibility measure. When, for instance, the accessibility to amenities is measured within a census tract, the result will depend on the demarcation of that census and the MAUP problem is considerable. The larger the area of aggregation and the greater the diversity in the aggregated parts, the more variation is lost in the calculation, and the more abstract, and the further from a perceived reality, the result is [
23]. The same reasoning is valid when comparing the Euclidean distance versus Network distance, measured as distance through the real street network. When Network distance to the nearest school is considered, the MAUP problem is far less problematic than when Euclidean distance is used.
3. Materials and Methods
To study which accessibility specifications are used in hedonic price models, a systematic review of previous studies are conducted. The review format was chosen to be able to draw general conclusions from a systematically selected sample of studies in the field. The empirical data for this paper was the results and methods from studies that were published in scientific journals and gathered through the systematic literature search. It is a different approach than a meta-study, which combines the data derived from the included studies, often to see whether there is consistency in the results.
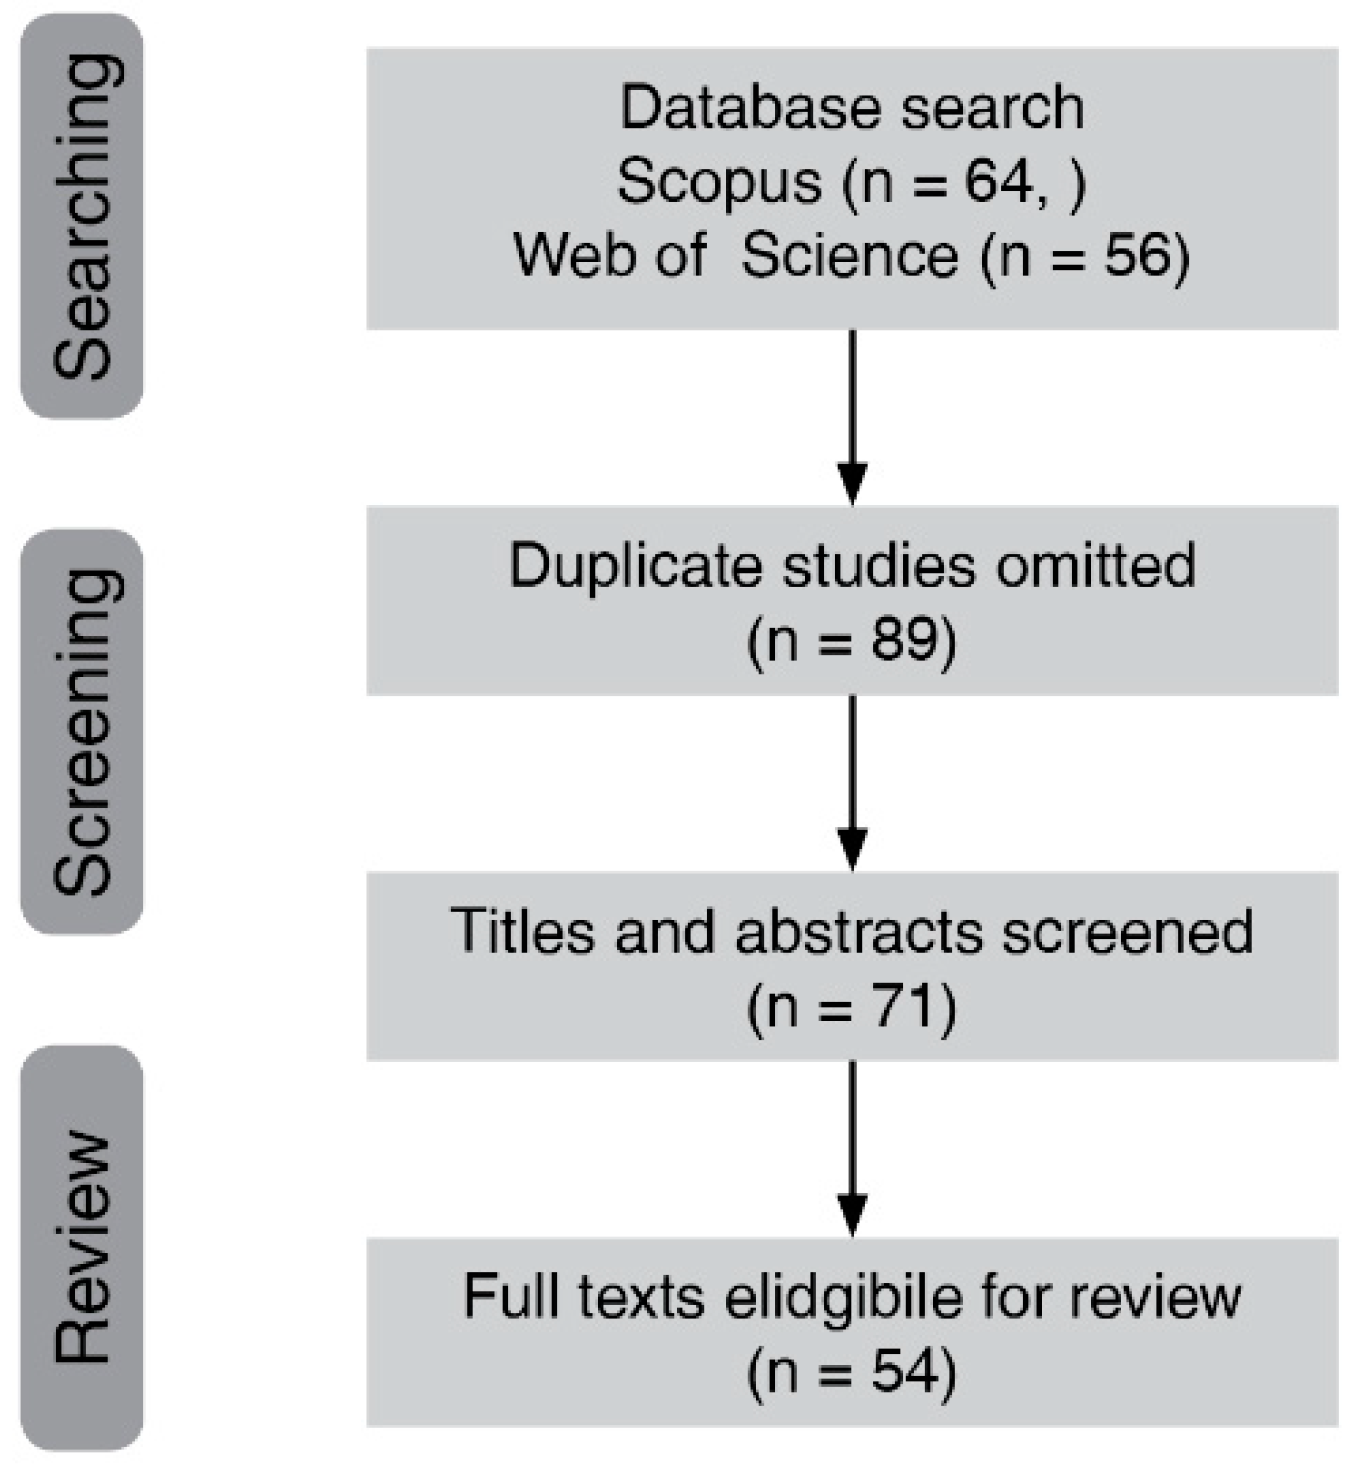
This study consists of three steps to retrieve the results before drawing conclusions; search for articles according to an a priori search strategy, filter out obviously irrelevant ones, and review the filtered sample following a pre-defined method (
Figure 1). The steps will be explained in detail in the following sections.
3.1. Searching
In order to get a relevant and consistent sample of articles, a set of search criteria was decided upon, as well as where to search for the articles. The Web of Science database and the Scopus database have been systematically searched for peer-reviewed journal articles. The choice to limit the search to these two databases was based on our own experiences and experts in the domain. It was also an effective way to limit our search to peer-review articles. Apart from controlling for quality, there is also a higher possibility that peer-reviewed articles have a more thorough description of the methodology, which is central to our research question. However, it means that we are leaving less formal articles out, which is indeed vast on this subject, for example [
24,
25,
26]. Apart from these criteria, we limited the sample of articles to ones published after 2000 (until mid 2016) to ensure that the choice for a method is not computationally restricted. Some of the accessibility measures demand more computation and larger datasets which we assume should not be the case since the year 2000. Importantly, we wanted to understand the current state of the art research in the use of accessibility indicators in hedonic price studies.
As search terms, three commonly used notations of hedonic studies were used: hedonic model, hedonic price model and hedonic regression. Furthermore, property and housing as search phrases narrowed the sample down to studies that handled housing prices. To further limit the search result, five additional criteria were added: accessibility, centrality, density, walkability, and diversity. The search strings were as follows: “Hedonic model” OR “Hedonic price model” OR “Hedonic regression” AND Property OR Housing AND accessibility OR centrality OR density OR diversity OR walkability. Our search criteria are inclusive, meaning that articles containing either accessibility or walkability or centrality or diversity are all included. This means that we will not miss any article that has accessibility notwithstanding the article has walkability or not. The search was made on June 22, 2016 through respective databases. These searches gave a list of 120 articles in total. In all, we found 64 articles in Scopus database and 56 in Web of Science database.
3.2. Screening and Filtering
Screening of the article’s titles and abstracts was systematically conducted by following a list of exclusion criteria that was set up in advance. The next step was to screen the remaining full texts according to the same criteria. After the search was completed, duplicates were removed, after which 54 articles remained (see
Figure 1). Due to the large volume of literature where accessibility was used in regional science, the following exclusion criteria were included.
We excluded all articles that did not use the hedonic price methodology.
We excluded all articles that did not use residential sale price as its dependent variable. As a result, we excluded all articles that used non-residential sales price. The reason being that these other uses would value accessibility differently with a different set of methods.
We similarly excluded all articles that looked at inter-metropolitan hedonic price researches. Different sets of accessibility variables are used when we are comparing which city to live rather than which parts of the city to live in.
We also excluded meta-studies. The reason is that meta-studies can have different search criteria and search periods, which might result in mismatches between the articles we found and the articles used.
We did not include studies that used land use transportation model (Luti). The reason being that the output of accessibility measures hold potential for a particular origin rather than the actual flows between a pair of origin and destination, as in a Luti model. However, we do note that the two are highly related.
We also excluded studies pertaining to housing submarkets. These sets of literature had become a sub-domain within the housing literature and they would require a separate review to understand how accessibility influences the definition of the housing submarket.
In general, exclusion criteria were used to better understand the specific use of accessibility in hedonic price models. These exclusion criteria should be relaxed in future studies to have a more comprehensive understanding of how accessibility is used in regional science.
3.3. Reviewing
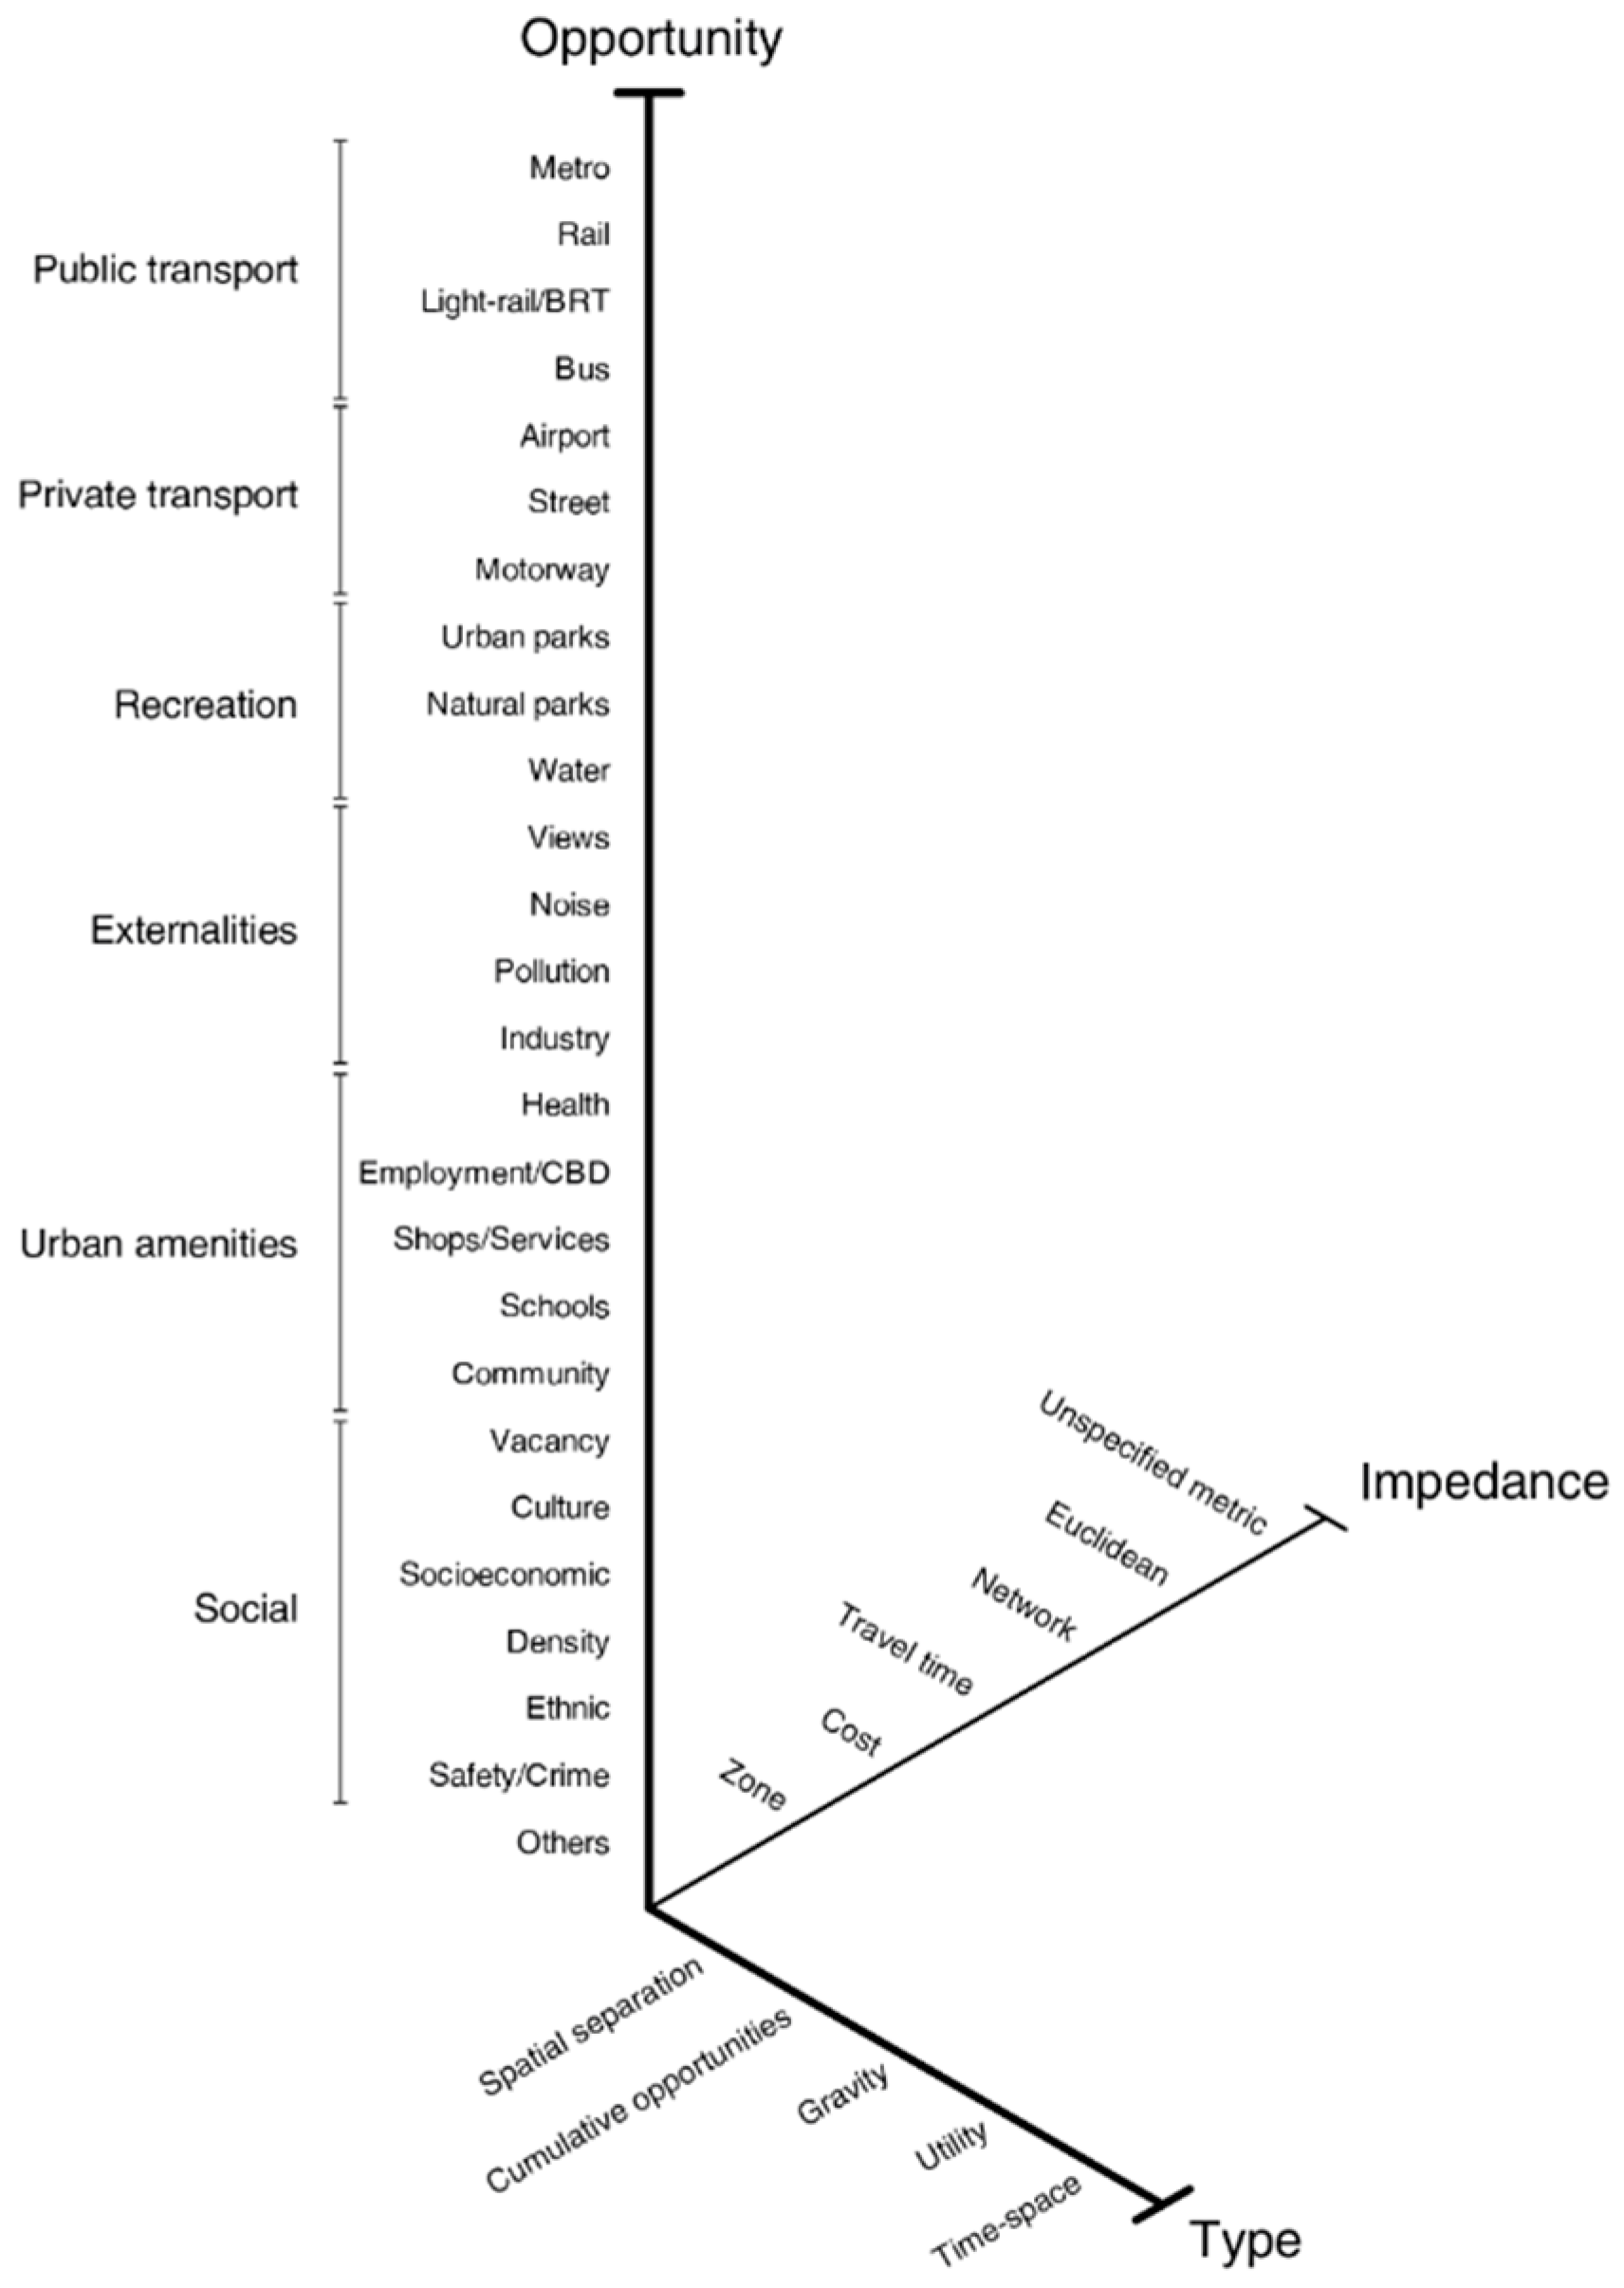
The strategy for review is to read the full texts and to note the specification of all accessibility variables from the samples in a spreadsheet. The notation follows a categorization derived from the accessibility literature, which focuses on three fundamental aspects: type, opportunity, and impedance. As was described in the introduction, accessibility has no common definition, but some definitions that are more commonly used can be found in [
10,
11]. There are, however, some basic components in all measures of accessibility, which builds to our investigation: opportunities and impedance. These two components together with types, as defined by [
13], are to be investigated and illustrated in
Figure 2. In addition, we also noted whether or not the measure was specified as a dummy variable and the geographical location of the study, see
Supplementary Material.
3.3.1. Opportunities and Impedance
The notation of opportunities, followed the simple principle that if one opportunity appeared more than one time in the sample, it was noted as its name and if not, it was noted as “other”. There are examples in our list of variables that include more than one opportunity, for example, green factor, which includes both urban and natural parks. In those cases, a notation was made for every opportunity included.
We have divided the second component, impedance, into six different categories; unspecified metric distance, Euclidean distance, network distance, travel time, cost, and zone. Euclidean distance is the shortest distance in space. In this study, we do not differentiate between measures that consider the curvature of the earth and those that do not. Typically, the difference will not matter, as most study areas are too geographically limited. The network distance refers to metric distance through a network, typically road center line networks, of any kind, and the unspecified metric distance category is when the measure uses metric distance but it does not specify whether it is using network distance or Euclidean distance. The next category of impedance, travel time, takes both time and distance into consideration. This can be done in various ways, from averaging the speed and multiplying it by distance to penalizing waiting time. Similarly, the cost impedance can take different shapes, from adding fuel prices to capturing the mode choice according to different socioeconomic groups or geographical locations. The zone category is included, as it is a common way to specify accessibility, not least as a consequence of data availability.
3.3.2. Type
Although not explicitly using these components, Bhat et al. [
13] defined five types of accessibility measures that are based on different combinations of specification of components. This includes spatial separation, cumulative opportunities, gravitational potential accessibility, time-space/individual-based accessibility, and utility-based measures. There are multiple ways to specify each of these measures. This section illustrates the most common specification for each of these accessibility measures in a hedonic price model.
The most common and basic of the accessibility types are spatial separation, which only uses impedance (typically distance, cost, or travel time) in measuring accessibility (Equation (1)). One example that is commonly used in hedonic price studies is the distance to Central Business District (CBD) measure. Distance to CBD simply measures the shortest (min) distance between the origin and the CBD:
where A
i is the measure of accessibility and c
ij is the distance or cost of travel between i and j.
The second is cumulative opportunity measures also known as the contour measure or isochrone measure (Equation (2)). It measures the sum of opportunities that can be reached up to a particular time, distance, or cost. For example, one can measure for a property how many shops are within 800 m walking distance. The measure has the following form:
where A
i is the measure of accessibility in location i to all opportunities D
j and r is the threshold radius for which the number of opportunities are summed.
The third is gravitational potential [
10,
27], which measure accessibility positively proportional to the attraction size and inversely proportional to the impedance between the location and attraction (Equation (3)). Gravitational potential can be thought of as a more comprehensive accessibility measure that encompasses both spatial separation and cumulative opportunities. The measure has the following form assuming a negative exponential cost function:
where A
i is the measure of accessibility in zone i to all opportunities D in zone j, c
ij is the cost of travel between i and j, and beta is the cost sensitivity parameter. The impedance function can take a different functional form.
The fourth is the time-space measures also known as the individual-based accessibility motivated by the time-space geography of Hägerstrand [
28] (Equation (4)). It measures the activities in which an individual can participate at a given time [
29,
30]. These measures put constraint on the location and duration of mandatory activities plus the travel time budgets for flexible activities. These measures are the most disaggregated form of accessibility measures and they are often visualised as a time-space path of individual or time-space prism. Due to the lack of data at the individual level, these measures are not commonly used in hedonic price studies. A simple way to measure this type of accessibility for an individual is to sum the number of opportunities within the feasible opportunity set or simply use the length of network arcs in potential path area:
where A
i is the accessibility at the individual or homogenous population level i and V
ij is the perceived utility. The perceived utility (V
ij) is the sum of the utility derived from the transport mode in accessing the specific destination. The differences in utility between different scenarios can then be used to derive consumer surpluses and thus the monetary value. Empirically, this is done by multiplying the logsum accessibility by an income coefficient.
The fifth is the utility measures, which interprets accessibility from the outcome of travel and destination choices and translating it into monetary value [
12,
31]. The most common form of these measures uses the denominator of the multinomial logit model, which is more widely known as the logsum accessibility measures. The accessibility measures the sum of the utility of all choices.
4. Results
In this section, we will present the results following the review method that is discussed in
Section 3 using three aspects of accessibility: type, opportunity, and impedance. In the following three result figures, these three aspects are presented in relation to each other. Instead of presenting the results in a three-dimensional graph (
Figure 2), each plane in this three-dimensional (3D) graph is discussed separately: type-opportunities (
Figure 3); impedance-opportunities (
Figure 4); and, type-impedance (
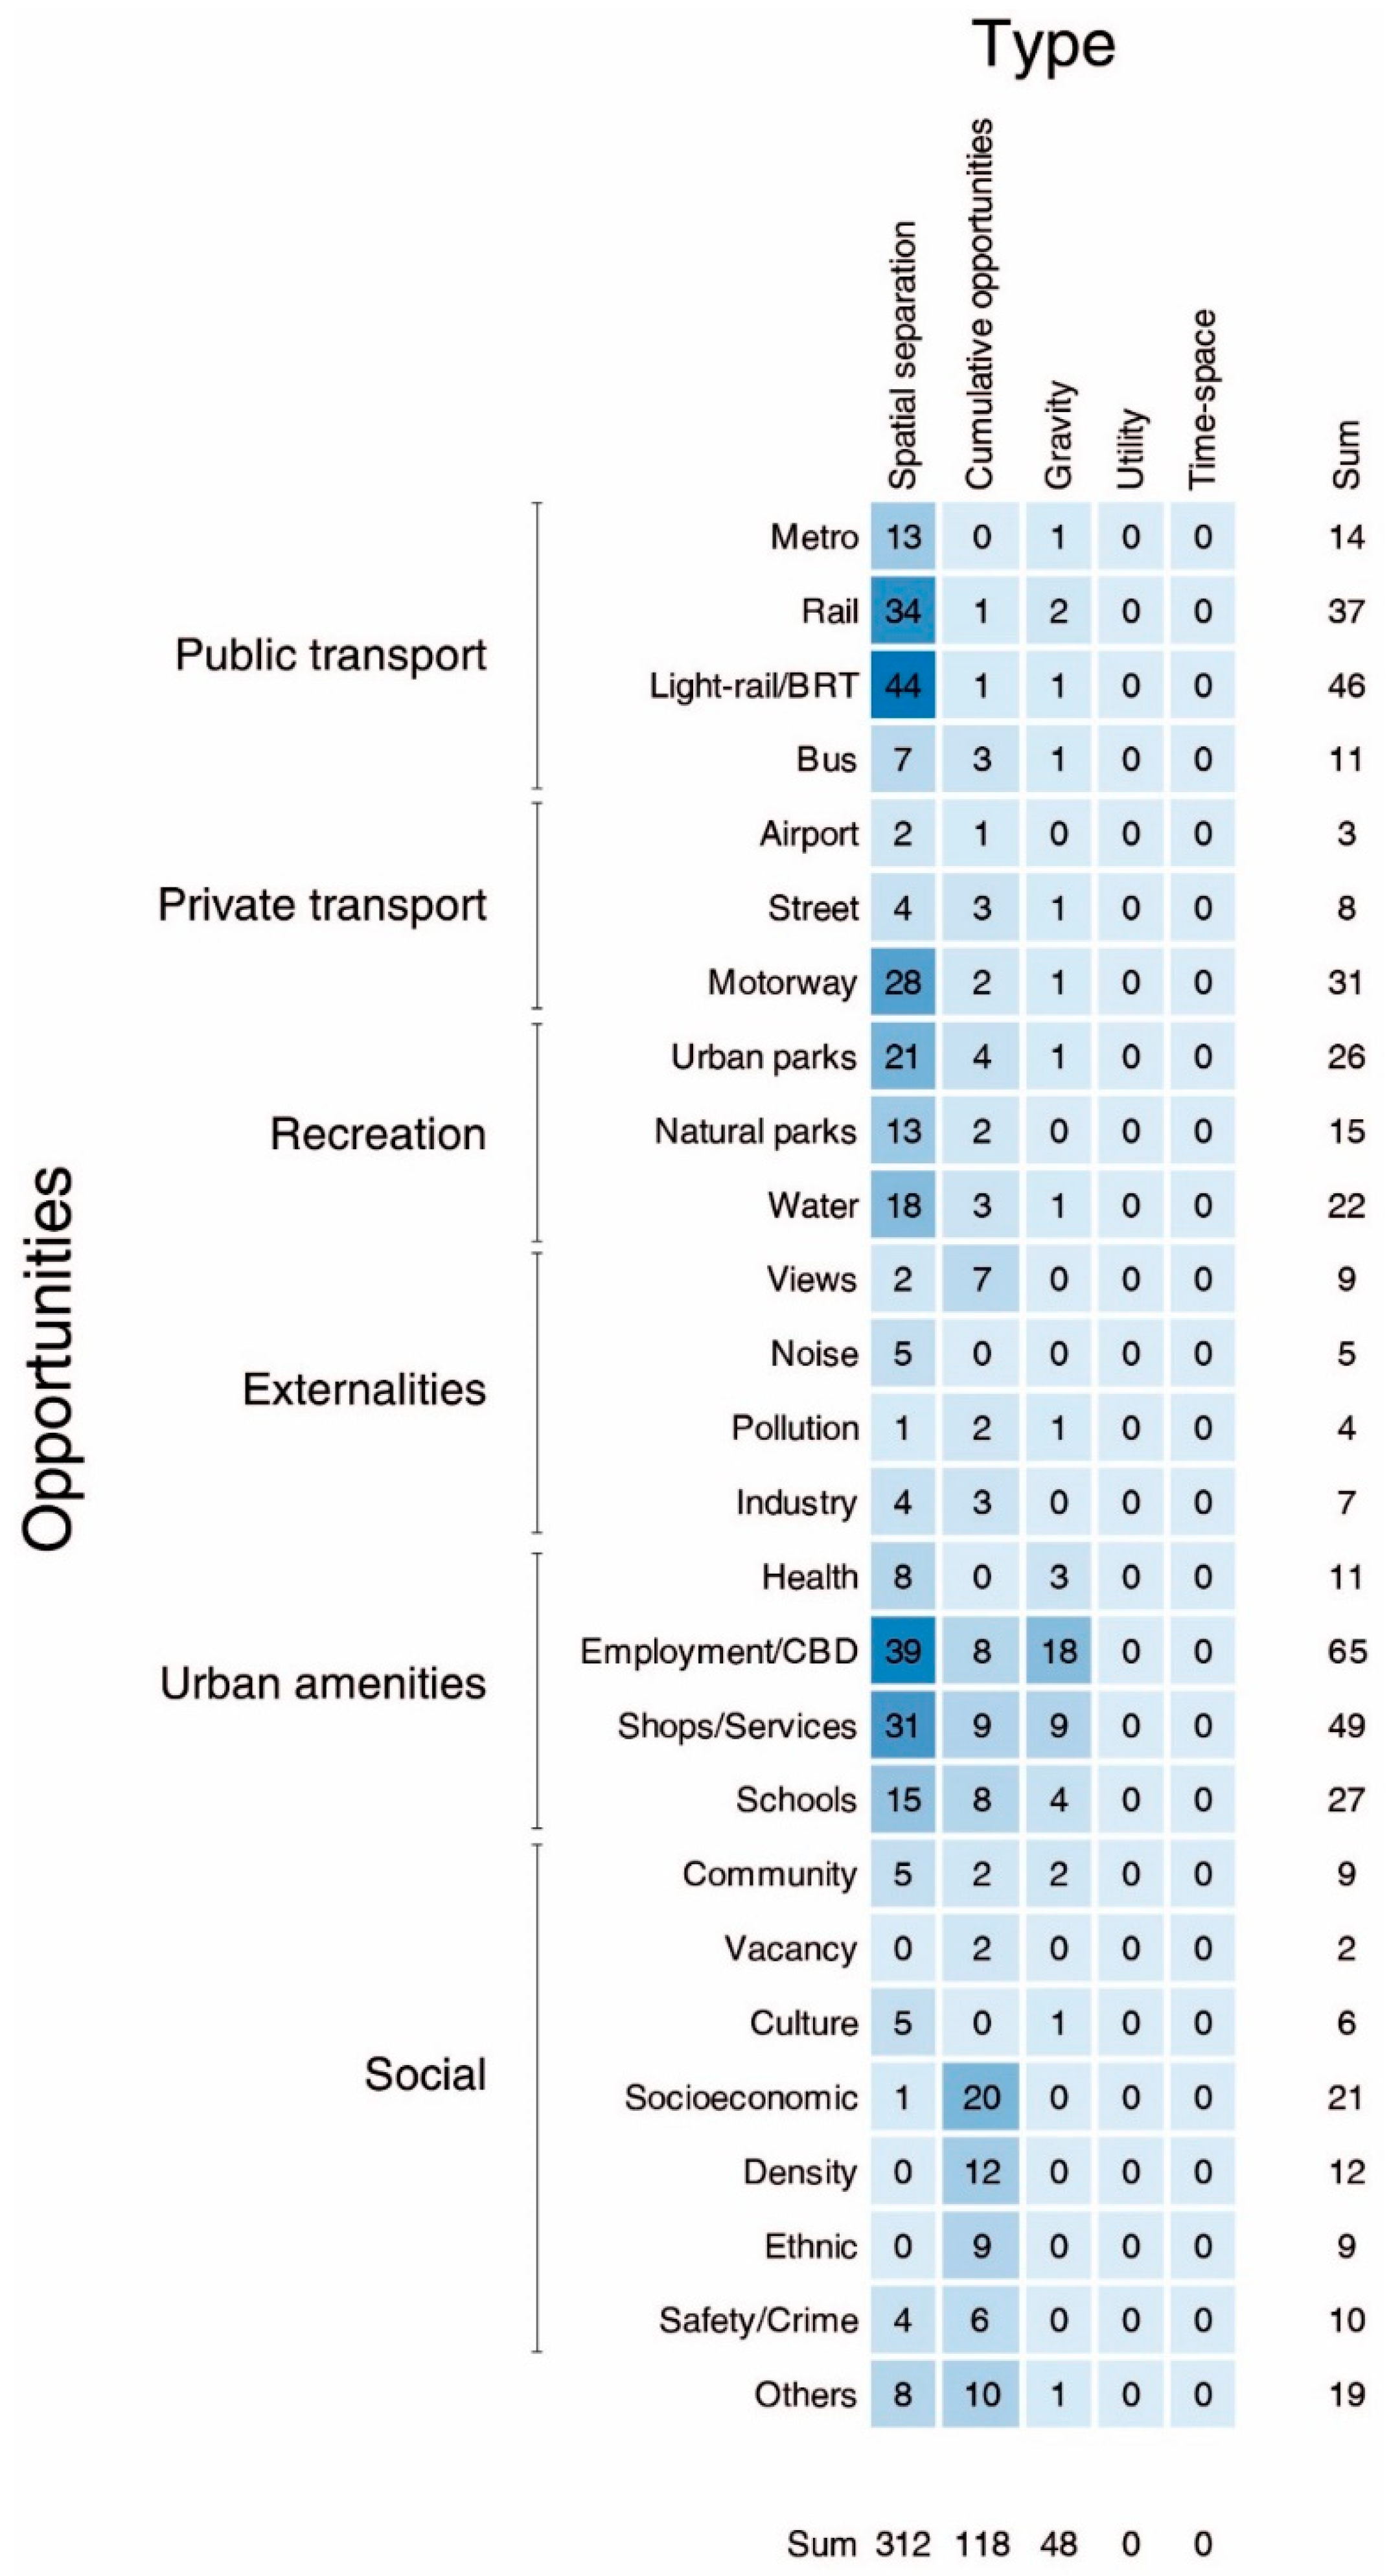
Figure 5). The numbers in the figure show the amount of times the specific combination of aspects of accessibility occur in the reviewed papers.
A first thing to note is that the specifications of the measures was as well described in the articles as they were, something that we had not expected. Second, we found a strong diversity of all three aspects reviewed in this paper.
From examining
Figure 3, spatial separation is the most frequently used type of accessibility measure (312), second largest was cumulative opportunities (118), followed by gravity measures (48). We also see that in our sample of papers none used utility or time-space. When examining the opportunities in relation to the most frequently used type of accessibility spatial separation, we do not observe concentrations in any of the opportunities. However, for cumulative opportunities, we notice a considerable weigh towards socioeconomic measures, including density, ethnic, and safety/crime. The gravity type shows a clear dominance tendency towards employment/CBD and shops and services. The type of accessibility measure utility or time-space is used only once, which is likely due to the need of heavy analytical efforts.
When only considering the frequency of opportunities in
Figure 3, Employment/CBD is the most used variable in our study, used 65 times, followed by Shops/services (49) and Lightrail/BRT (46). If we look at the groups of opportunities, we see that urban amenities and public transit are most frequently used, followed by social variables and recreation.
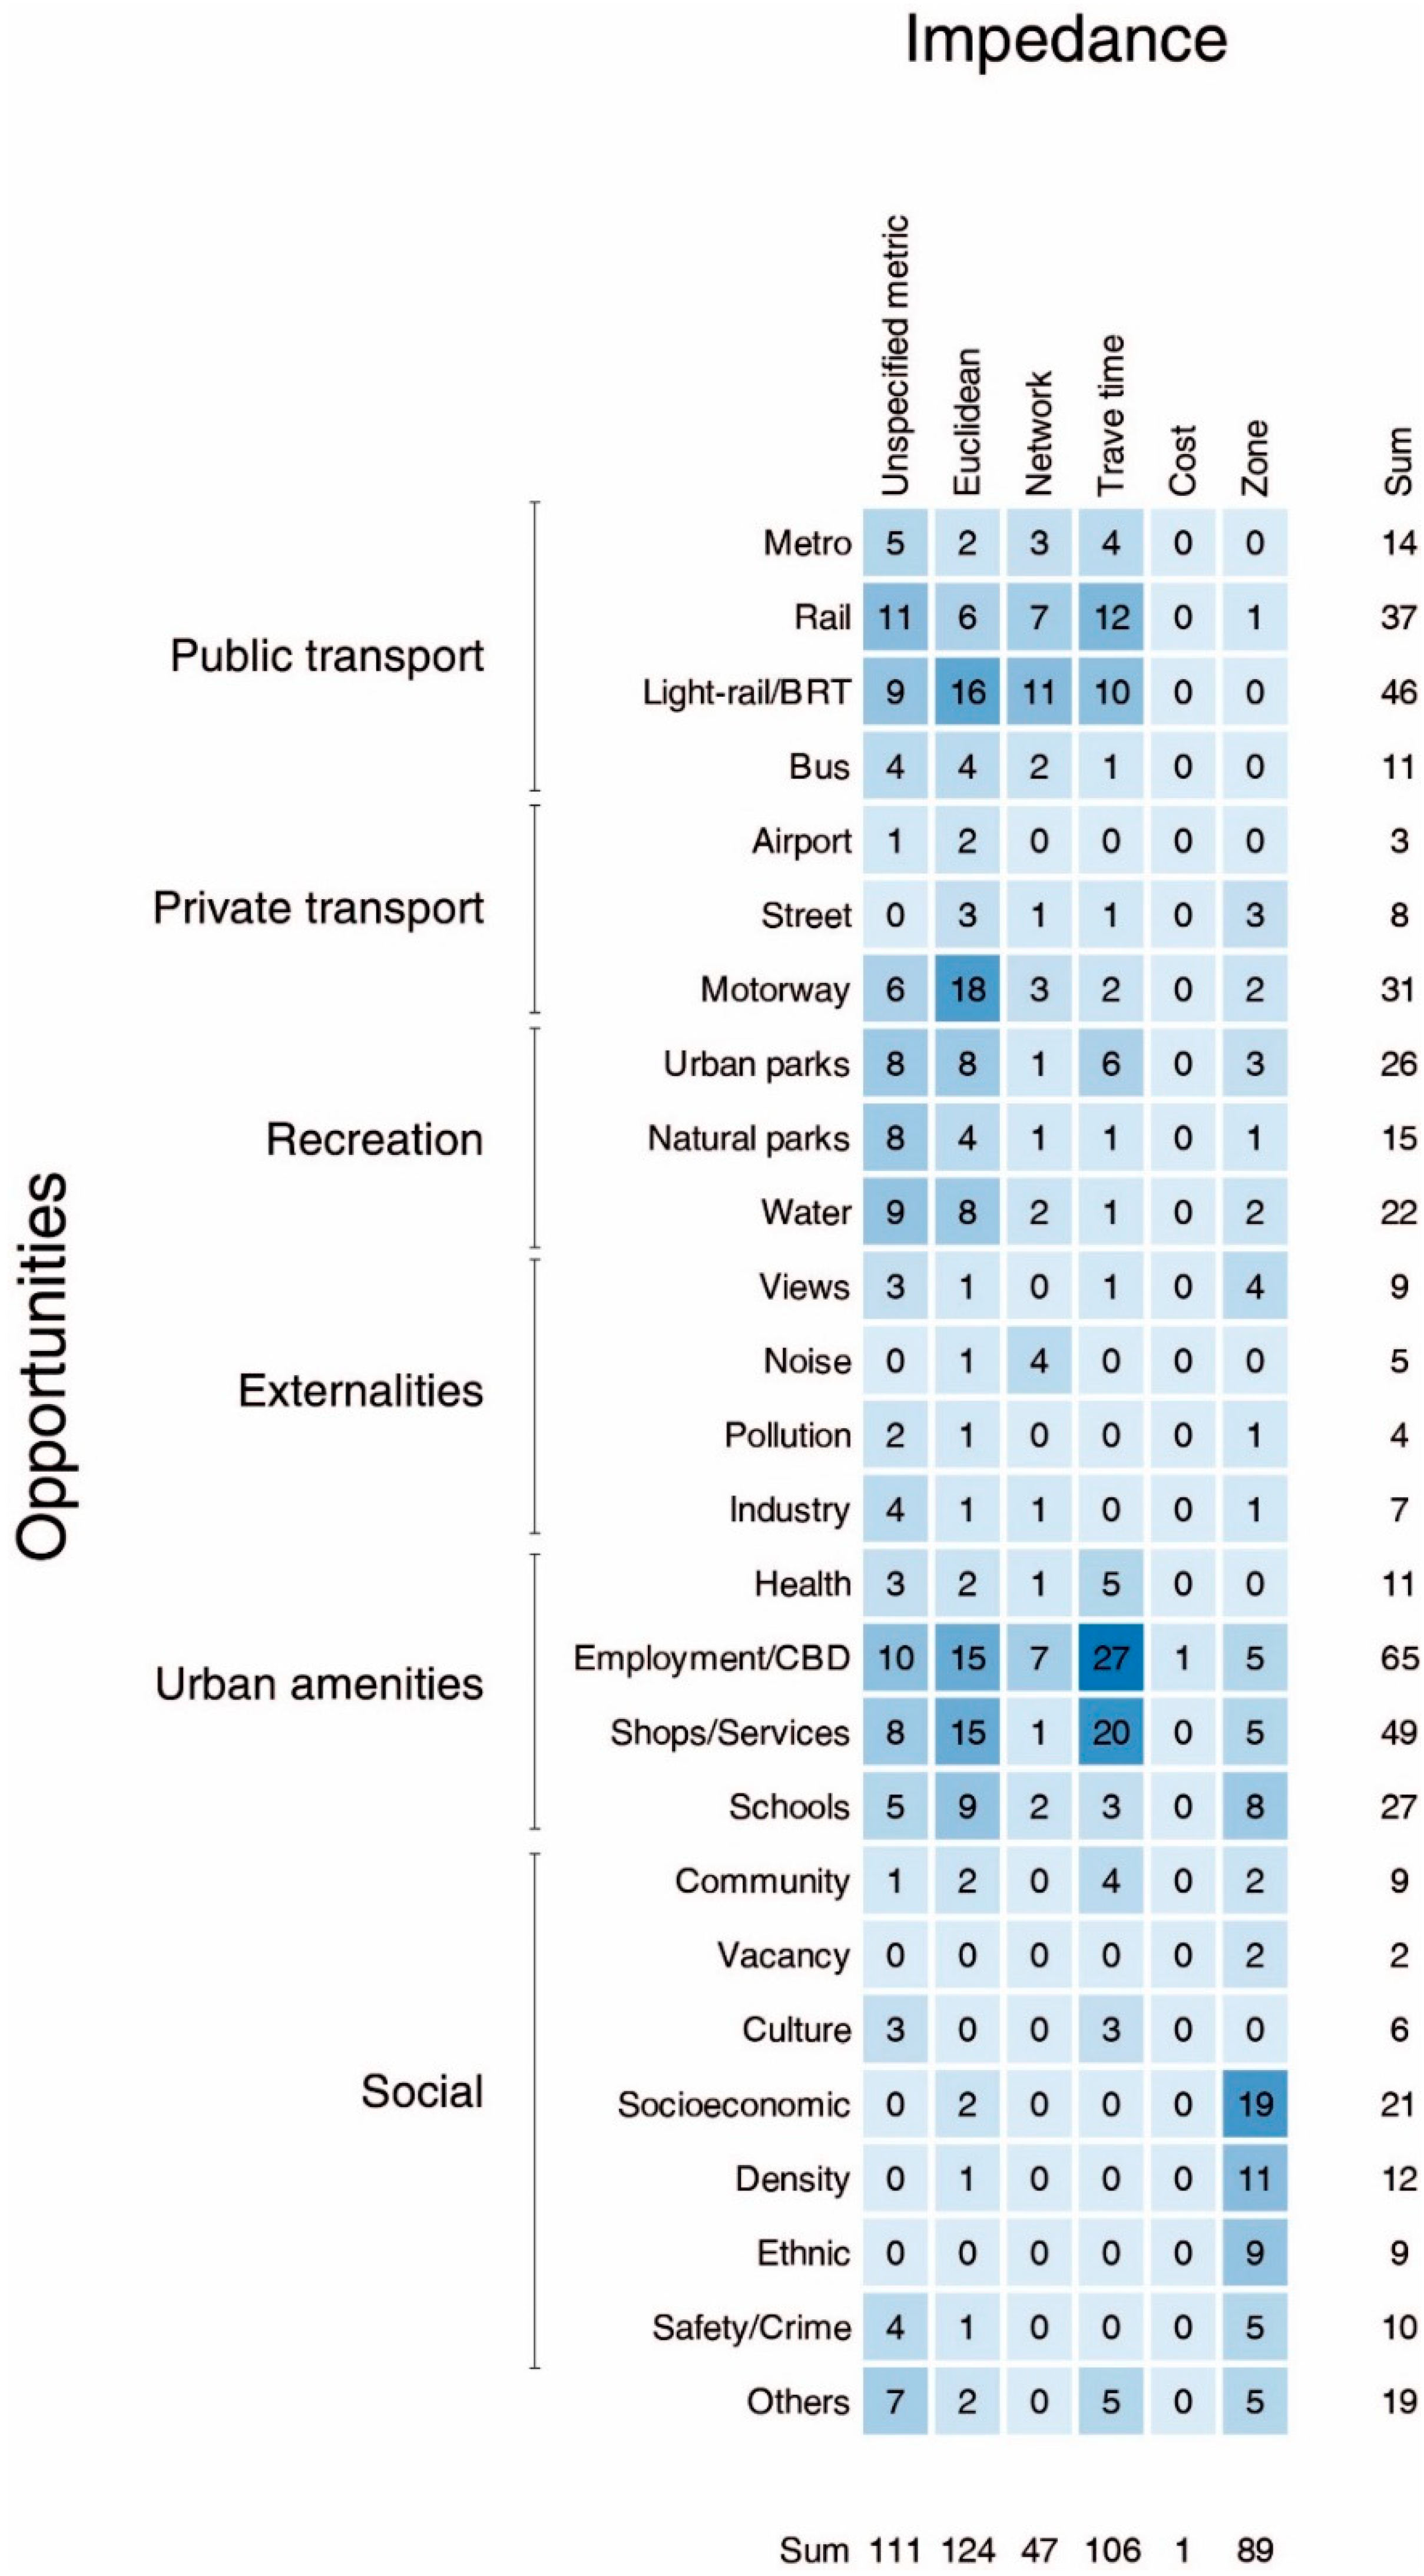
In
Figure 4, we see the results of the combination of the aspect opportunities and impedance. When it comes to impedance, Euclidean distance was the most frequently used impedance (used 124 times), followed by unspecified metric distance (111) and travel time was the third most often used impedance (106). The fourth commonly used impedance is zone (89), followed by network distance (47), and last is cost, which only occurred once in our sample. The more precise distance measure, network, is thus used less than half as often as the more crude Euclidean distance, which is used 124 times.
When looking at the combination of opportunities and impedance, it is striking that especially the social variables are predominantly combined with a single impedance, that is, zone. This group of opportunities includes socioeconomic, density, ethnic, safety/crime, and vacancy, which seldom are available on more disaggregated resolution than census tracts, hence the zone.
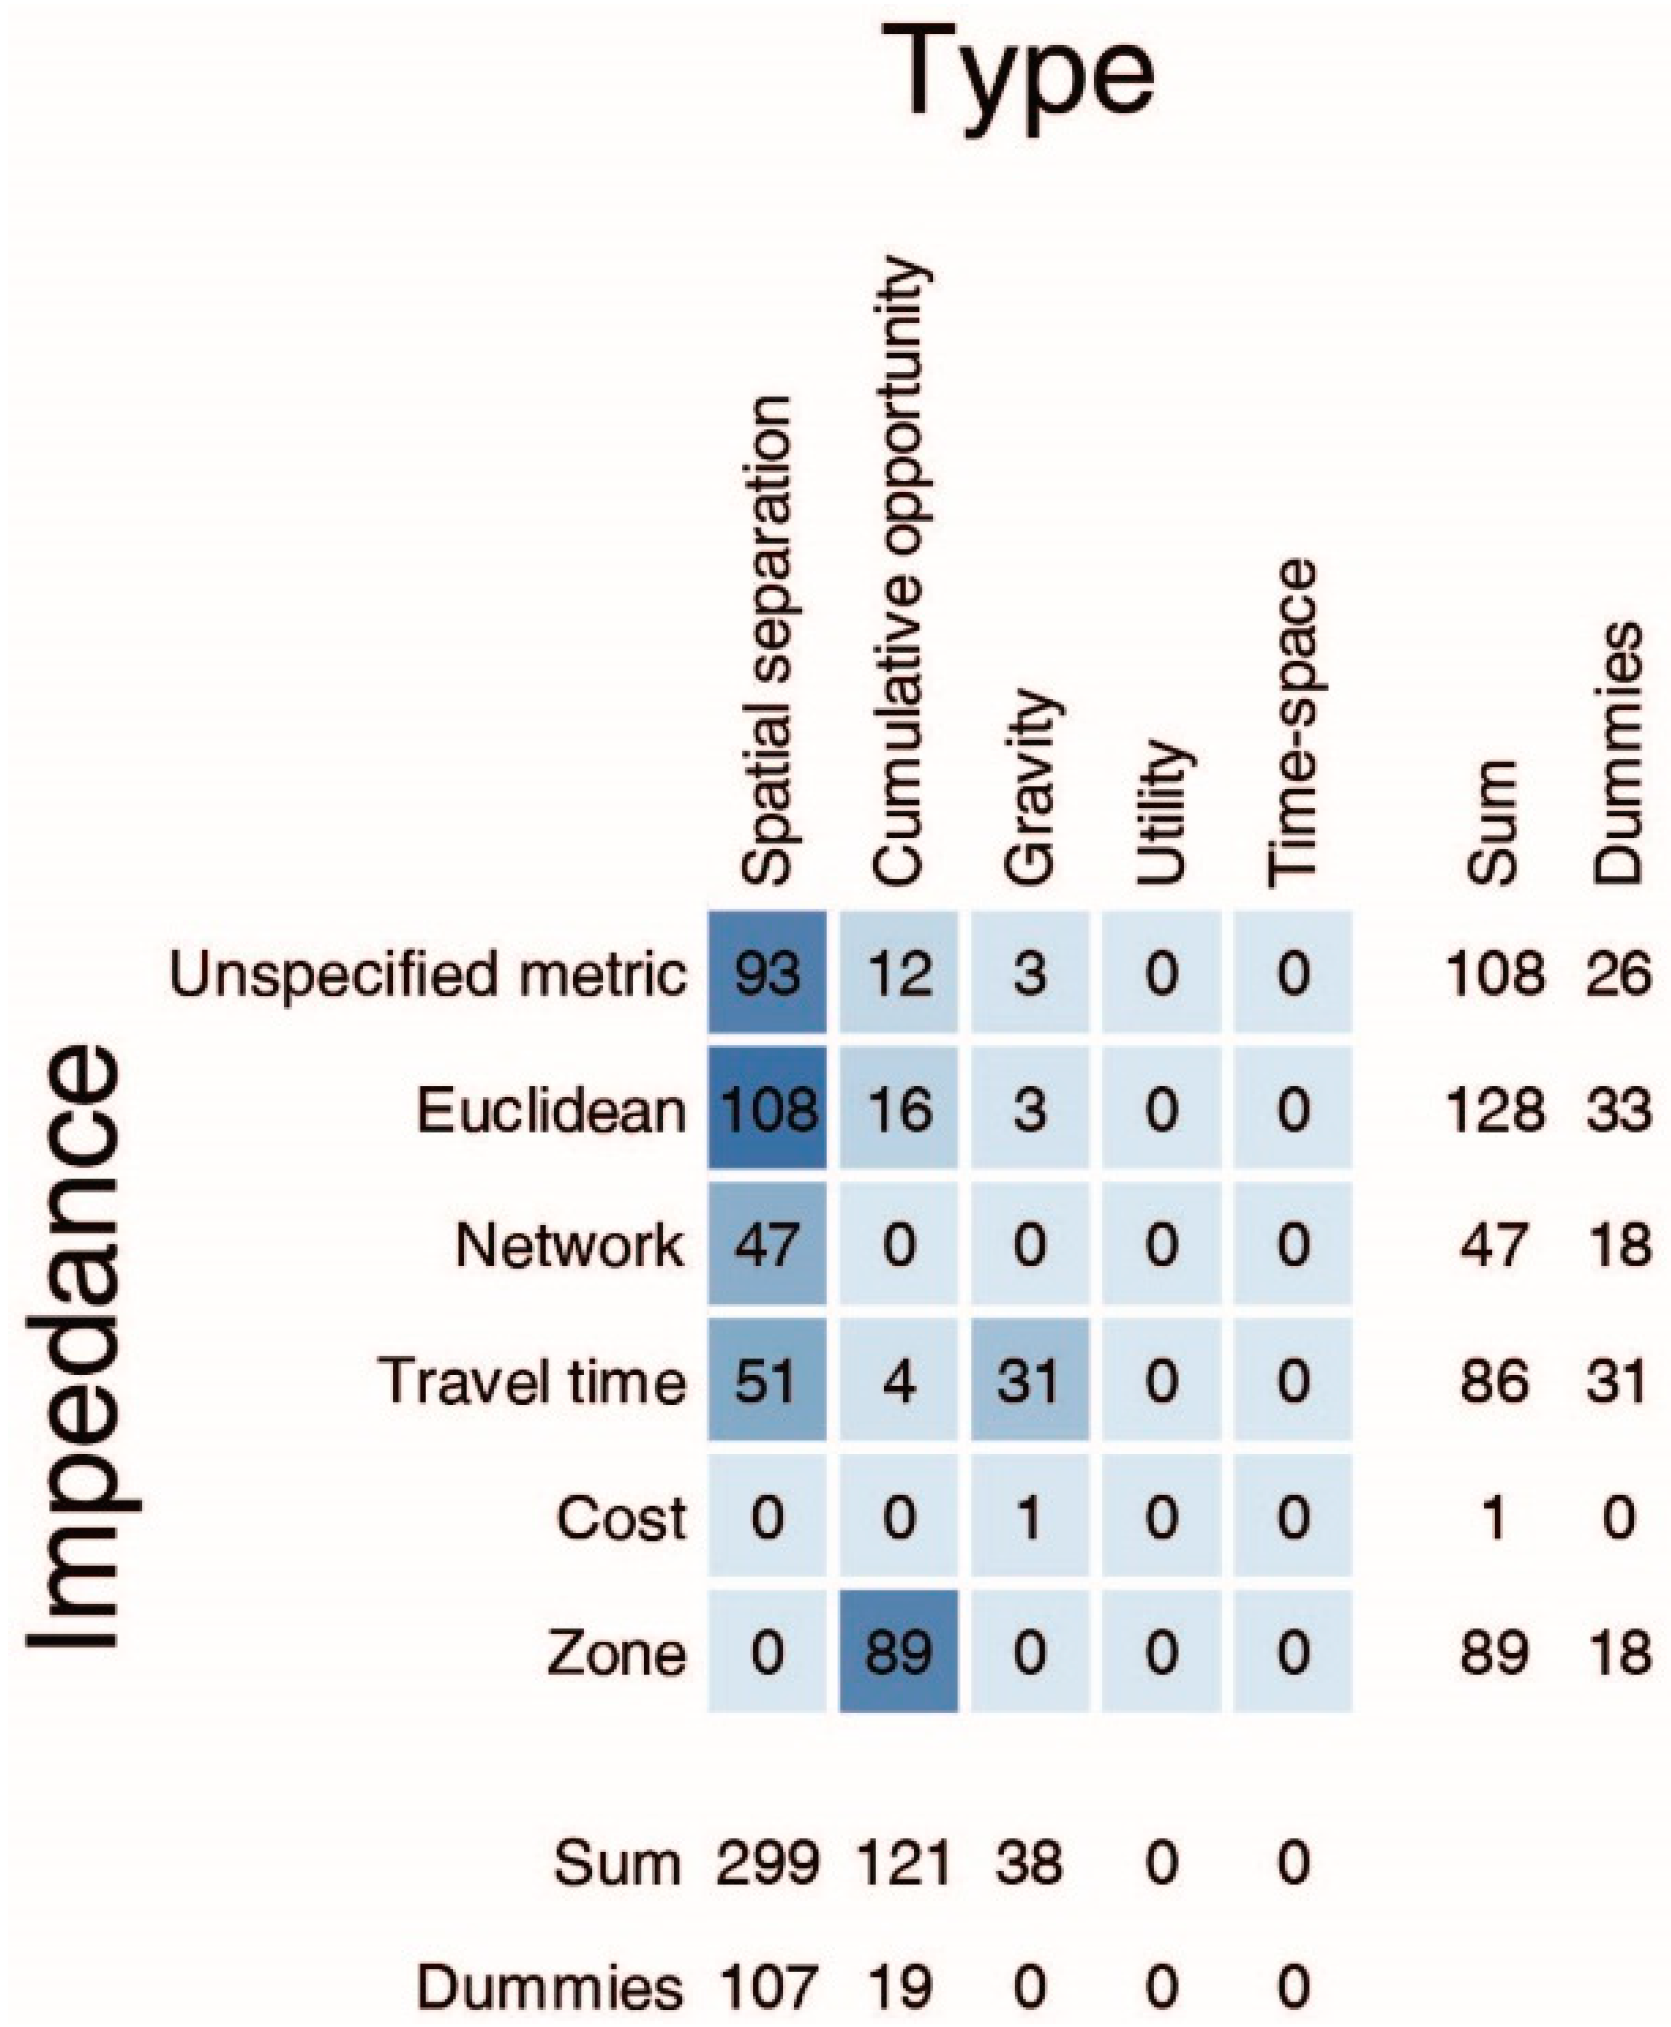
Figure 5 presents the results of the frequency of the use of the combination of type of accessibility measure and impedance. The figure shows that Euclidean distance is the most frequently used impedance, and further, dominant in combination with the type of measure spatial separation (106 times used). Almost as frequently used is unspecified metric (93), again in combination with spatial separation, followed by network (47) and travel time (51). In other words, less than half of the variables using spatial separation as type of measures are using the more precise distance measures network or travel time (98 in total), in comparison to the less precise distance measures unspecified metric and Euclidean distance (201). For cumulative opportunities, zone is the most frequently used impedance. We also note that there are no occurrences of network impedance among cumulative opportunities. The gravity type is often used in combination with travel time as impedance.
When we look at how many of the accessibility variables in the reviewed papers that are specified as dummy variables, we can see in
Figure 5 that they are evenly distributed among the impedances unspecified metric (24%), Euclidean (26%), and zone (20%) on one hand and among network (36%) and travel time (38%) on the other. Our results further show that 16% of the cumulative opportunity variables and 36% of the spatial separation variables are measured as dummy variables. Drawing from the
Supplementary Material, we see that all but one of the cumulative opportunity dummy variables are measured by zone impedance, while the spatial separation dummy variables are more evenly spread among the different impedances.
5. Discussion
Contemporary hedonic price models (HPM) that use accessibility measures predominantly use spatial separation as the type of accessibility measure, followed by cumulative opportunities. Among these two types of measures, we furthermore see a clear tendency for using Euclidean and unspecified metric distance as impedance, while among cumulative opportunities and gravity measures, zone and travel time are the most common, respectively. If we also assume that the unspecified metric is done based on Euclidean distance, we can presume that the lion part of the unspecified metric are Euclidean distance measures, this would result in 235 Euclidean measures against 47 network based, exactly one-fifth. In the same manner, the travel time measures in some cases might actually be a network distance, possibly even Euclidean, multiplied with an assumed average speed to get a time, in which case we would have 235 Euclidean and 153 network measures.
We also see that there are two clear groups of opportunities dominating HPM: urban amenities and public transport are the most frequently occurring, followed by recreation and social variables. The public transport categories are probably frequent, because it is considered as an important determinant for housing prices in general [
32,
33,
34]. The theory driving the frequent use of distance to CBD measures in HPM, the most frequent used opportunity in the urban amenities group originates from the concept of the bid rent theory of Von Thünen [
35] and its exposition through a monocentric model [
36]. The essence of the monocentric model is its simplicity in explaining land rent through transport cost to determine the location of residents relative to its workplaces, i.e., CBD.
Urban amenities and public transport are the most diverse in terms of use of impedances, recreation has a tendency towards using the unspecified metric or Euclidean distance, and the social variables are dominantly combined with zones as measure of distance. There are thus clearly context specific combinations that, in the case of social variables and zone, might have to do with data-availability; socio-economic data, ethnicity, and data related to safety/crime, are usually only available in aggregated format, typically to census tracts. The use of travel time impedance is clustered in public transit measures and in typical control variables, like distance to CBD or shops and services. This makes it easy to believe that the main focus of these studies is transport.
One of our initial questions was if we, from this sample, could draw any conclusions as to whether or not accessibility measures in general fit in the fundamental theory of hedonic models, which has its base in the buyers’ perception of location. In essence, a consumer buys a dwelling that is based on how he or she values the different characteristics of it, based on how he or she perceives them [
5]. The example used in the introduction, explains how it is hard for a consumer to appreciate the pollution level, at least in parts of the world where there is no visual sign of it, and therefore makes it problematic to include in a hedonic model where people’s perceptions are central. This is also a valid discussion to have for specification of accessibility measures regarding, for example, density or distance [
20,
21]. Although somewhat simplified, we could argue that, among the impedances network, travel time and cost can be considered to capture perception of a consumer in a satisfactory way, while unspecified metric, Euclidean, and zone, in general, do not. This can be linked to the discussion on measured, physical, and perceived distance in the introduction. The physical and perceived impedances are underrepresented here. Instead, the measured impedances dominate, which we conclude could violate the fundamentals, on which hedonic price modelling is built upon. From a homebuyer’s perception point of view, these results show weaknesses in current HPM, since homebuyers typically do not use Euclidean space to reach amenities and therefore do not perceive accessibility as such. We would also like to make a notation that there are no studies using geometric accessibility measures as impedance, such as angular change or topological steps [
37]. Such specifications of impedance could fit with homebuyers’ perception.
With this in mind, we find the relative high frequency of travel time as impedance, which is in line with the theory. Another frequently used impedance is Zone, which is, as we argued above, not in line with the fundamentals that, for example, Baranzini et al. [
5] is pointing at. How problematic this is for the outcome of HPM is hard to say based on this review, and it will also depend on the level of aggregation of these zones. Linking back to our discussion on aggregation and MAUP, we established that the larger the zone is and the greater the diversity in the aggregated parts, the more variation is lost [
23], and the further away from the perception of a home buyer, which is the aim in hedonic price modelling [
5,
7]. In all, we think that it is a clear limitation in current studies that they do not seem to reflect on the influence on the results that data resolution has.
What we have shown with this review paper is that types of accessibility and impedances that capture what the buyer perceives when purchasing a dwelling well are in minority. A more conscious choice and in depth discussion of the chosen type of accessibility measure, impedance, and opportunity in relation to the theoretical foundation of HPM could enhance the accuracy of the results. This is true, not least concerning the potential causality in the relationships, where a characteristic of a dwelling that is not perceived by the buyer or seller could hardly be argued to have a causal effect on the price. While reviewing the sample of papers, we noticed a lack of consideration to how this coupling possibly could affect the results. For instance, a matter that was poorly described in the articles was the level of aggregation of the data. We believe many of the choices of specification of accessibility measures are based on the access and quality of the data, instead of theoretical considerations. As de Jong and van der Voordt [
23] concludes, the results are affected by the resolution of the geographical data, MAUP, and they could of course also make the results from HPM inconsistent.
We strongly believe that the specification of accessibility measure in HPM needs to develop in the above-mentioned ways to be able to get more precise estimations. That is to, in a theoretically founded way, couple impedance and type of accessibility with opportunity and use the appropriate resolution of data. This conclusion also points to the need for further research to empirically test the influence of the type-impedance-opportunity specification on the price estimates in HPM. Because of the differences in scope and geographical location in the articles that were reviewed for this paper, it is hard to draw such conclusions based on a meta-analysis of this sample of already published articles. We recommend to study the influence of the type-impedance-opportunity specification on the price estimates in HPM using the same geographical location and the same hedonic model specification to estimate the error related to methodological choices when considering accessibility.


