Case Report

Use of Mobile Devices with Multifunctional Sound Level Measurement Applications: Some Experiences for Urban Acoustics Education in Primary and Secondary Schools

1
Environmental Acoustics Laboratory, Department of Architecture, Graduate School of Engineering, Kobe University, Kobe 657-8501, Japan
2
Department of Architecture, Chiba Institute of Technology, 2-17-1 Tsudanuma, Narashino, Chiba 275-8588, Japan
3
Department of Acoustic Design, Kyushu University, 4-9-1 Shiobaru, Minami, Fukuoka 815-8540, Japan
*
Author to whom correspondence should be addressed.
Submission received: 6 November 2019 / Revised: 2 December 2019 / Accepted: 5 December 2019 / Published: 9 December 2019
(This article belongs to the Collection Urban Acoustic Environments)

Abstract

:
Geo-referenced sound data are often used in the field of acoustics education to learn about the urban acoustic environment. Simple soundwalks and sound collections are also employed, in which acquiring additional information such as visual data, recorded sound data, and GPS location data are helpful to produce a map with sound data and sound collection and to carry out more profound discussions in educational activities. In order to enrich these acoustic educational and environmental survey activities with a simple tool, the use of multifunctional sound-pressure level (SPL) measurement applications with mobile devices are proposed. Some experiences of combined activities of the above methods using the applications and mobile devices are reported in this paper. In this study, applications for SPL measurements, which record GPS location data, sound, photo, and video during measurements, were used to produce geo-referenced sound data. First, the accuracy of the applications was checked and we found them to have reasonable accuracy when used with iOS devices; for example, the averaged error was less than 1.5 dB(A) with iPhone XS. Next, they were actually used in a simple soundwalk-like field survey and the resulting geo-referenced sound data were presented to discuss the merits and demerits of each application. Overall, the applications used in this work were found to be useful; for example, recorded sound allowed us to check the main sound source and to carry out discussions using collected sound samples later, and photos and videos allowed us to grasp the impressions and situations around the measuring points. Therefore, these multifunctional sound level meter (SLM) applications can be effectively used for various purposes, including acoustics education for learning about urban acoustic environments.

1. Introduction

1.1. Background

Acoustics education is now established as one of the subfields of acoustics and includes various disciplines of educational activities for teaching and learning about sound. This also includes activities to learn about urban acoustic environment in various levels of educational institutions. Recent growth in the demand for acoustics education has promoted the development of its methods in various disciplines at different stages of education [1]. In many cases, methods based on soundscape ideas [2,3,4,5], in particular, the applications of soundwalk, sound mapping, and sound collections, are employed for acoustics education to learn about urban acoustic environments [6]. In the same paper [6], the authors proposed an acoustics education programme with soundwalk-like methods to make small-scale maps with geo-referenced sound data, employing mobile devices with sound-level measuring applications, instead of a sound-level meter (SLM). This programme was originally planned for engineering-oriented higher education related to urban environments, e.g., departments of architecture, urban planning, environmental sciences, etc., to relate their perceptual impressions to physical values. However, such an approach to relate perception to physically measured sound-pressure level (SPL) has recently been encouraged in primary education in Japan [7,8], of which some details are introduced later.
More elaborated methods using mobile devices for large-scale sound mapping have been proposed and developed in previous studies [9,10,11,12,13,14]. Recently mobile devices have also been used for classroom acoustics, which relates to indoor acoustic environmental studies [15]. In view of this recent research progress, it is worth pursuing further possibilities of mobile devices for educational applications. Particularly, recent acoustic measurement applications have various advanced functions, which can be of potential use for acoustics education in various fields and stages. The advanced functions include sound recording, photo and/or video taking, data logging, etc. during SPL measurements. Especially, sound-recording and photo/video-taking functions are potentially useful for educational programmes not only with mapping sound data but also with other activities based on the sound collection approach [16].

1.2. Acoustics Education in Various Stages of Education and Their Demands

Most basic ideas of acoustics education in primary and secondary schools are inspired by Schaefer’s books on acoustics education [3,4]. According to his principles, perceptual aspects are highlighted in most activities [5,17]. However, in Japan, for example, due to the recent drastic changes in the curriculum in primary and secondary education [7,8], the use of mobile devices is strongly encouraged, to use them not only for sound collection with sound recordings and video taking but also for SPL measurements [8,18].
Studies on the methods for acoustics and environmental education using mobile devices, for example, in References [16,19], have recently been reported. In Reference [16], Kawahara et al. proposed educational activities using tablets for collecting sounds by taking videos that are played back in the classroom for pupils to determine the sound source in “sound quiz” style. In the activities, pupils shared the perceptual impressions each other. Its method and effectiveness were discussed in detail in Reference [16]. In Reference [19], Suzuki and Toyomasu proposed to use a tablet to take videos of places that are recognized as dangerous in a city to produce a security map. In both studies, acoustic criteria such as SPL were not measured, but rather, they focused on perceptual evaluation. However, in view of acoustics education needs, SPL measurements can be accompanied to understand the relationship between a physical measure, such as sound levels, and perceptual impressions. This is easily understood to be important for engineering-oriented educational institutions [6,20,21]. In these cases, applications with advanced features for mobile devices will be useful.
Even in acoustics education in primary schools, it is encouraged to deal with neighbour noise, road traffic noise, environment noise, etc., which are typical noise problems in and highly relevant to urban acoustic environments [22,23,24,25,26]. In this sense, development of effective methods with advanced applications with mobile devices at all stages for educational institutions will be useful. In this case, recording “perceptual” evaluation is also desirable, and there are some applications for mobile devices which can record perceptual scores [27,28]. Those applications are aimed at a large-scale survey, and detailed perceptual evaluation can be somewhat difficult for the primary/secondary education level. Also they are available in limited languages. Considering this situation, in this study, we considered the use of a recorded sound/video in a classroom or group discussion after a survey to share the perceptual comments and impressions. Alternatively, perceptual comments are recorded in a field note to share later in the class.

1.3. Purpose and Outline of the Present Work

In our previous studies on acoustics education [6,20,21], we considered a possible use of mobile devices with SPL measurement applications for introductory teaching of acoustics, mainly for students at engineering-oriented higher education. In these studies, one of the main purposes was to enable students to measure SPL by themselves in various places, which is not realistic with professional SLMs for a large class. We considered that this is useful for students to grasp the relationship with their perceived sound and its physical quantity. Therefore, detailed tests of measurement accuracy were performed, though we did not consider replacing professional SLM meters with mobile devices. For this teaching programme, we supposed that making geo-referenced sound data (similar to a small-scale sound map) is suitable as a task for the students, and examples were presented in References [6,20,21].
On the other hand, the present work is aimed at providing examples of possible educational activities using mobile devices for a broader grade of schools, including sound environment education in primary and secondary education as the main target. In this case study, three commercial applications that were not used in our previous work recorded additional data such as GPS positioning data, sound, photo/video, time history, and power spectrum.
First, the measurement accuracy of the applications was checked. In the present work, considering that overall A-weighted SPL data are usually used in the acoustics education, we employed a simple method for accuracy check proposed in References [6,21].
Secondly, as an output from a possible educational activity, we supposed a soundwalk-like method: measurements of SPL and additional data were performed at each designated point on a predetermined route, which were arranged on a map afterward. We performed this activity as a trial, and the examples of the geo-referenced sound data are presented to introduce the feature of each application.
The main purpose of this case report is to provide information about multifunctional applications with mobile devices as a tool for acoustics education in schools of various levels, mainly for educational activities to learn urban acoustic environmental in primary and secondary schools. For such activities, perceptual elements are important to be included. In this case study, examples of geo-referenced sound data as an output were presented and perceptual elements were supposed to be recorded by note in field book or by playing back the recorded sound or video afterwards in a classroom for activities such as group discussion.

2. Applications Used in this Study

In the present work, the following three applications were considered to be suitable for the purpose:
  • dB Meter Pro (Ver. 4.7, Decibel Sound Meter Pro. [29])
  • Decibel X (Ver. 8.0, SkyPaw Co. Ltd. [30])
  • SoundLog (Australian Hearing [31])
The features of the above three applications are summarized in Table 1. All three can record GPS data. However, the dB Meter Pro records sound only but the Decibel X can take photo and video (up to 10 s but the “Pro” version takes longer videos depending on the device), which is its most distinguishing feature. SoundLog is rather a simple “data logger” and was developed to be used as a dosimeter, which outputs a time history of Leq(A) every 1 min. All these applications have calibration functions. The screenshots of the main panels of those applications are shown in Figure 1.

3. Accuracy Check

Previous studies [32,33] have clarified the measurement accuracy of iOS/Android sound-level measurement applications for mobile devices, and dB Meter Pro and Decibel X were studied in Reference [33]. In previous work by the present authors, recent changes in both the applications and devices made some variation in accuracy of applications [6]. Therefore, in the present paper, we also made an accuracy check to confirm the reliability of the above three applications on both iOS and Android devices.
We proposed a detailed method to test accuracy in Reference [6,21]. However, considering that the main purpose of the present work is education of urban acoustic environments, in this work, the method of accuracy check is simplified. This is because, in many cases, the measurement is limited to A-weighted sound-pressure level (SPL): if the accuracy of the measured value includes some smaller errors, qualitative analyses are possible and often enough for educational purposes. Additionally, considering that it is difficult to perform an accuracy check in an anechoic chamber in the actual field of education, we performed an accuracy check in a typical non-reverberant room with nonprofessional equipment to produce test sound. For the test sound, we used pink noise only: in the previous studies aimed at engineering-oriented education [6,20,21], we used 1/1-octave band noise of various centre frequencies to check the frequency response of the device. However, considering the abovementioned purpose, accuracy for a broadband noise is sufficient. We used a standardized class 1 sound-level meter (SLM) as the reference for obtaining the best results. However, when quantitative discussion is less important, a class 2 SLM can be used.
Before the accuracy check, we removed the case of mobile devices and cleaned around the microphone port. The devices were oriented so that the microphone was directed to the loudspeaker emitting the test sound during the test. The loudspeaker used was a full-range loudspeaker of 12-cm diameter enclosed in a cabinet. The test was performed in the middle, but not the centre, of the room to avoid the effect of walls. The distance between the device and the loudspeaker was 1.5 m. The room used for the test was an office (3.5 × 6.5 × 2.8 (m3). Reverberation time, T20, was calculated from measured impulse response, and it was about 0.3 s) with furniture on the walls, carpet on the floor, and a sound-absorbing ceiling. Background noise level was 26 dB(A) (measured by class 1 SLM). Considering the level of typical environmental noise, the test was performed up to about 80 dB(A).
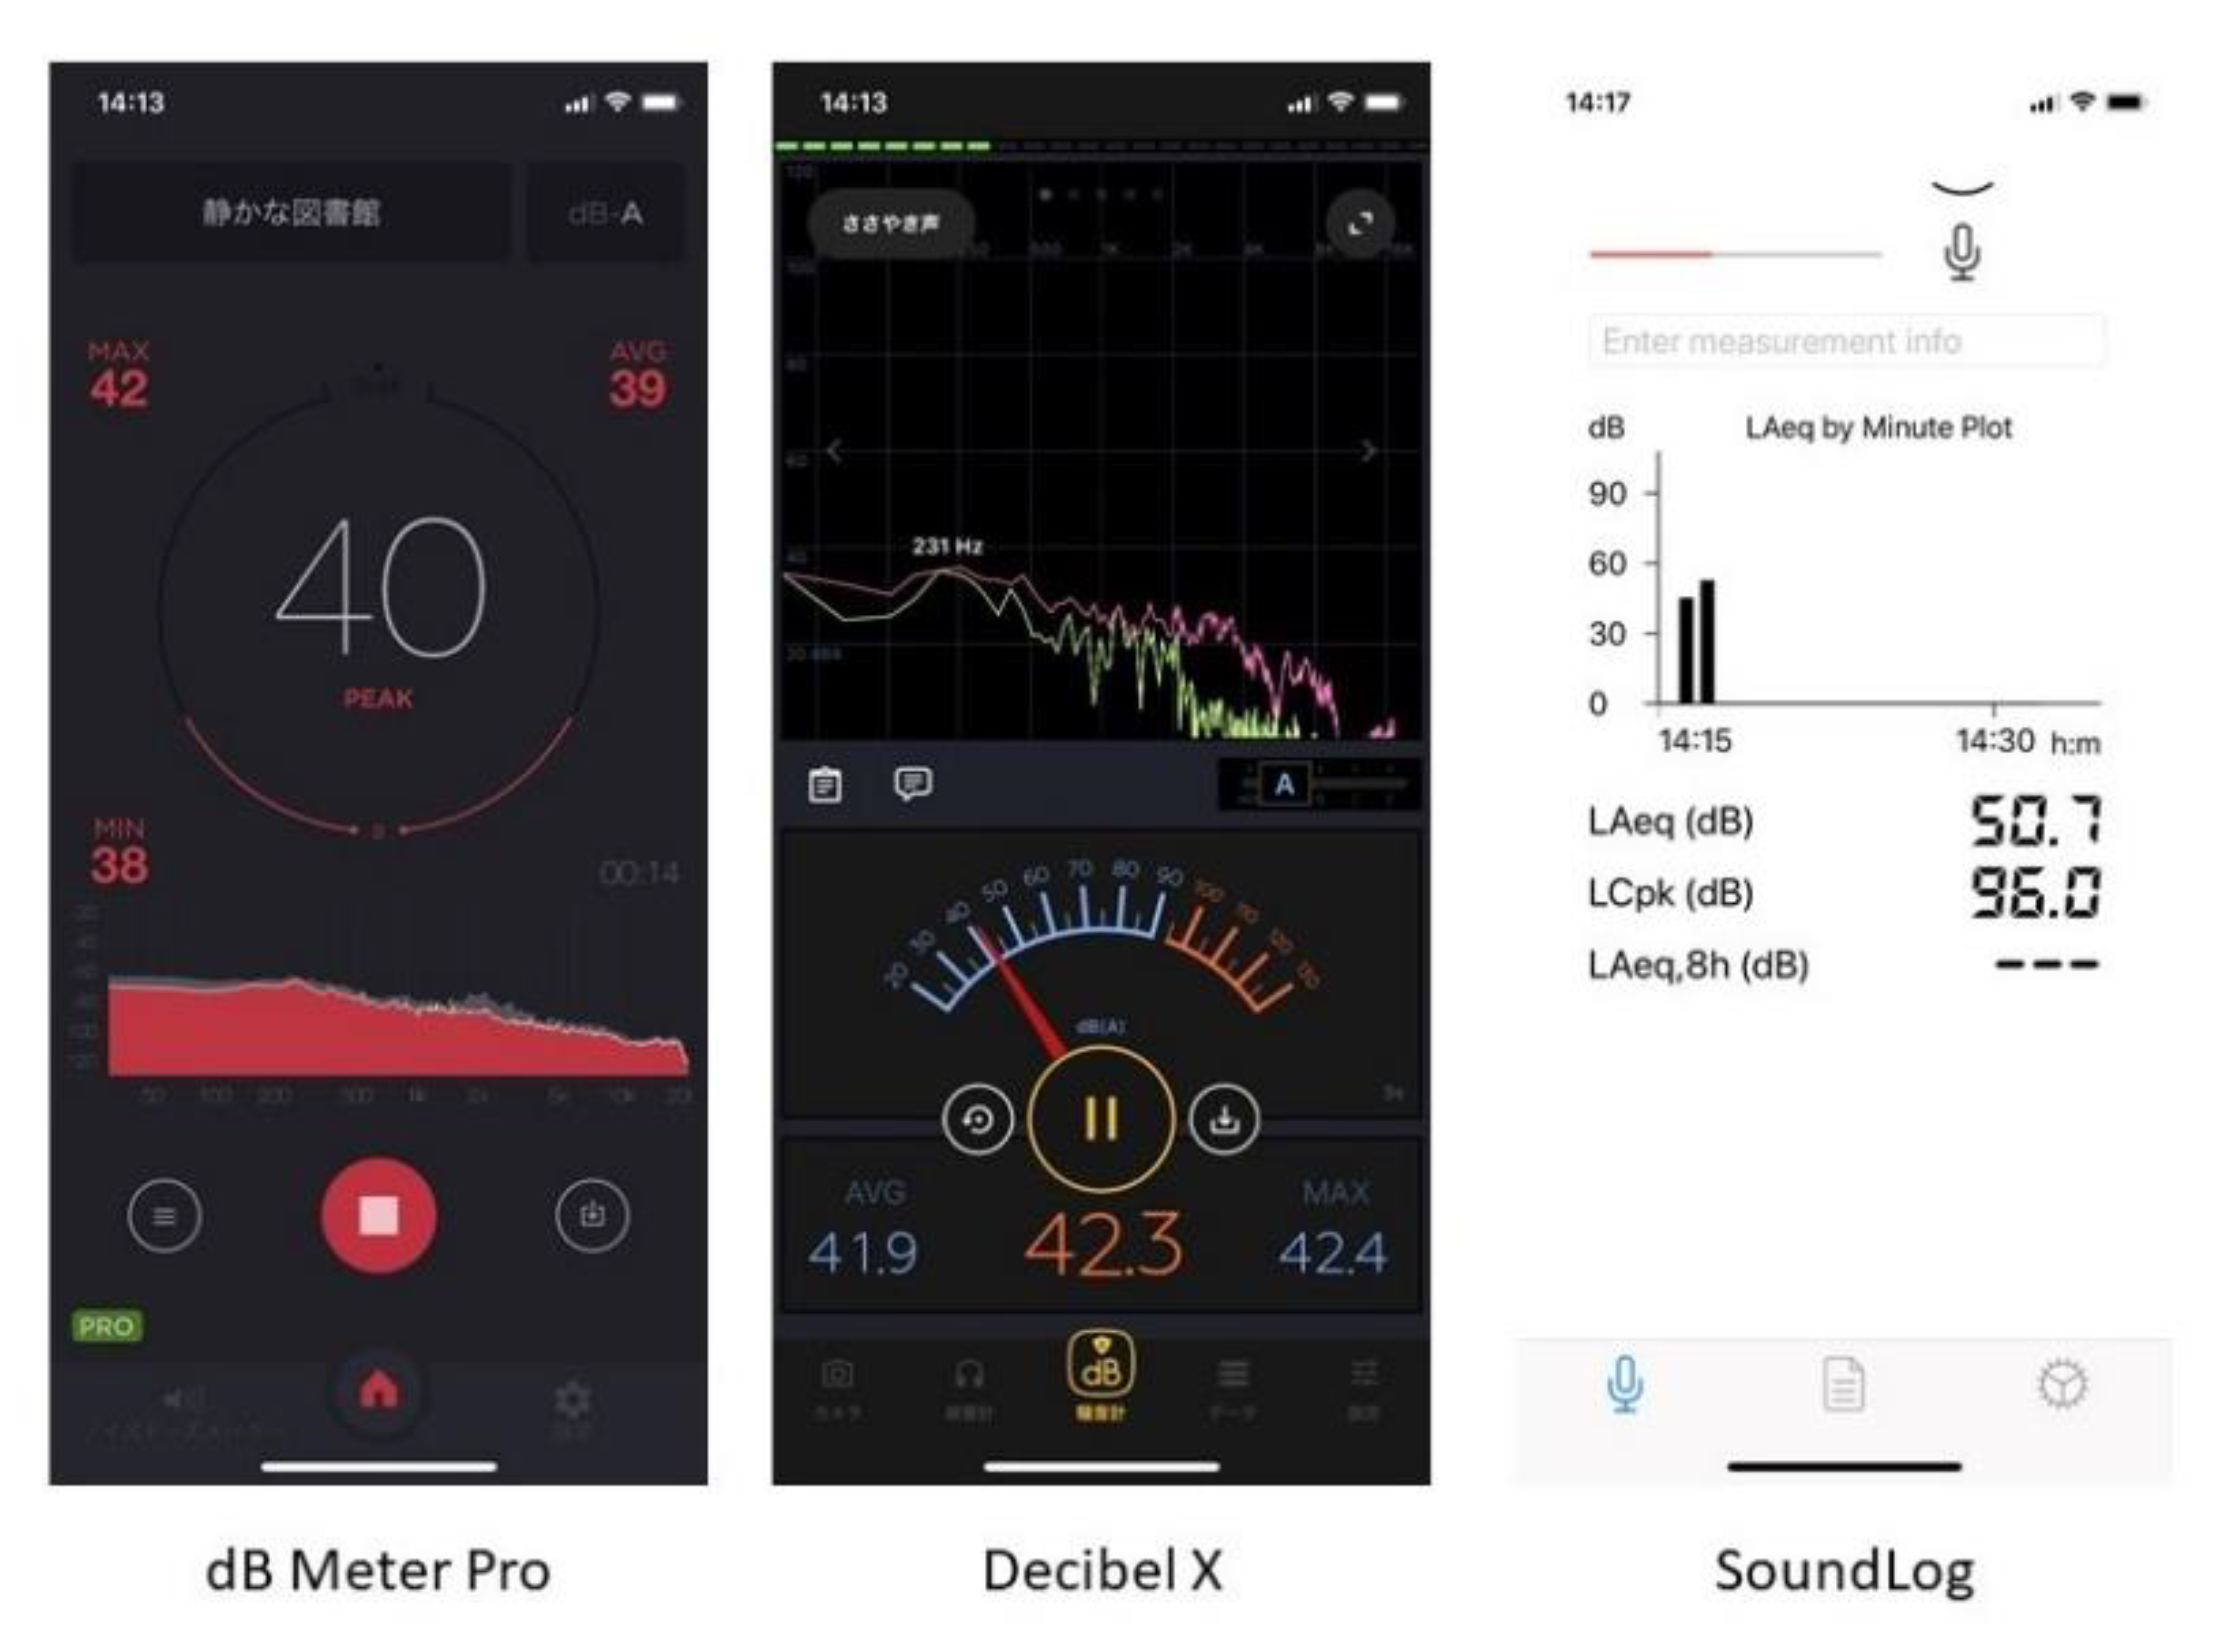
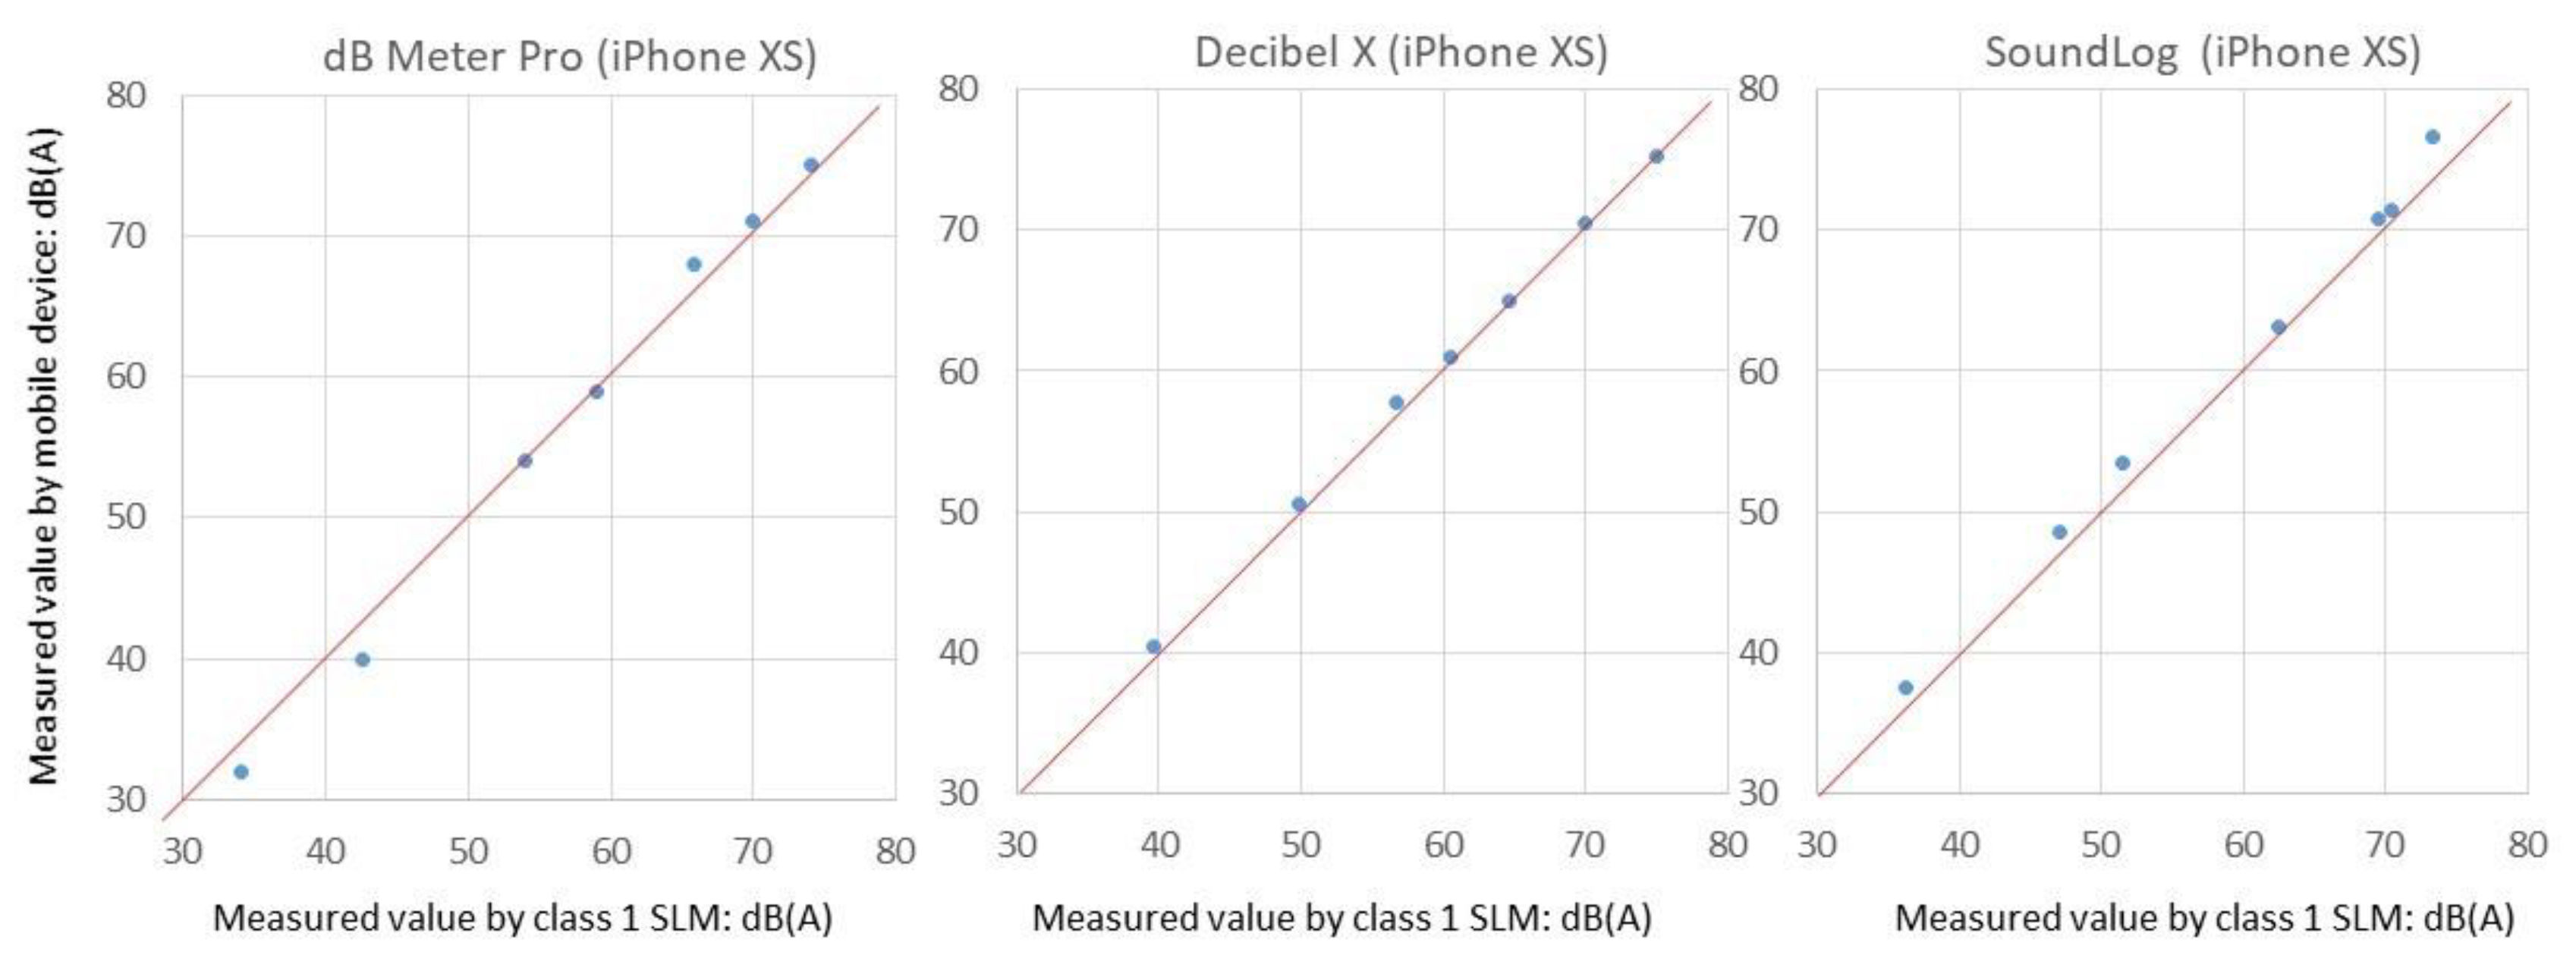
In this accuracy check, first, all applications were calibrated by measuring the A-weighted SPL of 1 kHz 1/1-octave band noise of 60 dB(A). The measured values were compared with those measured by a class 1 SLM (RION NL-52), and the values of difference between them were given in each application as a trimming value. After this calibration procedure, pink noises of different levels were presented from a loudspeaker, which we measured with each application on a mobile device and a class 1 SLM. In this test, we used an iPhone XS (issued Oct. 2018, iOS 13) and an iPad Air (issued Apr. 2019, iOS 13). As the dB Meter Pro and Decibel X are also available for Android devices, these applications were also tested with an Android tablet (Teclast P80X, Android OS 9) for reference. The results from both the mobile devices and class 1 SLM were plotted in a graph.
Figure 2 shows the results using an iPhone XS. As is observed in the figure, Decibel X showed the most accurate results: average error was 0.6 dB(A) and maximum error was 0.7 dB(A). The other two showed small but clear discrepancies. In the case of the dB Meter Pro, it only gave the measured values in integers, with no numbers given after the decimal. This was considered as the main cause of discrepancies. On the other hand, in the case of SoundLog, the trimming value was given by 0.5 dB steps, and this could be a cause of an error in the calibration. (Trimming value could be given in 0.1 dB steps in the dB Meter Pro and Decibel X).
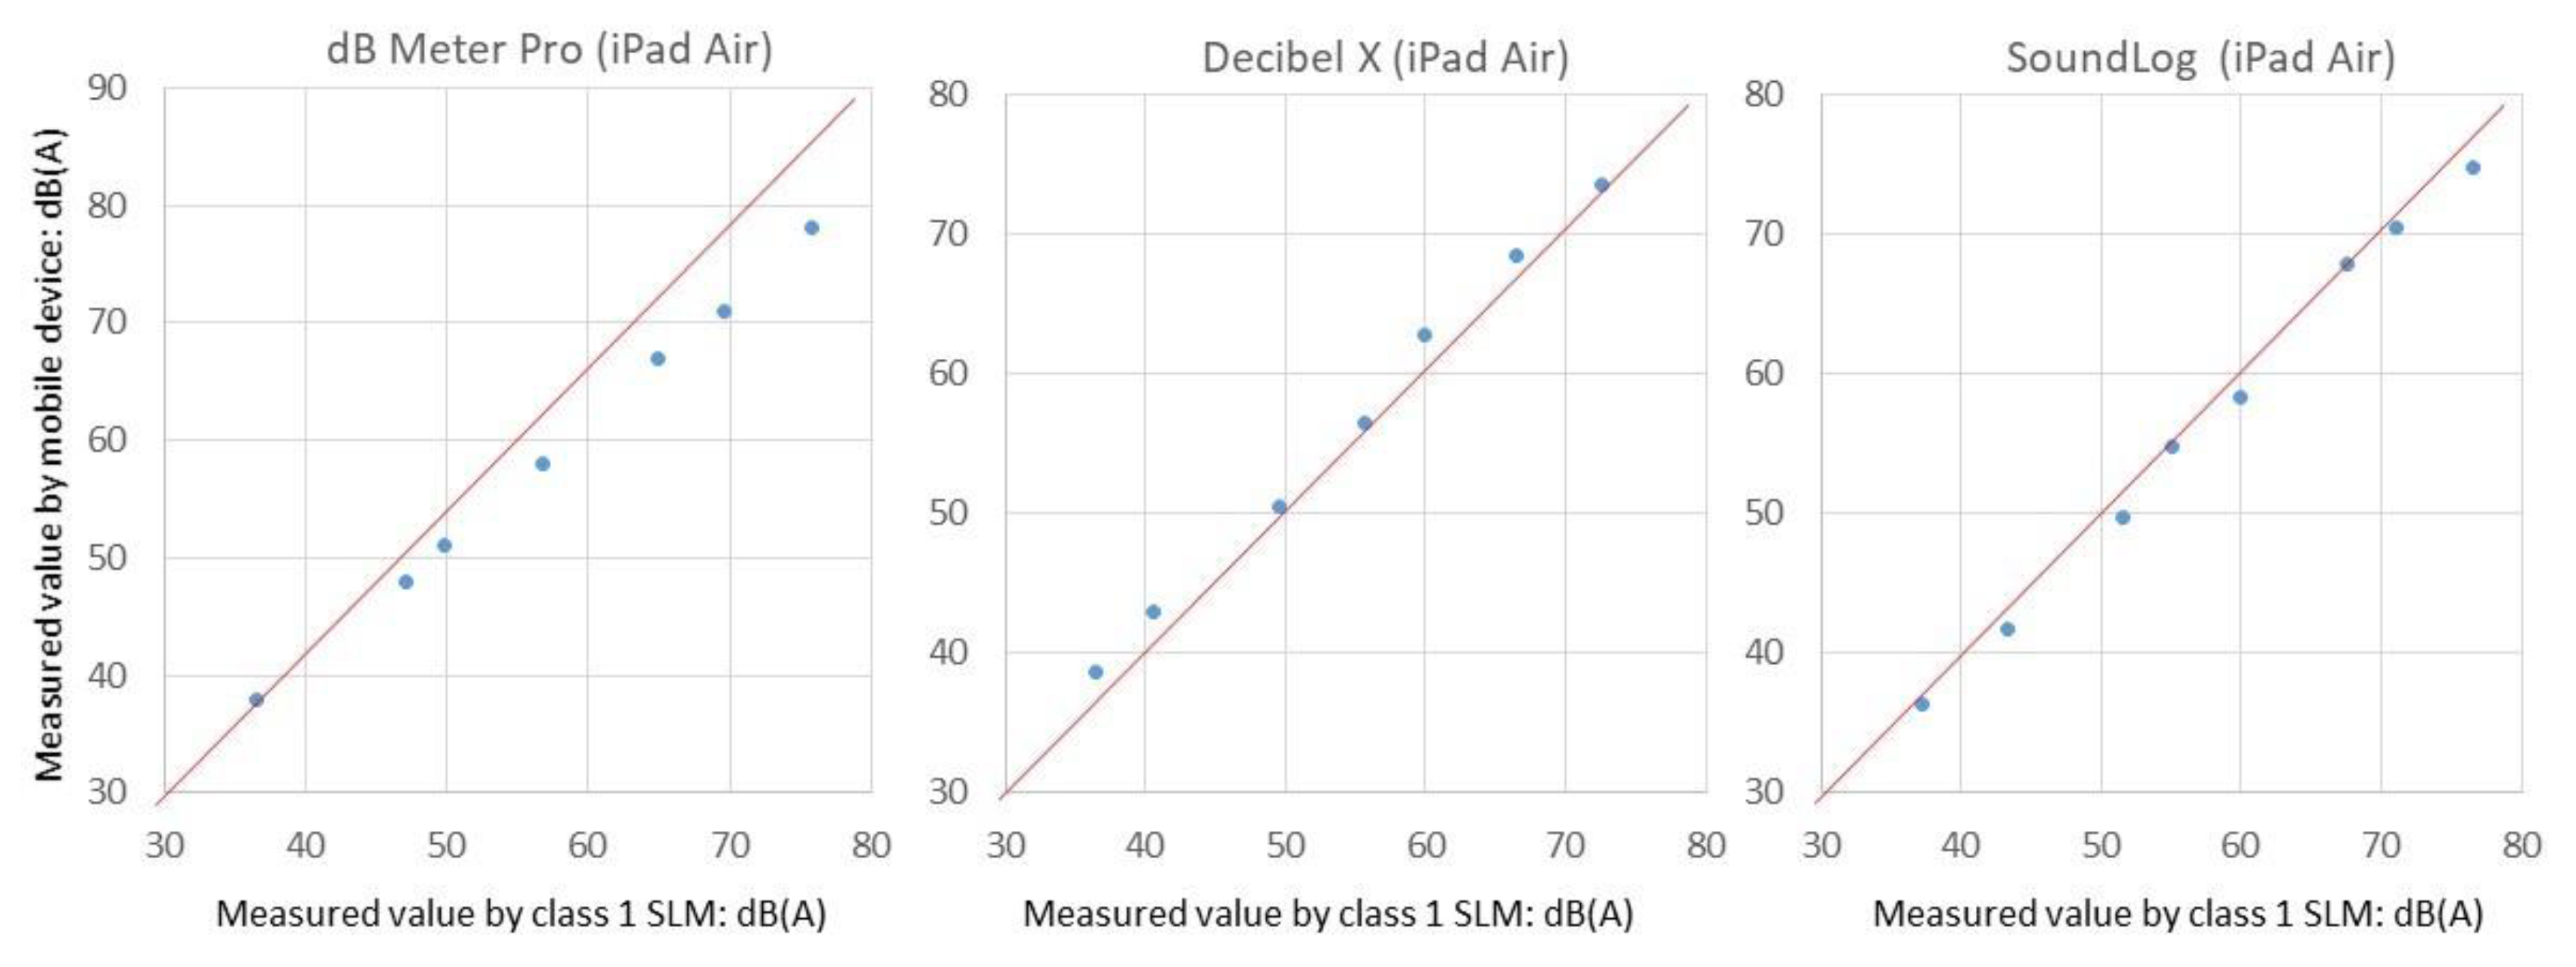
Figure 3 shows the results using an iPad Air. Although the tendency was the same as that of the iPhone XS, the discrepancies were somewhat larger. Similar results were obtained in our previous results in References [6,20,21]. As is pointed out in previous work, the accuracy of applications may become worse when they are used with iPads, and it depends on the version of the device [6].
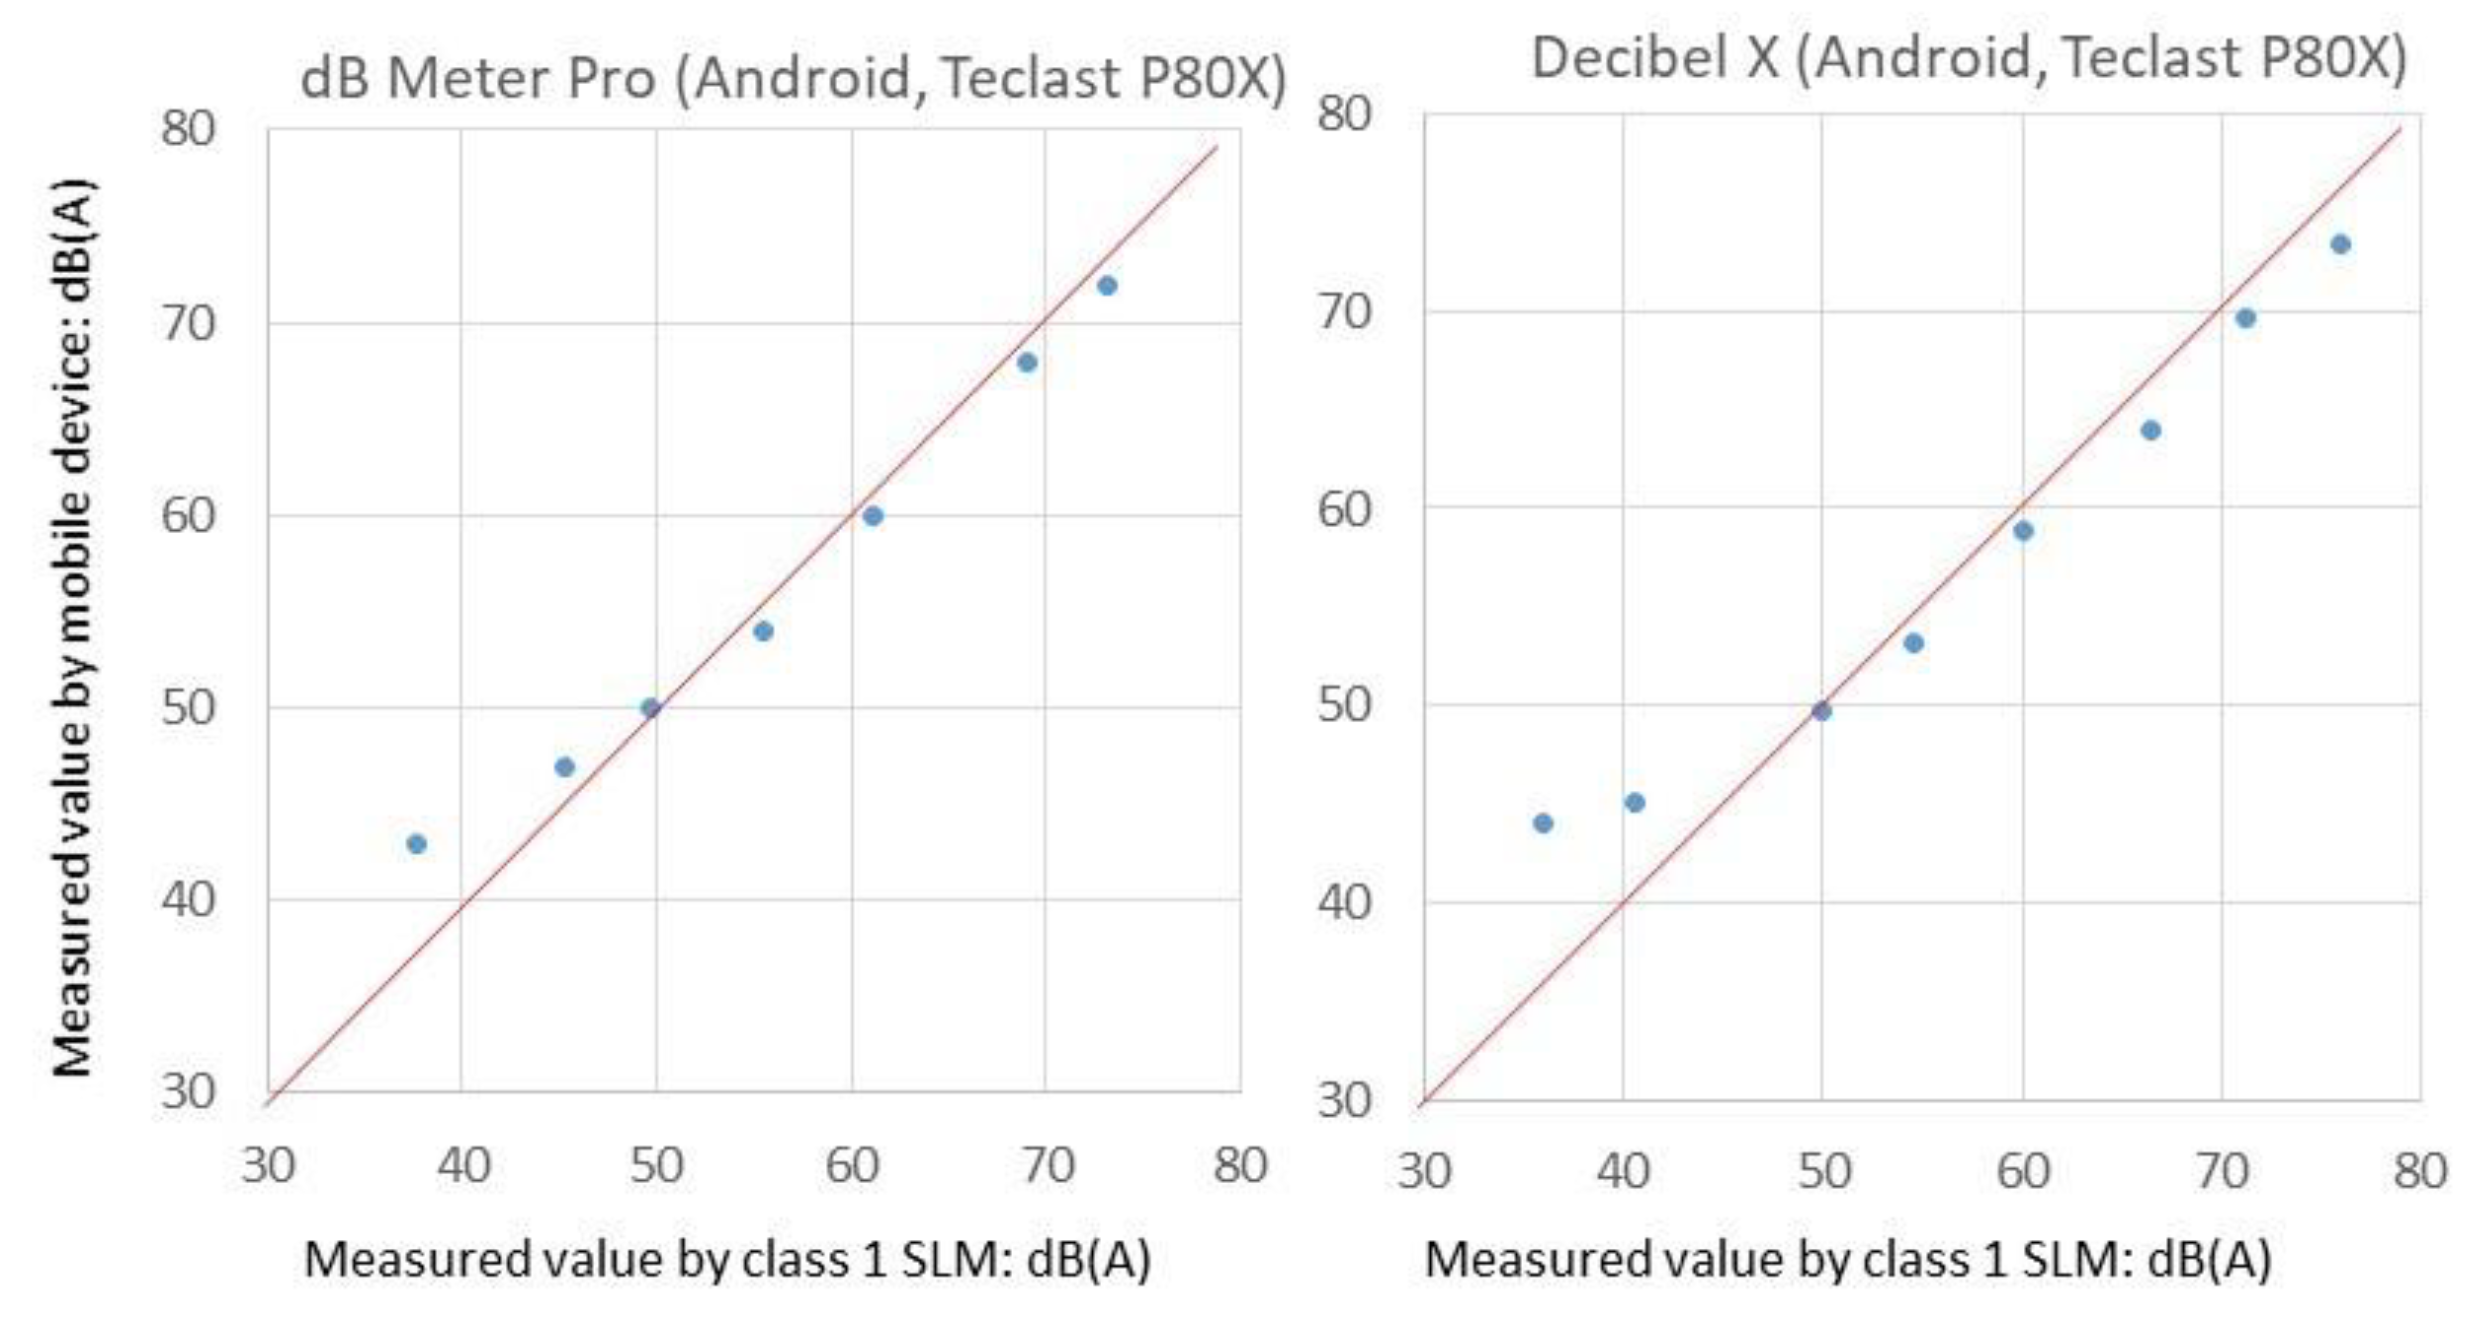
Figure 4 shows the results of an Android tablet P80X for dB Meter Pro and Decibel X (SoundLog is not available for Android devices). At middle to high levels, the discrepancies were smaller than observed in the authors’ previous study [6,21]; however, at low levels, the discrepancies were quite large (maximum errors: 5.3 dB(A) for dB Meter Pro and 8.2 dB(A) for Decibel X) and linearity was deteriorated. This was inferred to be attributed to the specifications of the device used in this test. Android devices are manufactured by various manufacturers; therefore, the specifications of audio hardware are different from type to type: some devices can be accurate but others may not be [21]. Another possible reason is the internal noise of the device; however, this was not confirmed. This should be noted when Android devices are used. Although the linearity was not good at low levels in this case, reversal of measured value was unlikely to occur, so Android tablets may be used, depending on the purpose, after careful calibration.
Based on these results, we decided to use an iPhone XS in the survey for making the following examples. As the results were limited to three devices that were issued recently, the test above was not intended to determine the best device. However, the conclusion in our previous work [6] comparing iPhones and iPads that the former was better in accuracy is supported. Therefore, it is always possible to use another mobile device, as long as its accuracy is checked beforehand and considered when the results are analyzed.
In the above, we checked the accuracy for measured values of overall A-weighted SPL of pink noise at various levels. This method does not give information about the frequency response of the devices or the built-in microphones. Regarding this problem, in our previous work, we pointed out that the accuracy deteriorated for 125 Hz [20,21]. However, for recent iOS devices, in Reference [6], we checked the frequency response by testing their accuracy using 1/1-octave band noises from 125 Hz to 4 kHz (considering typical frequency characteristics of environmental noise) and observed that the accuracy was almost independent on the frequency. From the results, we can infer that, as for iOS devices, the frequency response of the device is almost flat in the above frequency range or adjusted in applications to be flat. For Android devices, which is not used in the following survey, we did not perform such a detailed test. As mentioned above, Android devices are made by various manufacturers and the specifications are different for each model. Therefore, if testing frequency response is needed, it is possible to obtain a rough evaluation by testing the device using the method in Reference [6].

4. Examples and Suggested Usages

In this section, we present some examples of the outcome of the survey using the applications selected. Mainly, in the results, geo-referenced sound data obtained from the surveys are supposed to be organized on a map. In light of the principles of soundscape [2], perceptual comments should also be included; however, here, only the map with the sound data is presented, as it will be used, for example, in educational activities afterwards, for discussion where perceptual aspects will be exchanged. Therefore, the following examples will be assumed to be used for teaching material. Of course, it is possible to record perceptual comments during the survey by the surveyor, if needed.

4.1. Geo-Referenced Sound Data by the Selected Applications

The sound or photo/video recording function during SPL measurements in a field survey is expected to be helpful for checking the situation around each measuring point as well as for plotting the measuring points on a map later to arrange the measured results on a map. In this section, some examples are given of a map with geo-referenced sound data using the applications with such functions.
Here, three examples are given of geo-referenced sound data arranged on a map from the data measured whilst walking on the determined route (similar to a soundwalk) using the three applications with GPS, sound-recording, and photo- and video-taking functions. 
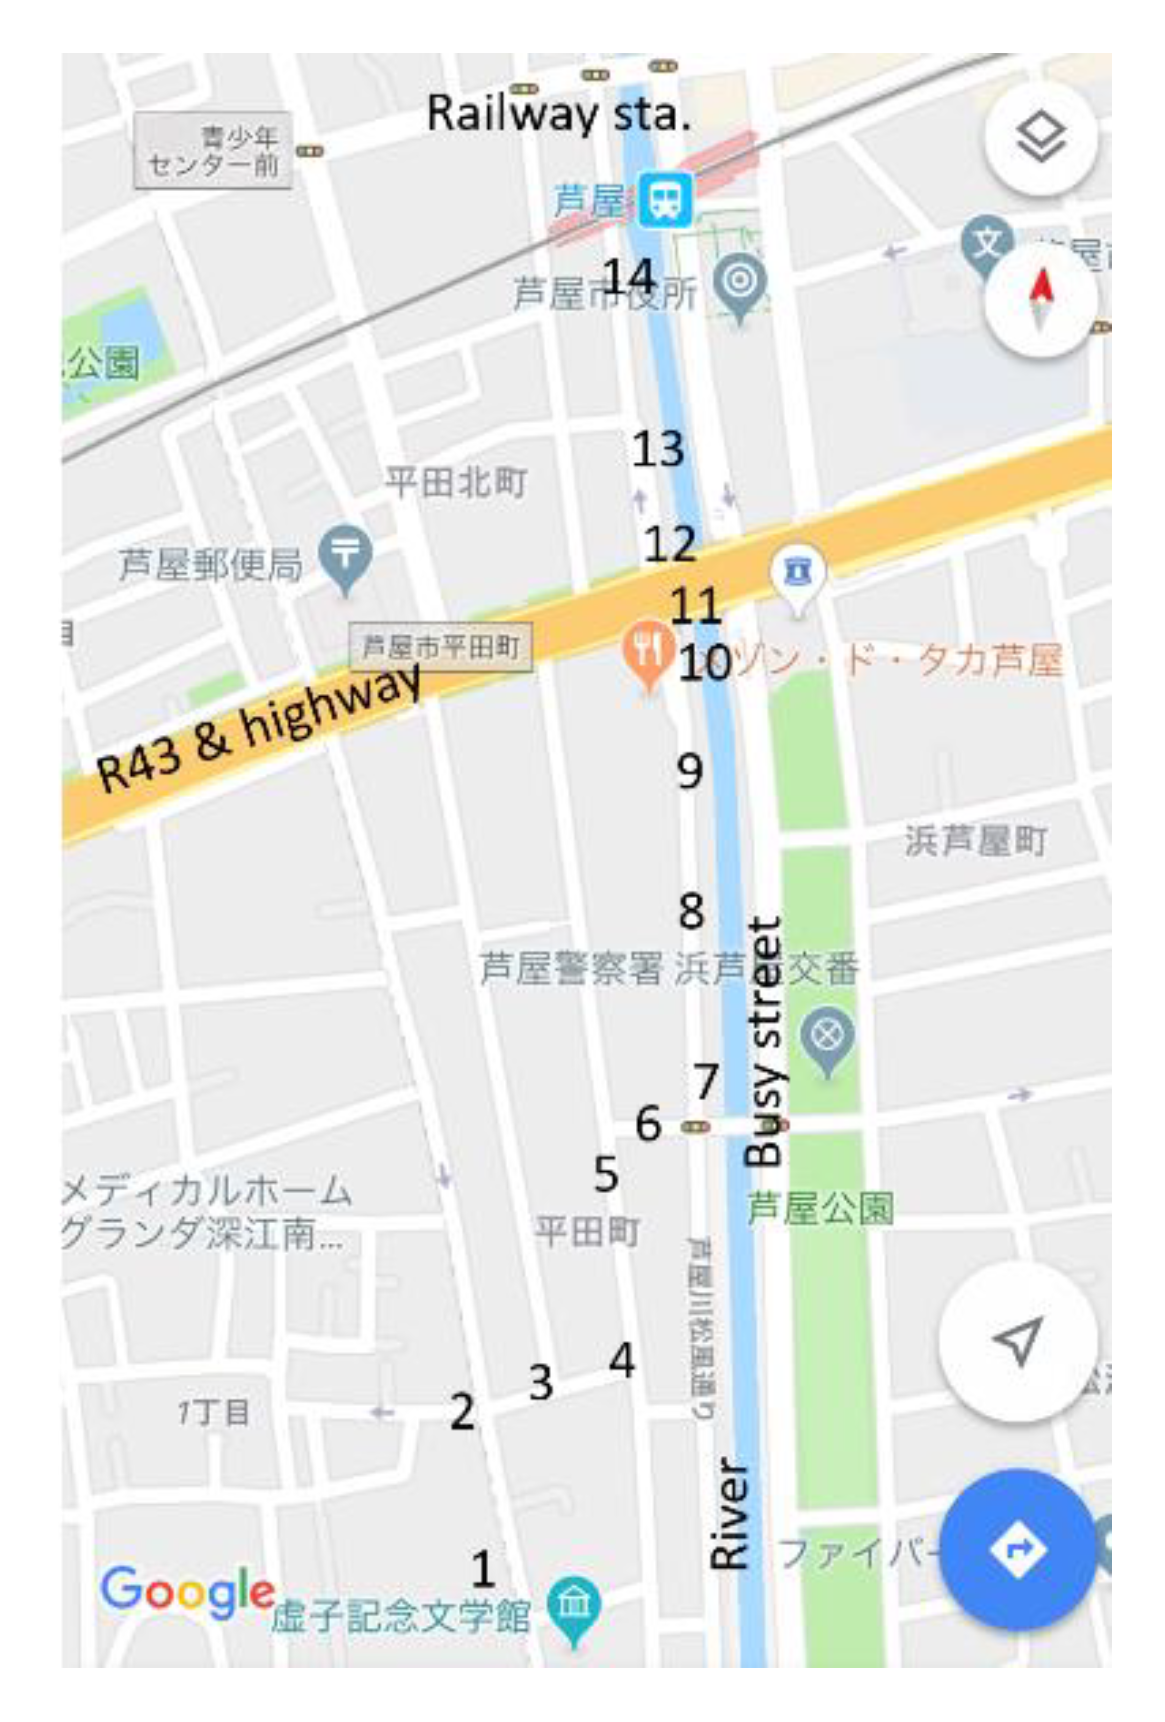
Figure 5 shows the course of the trial sessions. In a preliminary walk, measurement points were determined (Points 1–14). This area is moderately urbanized and is mainly a residential area. There is a railway and busy traffic as indicated in the map. The following examples are not made from data taken on the same day but on three different days. For the measurements, an iPhone XS (issued 2018, iOS 13) was used throughout and applications were calibrated beforehand.
The surveys were performed on calm days to avoid the effect of the wind, and also, we checked that the effect of wind noise was negligible before the surveys.

4.2. Example with Measurements by dB Meter Pro

This application records sound and GPS positioning data during SPL measurements, and the data can be exported as PC compatible files as well as screen shots. GPS data can be helpful to record the location of measuring points. The recorded sound can also be played by the application on the mobile device. This function helps to check the type of sound source; overall impression of the acoustic environment; and the location of the measuring point after the measurements at the laboratory, classroom, etc.
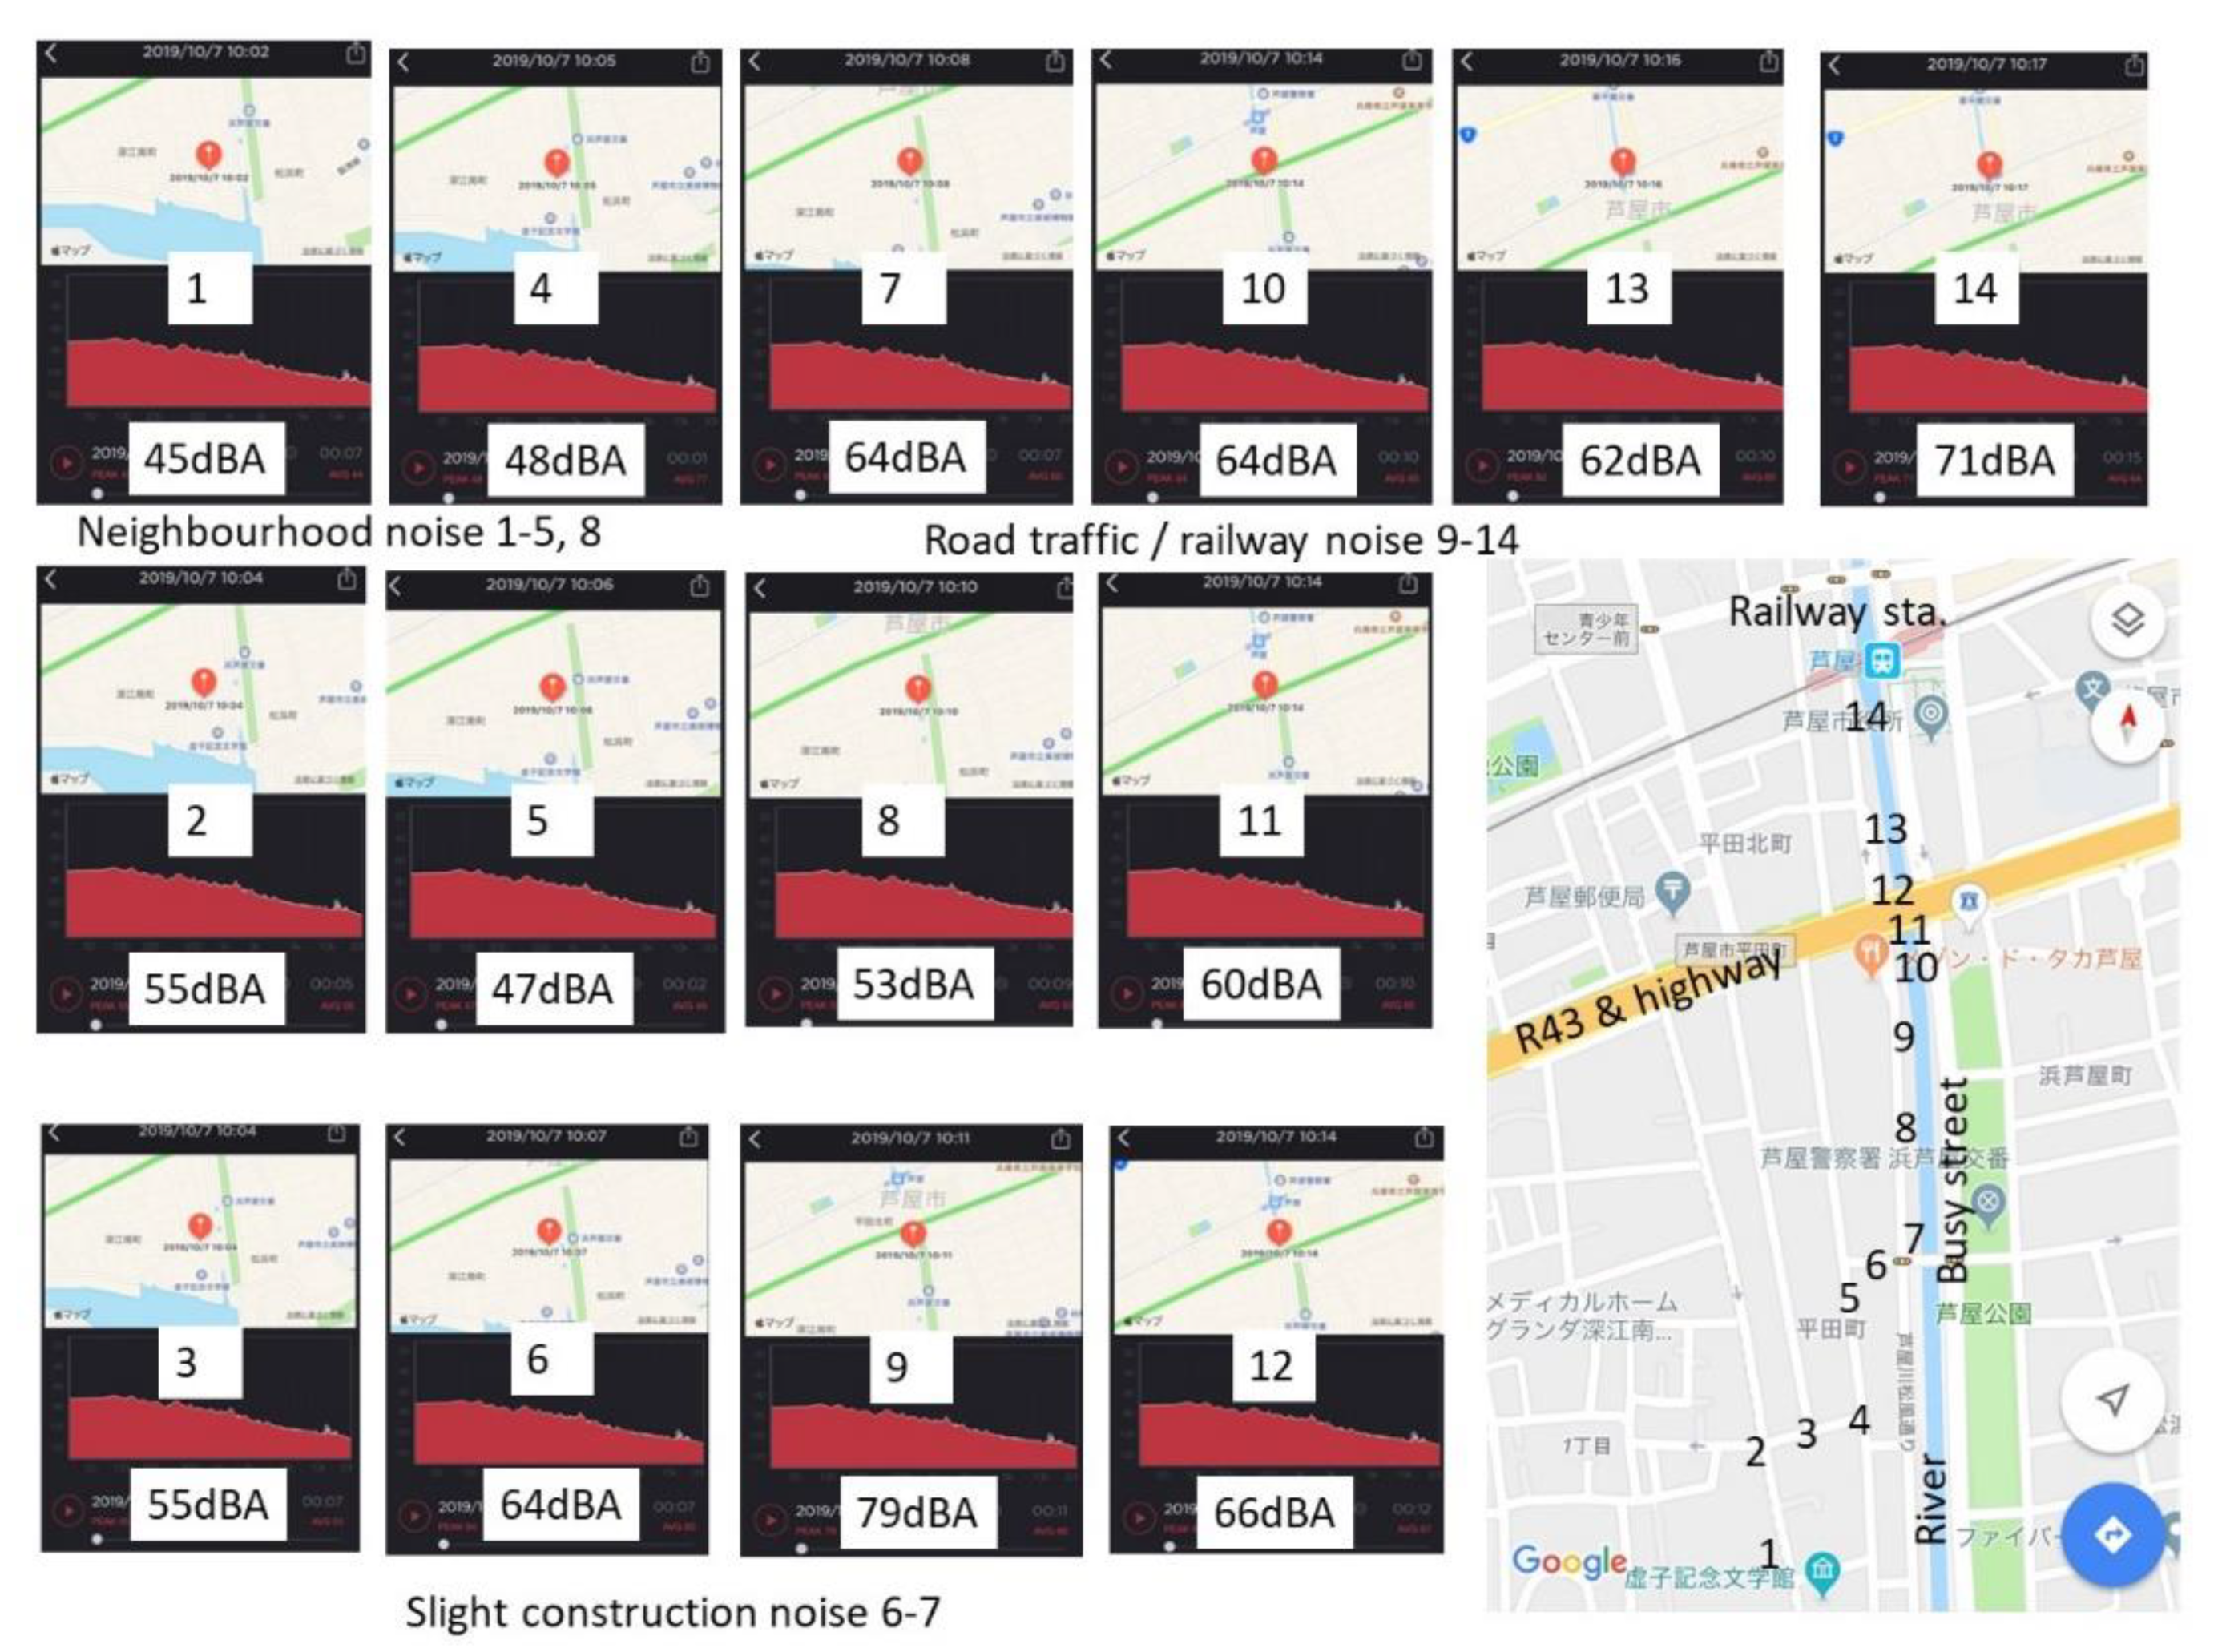
An example of a map with geo-referenced sound data of the above area made with the data taken by dB Meter Pro is shown in Figure 6, with the measured value of the peak level of A-weighted SPL with slow time constant (dB(A), slow, peak). The screenshots of the data at each point are displayed on the map: on the top, GPS data are shown on the maps; in the middle, red graphs show the power spectra; and the measured value of peak and the average and max SPL are indicated in the bottom with the playback button.
After the measurements, by playing back the recording at all points, the source type and cause of the noise were checked. Points 1–8 were in a rather quiet residential area, although SPLs at points 6 and 7 were higher. By playing back the recorded sound, it was confirmed that these higher levels were due to noise from a construction site near these points. Furthermore, the main type of the noises at points 9 to 14 was confirmed to be traffic noise, and especially at point 9, the level was very high, which was confirmed as coming from a car that passed by during measurement. The high level at point 14 was also identified as a mixture of car noise and railway noise from a train approaching the station. In this way, playing back the sound recording was helpful and useful to organize the measured data.
One problem is the accuracy of GPS data: the locations of points 9–12 were rather difficult to discriminate, and errors could be observed when compared with actual points indicated on the map. There were also some deviations with others points from the actual positions observed. In this measurement, the smartphone used was connected online using a 4 G (LTE) network (no Wi-Fi connection was available.) In this case, some errors were observed in GPS data, for example, in some cases, if one moved a few meters with the device while taking measurements, GPS data could not be obtained at all.
When GPS data are not required, it is of course possible to measure SPL as one walks while recording the sound. This may also be used for a method “to collect sounds” as the application records SPL and time, which can be exported as a csv file; therefore, one can trace back the SPL at some point by using these data if time is also put down on a notebook by the experimenter during a measurement.
Finally, this application shows the sound power spectrum, which may only give the outline of spectra, but it may help to see which frequency range is dominant.

4.3. Example with Measurements by Decibel X

This application has a distinguishing feature in that it can take photos or videos whilst measuring SPL. A photo taken by this application includes the measured SPL and the address (only the name of city in the iOS version but detailed street address in the tablet Android version) of the measurement position suggested by GPS (note that raw GPS data are not displayed or recorded). Therefore, just looking at a photo reminds the surveyor of not only the measured SPL but also the position where the measurement was carried out. The record of the name of city is not sufficient, but photos can provide detailed information about the measurement position. By taking a video instead of still photos, one can also listen to the sound and see the situation around the point after the measurement, which is helpful for checking measured sound level data as well as the visual environmental conditions of the point.
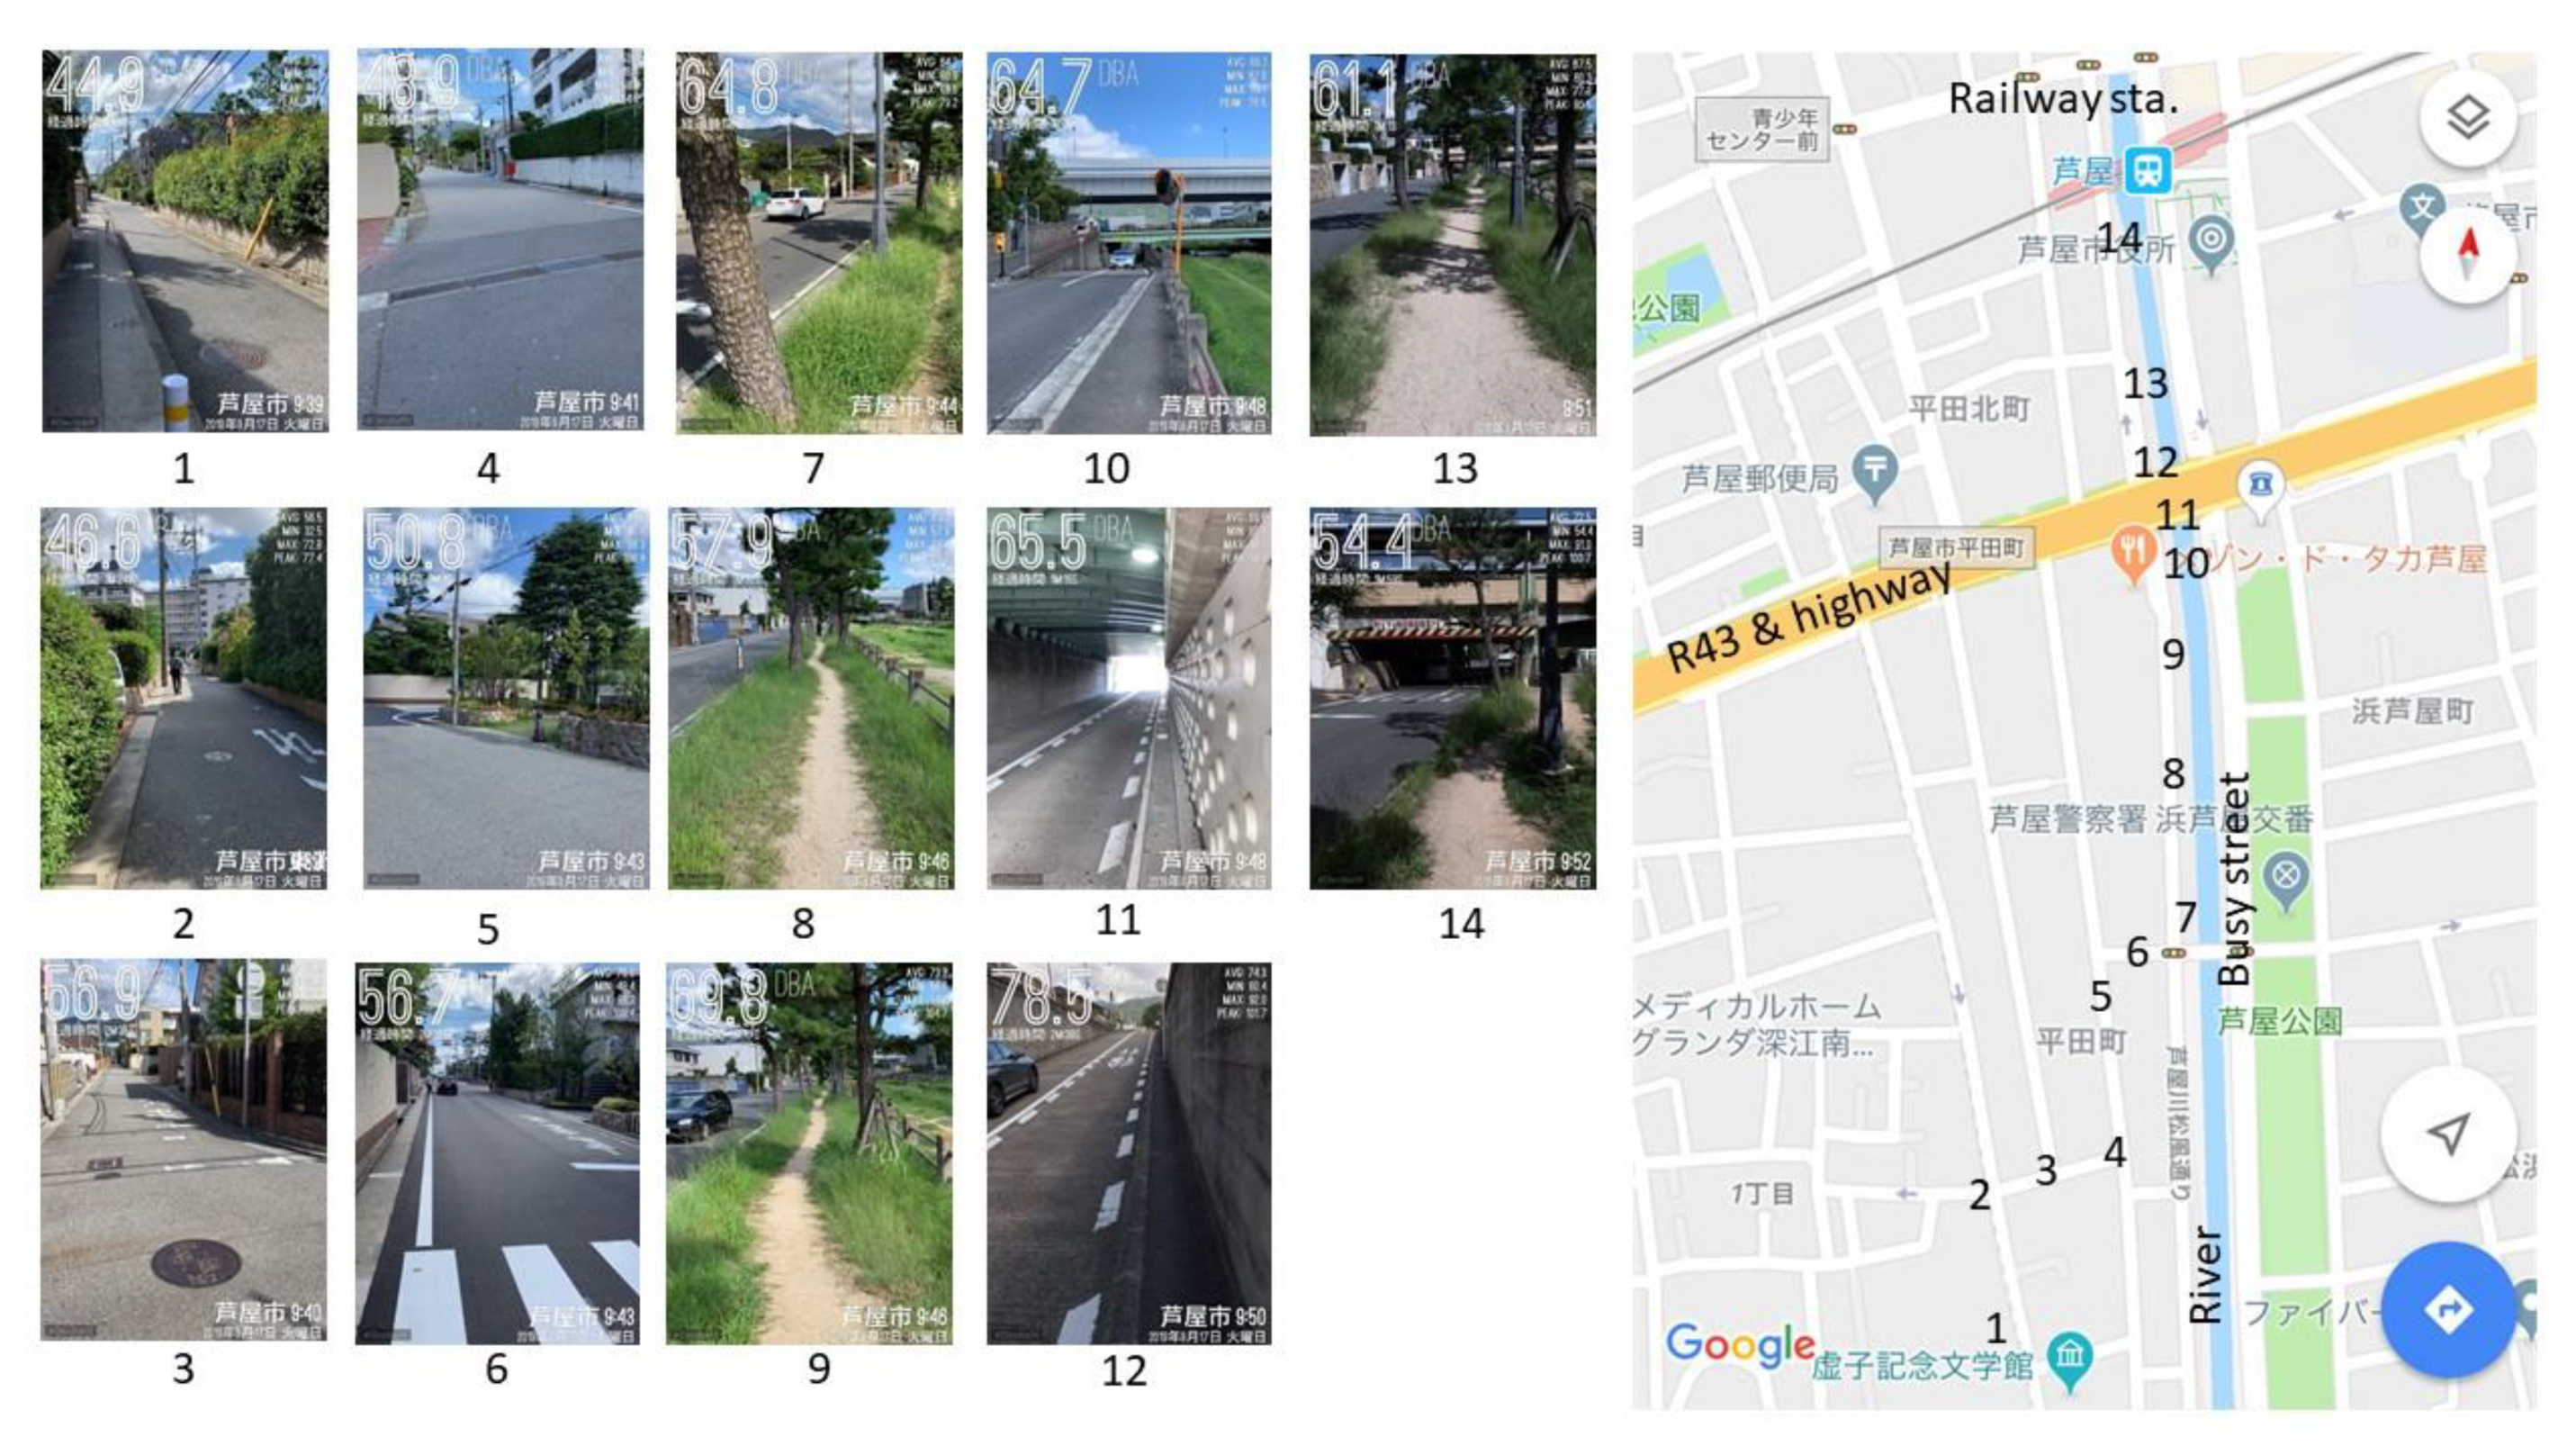
An example is shown in Figure 7. Looking at the figure, one can understand the situation around each measuring point with photos taken there. SPL and location, which were also measured, are indicated in the photos. The photos are quite useful to confirm the measuring point.
Interestingly, the photos of points 7 and 8 visually include the most greenery, but the SPLs were rather high. This was due to the road traffic noise from the busy street along the river. In this way, visual information from photos offers interesting opportunity for discussion in a classroom when used for educational purposes and is also usefully employed to better understand the environment of the area.
In this example, only the name of the city was given in the photos, as the smartphone version was used, but in the tablet version, detailed street addresses are printed in the photos, which is helpful to confirm the measuring point.
This application also shows the sound power spectrum on the main screen, but it may not be seen when the application is used in the photo-taking mode.

4.4. SoundLog

This application neither records sound nor takes photos or video, but the display measures Leq(A) every minute as a time history. The graph showing the measured results is rather rough and intuitive; therefore, this application is not suitable for quantitative surveys. However, the graph shows variations of temporal fluctuations of Leq(A).
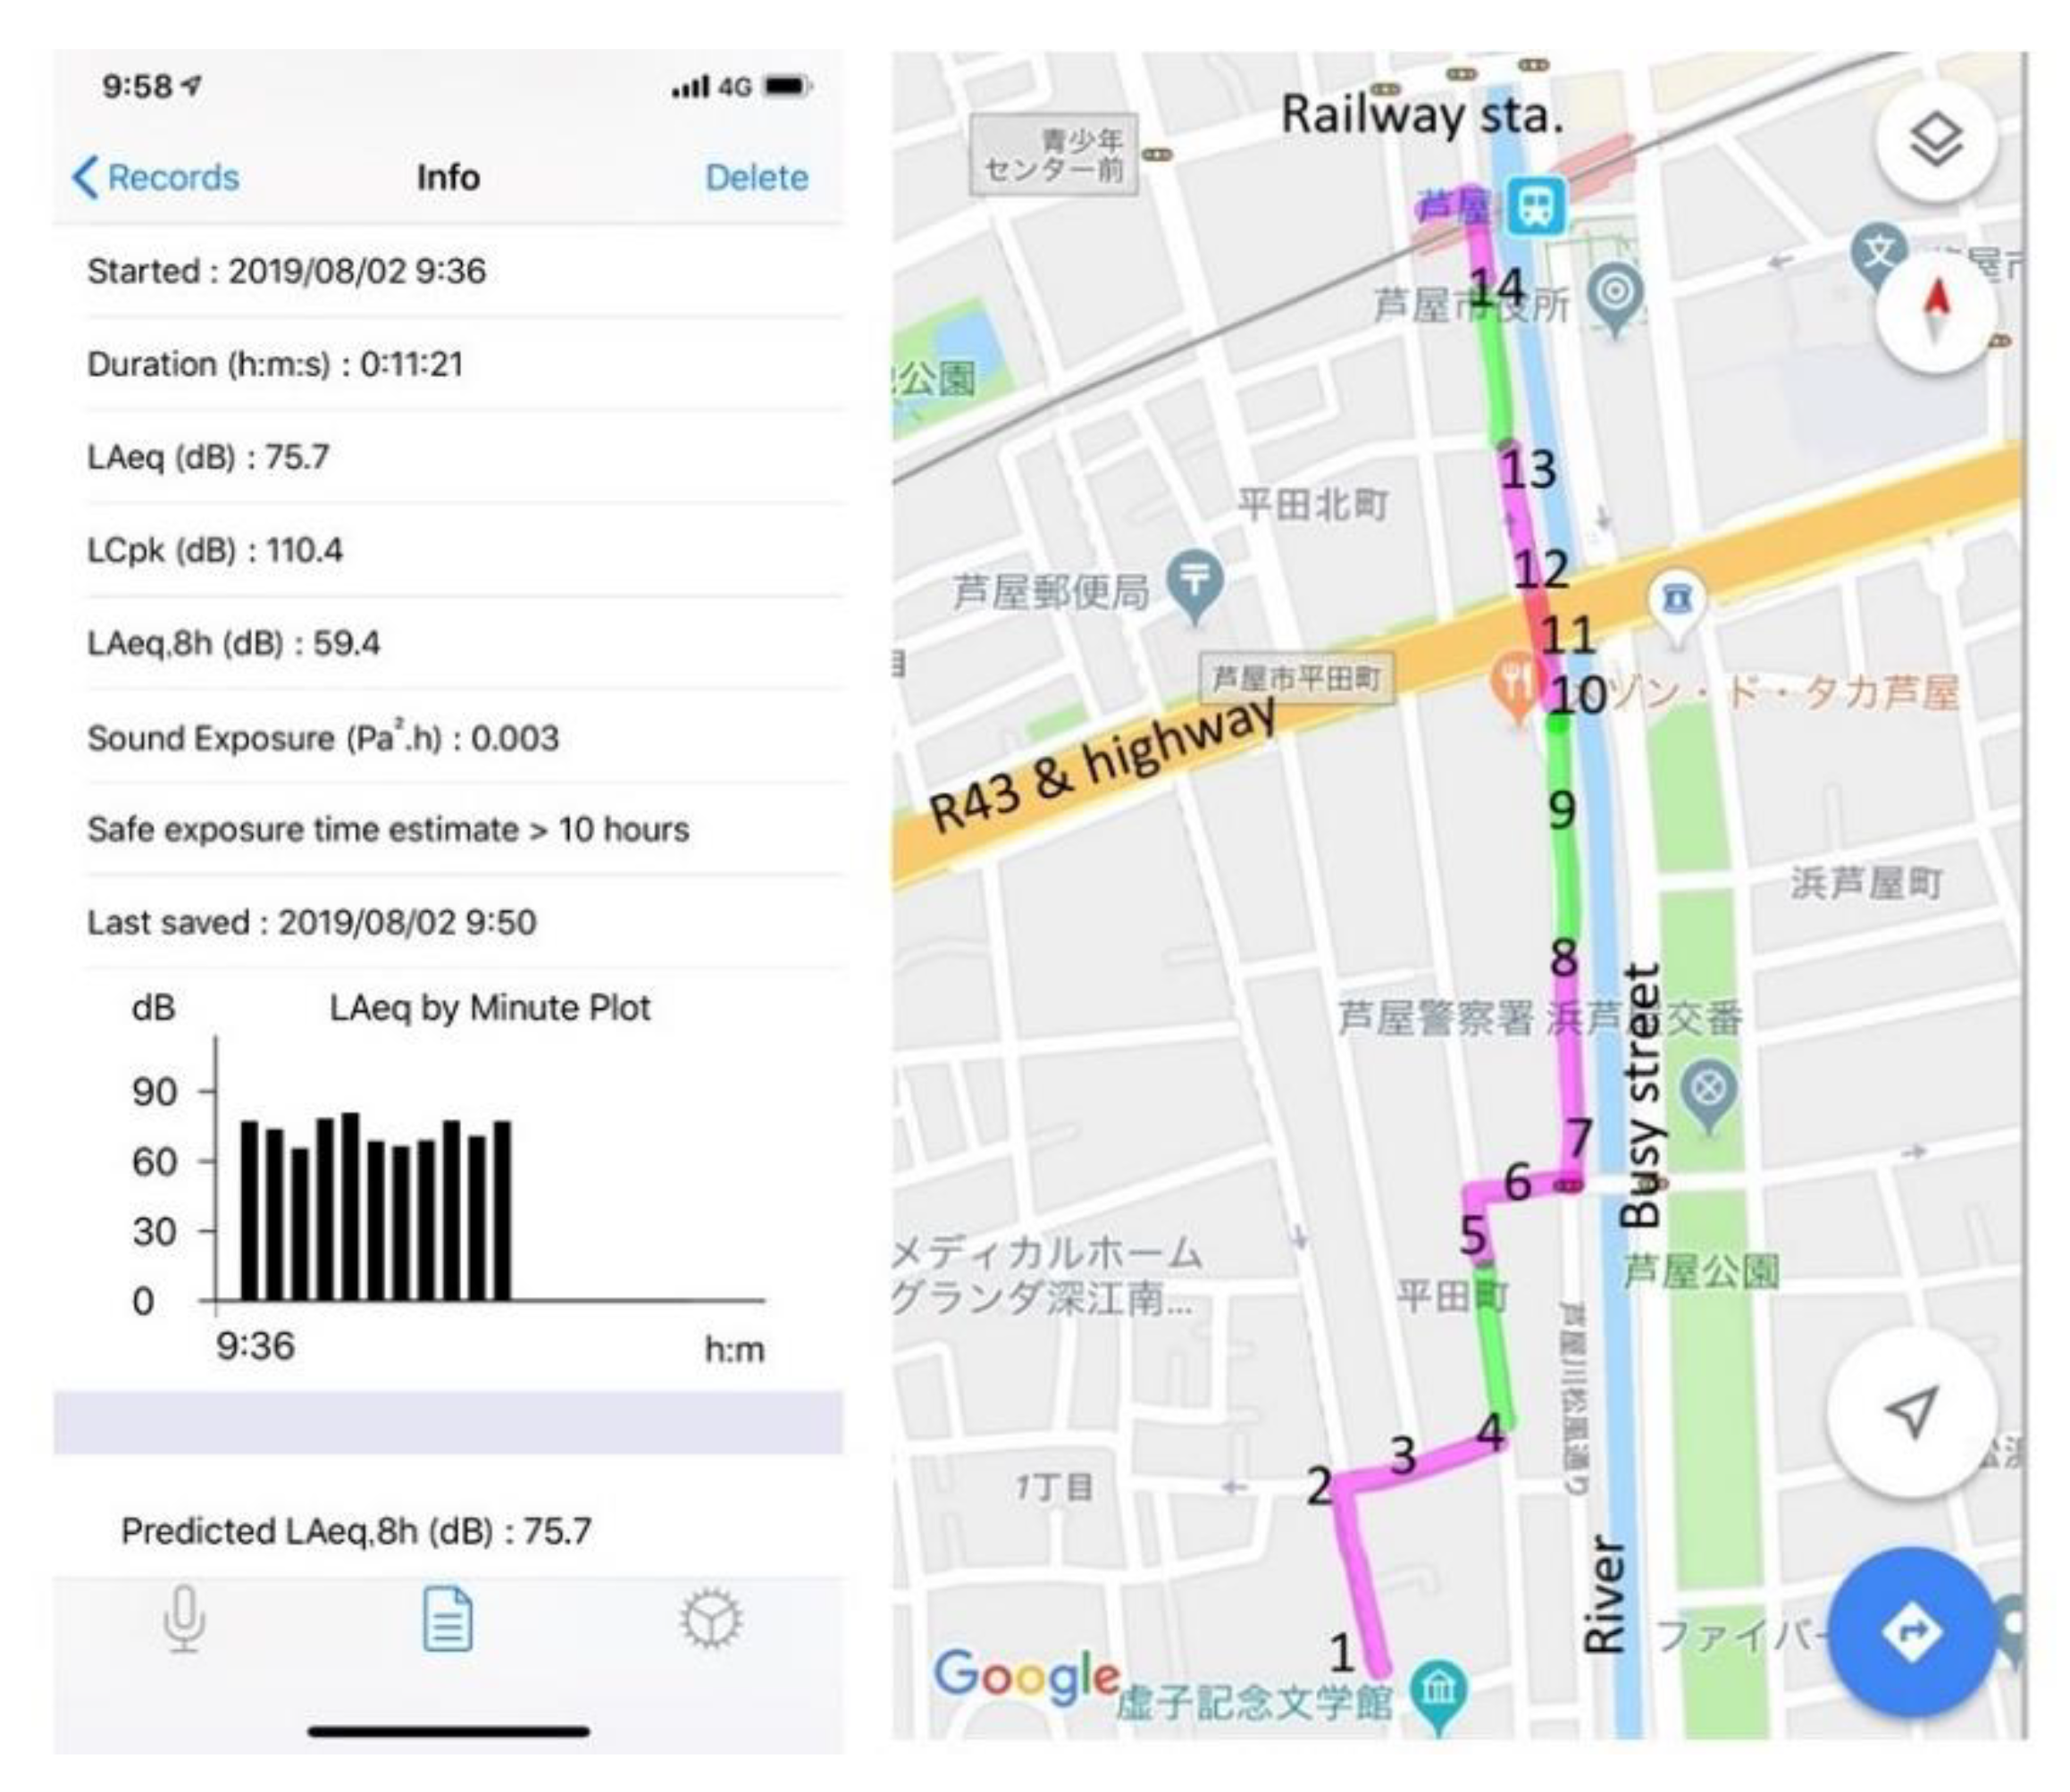
An example of a map with geo-referenced sound data using this application is presented in Figure 8. In this survey, this application was running whilst the surveyor was walking through the course and the time at each measuring point was noted on the map by hand. In this way, the geo-referenced sound data are arranged in the map. This map could provide a rough distinction of a “quiet area” and “noisy area”. In this map, the pink zone indicates the area with Leq(A) larger than 70 dB (A) and it was identified, by on-site observations, that the cause of such a high SPL was the sound of cicadas: this survey was performed on a very hot day in midsummer, and there were many cicadas on the trees around the course. Information like this provides a topic for discussion on the “attitude” towards various sounds afterwards in a classroom.

4.5. Fixed Point Observation

In the above, examples of maps with geo-referenced sound data by soundwalk-like methods with mobile device are presented. Another method to be considered as a use of these applications is fixed point observations, in which a surveyor takes video, sound recordings, etc. while measuring sound levels several times at the same point. In so doing, one can see the change of sound levels as well as changes in sound sources and situations around the point.
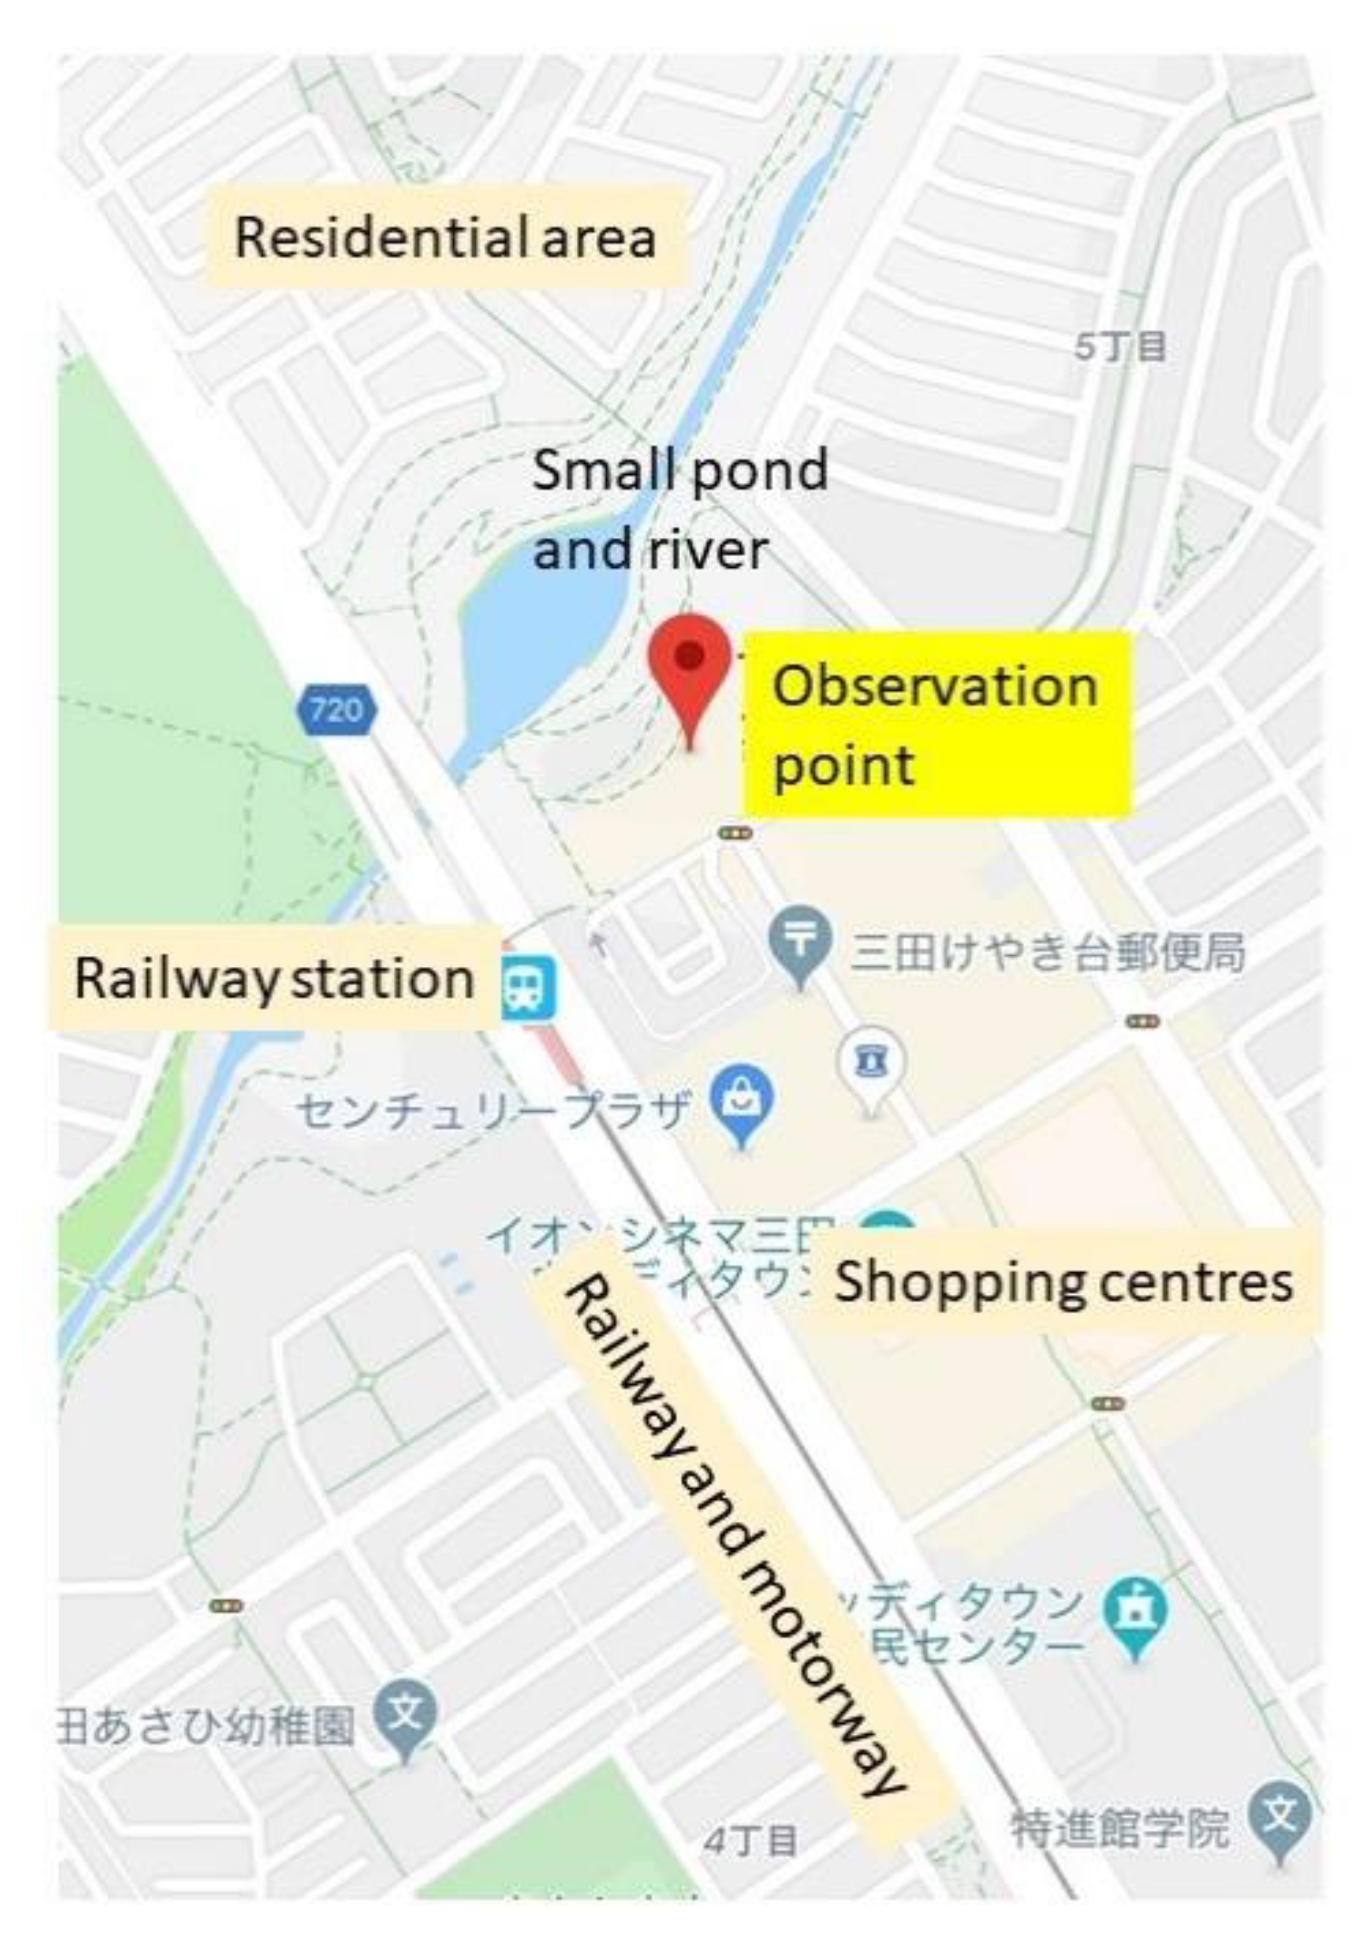
Here, an example of a fixed point observation using Decibel X is presented. In this trial, videos were taken during measurements at the same point indicated in the map shown in Figure 9. The duration of the video was 10 s.
The observation point was on the balcony of a room on the sixth floor of a six-storey building in Sanda city, Hyogo prefecture, Japan, which is in the suburb of Kobe city. This hotel is surrounded by a park and car parking, and there are no tall buildings near it. It is a rather new residential area with mainly two-storey houses.
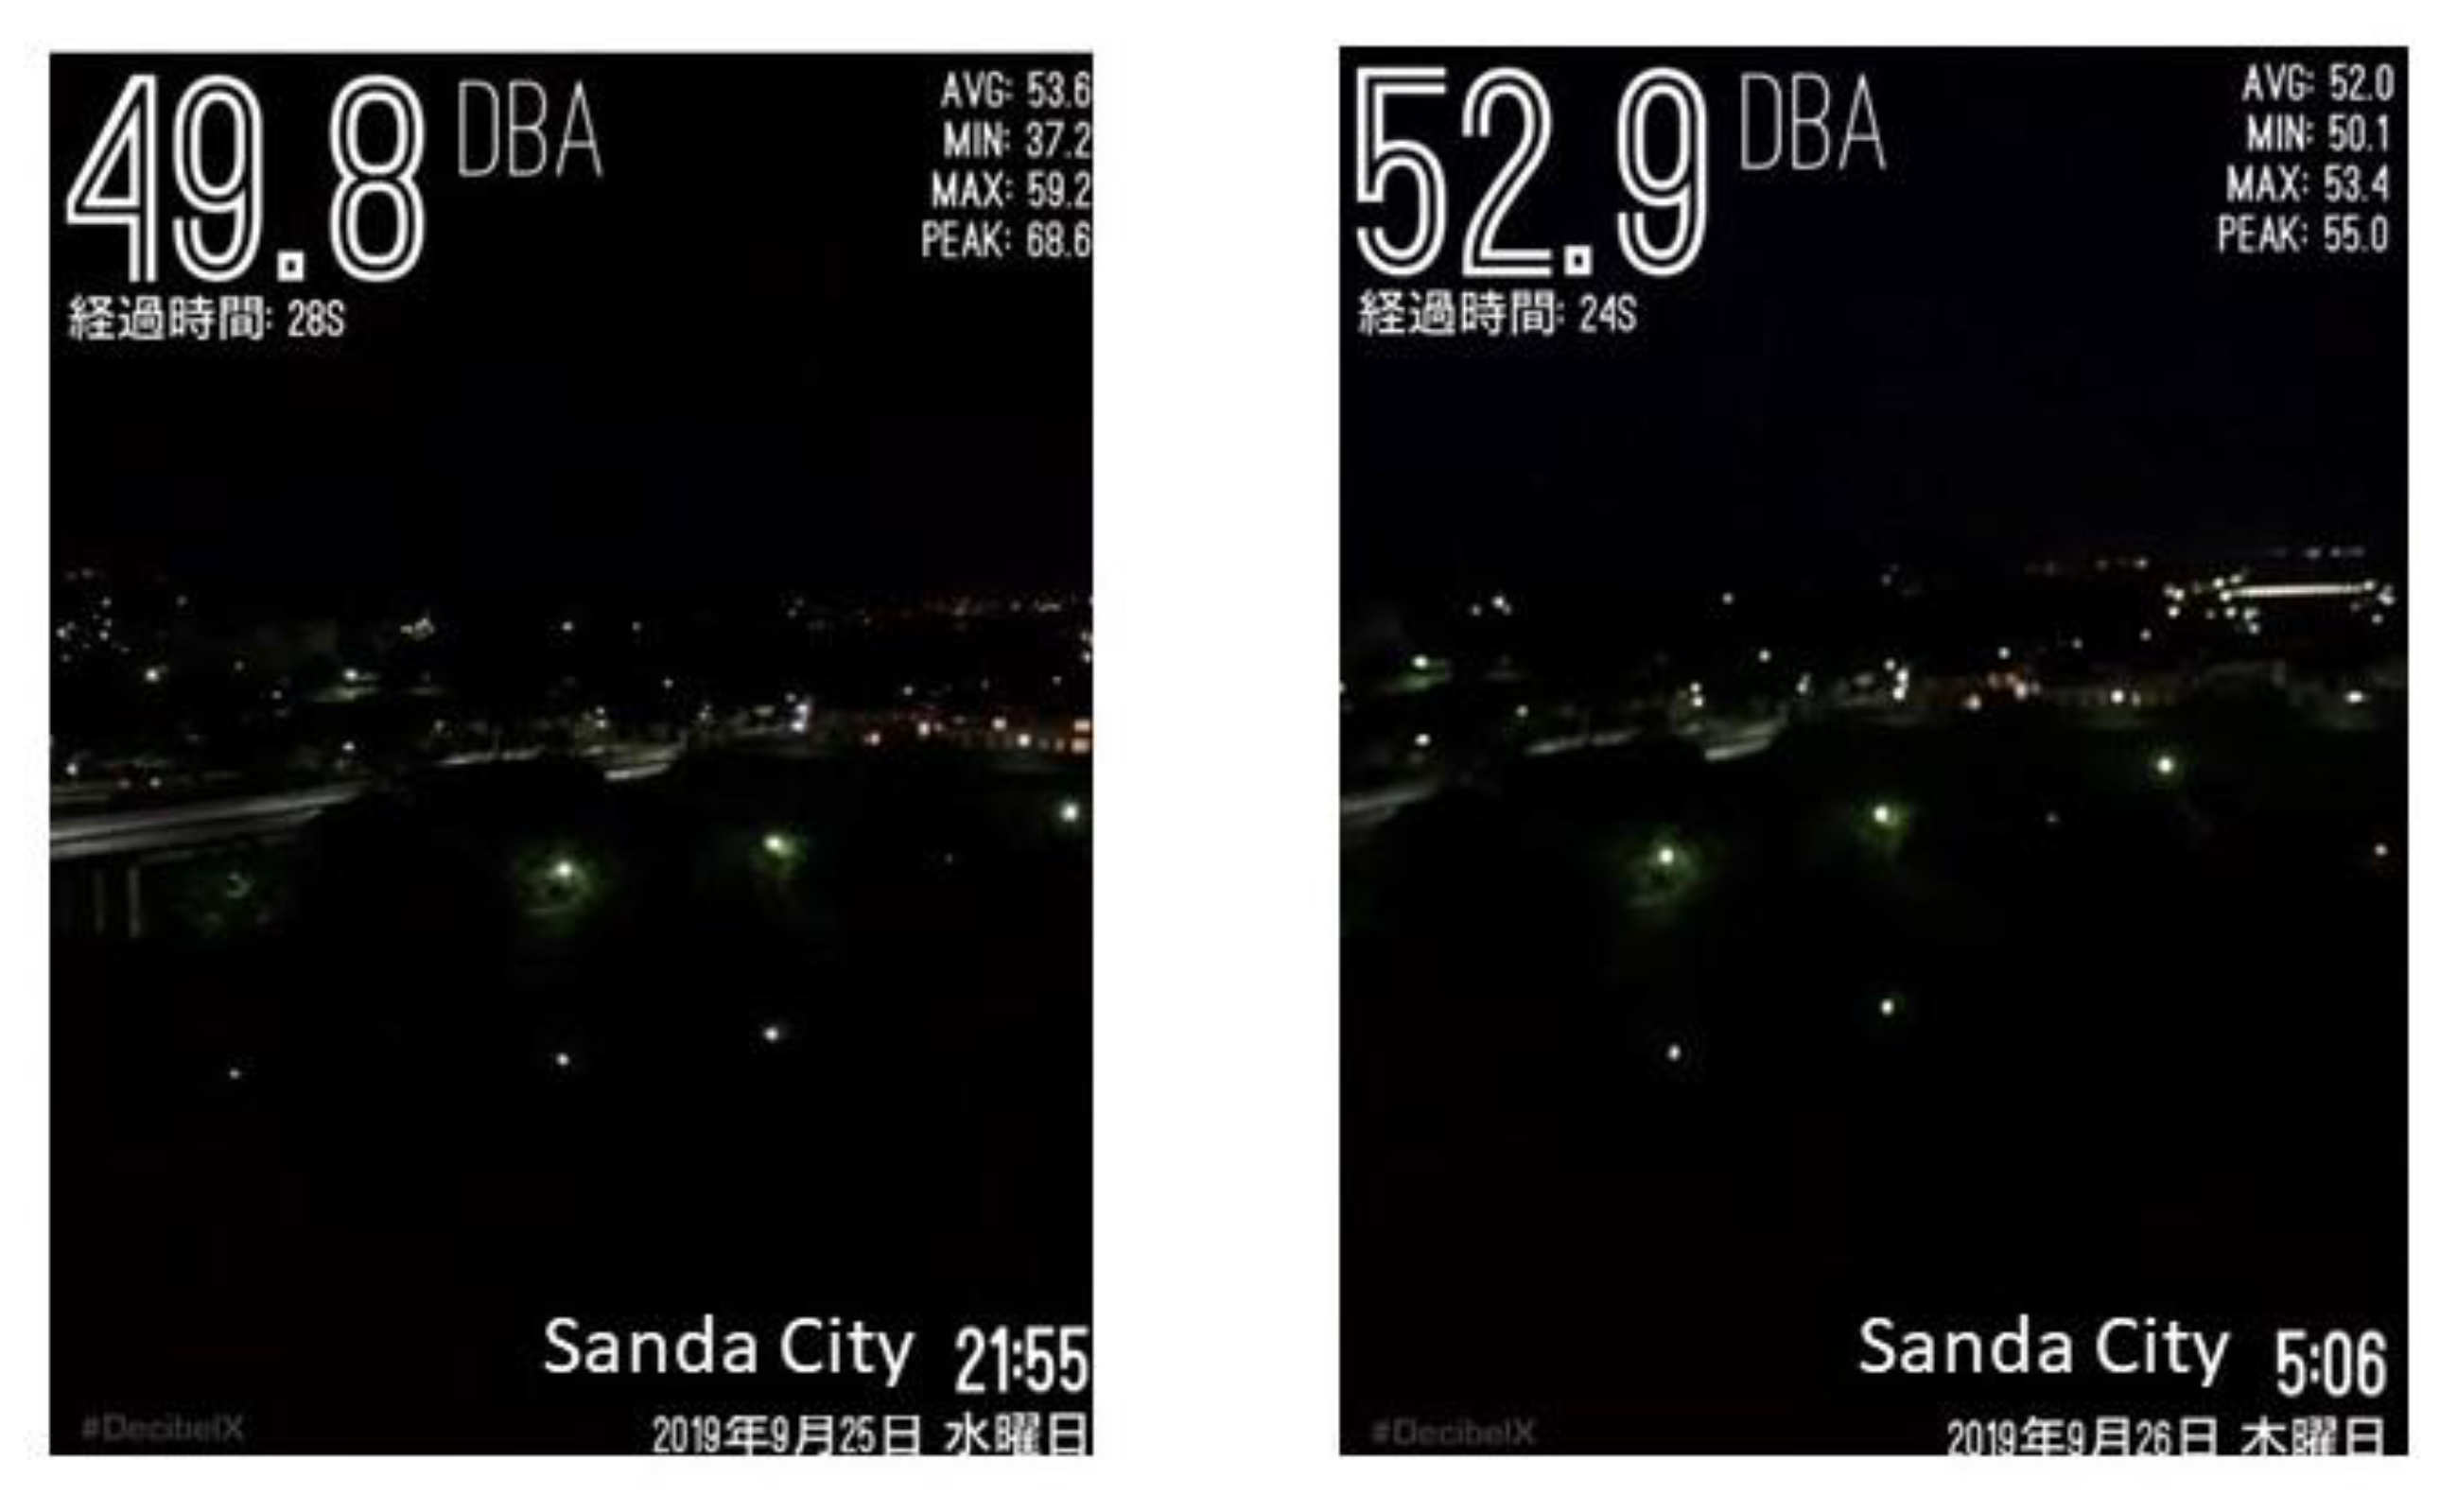
The examples of the snapshots from the videos taken at the observation point are shown in Figure 10. One was taken at night (21:55), and the other was taken in the early morning (05:06). In the night, a few cars passing by were observed but the sound level was lower. The main sound source was the sound of insects, which was at almost a steady level. In the early morning, cars were rarely passing and no car was observed during this measurement. However, the sound level was rather higher. This was also the sound of insects, but comparing the sounds of the two videos, it was understood that the sounds were different. In the early morning, the different types of insects caused characteristic sounds and the sound was relatively greater than in the night. The videos were short but long enough to perceive these differences.
In this trial, only two samples were taken as this area was basically quiet and few other sounds were detected. However, it gave us some more findings compared with, for example, busy areas with various sounds. Although the device used could take only 10 s of video, taking video offers various applications for educational purposes. As mentioned above, the “Pro” version can take longer videos, which should be useful for more detailed surveys.

4.6. Summary

In this section, the examples of a map with geo-referenced sound data are elaborated, using the measured data of SPL as well as some additional data such as recorded sound, photo, video, and time history provided by mobile device applications. Arranging geo-referenced sound data on a map can be done without those additional data, but those data can be useful information for confirming the situations around measuring points, checking main sound sources, etc.
Additionally, they provide good opportunities for further discussion in the field of education. Not only using these applications but also simply taking videos by built-in cameras in devices to collect sound samples are useful for sound education programmes, e.g., one with sound quiz or group discussion activities as reported in References [16,19]; when there is a need to combine SPL measurements, an application such as Decibel X (Pro) will be an alternative for the programme. As for the sound spectra presented by dB Meter Pro and Decibel X, they can be used to “see” the frequency component of the sound in some cases. In this way, the application can be used in multisensorial environmental education and surveys [34].
Regarding GPS data, the accuracy is often somewhat problematic, mainly because of the latency caused by various factors [35], including position of mobile phone base station. There are studies for elaborating the system to overcome the latency, for example [36], and may overcome this problem in the future.
In this way, mobile devices can offer various possibility for sound education, especially urban acoustics education, for both primary/secondary education and engineering-oriented higher education, depending on educators’ ideas and teaching plans.

5. Concluding Remarks

In this paper, some examples of geo-referenced sound data arranged on a map with additional information such as recorded sound, photos, etc., using mobile devices during soundwalk-like activities, are presented. Three commercial applications, which are easily available, are tested for their accuracy and usability, and they are actually used in the above experiences.
Each application has a significant feature; therefore, users are advised to choose one of them considering the function necessary for their educational programme or purpose of the survey. For example, if the sound recorded with measured SPL is needed, one with a sound-recording function is suitable, but if visual information of the situations around the measuring point is of interest, one with photo- and video-taking functions is also available. In this way, various programmes for education of urban acoustic environments can be organized.
As the methods and usages presented in this paper are not only limited to outdoor environment surveys, they can be also applied to indoor acoustic environment surveys with sound collecting activities, which may be necessary in primary or secondary education as well as engineering-oriented higher education institutions.
In this work, we used applications to measure physical values only, and collecting perceptual data was either done while the measurement used a field book or played back the recorded data afterward to discuss. In order to develop more elaborated educational activities, it is desirable to include a function to collect perceptual data, even a simple note or comment. Therefore, more integrated applications collecting also perceptual data, such as Hush City [27] or Noise Capture [28], will be in demand for educational purposes as well. This will be one of the future tasks.

Author Contributions

Project design, survey and analyses, and draft writing, K.S.; data analyses and draft editing, F.S.; data analyses, A.O.

Funding

This research received no external funding.

Acknowledgments

The authors are indebted to Francesco Aletta for his constructive comments and support for this work.

Conflicts of Interest

The authors declare no conflict of interest.

References

  1. Research Committee on Education in Acoustics (Acoustical Society of Japan). Report of questionnaires on education in acoustics and survey in syllabus in Japanese universities. J. Acoust. Soc. Jpn. 2009, 65, 264–269. (In Japanese) [Google Scholar] [CrossRef]
  2. Schafer, R.M. Tuning of the World; Knopf: New York, NY, USA, 1977. [Google Scholar]
  3. Schafer, R.M. A Sound Education; Arcana Editions: Douro-Dummer, ON, Canada, 1992. [Google Scholar]
  4. Schafer, R.M.; Imada, T. A Little Sound Education; Arcana Editions: Douro-Dummer, ON, Canada, 1996. [Google Scholar]
  5. Ishii, A. Soundscape and environmental education. J. Acoust. Soc. Jpn. 1996, 52, 800–804. (In Japanese) [Google Scholar]
  6. Sakagami, K.; Satoh, F.; Omoto, A. Revisiting Acoustics Education Using Mobile Devices to Learn Urban Acoustic Environments: Recent Issues on Current Devices and Applications. Urban Sci. 2019, 3, 73. [Google Scholar] [CrossRef] [Green Version]
  7. Guidelines for the Course of Study for Primary School Home Economics, Ministry of Education, Culture, Science and Sports, Japan. 2017. Available online: http://www.mext.go.jp/a_menu/01_c.htm (accessed on 25 November 2019). (In Japanese)
  8. Commentary on the Guidelines for the Course of Study for Primary School Home Economics, Ministry of Education, Culture, Science and Sports, Japan. 2017. Available online: http://www.mext.go.jp/component/a_menu/education/micro_detail/__icsFiles/afieldfile/2019/03/18/1387017_009.pdf (accessed on 25 November 2019). (In Japanese)
  9. Kanjo, E. NoiseSPY: A Real-Time Mobile Phone Platform for Urban Noise Monitoring and Mapping. Mob. Netw. Appl. 2010, 15, 562–574. [Google Scholar] [CrossRef] [Green Version]
  10. D’Hondt, E.; Stevens, M.; Jacobs, A. Participatory noise mapping works: An evaluation of participatory sensing as an alternative to standard techniques for environmental monitoring. Pervasive Mob. Comput. 2013, 9, 681–694. [Google Scholar] [CrossRef]
  11. Maisonneuve, N.; Stevens, M.; Ochab, B. Participatory noise pollution monitoring using mobile phones. Inf. Polity 2010, 15, 51–71. [Google Scholar] [CrossRef] [Green Version]
  12. Picaut, J.; Fortin, N.; Bocher, E.; Petit, G.; Aumond, P.; Guillaume, G. An open-science crowdsourcing approach for producing community noise maps using smartphones. Build. Environ. 2019, 148, 20–33. [Google Scholar] [CrossRef]
  13. Can, A.; Renterghem, T.V.; Botteldoren, D. Exploring the Use of Mobile Sensors for Noise and Black Carbon Measurements in an Urban Environment; Acoustics 2012; SFA: Nantes, France, 2012. [Google Scholar]
  14. Zuo, J.; Xia, H.; Liu, S.; Qiao, Y. Mapping urban environmental noise using smartphones. Sensors 2019, 16, 1692. [Google Scholar] [CrossRef] [PubMed] [Green Version]
  15. Elejalde-Garcia, M.J.; Macho-Stadler, E. Using a smartphone to investigate classroom acoustics. J. Phys. Conf. Ser. 2019, 1287, 012023. [Google Scholar] [CrossRef]
  16. Kawahara, K.; Suzuki, S.; Toyomasu, M.; Toyota, S. Development of a Teaching Material on “Life and Sounds” for Primary School Home Economics; an Activity Program on Making Sound Quizzes Using Tablet Devices. Memoirs of University of Teacher Education Fukuoka, 2019; Volume 68, pp. 1–6. Available online: http://hdl.handle.net/10780/2161 (accessed on 6 December 2019). (In Japanese).
  17. Taninaka, S. Theory and Practice in Soundscape. Ningenkagaku-Kenkyu (Research Reports on Human Sciences) of Kanazawa Seiryo University, 2009; Volume 2, pp. 35–40. Available online: http://www.seiryo-u.ac.jp/u/education/gakkai/h_ronsyu_pdf/2_2/p35_taninaka.pdf (accessed on 6 December 2019). (In Japanese).
  18. Otake, M.; Suzuki, M.; Watabiki, T. (Eds.) Shogakko Kateika Kyoikuho (Teaching Method for Home Economics in Primary Schools), Chapter 3; Kenpakusha: Tokyo, Japan, 2018. (In Japanese) [Google Scholar]
  19. Suzuki, S.; Toyomasu, M. Development of an Activity Program on Town Watching Using Tablet Devices for Disaster Education at the Elementary and Junior High School Levels: Program Practices and Evaluation By Teacher Training Students. Memoirs of University of Teacher Education Fukuoka, 2019; Volume 68, pp. 1–8. Available online: http://libopac.fukuoka-edu.ac.jp/dspace/handle/10780/2162 (accessed on 6 December 2019). (In Japanese).
  20. Sakagami, K.; Satoh, F.; Omoto, A. A case study of introductory teaching method for architectural/environmental acoustics using a smartphone. Acoust. Sci. Technol. 2013, 34, 209–211. [Google Scholar] [CrossRef] [Green Version]
  21. Satoh, F.; Sakagami, K.; Omoto, A. Application of a smartphone for introductory teaching of sound environment: Validation of the precision of the devices and examples of students’ work. Acoust. Sci. Technol. 2016, 37, 165–172. [Google Scholar] [CrossRef] [Green Version]
  22. Minichilli, F.; Gorini, F.; Ascari, E.; Bianchi, F.; Coi, A.; Fredianelli, L.; Licitra, G.; Manzoli, F.; Mezzasalma, L.; Cori, L. Annoyance judgment and measurements of environmental noise; A focus on Italian secondary schools. Int. J. Environ. Res. Public Health 2018, 15, 208. [Google Scholar] [CrossRef] [PubMed] [Green Version]
  23. Chetoni, M.; Ascari, E.; Bianco, F.; Fredianelli, L.; Licitra, G.; Cori, L. Global noise score indicator for classroom evaluation of acoustic performance in LIFE GIOCONDA project. Noise Mapp. 2016, 3, 157–171. [Google Scholar] [CrossRef]
  24. Aletta, F.; Brambillia, G.; Maffei, L.; Masullo, M. Urban soundscapes: Characterization of a pedestrian tourist route in Sorrento (Italy). Urban Sci. 2017, 1, 4. [Google Scholar] [CrossRef] [Green Version]
  25. Aletta, F.; Kang, J. Soundscape approach integrating noise mapping techniques: A case study in Brighton, UK. Noise Mapp. 2015, 2, 1–12. [Google Scholar] [CrossRef] [Green Version]
  26. Xian, J.; Aletta, F. A soundscape approach to exploring design strategies for acoustic comfort in modern public libraries: A case study of the Library of Birmingham. Noise Mapp. 2016, 3, 264–273. [Google Scholar] [CrossRef] [Green Version]
  27. Radicchi, A.; Henckel, D.; Memmel, M. Citizens as smart, active sensors for a quiet and just city. The case of the “open source soundscapes” approach to identify, assess and plan “everyday quiet areas” in cities. Noise Mapp. 2018, 5, 1–20. [Google Scholar] [CrossRef] [Green Version]
  28. Noise Capture Page. Available online: http://noise-planet.org/noisecapture.html (accessed on 25 November 2019).
  29. dB Meter Pro Page. Available online: http://dbmeterpro.com/ (accessed on 25 November 2019).
  30. Decibel X Page. Available online: https://www.skypaw.com/decibelx.html (accessed on 25 November 2019).
  31. Australian Hearing Page. Available online: https://www.hearing.com.au/ (accessed on 25 November 2019).
  32. Kardous, C.A.; Shaw, P.B. Evaluation of smartphone sound measurement applications. J. Acoust. Soc. Am. 2014, 135. [Google Scholar] [CrossRef] [PubMed] [Green Version]
  33. Murphy, E.; King, E. Testing the accuracy of smartphones and sound level meter applications for measuring environmental noise. Appl. Acoust. 2015, 106, 16–22. [Google Scholar] [CrossRef] [Green Version]
  34. Radicchi, A.; Henckel, D. Combined sound- & lightwalks. A perception based method to analyze and evaluate the sonic and light environment of our cities at night. In Proceedings of the Euronoise, Crete, Greece, 27–31 May 2018. [Google Scholar]
  35. Merry, K.; Bettinger, P. Smartphone GPS accuracy study in an urban environment. PLoS ONE 2019, 14, e0219890. [Google Scholar] [CrossRef] [PubMed] [Green Version]
  36. Bowen, L.; Danya, Y. Calculation of vehicle real-time position overcoming the GPS positioning latency with MEMS INS. In Proceedings of the 2014 IEEE International Conference on Service Operations and Logistics, and Informatics, Qingdao, China, 8–10 October 2014; Available online: https://0-ieeexplore-ieee-org.brum.beds.ac.uk/document/6960730/authors (accessed on 6 December 2019).
Figure 1. The screenshots of main panels of the dB Meter Pro (left), Decibel X (centre), and SoundLog (right).
Urbansci 03 00111 g001
Figure 2. Results of the accuracy check of the applications used with an iPhone XS: SLM is sound level meter. Average errors are 1.3 dB(A), 0.6 dB(A), and 1.6 dB(A) for dB Meter Pro, Decibel X, and SoundLog, respectively.
Urbansci 03 00111 g002
Figure 3. Results of the accuracy check of the applications used with an iPad Air: Average errors are 1.5 dB(A), 1.8 dB(A), and 1.2 dB(A) for dB Meter Pro, Decibel X, and SoundLog, respectively.
Urbansci 03 00111 g003
Figure 4. Results of the accuracy check of the applications used with an Android tablet P80X: Average errors are 1.8 dB(A) and 2.8 dB(A) for dB Meter Pro and Decibel, respectively.
Urbansci 03 00111 g004
Figure 5. The map of the measured area (Hirata-cho area, Ashiya-city, Hyogo pref., Japan) and the measuring points 1–14: This area is moderately urbanised. The area west of the river (Ashiya River) is densely residential. There are two main roads: Route 43 and an elevated highway, which are with heavy traffic. There is also a rather busy street along the river. Points 10 and 12 are at the entrance of a short tunnel under Route 43, and point 11 is in the middle of the tunnel. There is a railway (Hanshin Railway), and it is at Ashiya Station.
Urbansci 03 00111 g005
Figure 6. An example of a map with geo-referenced sound data using dB Meter Pro on an iPhone XS: Point 14 is near a railway (Hanshin Railway), and it is at Ashiya Station. Measured values are dB(A), slow peak. The survey was carried out at 10:00–10:20 on 7 October 2019.
Urbansci 03 00111 g006
Figure 7. An example of a map with geo-referenced sound data using Decibel X on an iPhone XS: Measured values are dB(A), slow peak. The survey was carried out at 9:35–9:55 on 9 September 2019.
Urbansci 03 00111 g007
Figure 8. An example of a map with geo-referenced sound data using SoundLog on an iPhone XS: The areas with Leq(A) larger than 70 dB(A) are marked in red, and those with less than 70 dB(A) are marked in green.
Urbansci 03 00111 g008
Figure 9. The map of the observation point (indicated by red mark) and surroundings in Sanda city, Hyogo pref., Japan: The observation point is on the sixth floor of a building surrounded by a park and car parking lots. There are a railway station and motorway near the point, but this area is a suburban area and is basically quiet.
Urbansci 03 00111 g009
Figure 10. Examples of snapshots from two videos taken at night and in the early morning: Measured values are dB(A), slow peak. The survey was carried out on 25 September 2019.
Urbansci 03 00111 g010
Table 1. The summary of the basic functions and advanced features of the applications: Note that the specifications can be different depending on the version of the applications and type of devices.
ApplicationBasic MeasurementsAdvanced Function (Data Recording)
WeightingCalibrationSoundPhoto/VideoTime functionPower Spectrum
dB Meter ProA, B, C, ZyesyesnoWaveformyes
Decibel XA, B, C, ZyesyesyesWaveformyes
SoundLogLeq(A)yesnonoMinute-by-minute historyno

