Policies for Autonomy: How American Cities Envision Regulating Automated Vehicles


1
Urban Institute, Washington, DC 20024, USA
2
Department of Urban Studies and Planning, Massachusetts Institute of Technology, 77 Massachusetts Ave, Cambridge, MA 02139, USA
*
Author to whom correspondence should be addressed.
Urban Sci. 2020, 4(4), 55; https://0-doi-org.brum.beds.ac.uk/10.3390/urbansci4040055
Submission received: 24 September 2020
/
Revised: 24 October 2020
/
Accepted: 28 October 2020
/
Published: 31 October 2020
Abstract
:Local governments play an important role in structuring urban transportation through street design, zoning, and shared jurisdiction over ride-hailing, transit, and road pricing. While cities can harness these powers to steer planning outcomes, there is little research about what local officials think about regulatory changes related to autonomous vehicles (AV). We compile key AV-related policies recommended by scholars but rarely implemented, and conduct a survey of municipal officials throughout the United States, exploring their personal support and perceptions of bureaucratic capacity, legal limits, and political backing for each policy. This paper finds broad personal support for regulations related to right-of-way, equity, and land use, such as for increasing pedestrian space, expanding access for low-income people, and reducing sprawl. However, officials emphasized uncertain bureaucratic and legal capacity for city intervention outside of these areas, reaffirming limited local power in the federal system. Only a minority expected political support for any policy. Greater population size and more liberal resident political ideologies are strongly associated with personal and political support for many policies. Local population growth is correlated with greater capacity to undertake policies. This work contributes to the growing literature on transportation governance in the context of technological uncertainty.
1. Introduction
Technological developments have the potential to fundamentally shift the nature and use of both urban transportation and city form. Examples include the 19th century introduction of the streetcar and the resulting development of “streetcar suburbs”, or the invention of the internal combustion engine and the reconfiguration of land use to accommodate personally-owned vehicles [1,2]. Urry’s [3] poignant critique of the 20th century car system suggests the time has come for a new shock—one also catalyzed by technological innovation—that transcends today’s “automobility” in favor of more efficient, equitable, and environmentally sustainable urban transportation. However, the car-dependency of a majority of people in countries such as the United States has historically hindered reforms, like distance-based user fees, that could help to mobilize such a change.
The recent development of driverless, autonomous vehicles (AVs) has encouraged hopeful speculation in some quarters as to their potential for transcending the transportation system’s automobile focus. For example, former New York City Transportation Commissioner Janette Sadik-Khan argues that AVs provide “a historic opportunity to reclaim the street and to correct the mistakes of a century of urban planning” [4] (p. 3). Her claim reflects a technological optimism shared by many working in local government that with innovations in transportation, we can reduce the deleterious social, economic, and environmental consequences of automobile reliance.
At the same time, a cadre of scholars warn of an “innovation logic” encouraging “maladaptive planning” that could increase corporate consolidation, surveillance, and inequality in the context of a limited, but powerful, set of dominant private actors [5]. Some critics call instead for an approach to governance and planning that ensures and enhances the “public value” in the context of new innovations [6]. Key institutions, in turn, have recommended policies to help governments develop that framework, but little research has engaged how—and whether—governments are considering implementing such policies.
Our paper evaluates several related questions exploring the potential for policy creation and adoption involving AVs. First, to what degree do municipal officials support reforms that would leverage AVs to alter approaches to city planning? Since the policymaking process is more complicated than just enacting regulations that align with the personal opinions of the municipal officials enacting them, however, we also explore how that personal support compares with bureaucratic limitations (e.g., inadequate staff), legal restrictions (e.g., higher-level governments preventing municipal action), and political obstacles (e.g., missing leadership). If technological change opens up possibilities for different sorts of urban life and functions, we must better understand the attitudes of the implementers—those municipal officials making choices on the ground. This is an essential investigation for scholars’ intent on connecting transportation models with the practicalities of local policy.
Second, we ask what city characteristics are associated with officials’ views, in order to better understand how the rollout and regulation of AVs might be filtered through differences in local demographics and political ideologies.
Third, we consider whether there are policies that are difficult to undertake in today’s environment but which municipal officials expect to become more feasible to enact with the arrival of AVs. Here, we directly investigate the claim that technological change can produce the regulatory environment suitable to catalyze urban change.
These questions must be considered in the context of deep uncertainty as to the specific parameters of AVs, let alone the forms associated transformations might take. Automated vehicle technology is not new, but AV technology, allowing driverless operation on public streets, has recently experienced a surge of research and investment. Despite the continued uncertainties related to how this future technology may look (e.g., whether vehicles are powered by fossil fuels, and whether they are operated in fleets), policymakers’ decisions about how to shape the urban context in which AVs will operate—lacking full details about how they will be powered and whether they will be shared—will impact the manner in which the technologies are both built and implemented.
AV-related outcomes should be seen as a combination of both technological realities and political choices. Local governments are including AVs in their plans despite this uncertainty, which reaffirms the importance of studying what officials believe now. Furthermore, experts are recommending the adoption of regulations today in anticipation of the technology—warning against policymaking that serves solely as a reaction to technological developments [4,5].
The regulatory response to AVs, of course, will be informed in part by changes in mobility patterns made possible by the technology. Scholars, generally describing Level 5 automation (meaning the as-yet unachieved goal of automated driving in all conditions, with no human input) [7], have identified a wide array of potential AV-related impacts—ranging from opportunities for a new direction in transportation to the exacerbation of existing problems. On the one hand, AVs could allow for expanded point-to-point travel, lower travel costs, and greater safety. AVs may also perform more efficiently than conventional vehicles, reducing pollution [8,9]. These are outcomes most would agree would be positive for society.
At the same time, depending on the degree to which they are shared, and whether they are electric, fossil-fuel, or hydrogen powered, AVs could be associated with outcomes many agree are negative. Lower travel costs and the ability of former drivers to reorient their travel time to more productive uses could increase vehicle-miles traveled (VMT). A willingness of some commuters to travel further could encourage sprawling land uses, whose consequences could include increased energy consumption and segregation by income. Increased VMT could also be associated with congestion, such as in contexts in which users have their private vehicles circle the block rather than pay for parking. Cheaper car travel could discourage transit use, potentially reducing overall network efficiency and deepening unequal access if a subset of the population cannot afford AV service but remains dependent on a transit network whose declining popularity produces a downward spiral of service. Finally, governments could lose revenues they currently collect from parking tickets, speeding fines, and fuel taxes [10,11,12,13,14,15]. AVs may also have major effects on employment and safety, though we do not evaluate these issues in this paper.
Given that AV rollout remains in its infancy, those impacts are speculative and will depend to a significant degree on how the technology is regulated and, significantly, how the context in which they operate is designed and planned. Local governments, on which this paper focuses, will thus play a major role through their approaches to regulation. Furthermore, local officials, whose insight this paper explores, will translate what they know about the research into planning policy.
In the United States, cities are political entities subordinate to higher-level governments. Their power to make policy choices depends on whether their respective states have allocated them broad home-rule powers (in which their councils have significant discretion), or are subject to what is commonly referred to as Dillon’s Rule, which allows cities to command jurisdiction only over issues that have been explicitly conferred to them by states [16,17]. As a result, different cities may be able to intervene in AV issues in different ways. In addition, other public-sector entities, such as transit agencies, are important actors in transportation policy.
Yet many local governments—with differing levels of local power—have attracted and managed recent AV testing [18]. Local officials are largely optimistic about future AV impacts on their cities, and a large share agree that AVs should be regulated, though most municipalities have yet to begin planning for them [19]. This general positivity comes in spite of concerns from some quarters that uncritically accepting innovations could have adverse consequences, particularly related to the ability to direct behavior through surveillance capitalism. This could be made only easier through automated vehicles covered by cameras, traveling through human environments [6,20,21,22,23].
Undeterred by this ambiguity about the positive or negative impacts of AVs, the role of cities is likely to grow given that the function and impacts of the transportation system (co-managed with others in the public sector) are products of broader policies often overseen by local governments, such as land use, public space, and the environment. In addition, cities often serve as testing grounds for new transportation-related policies, such as environmental planning [24]. New technologies such as AVs create openings for policies that have been long discussed but rarely implemented, such as congestion pricing [25,26,27,28]. Policymakers may have an opportunity to thread the needle between a course determined by the features of the new technology alone and one mediated through political and ideological approaches. If they do not act on behalf of what Docherty et al. refer to as the “public value”, they may ultimately only entrench the current conditions of automobile dependence [6].
Local officials may also leverage the transition to a new technology to implement reforms that now face resistance. Existing scholarship offers little insight into how policies anticipating the arrival of a new technology are actually being considered, however. This becomes particularly important with AVs, since they may exacerbate many existing challenges that municipalities face. Here, we explore whether local officials are considering the potential for using new technologies as a catalyst for existing proposed policies—ones that have the potential to shape the context in which the technology arrives, but do not directly regulate the technology itself.
One related question is how municipalities will vary in their responses to technological change. A growing body of political science research demonstrates that the left-right political views of local populations influence officials’ spending decisions, climate policies, service provision, and redistribution [29,30,31,32,33,34]. This paper thus considers whether local characteristics, including political viewpoints, are affecting regulatory response.
While AVs may rupture the norms and effects of the existing transportation system, their full social and environmental impacts remain unknown. Research into best practices for AV policies and/or regulations to help shape the resultant impacts remains in its infancy. As the technology itself evolves, so, too, have recommendations for how best to approach its regulation. However, policymakers are still tasked with shaping the context in which AVs will arrive (or choosing not to do so)—and scholars have yet to understand local willingness to engage in AV-related policymaking.
In Section 2, we identify 12 urban-transportation policies that could be implemented today to help shape the rollout of AVs. We then describe our research methods, including an online survey of local public officials representing 146 cities, plus follow-up phone calls with 25 staff members from municipalities across the United States. We hypothesize that most local staff support policies intended to leverage AVs to reduce the automobile dependence of American cities—but expect that bureaucratic, legal, and political obstacles will moderate support. We expect greater support in higher-population and higher-population-growth cities, but that the political beliefs of local residents will have limited influence. Finally, we expect that staff see AVs as an opportunity to pursue now-politically challenging policies.
In Section 3, we delve into results, using descriptive and regression analyses to examine official support for such policies, explore associations with city characteristics, and consider whether AVs are inducing changing views about policies. We find broad support from local officials for AV-related regulations on right-of-way, equity, and land use, such as for increasing pedestrian space, expanding access for low-income people, and reducing sprawl. This support is stronger in cities with greater population and more liberal residents. Though bureaucratic, legal, and political obstacles stand in the way, according to interviewees, officials believe AVs will increase the political feasibility of policy enactment for most proposed policies.
2. Materials and Methods
What sorts of local mobility policies may cities develop related to AVs? Beyond regulating the vehicles themselves, cities command regulatory tools that allow them to shape AV rollout—if they so desire [4,35,36]. Scholars and think tanks such as the National Association of City Transportation Officials (NACTO) and Regional Plan Association (RPA) point to potential municipal policies that could be revised in order to reverse the dominance of single-occupancy automobiles in so many cities today. Many of these policies proposed have been studied for years, but have yet to see widespread adoption. One key question that motivates this paper is thus whether such policies are of interest to local officials, and whether the advent of AV technology is encouraging them to think differently about them.
In order to examine whether local governments are considering AV-related policies, we developed a list of 12 urban-transportation policies that could help shape the rollout of AVs towards more positive outcomes, and which were mentioned by at least two of Sperling [35], NACTO [4], and RPA [36]. These policies have also been frequently discussed in contexts outside of AV rollout. Their potential implementation is dependent on local conditions, since cities’ power over specific regulations varies. For each policy, listed in Table 1, we note the manner in which AVs may be impacted by regulations in these areas, as informed by those cited above.
It is important to note that the below list is not exhaustive of potential policies for AVs, but is rather intended as an enumeration of strategies frequently endorsed in contemporary urban transport planning to shape the rollout of AVs towards more equitable and less car-centric outcomes (with the exception of the 12th policy). These policies also each have the potential to be implemented today. As such, we recognize that responses we describe in this paper may be oriented generally in favor of that sustainability and equity approach on the whole. If responses are biased in one direction (impacting the descriptive data in Section 3), however, that would have little impact on the variation in regression results that we describe later.
First, we consider land use and the public right-of-way. Cities may use their zoning power to reduce minimum parking requirements for new developments. Similarly, they may reorient their local transportation departments’ street-use priorities to reduce the quantity of on-street, curbside parking; transform vehicular traffic lanes into space for pedestrians, bikers, and transit; and ban single-occupancy vehicles from part or all of the city [37,38,39,40]. Rolled out with AVs, these policies could collectively produce lower personal vehicle ownership, reduced driving, and denser living environments. In some cases, these could also have the inverse effect: Reducing parking availability, for example, could mean higher levels of driving if people substitute parking with cheap AV driving.
Second, we consider equity and the environment. Cities may expend budgetary resources to provide income-based subsidies to support social equity for users of transportation network companies (TNCs) like Lyft and Uber—which, in the future, could provide service using AVs (here, and in other TNC-related questions, we are interested in AV-based TNC service). They could require AVs using the public roadway to be zero-emissions vehicles, with the goal of reducing point-based pollution. Furthermore, they could require AV-based TNCs to offer a minimum level of service throughout a community, offering spatial equity across an urban environment [41,42,43,44].
Finally, we consider the transportation system. Cities could work with transit and TNC providers to offer a single fare media for transit and AV-based TNCs, redesign the transit system to account for such services, and collect data related to TNCs in a public clearinghouse. Cities could also charge drivers for roadway use, and invest in increasing road capacity. These policies could increase system efficiency [45,46,47,48,49]. Note that we added two policies—banning single-occupancy vehicles from certain areas (4) and increasing road capacity (12)—after our initial round of surveys, and thus only include results related to them in some of the findings below. The policies, in sum, reflect a variety of strategies for regulating AVs either directly (such as through TNC regulation) or indirectly (such as through street design), that could be pursued through multiple means and by multiple actors.
We recognize that policymakers’ views about TNC service may influence their views on regulations for TNC services using AVs. We also note that there are other policies that could be worthwhile to evaluate, such as vehicular and/or ride sharing (which could play a major role in reducing congestion and pollution); integrating AV services into a shared app with transit; and building electric-vehicle charging stations. It is worth noting that regulators’ perceptions about AVs may depend on future changes in technology—for example, whether they are all electrified, and whether AV-based TNCs are widely available. However, asking local staff about how they think about AVs now is meaningful in that they engage in future-oriented planning on a daily basis, aware of the potential for multiple future outcomes for the vehicles (indeed, projecting future scenarios is a basic element of the work of planners). This research thus provides new insight into how municipal officials are thinking about several key transportation policies—and whether they are approaching local policymaking from a technologically determinist perspective or one informed by the potential value in local action.
The purpose of this paper is not to establish the effectiveness of these policies, which are also applicable to human-driven vehicles, nor is its purpose to offer a comprehensive list of recommended policies for regulating AVs. Rather, the intent is to present an array of often-mentioned urban-transportation policies and to examine how local officials view the feasibility of enacting them in the context of new technology. These policies have not been examined collectively in other scholarly contexts from the perspective of their support by local actors.
This work contributes to a growing, but still limited, field of examinations of mobility policymakers’ real-world concerns. Marsden and Reardon [50] offer a useful frame for our work. They identify three components of policy development: first, high-level abstraction (general ideas such as efficiency); second, program-level operationalization (goals that motivate the search for a solution), such as reduced VMT; and third, specific on-the-ground measures that can be enacted, such as congestion pricing. We take advantage of this framework to shape questions, which focus on the second and third components of this policy process.
We develop several questions and hypotheses related to AV regulation. First, we evaluate whether local officials support the policies laid out in Table 1. We consider whether they are willing to pursue both program-level issues and specific, on-the-ground policies. In the context of widespread public discussion about AVs and positive assessments by policymakers of their potential influence on cities, we expect personal support from most municipal staff for policies we consider (except road expansion) (H1a). That said, we also hypothesize that bureaucratic, legal, and political obstacles will moderate support, given the reality of limited local-government power in the case-study cities in the United States (H1b).
Second, we examine which city characteristics motivate support for various policies. Based on previous research [19], we expect that officials from higher-population and higher-population-growth cities will be more likely to support AV-related policies, but that the ideological makeup of the local population will have limited influence (H2). These hypotheses are founded on the assumption that a higher level of local capacity is linked to greater interest in regulating new technologies—but that views on the specific ways to regulate transportation have little connection to differences in left-right political ideologies of local residents.
Finally, we evaluate whether officials see AV technology as a tool to realize on-the-ground policies they already had in mind but had not yet been able to accomplish. We hypothesize that staff working in planning and transportation see AVs as a tool to pursue policies that they believe are difficult to promote politically today (H3). We make this hypothesis based on two assumptions: first, that the logic described by Sadik-Khan in the introduction is shared by her peers across the country, and second, that getting drivers out of the driver’s seat opens up opportunities to reduce the footprint of cars, since the “windshield perspective” of people focused on moving through traffic as quickly as possible will be made less prominent by automation.
This paper pursues a mixed-methods approach that combines quantitative models with qualitative nuance. We developed a list of U.S. cities or city-equivalents with at least 100,000 residents in 2016 (there were 307 the U.S. Census [51] categorized as “places”). For each city, we contacted the heads of planning/community development and transportation/public works departments—the people we refer to as officials or staff here. In total, 614 emails requesting survey responses were disseminated in total. We intentionally focus on top officials because of their roles in developing policy; these individuals would undoubtedly be involved in the formulation of local efforts related to any of the policies noted above. These staff members do not have complete control over decision-making, but they are influential in establishing policy priorities and identifying preferred outcomes [52,53].
We asked officials in all cities to complete an anonymous online survey (Appendix A) consisting of Likert-scale questions, with associated free-text submission. This paper is a companion piece to our previous work [19], which focused on municipal preparation for AVs, not support for specific policies. We used the same survey, but here analyzed the results of different questions. It is important to note that the survey did not specify the shape or size that AVs might take (indeed, we can imagine autonomous buses or minivans or even tiny pod cars). In doing so, our survey attempted to replicate the uncertainty that policymakers themselves experience today in developing regulations for AVs. We also did not ask respondents to evaluate AVs at different levels of automation, or within a roadway system shared with human-driven cars, instead choosing to ask all questions “in the context of AVs”, allowing interviewees to respond as they saw fit—which approximates the decision-making environment in which they are currently planning. Most interviewees shared an understanding that, to them, AVs referred to fully autonomous, automobile-sized passenger vehicles (one, for example, noted that they might have “a sedan-type shape”). Several others, though, emphasized that AVs could be, to quote another interviewee, “a whole number of different styles of vehicles”.
At least one representative from 120 cities (about half from planning departments, half from transportation departments) responded to the full survey between April and June 2018. In total, we received 148 fully completed surveys (a response rate of about 24%). We also received 27 partially completed surveys from an additional 26 cities. In order to address a concern that multiple respondents from one city could bias results, we ran the models described later in the paper without responses from cities with more than one survey taker, and found no significant difference in results. Of all respondents, 45 said they had been appointed, 115 noted that they were members of the civil service, 15 said something else, and none were elected officials. We allowed staff to complete surveys on behalf of department heads if needed; we also allowed the survey to be shared, so we accepted several responses from officials outside of planning or transportation departments, but who noted that they supervised AV policy in their respective cities. A summary of respondents is found in Appendix B.
For each city, we assembled a set of variables representing demographics (jobs, residents, population density, population growth, ethnic composition, commuting modes, wealth, and housing tenure) from the U.S. Census [51], as well as information on mayoral partisanship (assembled from web sources) and resident political ideology (on a liberal-to-conservative scale [34]). To examine the representativeness of the cities from which we acquired responses, we compared data about sample cities with those from all U.S. cities with 100,000 or more residents, conducting t-tests of means for each variable, and found no significant difference (p < 0.05) for any of them (we used many of these variables in the models presented in the following section). As a result, recruitment bias does not appear to be a concern; the survey responses are representative of views of the range of officials in medium and large U.S. cities.
Many of the respondents we surveyed were from cities in California (35) or Texas (20)—a product of the concentration of relatively large U.S. cities in those two states (73 and 38 of the 307 total cities in the population, respectively). Because every state has control over local-government powers, and has enforced specific rules (such as California’s greenhouse-gas reduction policies), a future examination may analyze how cities respond differently based on state political climate, but we do not engage in such research here because of our relatively small sample size.
In fall 2018, we conducted follow-up interviews with 25 officials randomly selected among web-survey respondents. These interviews lasted 30 min on average and included both an additional online survey and a telephone discussion (Appendix C). We again conducted t-tests of means for variables related to respondents’ cities and found no significant difference with the population as a whole. We asked interviewees to detail their responses to the web survey, and to describe whether they believed AVs would alter their personal support, as well as their perceptions of political support, for each on-the-ground transportation policy. Responses were recorded both quantitatively and qualitatively: Respondents completed an online survey while voicing the nuances of their answers over the phone. Interviews were transcribed, and responses divided into separate documents by policy discussed. We then coded each document based on key terms respondents mentioned. We include quotes from interviews in the paper to provide context for the quantitative survey-question findings.
This approach has several limitations. Though the cities from which respondents hailed are representative of the nation as a whole—and respondents were not a stratified sample of all staff but rather specifically departmental heads or their representatives—the people who responded may be more likely to be interested in AV regulation. This study measures opinions and expectations, not evaluating the presence of regulations, nor their effectiveness. It also examines AVs broadly; results we present do not explore officials’ views about vehicle or ride sharing (which may be regulated along with AVs), nor did respondents weigh in on multiple levels of automation, as they were allowed to interpret the term AV as they wished, again, with the goal of reflecting policymakers’ current conditions, not an idealized policymaking environment. The degree to which AVs are shared may play an important role in impacting their effect on the environment, and regulators may make AV policy differently depending on the degree to which they are shared.
The study also tells a national story whose implications require a nuanced interpretation which takes the specific local context into account. Even so, some cities are already incorporating AVs into their plans, thus understanding their current approaches is relevant. The technological advancement offered by autonomy is just one of many changes now impacting urban transportation [54], and there is little guarantee that AVs themselves will induce governments to alter their approach to mobility policy. Many ideas, such as congestion pricing, have been studied for generations but made little headway in the face of political, bureaucratic, financial, or legal obstacles [55]. Nonetheless, this study seeks to better understand the possibility of policy change within the municipal political context specifically, asking officials about the bureaucratic and political nuances of the feasibility of our proposed policies today, and then exploring how that might change in the context of AVs.
3. Results
3.1. Support for Municipal Involvement in General Issue Areas, and Specific on-the-Ground Policies (H1)
We begin by considering the degree to which municipal officials personally support involvement in AV-related regulations, and how this relates to local capacity, political support, and legal feasibility. Officials were asked to consider whether they believe municipal governments should be involved in the creation of regulations related to several general policy issues, which fit into the aforementioned categories: land use and public right-of-way; equity and environment; and the transportation system.
These issues represent Marsden and Reardon’s [50] second component of policy: Program-level operationalization, but not on-the-ground measures, which we investigate in the next section. These responses are officials’ personal opinions, but given their important roles in identifying policies to pursue, they indicate what cities may prioritize in their planning processes. Officials stated whether they supported AV-related municipal regulations to address each issue by answering “yes”, “maybe”, or “no”. If selecting no, they were asked for the reason they do not support municipal regulation, with options of “this isn’t an important policy”, “private actors should intervene”, or “other governments should intervene”.
Overall, results affirm the hypothesis that officials support local regulation in the context of AVs (H1a), but this support is issue-dependent. Table 2 summarizes responses. There is majority support among interviewees for municipal engagement in reducing sprawling land uses; increasing street space for pedestrians; and increasing access to mobility for low-income and disabled people. There is also considerable support for local involvement in increasing transit ridership. Officials were far more skeptical of local efforts to reduce pollution and VMT, with a plurality in each case suggesting that other governments should intervene instead. Issues related to reducing private car ownership attracted even less support, with almost half of officials suggesting that such an effort should not be in the realm of government intervention at all.
In order to further examine officials’ views, municipal staff considered policies from Table 1—the third component of policy: specific on-the-ground measures [50]. These responses allow us further evaluation of H1a, as well as H1b, the hypothesis that although municipal officials might personally support proposed policies, their ability to enact those policies is moderated by legal, bureaucratic, and political obstacles that hinder implementation. For each policy, officials answered whether (a) they personally support it; (b) their agency has the capacity and resources to pursue this idea; (c) it is legally feasible for their city to pursue this idea; and (d) there is political support in their city for this idea. For the latter two questions, respondents noted if they were not sure.
For all of the policies officials considered, a majority expressed personal support (over 70%), affirming expectations in H1a (Table 3). This suggests considerable interest among staff working in local transportation and planning in advancing all kinds of specific AV-related policies. In fact, their support is stronger than their sense that municipal governments should be involved in any of the general issues (Table 2). Officials largely share the view expressed by national advocacy organizations about the need to orient AV technology toward planning ends that reduce automobile dependence.
On the one hand, at least two-thirds of officials agreed that their cities had the capacity and legal power to implement on-the-ground measures related to land use and the public right-of-way (policies 1–3). In these cases, it is likely that officials are aware of their legal capacity to undertake these policies because many of their cities have already adopted similar regulations.
On the other hand, from the perspective of bureaucratic and legal capacity, officials pointed to very significant roadblocks to implementing other policies, regardless of their personal support, affirming H1b expectations. Officials were far less confident in their cities’ ability to develop policies related to equity, the environment, and the transportation system (policies 5–11); 35% or fewer responded affirmatively to such questions, with a large share noting they were unsure of their cities’ legal ability to intervene. While almost three-quarters expressed personal support for distance- and congestion-based road pricing, only 18% believed their respective agencies had the bureaucratic capacity to pursue the idea, and only 11% were confident that their city could legally pursue it. In many cases, respondents selected “not sure” regarding policies’ legal feasibility, likely because several of the policies have little precedent in existing local regulations. While asking about legal feasibility is perhaps more in the purview of city legal staff, it is telling that key decision-makers were confident about their legal jurisdiction over land-use and right-of-way issues, but likely have not yet explored the other subjects with their attorneys.
Officials also expressed broad skepticism about the level of local political support for policies. Fewer than 40% of officials agreed that any of the policies had political support—even those related to land use and the public right-of-way. This illustrates a divergence between what staff believe is appropriate AV-related planning and what they think politicians are willing to support. Few officials agreed that local politicians would support road pricing. It is worth noting that staff are estimating local political support and may not accurately represent mayoral or council views. Even so, the officials we surveyed are not only familiar with the politicians with whom they work, but also likely influence those politicians’ actions. One interviewee, for example, noted that elected councilmembers “ask us a lot of questions… so they are looking to us for information”.
3.2. City Characteristics and Their Association with Support for Regulations (H2)
This section considers the second question: To what degree do city characteristics motivate policy support? To examine this, we developed a series of ordered probit regressions (“No” < “Maybe” < “Yes”) to evaluate associations between perspectives on whether to address program-level issues (those noted in Table 2) by regulating AVs, and the characteristics of the cities in which officials are employed. Standardized coefficients are used to identify the relative magnitude of associations between local variables and support in each issue area; as results reflect policymakers’ opinions, we believe that this approach allows us to identify key local factors that play a relative role in impacting willingness and ability to pursue outcomes (e.g., being a larger city is correlated more than most other variables with the likelihood of supporting reductions in curbside parking). However, we intentionally underemphasize the marginal impacts of different variables (e.g., how much being a larger city influences likelihood of supporting such reductions); the latter, more specific analysis may be more useful in future analyses of actual policy response once AVs are rolled out.
Controls in our models include local per-capita expenditures, political ideology, departmental employees (logged), population (logged), percent population change from 2000 to 2016, share of population with a bachelor’s degree or higher, median household income (logged), population density, median housing value, and also a dummy variable for whether the survey respondent works in the planning department. These variables were selected to avoid multi-collinearity while maximizing model fit. Other variables initially considered were cities’ Gini coefficients, poverty rates, modal shares, jobs, mayoral political parties, regions, and number of self-reported department employees, but we eliminated these from final models because they reduced effectiveness and did not add insight.
Subsequently, on-the-ground policies (those in Table 3) are considered to determine what factors might affect bureaucratic support. Again, H2 hypothesizes that officials from higher-population and faster-population-growth cities would be more supportive of specific policies, but that residents’ ideological composition would not be influential.
The first round of analysis, compiled in Table 4 (average marginal effects, for comparison, are noted in Appendix D), points to two major contributors for officials’ personal support for local regulations of AVs for general issues. To interpret this table, it is meaningful to compare standardized coefficients within each column in this table (as well as the other regression tables in this paper), but not across columns. Confirming H2, resident population size was significantly (p < 0.05) and positively associated with officials’ views that AVs be locally regulated so as to increase mobility of low-income (C) and disabled-people (D); reduce pollution (E); reduce VMT (F); increase transit use (G); and reduce private car use (H). This indicates greater municipal governmental capacity associated with being a more populous city. However, there was no connection between population growth and support for general AV regulations.
These results indicate a strong and significant relationship between local resident ideology and officials’ support for several municipal AV-related issues: Reducing sprawl (A), increasing street space for pedestrians (B), and increasing mobility for low-income individuals (C). For each of these general areas, the variable representing resident perspectives on the left-right spectrum was the most highly associated among all variables with staff support for regulations; officials from cities with citizens who espouse more left-wing political beliefs were more likely to support regulations in these spaces. Since ideology is measured on a −1 to +1 liberal-to-conservative scale, a larger negative coefficient means a larger association between more liberal ideological views and support for an issue. Several AV-related issues were not affected much by control variables: there was universally strong support for increasing disabled mobility and universally weak support for reducing VMT and reducing private car use. Similarly, several variables proved insignificant in determining support for different AV-related issues, including education level, median household income, population density, and median household value. Planners and other types of officials, meanwhile, had statistically indistinguishable views on the necessity for local involvement on all matters except for increasing street space for pedestrians (B), which planners were more likely to support.
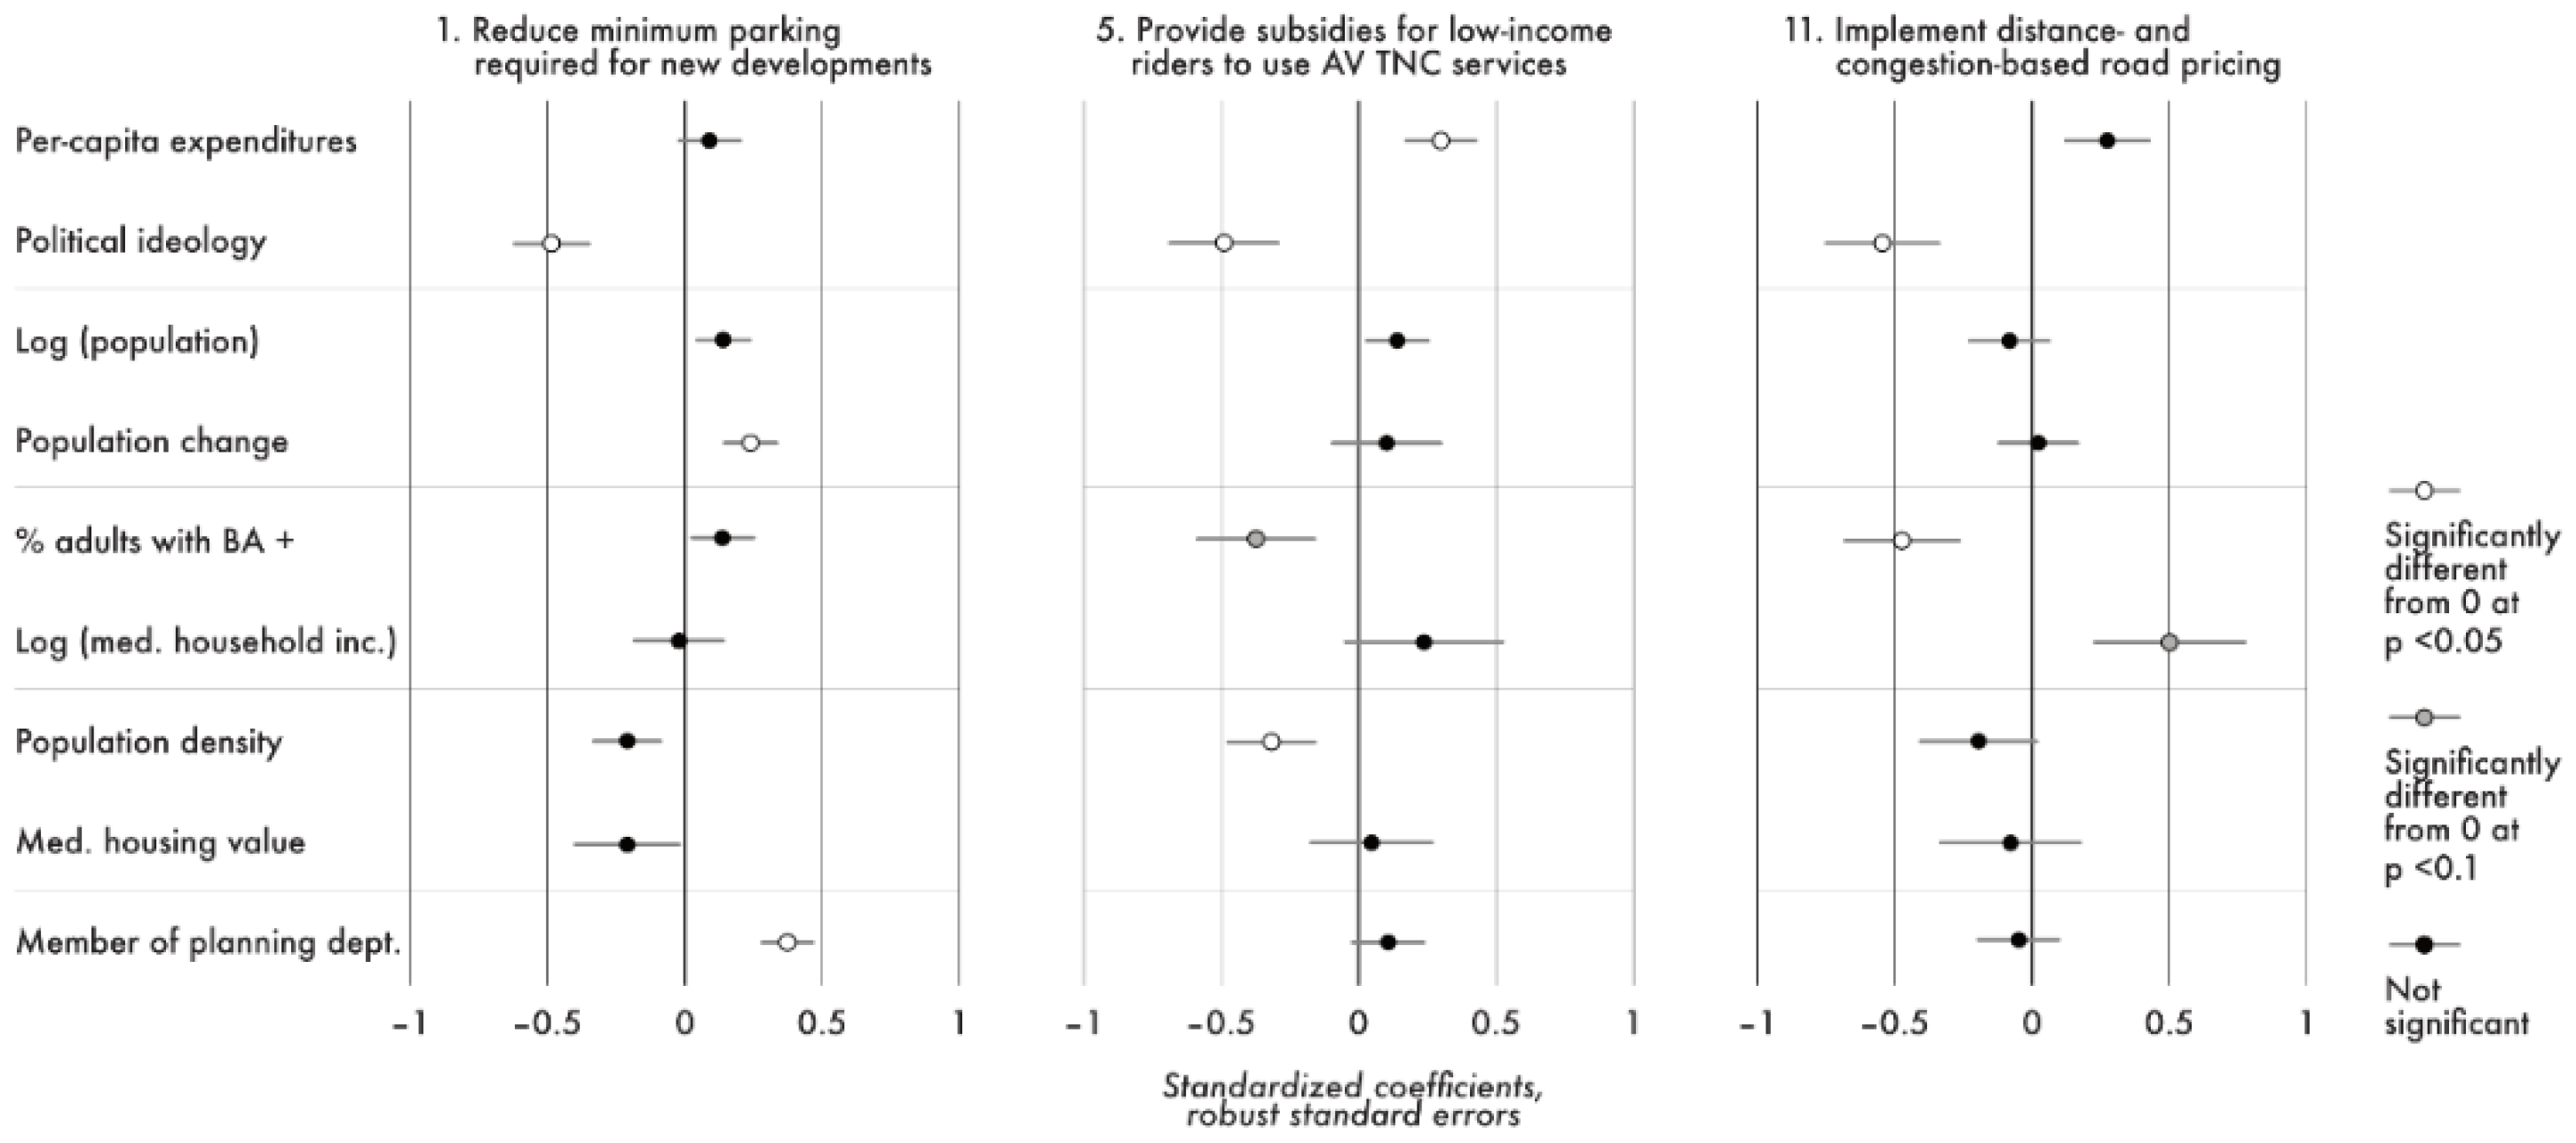
The same correlations only partially held for officials’ personal support for specific, on-the-ground measures they were asked to consider. Table 5 evaluates what city characteristics are most associated with support for AV-related policies through a series of regressions, and Figure 1 graphs regression results for indicative regulations representing the three areas of land use and the public right-of-way, equity and environment, and the transportation system. Standardized coefficients are again used to ensure comparability between the relative influence of each variable on personal support for a given policy; because of the early nature of these results, the relative influence of each factor—not its exact elasticity—should be most useful to the reader.
These results, once again, show strong connections between the political ideology of a city’s residents and local officials’ support for certain regulations. Civil servants and appointed officials from more left-leaning cities were significantly more likely to personally support measures related to land use and the public right-of-way (policies 1–3), including reducing minimum parking requirements, as well as subsidies for low-income riders (5) and implementing road pricing (11), as clearly illustrated in Figure 1. For all but one of these issues, the ideological makeup of the city’s residents had the highest-magnitude effect on the results. Nonetheless, there is no correlation between political ideology and support for the other policies such as requiring zero-emissions vehicles (6) or requiring a minimum level of service (7).
Other correlations are worthy of mention because they suggest relationships between municipal capacity and bureaucratic support for pursuing new transportation policies. Local expenditures were related to support for transforming car lanes (3), providing subsidies for low-income people (5), and redesigning the transit system to account for AVs (9). Population size was positively related to support for reducing curbside parking (2) and creating a single payment system for AVs and transit (8). We also tested whether officials had different personal feelings based on their position in their respective administrations. We thus ran each of the regressions noted in Table 5 again, but adding dummy variables for respondents’ roles. We found no significance (p < 0.05) for being a member of the civil service (versus being appointed) for any of the policy issues, and almost identical coefficients for the other variables as in the aforementioned results. This suggests that respondents acting in the role of department head feel similarly regardless of how they assumed that position.
To understand these results in more detail, we also performed regressions on officials’ responses related to their perceptions of bureaucratic capacity and political support for the various measures examined. In terms of respondents’ sense that their respective agencies had the resources and capacity to pursue each policy (Appendix E), we found an association between a positive response and higher population growth among eight of ten policies considered. We also found a positive relationship between median local housing values and officials’ sense that their agencies had the capacity to require zero-emission AVs (6) and redesign transit systems to account for AVs (9). Yet resident ideology had no role to play in this question of local capacity. This suggests that H2′s expectation that population growth is an important characteristic for local regulation, and ideology is not, may apply—but primarily for questions of local capacity. This finding fits with a logic that the specifics of policymaking reflect local political preferences, but that the ability to execute those policies depends on characteristics for which local ideology is less important, such as state-government preemption or financial resources.
Planners were more likely to believe that their respective agencies had the capacity to reduce minimum parking requirements (1) (planners were also more supportive of such policies in general, as shown in Figure 1). However, they were much less likely to believe their agencies could require minimum levels of AV TNC service (7), implement a transit-AV TNC fare system (8), and create a public data clearinghouse (10). This confirms that these policy areas are outside of planners’ typical wheelhouses.
From the perspective of officials’ perception of political support for on-the-ground measures (Appendix F), results show strong links with local residents’ ideologies, even stronger than those presented in Table 5. These results excluded respondents who were “not sure” about political support; being unsure cannot be reasonably understood as between “yes” and “no” in this context, thus using an ordered probit model would be inappropriate. For eight of the ten policies examined (all but creating a single payment system (8) and redesigning the transit system (9)), resident ideologies had the strongest or second-strongest-magnitude impact on responses among variables examined. This indicates that officials surveyed believe that politicians are responsive to the ideological makeup of their respective cities, at least in so far as having an ideology further to the left is associated with more support for regulatory initiatives. This association was made without prompting respondents (no information was provided about the ideological characteristics of their cities), and supports the finding that political willingness to support transportation policies is to large degree a reflection of local residents’ views on the left-right spectrum.
Responses indicate several other influential links between city characteristics and officials’ sense of political support for policies. There was a positive association between population size and political support for a single payment system (8) and a redesigned transit system (9); there was also a connection between population growth and reducing minimum parking requirements (1) and the creation of a public data clearinghouse (10). However, these results are not consistent across policies, so we believe they are less meaningful, in sum, than our findings related to ideology. We also performed ordinary least squares regressions on responses related to the legal feasibility of policies (Appendix G, again excluding “not sure” responses). However, we believe that these data are less useful than the other regression results presented, for two reasons. First, outside of the first three policies (related to land uses and the public right-of-way), only a minority of officials responded that they knew the legal feasibility of their respective cities pursuing a policy related to AVs (Table 3). As such, the sample is limited and results may be inconclusive. Second, a city’s ability to pursue a policy is largely a product of state legislation that typically has little to do with city characteristics.
As a robustness test, we again examined whether officials’ roles (appointed or civil service) affected their responses. We found no significant difference in response to questions about bureaucratic support or political capacity, with one exception. Civil-service staff were somewhat more likely to believe that there was political support for subsidizing low-income riders (5).
3.3. Do autonomous Vehicles Alter Officials’ Views of Transportation Regulations? (H3)
The third question seeks to expand the analysis to understand how officials view regulations within the context of technological development. We ask whether local civil servants see AVs as a tool to realize existing priorities that have heretofore been difficult to implement. H3 hypothesized that officials see AVs as a tool for advancing existing, but unfulfilled, transportation priorities.
This question is considered using results from the follow-up interviews. In Table 6, we provide a summary of responses for each policy; note the share of respondents personally supporting policies now (with current technology) and in the future (in the context of AVs); and offer key, representative quotes. Two additional on-the-ground measures are included in this iteration of the survey—ban single-occupancy automobiles from all or parts of city (4) and increase road capacity (12)—in response to feedback from the first round of surveys. Only a minority of respondents supported either of these proposals either today or in the future.
Several conclusions stand out. First, officials said they were optimistic that political feasibility would improve for almost all policies, compared to today. This supports the expectation in H3 that AVs will increase support for—and improve the potential implementation of—many urban transportation policies. The exceptions were banning cars from certain parts of the city (4) and increasing road capacity (12).
Results also show that officials remain skeptical of aspects of many proposed policies—in the present or in the future with AVs. In terms of street space and land uses, many noted that businesses remain attached to local parking (1). Others emphasized that curbside parking is a useful tool for protecting bikers and pedestrians (2), and some officials said that residents have to be convinced that congestion has declined before they would be willing to eliminate car lanes (3). Officials voiced concerns about state preemption and the role of other public-sector agencies and governments in limiting their ability to require zero-emissions vehicles (6), redesign the transit system (9), and implement road pricing (11). Finally, respondents pointed to potential safety and privacy concerns when it came to agreeing about implementing a data clearinghouse (10)).
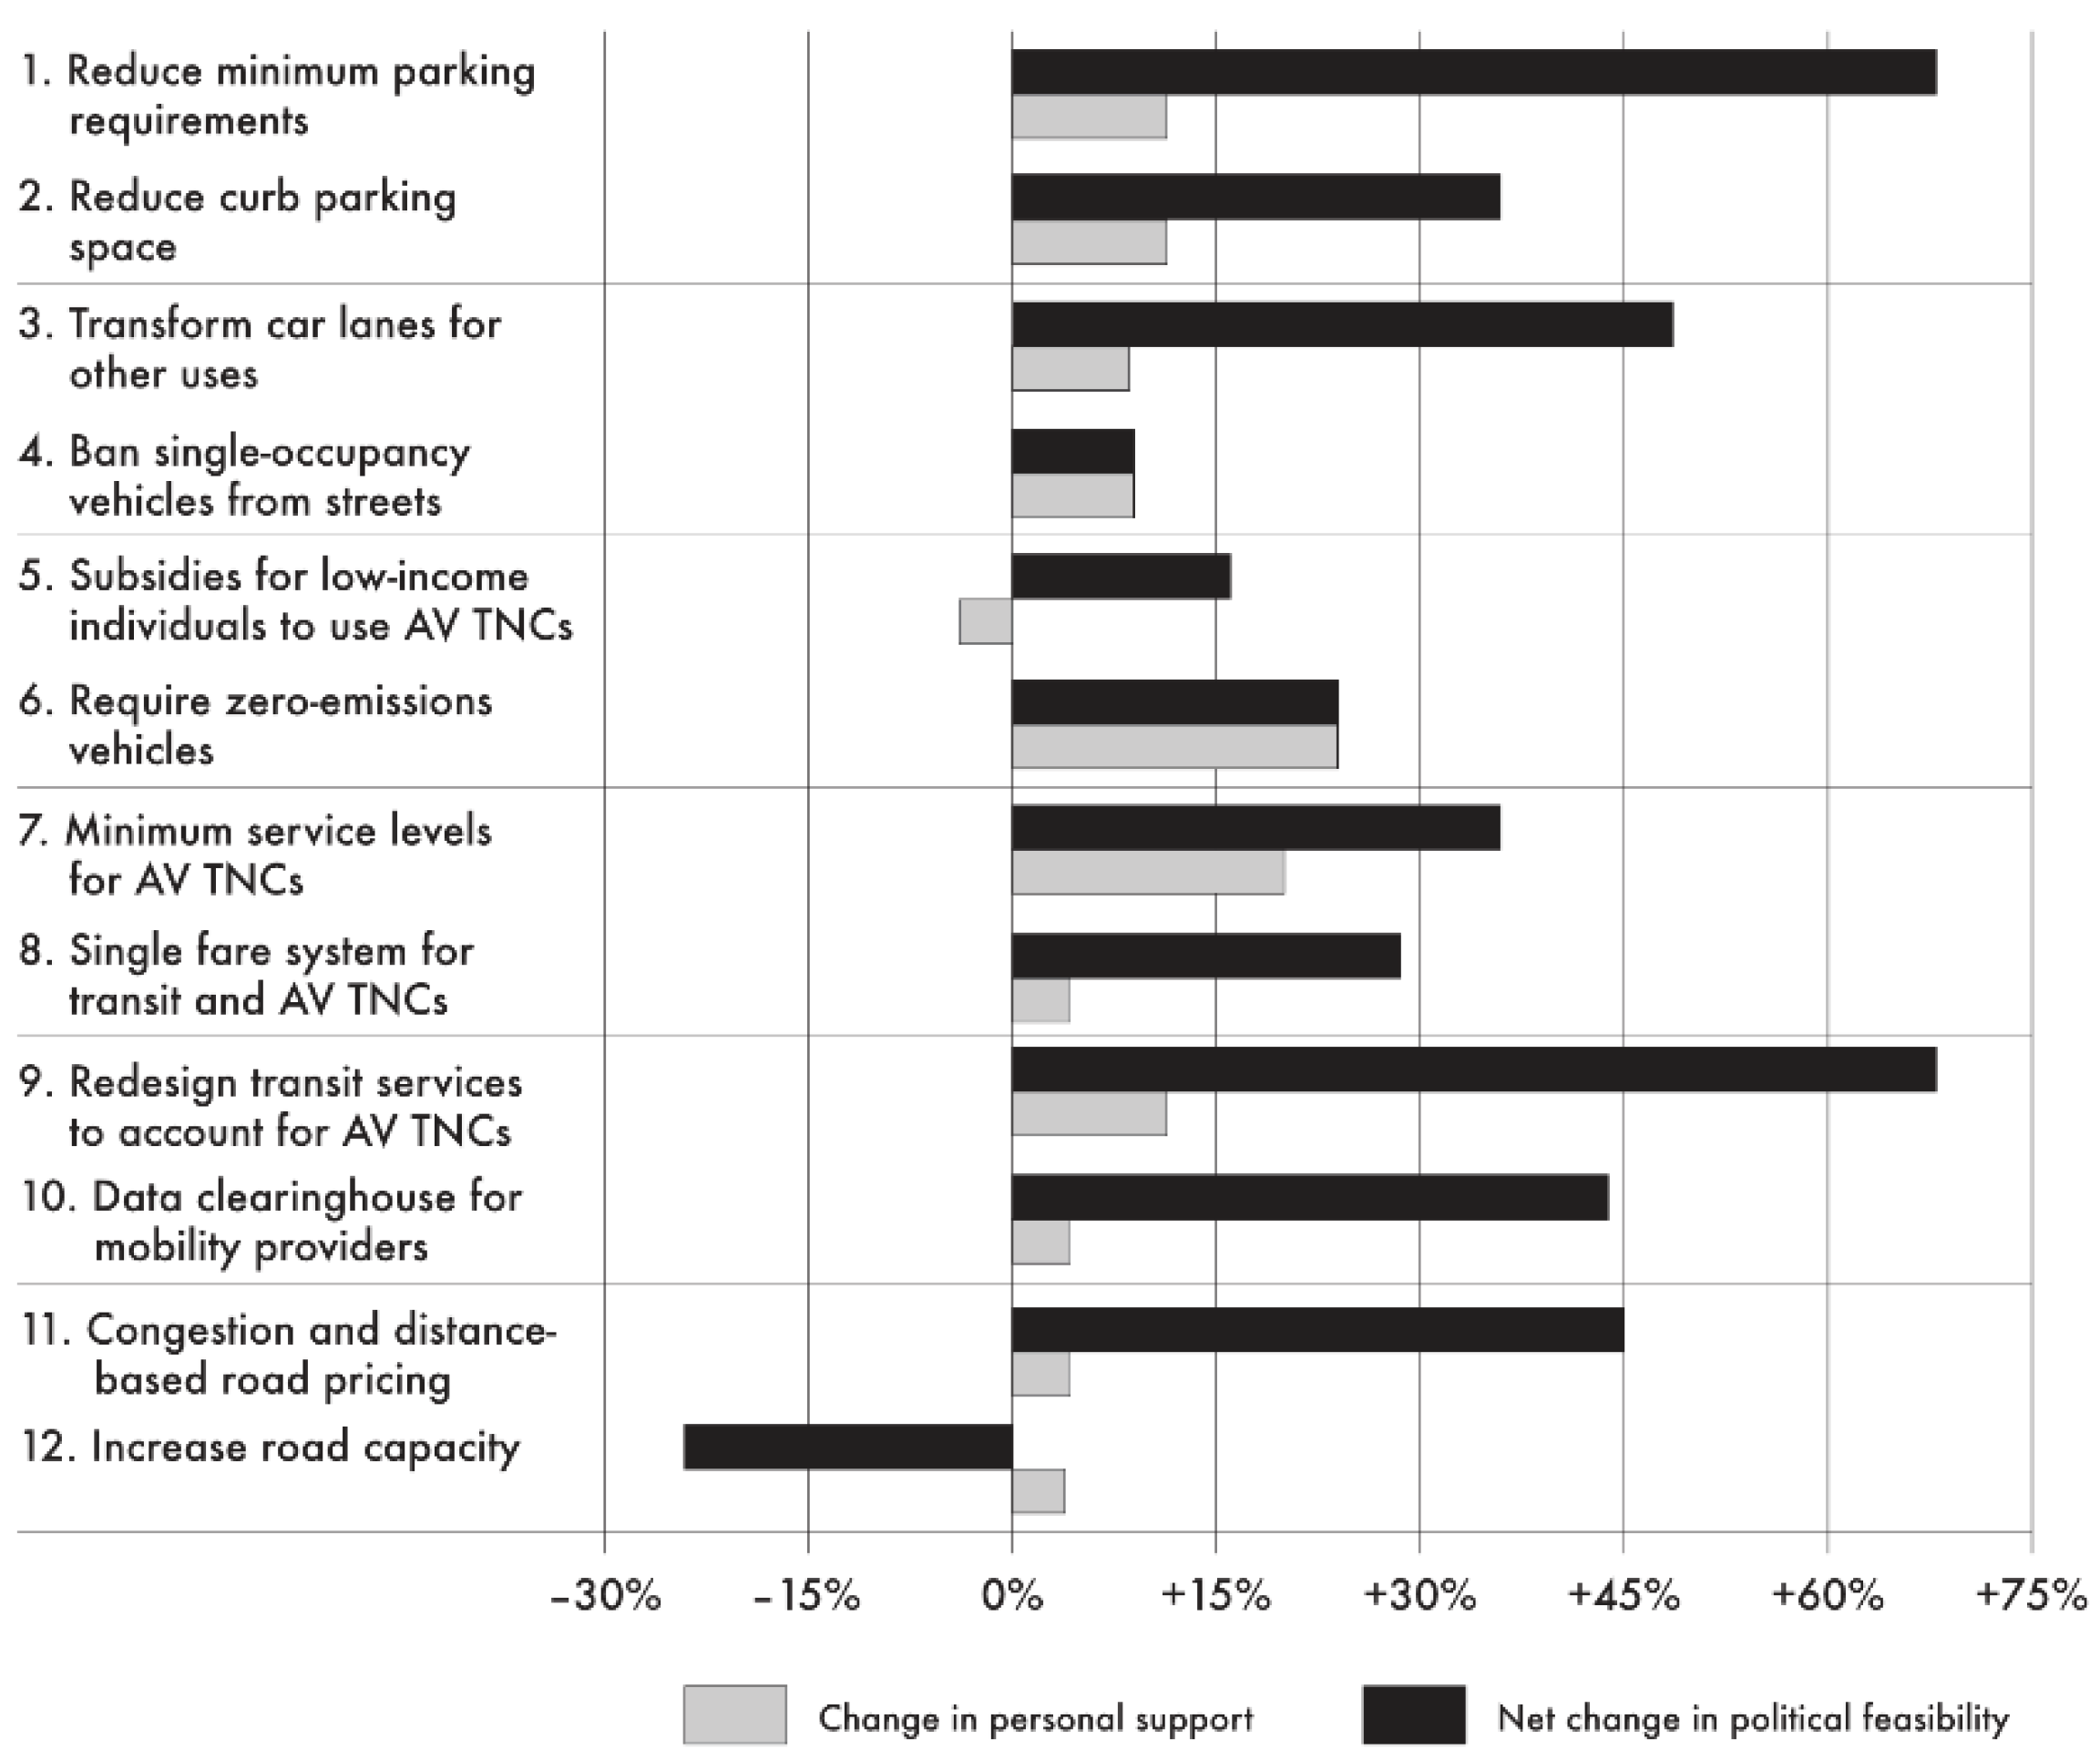
Figure 2 documents how much officials’ thought their personal support for individual policies would change between now (with current technologies) and a future with widespread AV availability. This evaluates just the change in perspective among those in our follow-up survey (that said, responses from officials in both surveys were similar in terms of their thinking on the policies today). On this measure, shown in gray, personal support increased for all but one policy: subsidies for low-income individuals (5). The magnitude of change was small; only policies to require zero-emissions vehicles (6) and minimum service levels for TNCs (7) attracted at least 15% points more support in the context of AVs. Yet most policymakers were supportive of most policies studied here (as in Table 3); their backing remained with or without AVs.
Respondents’ average assessment of change in the political feasibility of each policy given AV rollout is shown in black. This was calculated by subtracting the share of officials who responded that each on-the-ground measure would become less feasible with AVs from the share that said the policy would become more feasible. Here, more significant differences are evident. For most policies, at least 30% of officials expected that political support would increase. Yet, notably, they believed the political feasibility of increasing road capacity (12) would decline substantially with AVs—perhaps because of the higher levels of road efficiency potentially made possible by automation.
These results largely confirm H3, though unexpectedly this applies more dramatically to expected political support than staff’s own personal support. Given limited existing expectations of political support for most policies (Table 3), this suggests that AVs could make policy implementation more feasible.
Respondents over the phone were split in the general tenor of their responses: Some felt strongly that it was important to proactively institute policies to take advantage of the time window before AV rollout to ensure the technology results in more livable and complete streets, while others argued that they should adopt a wait-and-see approach, taking on more of a technologically determinist perspective. One respondent explained, for example, “if there are AVs driving around our city and we have not put these policies in place, we’re lost. [Right now] there aren’t people saying ‘what about me,’ but as soon as there are, that’s going to be tough to fight against them”. Another respondent, conversely, argued, “I think we try to look a small bit into the future when we are writing policies but we don’t try to extrapolate too far into the future because most policies especially regarding anything technological have to be revisited every year or two”.
Many respondents who advocated for the wait-and-see approach nonetheless still envision increasing feasibility in implementing these policies. Some mentioned that transportation will require users to make more of a comparison of costs and benefits in the future, given the possibility for multiple service options. Others mentioned the ease of regulating two or three large TNC companies as opposed to each individual personally-owned vehicle. That said, many respondents voiced place-specific concerns that would limit the implementation of several of the policies, indicating that policy recommendations cannot be a one-size-fits all approach, but rather should share an underlying philosophy that can then be molded for specific contexts. None of the respondents emphasized concerns often expressed in the critical scholarship about the potential of technologies like AVs to increase surveillance or concentrate corporate power in the transportation industry. Though these may be major societal concerns, they have not yet influenced local officials’ perspectives.
4. Discussion
In this paper, we offer new insight into how municipal officials are considering implementing AV-related policies. By surveying high-level staff working in a representative sample of U.S. cities, we demonstrate widespread support for local regulation across a range of issues frequently cited as both useful today and necessary to combat the negative aspects of AV rollout, specifically by reducing automobile dependence. The value of many related policies has been repeatedly emphasized by scholars but our research reaffirms that their implementation at the municipal level has been thus far limited by uncertainty, as well as legal and political obstacles. These policies remain relevant in the context of AVs, making a better understanding of their evolving potential for implementation essential for effective municipal policymaking.
Officials agree that the technological shift represented by AVs will ease the political path toward introducing regulations long considered difficult to implement, such as congestion pricing. This paper’s results indicate that cities will most easily adapt their land uses and public rights-of-way in the context of the vehicles, with two-thirds or more of respondents agreeing that they personally supported policies to reduce minimum parking requirements, lower the amount of curbside parking, and transform car lanes into spaces for pedestrians and bicyclists. A similar level of respondents agreed that these policies were within their agencies’ bureaucratic capacities and their cities’ legal power. These findings reinforce the claim that planning outcomes do not need to be technologically determinist; there is real potential for local officials to promote the “public value” in their approaches to shaping the context in which these technologies operate [6,22].
Given the almost universally pro-sustainability and pro-equity perspectives of the policies presented to respondents, we might have expected universal support for all of the measures—a generalized respondent bias toward certain outcomes due to the nature of this study. Yet the responses on policies related to land uses and public rights-of-way contrast with policies examined related to the environment and the transportation system. For these latter types of issues, this paper’s findings affirm that cities will face two significant obstacles in making strides toward implementing new policies—even if officials believe something should be done. First, respondents indicated that they were under-resourced from a bureaucratic perspective; they lacked the manpower to create policies, even when they considered them necessary. Furthermore, second, officials are operating in an uncertain environment. The fact that so many were unaware of whether or not they had the legal power to introduce policies that virtually all of them had heard of and even previously discussed suggests that their primary planning approach is reactive, not proactive.
Moreover, the difference between personal support—potentially unrelated to what officials are actually able to accomplish—and local levels of bureaucratic capacity, legal feasibility, and political support, provides further evidence for limits on local-government power in the U.S. federal system [16]. Their status as subordinate to state governments and players in multijurisdictional environments means that progress on advancing AV-related policies cannot be a city-only affair. Indeed, in many cases, cities will have to collaborate with other levels of government and/or seek additional state authorization and funding.
Our paper identifies evidence for differences between cities that may determine which ones respond to AVs if they are given the opportunity to do so. Officials’ personal feelings about on-the-ground AV-related measures, and even more so, their expectations about local political support for such policies, are highly associated with the ideology of local residents. This was not our expectation based on previous results [19], but the implementation of AV-related policies seems likely to be filtered through political difference. This may be the product of the fact that staff are selected based on the politics of their respective cities, which, in turn, are founded on resident views. Nevertheless, these findings affirm that viewpoints on transportation issues, like budgets and other matters of important local concern [29,34], are reflective of ideological divergence and cannot be understood or evaluated as apolitical. Given the status of cities within the federal system, cities with more left-wing residents in states with similar populations [31] can be expected to introduce policies of the sort discussed here most rapidly, with their more conservative peers holding off. This has the potential to exacerbate differences in quality of life between cities.
Officials from cities with larger populations, higher per-capita expenditures, and higher levels of population increases are also more likely to support both regulatory strategies related to AVs in general, and many of the specific policies proposed for local consideration. Wealthier cities with the capacity to lead policy development independently are likely to take the first steps when it comes to regulation. Smaller cities with fewer municipal employees and less ability to orient resources to speculative planning may be more likely to wait to imitate larger cities.
5. Conclusions
These findings both help us better understand what municipalities are considering in terms of transportation policy now and also offer insight into how future regulations are likely to be contextualized. They help to bridge the gap between frequently recommended policies and the potential for their implementation, bringing “the political and economic forces shaping policy and innovation…into clear[er] view” [22] (p. 98). Local officials notably already have strong feelings about what regulations are appropriate for AVs, despite the fact that the full parameters of these vehicles, like whether they are electrified, or whether they are operated in shared use, have yet to be defined. Yet they are also already aware of their limited capacity to enact such regulatory measures.
Furthermore, these findings indicate that different buckets of cities, divided by characteristics such as population size and political leanings, will approach regulations alternatively. Both of these results serve to expand our understanding of how policymakers act in the face of technological uncertainty.
The degree to which our findings are relevant to non-U.S. contexts deserves further evaluation. U.S. cities are typically less densely populated and less reliant on public transportation than cities in developed countries in Asia and Europe. Perhaps these differences will be borne out through the form the vehicles take (e.g., larger AV shuttles outside the United States, as opposed to primarily car-sized AVs in the United States). We also believe more insight is necessary to understand variation in how local officials will develop policies related to vehicular and ride sharing. Both will likely be key to influencing the environmental impacts of AV technology.
We reaffirm the concerns raised in the introduction about the potentially nefarious consequences of relying on technological change to produce a better society [5,20,21,22,23]. The dominance of large automakers and tech firms in the promotion of AVs may ultimately result in greater capture of the economy by a few companies, greater surveillance, and a fall-off in democratic attachments—results whose negatives could outweigh the potential benefits of greater street space for pedestrians, for example. Moreover, the political weight of those companies, focused on profits, not the common good, may ultimately make any local progressive action more difficult due to efforts to have state governments preempt local power or simply buying out local elected leaders through campaign donations and the like.
Finally, research is necessary to evaluate whether officials’ views are representative of those of the political officials who ultimately will make decisions about which policies to introduce. The momentum towards new transportation policies to which these results point may fade away as AVs become more common, especially if personal automobiles are simply replaced with privately owned AVs, and if the transition is slow. Yet, given the excitement about seizing AVs to make change in the policy community and the manifest interest among survey respondents, we are more optimistic.
Author Contributions
Conceptualization and methodology, Y.F., A.H. and J.Z.; validation, formal analysis, investigation, resources, data preparation, and writing—original draft preparation, Y.F. and A.H.; writing—review and editing, Y.F., A.H. and J.Z.; visualization, Y.F.; supervision, project administration, and funding administration, J.Z. All authors have read and agreed to the published version of the manuscript.
Funding
This research was partially funded by Singapore-MIT Alliance for Research and Technology (SMART) and University Transportation Center (UTC) New England.
Acknowledgments
We appreciate the considerable feedback from members of MIT’s JTL Urban Mobility Lab, as well as the extensive and thoughtful comments from the anonymous peer reviewers.
Conflicts of Interest
The authors declare no conflict of interest. The funders had no role in the design of the study; in the collection, analyses, or interpretation of data; in the writing of the manuscript, or in the decision to publish the results.
Research Involving Human Subjects
All subjects gave their informed consent for inclusion before they participated in the study; research was approved by the Massachusetts Institute of Technology Institutional Review Board.
Appendix A. Web Survey Questions
- In which city and for what agency do you work?
- What is your role in a local government or governmental agency?
- (a) Elected official; (b) appointed official; (c) civil service staff; (d) other. *
- Please indicate the extent to which you agree with the below statements (Likert scale—strongly disagree to strongly agree) **
- AVs will fundamentally transform transportation in my city for the better
- I believe AVs should be regulated at the municipal level
- I am worried that AVs could pose a serious risk to my city and its citizens
- I believe that AVs will improve the quality of life in my city
- I anticipate public opposition to the introduction of AVs in my city
- I anticipate bureaucratic opposition to the introduction of AVs in my city
- I anticipate political opposition to the introduction of AVs in my city
- Roughly how many people are employed full-time in your department? **
- What departments/agencies are responsible for AV policy and/or regulation in your city? **
- When do you expect individuals in your city to be able to hail fully automated vehicles (with no test driver) for passenger service? **
- How do you think AVs are likely to change the following in your city? (Likert scale—decrease a lot to increase a lot) **
- VMT
- Number of cars on the road
- Traffic congestion
- Personal transportation costs
- Transportation safety
- Transit ridership
- Walking and biking
- Local government revenues
- Employment (transportation)
- Employment (general)
- Class and racial segregation
- Sprawling land uses
- Social equity (mobility)
- Social equity (general)
- Energy use
- Air pollution
- Should municipal governments develop regulations for AVs to address any of these issues?
- Options block issues: Reduce vehicle miles traveled? Reduce pollution? Increase access to mobility for low-income people? Increase public transportation ridership? Increase street space for pedestrians? Reduce private car ownership? Increase access to mobility for disabled people? Reduce sprawling land uses?
- Answer options: (a) Yes; (b) Maybe; (c) No: This isn’t an important policy; (d) No: Private companies should intervene; (e) No: Other levels of government should intervene.
- How well prepared is your organization for the arrival of AVs? (Likert scale—strongly disagree to strongly agree) **
- I believe my city is well prepared for AVs
- AV policy is a priority for my city
- It is clear who is responsible for AVs in my city
- My city has developed a clear policy for how to incorporate AVs onto its streets
- My city is waiting for federal and/or state legislation to pursue our own AV policies
- My city treats AVs as a mechanism to make broad policy changes beyond transportation
- My city has a clear plan to regulate AVs
- It is a priority for my city to be at the forefront of technological innovation
- How much time have officials devoted to crafting AV-related policies: **
- How much time have city staff debated to developing policies related to AVs?
- How much time have elected officials devoted to developing policies related to AVs?
- Rank these goals in terms of your position as a municipal leader: **
- Mobility
- Economic development
- Environmental sustainability
- Efficiency
- Equity
- Safety
- Technological innovation
- We will now ask you some questions about your city’s or agency’s plans for AVs and its ability to respond to changes in transportation systems. Please consider each of these potential policy ideas.
- Options block policies: Table 1, policies 1–3; 5–11, presented one-by-one.
- Answer options: (a) I personally think this is a good idea (Yes/No); (b) I would be willing to publicly endorse this idea (Yes/No) **; (c) My agency has the capacity and resources to pursue this idea (Yes/No); (d) There is political support in my city for this idea (Yes/No/I’m not sure); (e) It is legally feasible for my city to pursue this idea (Yes/No/I’m not sure).
- What is unique about the way your city is approaching AVs? (open)
- Who or what cities do you look to for inspiration or guidance on regulating AVs? (open)
- Are there any obstacles to the introduction of AVs we didn’t address? (open)
- What do you view as your city’s priorities in transportation more generally? (open)
- Anything else? (open)
* Note: We included this question to account for people who passed on the survey to others (who we did not contact initially). We did not receive any responses from elected officials.
** Not reported in this paper; many questions related to preparation reported in [19].
Appendix B

Table A1.
Respondent characteristics 1.
| State | Number of Cities Represented | Planning Official Respondents | Transportation Official Respondents | Other Respondents Charged with Local AV Policy |
|---|---|---|---|---|
| Arizona | 7 | 3 | 4 | 0 |
| California | 35 | 22 | 19 | 3 |
| Colorado | 5 | 2 | 4 | 0 |
| Connecticut | 2 | 1 | 1 | 0 |
| Florida | 9 | 4 | 5 | 1 |
| Georgia | 5 | 3 | 2 | 0 |
| Illinois | 2 | 2 | 1 | 0 |
| Indiana | 1 | 0 | 0 | 1 |
| Iowa | 2 | 0 | 2 | 0 |
| Kansas | 3 | 1 | 2 | 0 |
| Kentucky | 1 | 0 | 1 | 0 |
| Louisiana | 2 | 1 | 1 | 0 |
| Maryland | 1 | 0 | 1 | 0 |
| Massachusetts | 1 | 1 | 0 | 0 |
| Michigan | 3 | 1 | 3 | 0 |
| Minnesota | 2 | 1 | 2 | 1 |
| Mississippi | 1 | 1 | 0 | 0 |
| Missouri | 4 | 3 | 2 | 0 |
| Montana | 1 | 1 | 0 | 0 |
| Nebraska | 1 | 1 | 0 | 0 |
| Nevada | 1 | 1 | 0 | 0 |
| New Jersey | 3 | 2 | 1 | 0 |
| New York | 2 | 1 | 1 | 0 |
| North Carolina | 6 | 6 | 2 | 0 |
| Ohio | 2 | 3 | 0 | 0 |
| Oklahoma | 3 | 1 | 1 | 1 |
| Oregon | 4 | 3 | 5 | 0 |
| Pennsylvania | 1 | 0 | 1 | 0 |
| South Carolina | 1 | 0 | 1 | 0 |
| Tennessee | 3 | 1 | 2 | 0 |
| Texas | 20 | 14 | 8 | 1 |
| Utah | 2 | 2 | 1 | 0 |
| Virginia | 4 | 3 | 3 | 0 |
| Washington | 4 | 2 | 2 | 0 |
| Wisconsin | 2 | 2 | 0 | 0 |
| Total | 146 | 89 | 78 | 8 |
1 Source: Web survey of officials. Note: this table includes surveys that were only partially completed.
Appendix C. Follow-Up Survey Questions
[This interview was conducted over the phone with respondents, who were simultaneously asked to visit a website where they completed survey question #2 online.]
- I want to start out by clarifying what you envision when we say autonomous vehicles. If I asked you what is an autonomous vehicle, what would you say? What do you picture when you hear the words “autonomous vehicles”?
- For each of the following policies, we would like you to consider:
- Do you personally think it would be a good idea for your city to pursue this policy today in the context of current technology?
- Do you think there is political support in your city to pursue this policy today?
- Do you personally think it would be a good idea for your city to pursue this policy in the context of autonomous vehicles?
- How does the arrival of AVs change the political feasibility of this policy?
Feel free to discuss your thoughts if you have any as you’re answering.
[All thirteen policies listed in Table 1 were then provided to the respondent for his or her review; each respondent was expected to answer the four questions above for each policy.]
- 3.
- Of those policies, are there some that stick out to you with regards to AVs? Which ones seem to be most talked about in your department? Do you have any additional thoughts about how autonomous vehicles will change the feasibility of any of these policies and your city’s likelihood of engaging in them?
- Who does this affect, exactly? Policy makers? The public?
- Who is changing their acceptance of policies?
- 4.
- Are there any other policies for autonomous vehicles that we did not mention that are being discussed among you and your colleagues?
- 5.
- Do you see policymaking for AVs as wholly different from policymaking for present-day transportation-related issues, or on a continuum with today’s policies?
- 6.
- One final question: When envisioning a future with AVs, what do you picture and what is the timeline? Does that impact the way you think about policymaking?
Appendix D
Table A2.
Average marginal effects for ordered probit models: Officials’ perspective on need for local regulations related to the following issues 1.
Table A2.
Average marginal effects for ordered probit models: Officials’ perspective on need for local regulations related to the following issues 1.
| Variable | A. Reduce Sprawl | B. Increase Street Space for Pedestrians | C. Increase Low-Income Mobility | D. Increase Disabled Mobility | E. Reduce Pollution | F. Reduce VMT | G. Increase Transit Use | H. Reduce Private Car Use |
|---|---|---|---|---|---|---|---|---|
| Per−capita expenditures | 0.13% | 3.67% | 0.10% | 0.02% | 0.00% | 0.08% | 0.20% | −0.10% |
| Political ideology | −0.46% *** | −0.69% *** | −0.33% ** | −0.19% | −0.00% * | −0.03% | −0.22% * | −0.10% |
| Log(pop.)/10 | 3.28% | 7.25% * | 3.87% *** | 7.81% *** | 0.56% ** | 1.62% *** | 3.49% ** | 4.75% *** |
| Pop. change | 1.31% | 0.16% | 0.00% | 0.00% | −0.03% | 0.00% | 0.00% | 0.03% |
| % adults with BA + | −1.55% | −0.15% | −0.07% | 0.28% | −0.09% | −0.02% | −0.03% | 0.27% |
| Log(med. HH inc.)/10 | 1.92% | −4.69% | 0.09% | −2.04% | −5.84% | −5.77% | 0.46% | −6.99% |
| Pop. density/1000 | −0.06% | −0.34% | −0.07% | 0.02% | 0.00% | 0.03% | −0.07% | 0.19% |
| Med. Housing value/100,000 | 2.72% | −0.10% | −0.03% | −0.17 | 0.12% | 0.22% | −0.07% * | 0.15% |
| Member of planning dept. | 3.23% | 7.28% ** | −0.11% | 0.39% | −0.09% | −0.26% | −0.20% | 0.38% |
| Respondents | 153 | 155 | 154 | 152 | 153 | 154 | 154 | 153 |
1 Source: Web survey of officials. Note: Models are the same as those presented in Table 4, but variables have been scaled differently to allow for interpretation. Average marginal effects indicate the effects of a ten-percent increase in that variable, as transformed (noted in the leftmost column), except for member of planning department, which is the effect of moving from not being a member to being a member, on an individual’s probability of agreeing in response to each question. Unlike the coefficients presented in Table 4, these are not standardized across variables and thus the magnitude of each coefficient should not be compared directly with one another. *** p < 0.01; ** p < 0.05; * p < 0.1.
Appendix E
Table A3.
Binary logit regressions on bureaucratic capacity for policies 1.
| Variable | 1. Reduce Min. Parking | 2. Reduce Curbside Parking | 3. Transform car Lanes for Ped./Bike | 5. Low-Income Subsidies | 6. Require Zero-Emissions | 7. Require Min. Service | 8. Single Payment System | 9. Redesign Transit System | 10. Public Data Clearing-House | 11. Implement Road Pricing |
|---|---|---|---|---|---|---|---|---|---|---|
| Per-capita expenditures | 0.24 (0.18) | 0.02 (0.19) | −0.04 (0.19) | 0.00 (0.19) | −0.50 (0.15) *** | −0.18 (0.19) | −0.20 (0.15) | 0.02 (0.17) | 0.08 (0.17) | −0.10 (0.16) |
| Political ideology | 0.04 (0.21) | −0.38 (0.23) | −0.26 (0.25) | −0.35 (0.21) * | −0.34 (0.21) | −0.26 (0.20) | 0.11 (0.21) | 0.11 (0.20) | −0.26 (0.20) | −0.14 (0.18) |
| Log(pop.) | 0.38 (0.16) ** | −0.11 (0.19) | 0.25 (0.17) | 0.13 (0.18) | 0.14 (0.17) | 0.14 (0.16) | 0.12 (0.15 | 0.21 (0.16) | 0.21 (0.17) | −0.16 (0.10) |
| Pop. change | 0.31 (0.10) *** | 0.24 (0.11) ** | 0.27 (0.11) ** | 0.56 (0.16) *** | 0.25 (0.17) | 0.26 (0.15) * | 0.31 (0.14) ** | 0.39 (0.18) ** | 0.64 (0.16) *** | 0.47 (0.17) *** |
| % adults with BA + | −0.03 (0.23) | −0.08 (0.23) | 0.02 (0.25) | −0.32 (0.17) * | −0.01 (0.20) | −0.27 (0.19) | −0.10 (0.21) | 0.01 (0.19) | −0.46 (0.18) ** | −0.12 (0.19) |
| Log(med. HH inc.) | −0.12 (0.31) | 0.04 (0.34) | −0.16 (0.34) | −0.27 (0.29) | −0.51 (0.29) * | −0.16 (0.28) | −0.29 (0.31) | −0.23 (0.29) | −0.14 (0.27) | −0.30 (0.27) |
| Pop. density | −0.25 (0.21) | −0.16 (0.23) | −0.40 (0.24) * | −0.17 (0.24) | 0.08 (0.23) | −0.05 (0.22) | −0.14 (0.20) | −0.26 (0.20) | −0.23 (0.21) | −0.02 (0.20) |
| Med. Housing value | −0.00 (0.24) | 0.14 (0.27) | 0.21 (0.24) | 0.45 (0.27) * | 0.56 (0.26) ** | 0.30 (0.25) | 0.25 (0.23) | 0.54 (0.26) ** | 0.36 (0.23) | 0.37 (0.22) * |
| Member of planning dept. | 0.31 (0.14) ** | −0.11 (0.16) | 0.13 (0.15) | −0.19 (0.15) | −0.24 (0.14) | −0.59 (0.15) *** | −0.59 (0.14) *** | −0.26 (0.15) * | −0.36 (0.14) ** | −0.19 (0.13) |
| Intercept | 0.32 (0.11) *** | 0.39 (0.11) *** | 0.35 (0.11) *** | −0.35 (0.10) *** | −0.35 (0.10) *** | −0.17 (0.11) | −0.18 (0.11) | −0.27 (0.11) ** | −0.30 (0.10) *** | −0.55 (0.09) *** |
| Model | ||||||||||
| Degrees of freedom | 130 | 131 | 131 | 128 | 129 | 127 | 131 | 128 | 129 | 127 |
| Multiple R2 | 0.10 | 0.04 | 0.05 | 0.10 | 0.13 | 0.15 | 0.17 | 0.11 | 0.16 | 0.10 |
| Adjusted R2 | 0.03 | −0.03 | −0.01 | 0.04 | 0.07 | 0.09 | 0.11 | 0.04 | 0.10 | 0.04 |
1 Respondents: 142. Source: Web survey of officials. Note: Standardized coefficients; robust standard errors in parentheses. *** p < 0.01; ** p < 0.05; * p < 0.1.
Appendix F
Table A4.
Binary logit regressions on political support for policies 1.
| Variable | 1. Reduce Min. Parking | 2. Reduce Curbside Parking | 3. Transform Car Lanes for Ped./Bike | 5. Low−Income Subsidies | 6. Require Zero−Emissions | 7. Require Min. Service | 8. Single Payment System | 9. Redesign Transit System | 10. Public Data Clearing−House | 11. Implement Road Pricing |
|---|---|---|---|---|---|---|---|---|---|---|
| Per−capita expenditures | 0.13 (0.21) | −0.07 (0.22) | −0.08 (0.21) | 0.34 (0.18) * | −0.07 (0.24) | 0.16 (0.34) | −0.01 (0.18) | 0.16 (0.24) | 0.15 (0.47) | −0.27 (0.30) |
| Political ideology | −1.08 (0.22) *** | −1.00 (0.38) *** | −1.08 (0.30) *** | −1.30 (0.27) *** | −1.17 (0.26) *** | −1.18 (0.39) *** | −0.44 (0.28) | −0.54 (0.31) * | −0.85 (0.39) ** | −1.75 (0.35) *** |
| Log(pop.) | 0.20 (0.25) | 0.25 (0.25) | 0.06 (0.22) | −0.03 (0.15) | −0.04 (0.22) | 0.26 (0.30) | 0.46 (0.17) *** | 0.42 (0.17) ** | 0.45 (0.30) | −0.42 (0.29) |
| Pop. change | 0.31 (0.14) ** | 0.27 (0.14) * | −0.27 (0.23) | 0.29 (0.24) | −0.02 (0.28) | −0.03 (0.55) | 0.19 (0.17) | 0.15 (0.21) | 0.67 (0.26) ** | 0.34 (0.34) |
| % adults with BA + | 0.14 (0.28) | −0.58 (0.32) * | −0.33 (0.30) | −0.42 (0.18) ** | 0.12 (0.19) | −0.66 (0.43) | −0.10 (0.31) | −0.08 (0.35) | −0.77 (0.35) ** | −0.50 (0.34) |
| Log(med. HH inc.) | 0.42 (0.42) | 1.44 (0.39) *** | 0.78 (0.47) | 0.23 (0.37) | −0.36 (0.32) | 1.51 (0.73) ** | 0.15 (0.44) | 0.68 (0.55) | 0.24 (0.53) | 0.75 (0.47) |
| Pop. density | −0.23 (0.25) | 0.10 (0.31) | −0.47 (0.26) * | −0.83 (0.28) *** | 0.57 (0.31) * | −0.41 (0.48) | −0.71 (0.25) *** | −0.48 (0.26) * | −0.80 (0.57) | 0.20 (0.45) |
| Med. Housing value | −0.96 (0.39) ** | −1.24 (0.30) *** | −0.98 (0.34) *** | 0.07 (0.35) | 0.41 (0.32) | −0.63 (0.51) | −0.00 (0.38) | −0.73 (0.44) | 0.07 (0.54) | −0.25 (0.47) |
| Member of planning dept. | 0.48 (0.17) *** | −0.03 (0.21) | −0.32 (0.21) | −0.15 (0.18) | 0.29 (0.21) | −0.29 (0.27) | −0.40 (0.24) | −0.31 (0.26) | 0.44 (0.25) * | −0.15 (0.25) |
| Intercept | 0.06 (0.12) | −0.26 (0.12) ** | 0.16 (0.12) | 0.65 (0.11) *** | 0.40 (0.13) *** | 0.53 (0.17) *** | 0.66 (0.11) *** | 0.46 (0.11) *** | 0.17 (0.15) | −0.31 (0.17) * |
| Model | ||||||||||
| Degrees of freedom | 70 | 68 | 76 | 44 | 40 | 25 | 44 | 41 | 40 | 33 |
| Multiple R2 | 0.39 | 0.28 | 0.30 | 0.44 | 0.37 | 0.31 | 0.27 | 0.31 | 0.20 | 0.43 |
| Adjusted R2 | 0.31 | 0.18 | 0.22 | 0.33 | 0.23 | 0.07 | 0.11 | 0.16 | 0.02 | 0.28 |
1 Respondents: 142. Source: Web survey of officials. Note: Standardized coefficients; robust standard errors in parentheses. *** p < 0.01; ** p < 0.05; * p < 0.1.
Appendix G
Table A5.
Binary logit regressions on legal feasibility of policies 1.
| Variable | 1. Reduce Min. Parking | 2. Reduce Curbside Parking | 3. Transform Car Lanes for Ped./Bike | 5. Low-Income Subsidies | 6. Require Zero-Emissions | 7. Require Min. Service | 8. Single Payment System | 9. Redesign Transit System | 10. Public Data Clearing-House | 11. Implement Road Pricing |
|---|---|---|---|---|---|---|---|---|---|---|
| Per-capita expenditures | 0. 09 (0.05) | −0.01 (0.12) | −0.02 (0.09) | −0.14 (0.22) | −0.61 (0.26) ** | −0.81 (0.32) ** | −0.27 (0.26) | −0.07 (0.28) | −0.00 (0.37) | −1.57 (0.32) *** |
| Political ideology | −0.07 (0.07) | −0.07 (0.14) | −0.10 (0.11) | −0.38 (0.19) * | −0.84 (0.43) * | −0.79 (0.69) | 0.06 (0.30) | −0.04 (0.33) | −0.52 (0.48) | −0.68 (0.41) |
| Log(pop.) | 0.02 (0.03) | 0.07 (0.10) | 0.12 (0.08) | 0.10 (0.15) | −0.30 (0.44) | 0.46 (0.39) | 0.60 (0.17) *** | 0.14 (0.23) | 0.03 (0.32) | −0.14 (0.38) |
| Pop. change | −0.13 (0.12) | −0.10 (0.10) | 0.03 (0.04) | 0.13 (0.10) | −0.19 (0.32) | 0.52 (0.18) *** | 0.25 (0.12) ** | 0.39 (0.17) ** | 0.68 (0.26) ** | 0.06 (0.17) |
| % adults with BA + | 0.01 (0.04) | 0.12 (0.14) | −0.02 (0.10) | −0.06 (0.16) | −0.53 (0.46) | −0.73 (0.55) | 0.14 (0.34) | 0.52 (0.31) | −0.57 (0.36) | −0.05 (0.43) |
| Log(med. HH inc.) | 0.28 (0.18) | 0.23 (0.18) | 0.07 (0.11) | 0.12 (0.28) | −0.05 (0.47) | 0.05 (0.34) | −0.37 (0.39) | −0.74 (0.40) * | −0.40 (0.53) | −0.93 (0.43) ** |
| Pop. density | −0.01 (0.04) | 0.11 (0.14) | −0.14 (0.12) | 0.02 (0.12) | 0.08 (0.39) | 0.22 (0.46) | 0.16 (0.25) | −0.18 (0.27) | −0.14 (0.30) | 0.69 (0.50) |
| Med. Housing value | −0.27 (0.17) | −0.29 (0.17) | 0.06 (0.07) | −0.36 (0.36) | 0.33 (0.67) | 0.44 (0.59) | 0.11 (0.34) | 0.36 (0.43) | 0.33 (0.49) | 0.88 (0.51) * |
| Member of planning dept. | 0.07 (0.05) | 0.04 (0.09) | 0.08 (0.07) | −0.13 (0.21) | −0.07 (0.31) | −0.30 (0.34) | −0.47 (0.22) ** | 0.00 (0.20) | 0.20 (0.28) | −0.15 (0.27) |
| Intercept | 0.93 (0.04) *** | 0.88 (0.06) *** | 0.89 (0.06) *** | 0.82 (0.10) *** | 0.09 (0.19) | 0.12 (0.21) | 0.79 (0.12) *** | 0.56 (0.13) *** | 0.37 (0.19) * | −0.16 (0.18) |
| Model | ||||||||||
| Degrees of freedom | 110 | 100 | 102 | 34 | 26 | 22 | 39 | 54 | 28 | 31 |
| Multiple R2 | 0.17 | 0.08 | 0.05 | 0.18 | 0.28 | 0.39 | 0.24 | 0.10 | 0.16 | 0.34 |
| Adjusted R2 | 0.10 | −0.01 | −0.03 | −0.04 | 0.03 | 0.14 | 0.07 | −0.05 | −0.11 | 0.15 |
1 Respondents: 142. Source: Web survey of officials. Note: Only responses of “yes” or “no” included in responses. Standardized coefficients; robust standard errors in parentheses. *** p < 0.01; ** p < 0.05; * p < 0.1.
References
- Warner, S.B. Streetcar Suburbs; Harvard University Press: Cambridge, MA, USA, 1978. [Google Scholar] [CrossRef]
- Newman, P.W.G.; Kenworthy, J.R. The land use—Transport connection: An overview. Land Use Policy 1996, 13, 1–22. [Google Scholar] [CrossRef]
- Urry, J. The ‘System’ of Automobility. Theory Cult. Soc. 2004, 21, 25–39. [Google Scholar] [CrossRef] [Green Version]
- NACTO. Blueprint for Autonomous Urbanism; NACTO: New York, NY, USA, 2017. [Google Scholar]
- Ferreira, A.; von Schonfeld, K.; Tan, W.; Papa, E. Maladaptive Planning and the Pro-Innovation Bias: Considering the Case of Automated Vehicles. Urban Sci. 2020, 4, 41. [Google Scholar] [CrossRef]
- Docherty, I.; Marsden, G.; Anable, J. The governance of smart mobility. Transp. Res. Part A 2018, 115, 114–125. [Google Scholar] [CrossRef]
- SAE J3016: Levels of Driving Automation. Available online: https://www.sae.org/news/2019/01/sae-updates-j3016-automated-driving-graphic (accessed on 27 August 2020).
- Fagnant, D.J.; Kockelman, K. Preparing a national for autonomous vehicles: Opportunities, barriers and policy recommendations. Transp. Res. Part A 2015, 77, 167–181. [Google Scholar] [CrossRef]
- Lee, J.; Kockelman, K. Development of Traffic-Based Congestion Pricing and Its Application to Automated Vehicles. Transp. Res. Rec. 2019, 2673, 536–547. [Google Scholar] [CrossRef]
- Metz, D. Developing Policy for Autonomous Vehicles: Impact on Congestion. Urban Sci. 2018, 2, 33. [Google Scholar] [CrossRef] [Green Version]
- Ewing, R.; Pendall, R.; Chen, D. Measuring Sprawl and Its Transportation Impacts. Transp. Res. Rec. 2003, 1831, 175–183. [Google Scholar] [CrossRef]
- Johnson, M.P. Environmental Impacts of Urban Sprawl: A Survey of the Literature and Proposed Research Agenda. Environ. Plan. A 2001, 33, 717–735. [Google Scholar] [CrossRef] [Green Version]
- Chase, R. Will a World of Driverless Cars be Heaven or Hell? CityLab 2014. Available online: https://www.bloomberg.com/news/articles/2014-04-03/will-a-world-of-driverless-cars-be-heaven-or-hell (accessed on 28 October 2020).
- Levinson, D. Climbing Mount Next: The Effects of Autonomous Vehicles on Society. Minn. J. LawSci. Technol. 2015, 16, 787–809. [Google Scholar]
- Wolmar, C. Driverless Cars: On a Road to Nowhere; London Publishing Partnership: London, UK, 2018. [Google Scholar]
- Frug, G.; Barron, D.J. City Bound: How States Stifle Urban Innovation; Cornell University Press: Ithaca, NY, USA, 2008. [Google Scholar] [CrossRef]
- Schragger, R. City Power: Urban Governance in a Global Age; Oxford University Press: Oxford, UK, 2016. [Google Scholar]
- Bloomberg Philanthropies Initiative on Cities and Autonomous Vehicles. Available online: https://avsincities.bloomberg.org/ (accessed on 27 August 2020).
- Freemark, Y.; Hudson, A.W.; Zhao, J. Are Cities Prepared for Autonomous Vehicles? Planning for Technological Change by U.S. Local Governments. J. Am. Plan. Assoc. 2019, 85, 133–151. [Google Scholar] [CrossRef]
- Krivy, M. Towards a critique of cybernetic urbanism: The smart city and the society of control. Plan. Theory 2016, 17, 8–30. [Google Scholar] [CrossRef]
- Foroohar, R. Don’t Be Evil: The Case Against Big Tech; Penguin: London, UK, 2019. [Google Scholar]
- Legacy, C.; Ashmore, D.; Scheurer, J.; Stone, J.; Curtis, C. Planning the driverless city. Transp. Rev. 2019, 39, 84–102. [Google Scholar] [CrossRef]
- Zuboff, S. The Age of Surveillance Capitalism: The Fight for a Human Future at the New Frontier of Power; Profile Books: London, UK, 2019. [Google Scholar]
- Lewis, P.G.; McGhee, E. The Local Roots of Federal Policy Change: Transportation in the 1990s. Polity 2001, 34, 205–229. [Google Scholar] [CrossRef]
- Acharya, S.R.; Morichi, S. Motorization and role of mass rapid transit in East Asian megacities. Iatss Res. 2007, 31, 6–16. [Google Scholar] [CrossRef] [Green Version]
- Marsden, G.; Docherty, I. Insights on disruptions as opportunities for transport policy change. Transp. Res. Part A 2013, 51, 46–55. [Google Scholar] [CrossRef] [Green Version]
- Winner, L. Do Artifacts Have Politics? Daedalus 1980, 109, 121–136. [Google Scholar]
- Gavanas, N. Autonomous Road Vehicles: Challenges for Urban Planning in European Cities. Urban Sci. 2019, 3, 61. [Google Scholar] [CrossRef] [Green Version]
- Einstein, K.L.; Kogan, V. Pushing the City Limits: Policy Responsiveness in Municipal Government. Urban Aff. Rev. 2016, 52, 3–32. [Google Scholar] [CrossRef]
- Gerber, E.R. Partisanship and Local Climate Policy. Cityscape 2013, 15, 107–124. [Google Scholar]
- Hajnal, Z.L.; Trounstine, J. Who or What Governs? The Effects of Economics, Politics, Institutions, and Needs on Local Spending. Am. Politics Res. 2010, 38, 1130–1163. [Google Scholar] [CrossRef] [Green Version]
- Palus, C.K. Responsiveness in American Local Governments. State Local Gov. Rev. 2010, 42, 133–150. [Google Scholar] [CrossRef]
- Percival, G.L.; Johnson, M.; Neiman, M. Representation and Local Policy: Relating County-Level Public Opinion to Policy Outputs. Political Res. Q. 2009, 62, 164–177. [Google Scholar] [CrossRef]
- Tausanovitch, C.; Warshaw, C. Representation in Municipal Government. Am. Political Sci. Rev. 2014, 108, 605–641. [Google Scholar] [CrossRef] [Green Version]
- Sperling, D. Three Revolutions: Steering Automated, Shared, and Electric Vehicles to a Better Future; Island Press: Washington, DC, USA, 2018. [Google Scholar] [CrossRef]
- RPA. New Mobility: Autonomous Vehicles and the Region; RPA: New York, NY, USA, 2017. [Google Scholar]
- Loader, C.; Stanley, J. Growing bus patronage and addressing transport disadvantage—The Melbourne experience. Transp. Policy 2009, 16, 90–96. [Google Scholar] [CrossRef]
- Arnott, R. On the optimal target curbside parking occupancy rate. Econ. Transp. 2014, 3, 133–144. [Google Scholar] [CrossRef] [Green Version]
- Huang, H.F.; Cynecki, M.J. Effects of Traffic Calming Measures on Pedestrian and Motorist Behavior. Transp. Res. Rec. 2000, 1705, 26–31. [Google Scholar] [CrossRef] [Green Version]
- Nieuwenhuijsen, M.J.; Khreis, H. Car free cities: Pathway to healthy urban living. Environ. Int. 2016, 94, 251–262. [Google Scholar] [CrossRef] [PubMed]
- Schweitzer, L.; Taylor, B. Just Pricing: The Distributional Effects of Congestion Pricing and Sales Taxes. Transportation 2008, 35, 797–812. [Google Scholar] [CrossRef]
- Barkenbus, J. Our electric automobile future: CO2 savings through a disruptive technology. Policy Soc. 2009, 27, 399–410. [Google Scholar] [CrossRef]
- Camporeale, R.; Caggiani, L.; Fonzone, A.; Ottomanelli, M. Quantifying the impacts of horizontal and vertical equity in transit route planning. Transp. Plan. Technol. 2017, 40, 28–44. [Google Scholar] [CrossRef]
- Hensher, D.A.; Stopher, P.; Bullock, P. Service quality—Developing a service quality index in the provision of commercial bus contracts. Transp. Res. Part A 2003, 37, 499–517. [Google Scholar] [CrossRef]
- Shen, Y.; Zhang, H.; Zhao, J. Integrating shared autonomous vehicle in public transportation system: A supply-side simulation of the first-mile service in Singapore. Transp. Res. Part A 2018, 113, 125–136. [Google Scholar] [CrossRef]
- Iacobucci, J.; Hovenkotter, K.; Anbinder, J. Transit Systems and the Impacts of Shared Mobility. In Disrupting Mobility; Meyer, G., Shaheen, S., Eds.; Springer: New York, NY, USA, 2017. [Google Scholar] [CrossRef]
- Kuhn, K. Open Government Data and Public Transportation. J. Public Transp. 2011, 14, 83–97. [Google Scholar] [CrossRef] [Green Version]
- Small, K.A. Using the Revenues from Congestion Pricing. Transportation 1992, 19, 359–381. [Google Scholar] [CrossRef] [Green Version]
- Mogridge, M.J.H. The self-defeating nature of urban road capacity policy: A review of theories, disputes and available evidence. Transp. Policy 1997, 4, 5–23. [Google Scholar] [CrossRef]
- Marsden, G.; Reardon, L. Questions of governance: Rethinking the study of transportation policy. Transp. Res. Part A 2017, 101, 238–251. [Google Scholar] [CrossRef]
- U.S. Census. American Community Survey, 2016 1-Year; U.S. Census: Washington, DC, USA, 2017.
- Gailmard, S.; Patty, J.W. Slackers and Zealots: Civil Service, Policy Discretion, and Bureaucratic Expertise. Am. J. Political Sci. 2007, 51, 873–889. [Google Scholar] [CrossRef]
- Petchey, R.; Williams, J.; Carter, Y.H. From Street-Level Bureaucrats to Street-Level Policy Entrepreneurs? Central Policy and Local Action in Lottery-Funded Community Cancer Care. Soc. Policy Adm. 2007, 42, 59–76. [Google Scholar] [CrossRef]
- Cervero, R. Mobility Niches: Jitneys to Robo-Taxis. J. Am. Plan. Assoc. 2017, 83, 404–412. [Google Scholar] [CrossRef]
- Deakin, E.; Yip, S. The Value of Transportation Research: Researcher and Practitioner Perspectives. In Proceedings of the Association of Collegiate Schools of Planning Conference, Buffalo, NY, USA, 25–28 October 2018. [Google Scholar]
Figure 1.
Graphical representation of regression results presented in Table 5 for three regulations presented to respondents: Reducing minimum parking requirements (1), providing subsidies to low-income riders (5), and implementing road pricing (11). Variables are plotted as standardized coefficients, thus indicating the relative weight of each variable in impacting views on policies, with robust standard errors.

Figure 2.
Follow-up interviews: Change in personal support and expectations of political feasibility of transportation policies, before and after AV rollout. Number of respondents: 25. Source: Phone survey of officials. Change in personal support is calculated by subtracting the share of respondents who personally support each policy under today’s transportation conditions from the share of respondents who would support such a policy in a future with AVs. Change in political feasibility is calculated by subtracting the share of respondents who say a policy would become less politically feasible in a future with AVs from the share who say it would become more politically feasible.

Table 1.
Transportation policies highlighted in autonomous vehicle (AV)-related guidance and frequently mentioned in scholarly literature 1.
Table 1.
Transportation policies highlighted in autonomous vehicle (AV)-related guidance and frequently mentioned in scholarly literature 1.
| Transportation Policy | Potential Impact on AV Rollout |
|---|---|
| Land use and the public right of way | |
| 1. Reduction in minimum parking requirements for new developments | 1–4. Could encourage less vehicular ownership, lower vehicle miles traveled (VMT), increased use of shared AVs, more compact land uses, and greater use of alternative modes. |
| 2. Reduction in level of curbside parking | |
| 3. Transformation of traffic lanes for pedestrian, bike, transit use | |
| 4. Ban single-occupancy vehicles from portion or all of city | |
| Equity and the environment | |
| 5. Income-based subsidies for AV-transportation network company (TNC) service | 5. Could increase social equity. |
| 6. Require zero-emissions vehicles | 6. Could reduce point-based pollution. |
| 7. Minimum level of service for AV TNCs throughout city | 7. Could increase spatial equity. |
| The transportation system | |
| 8. Single fare system for transit and AV TNC | 8–9. Could improve efficiency of the transportation system and increase user comfort. |
| 9. Redesign transit system to account for AV TNC service | |
| 10. Public data clearinghouse to collect AV TNC data | 10. Could allow better planning and research. |
| 11. Distance and congestion charging for all drivers | 11. Could associate demand with supply and encourage more efficient use of roadways. |
| 12. Increase road capacity | 12. Could increase vehicular throughput. |
Table 2.
Should municipal governments develop regulations for AVs to address these issues? 1.
| Yes | Maybe | No: This Isn’t an Important Policy | No: Private Actors Should Intervene | No: Other Governments Should Intervene | |
|---|---|---|---|---|---|
| Land use and the public right-of-way | |||||
| A. Reduce sprawling land uses | 51.3% | 29.2% | 7.8% | 1.3% | 10.4% |
| B. Increase street space for pedestrians | 70.5% | 21.8% | 4.5% | 0.0% | 3.2% |
| Equity and the environment | |||||
| C. Increase access to mobility for low-income people | 51.6% | 21.9% | 1.9% | 7.1% | 17.4% |
| D. Increase access to mobility for disabled people | 58.8% | 20.3% | 1.3% | 1.3% | 18.3% |
| E. Reduce pollution | 31.2% | 17.5% | 1.9% | 2.6% | 46.8% |
| The transportation system | |||||
| F. Reduce VMT | 26.5% | 23.2% | 12.9% | 4.5% | 32.9% |
| G. Increase public transportation ridership | 47.7% | 23.9% | 3.9% | 3.9% | 20.6% |
| H. Reduce private car ownership | 16.2% | 14.3% | 30.5% | 14.9% | 24.0% |
1 Number of respondents: 156. Source: Web survey of officials.
Table 3.
Support for various policy ideas in the context of AVs 1.
| I Personally Think This Is a Good Idea | My Agency Has the Capacity and Resources to Pursue This Idea | It Is Legally Feasible for My City to Pursue This Idea | There Is Political Support in My City for This Idea | |||
|---|---|---|---|---|---|---|
| Yes | Yes | Yes | Not Sure | Yes | Not Sure | |
| Land use and the public right-of-way | ||||||
| 1. Reducing minimum parking required for new developments | 87.2% | 73.8% | 83.8% | 14.8% | 36.2% | 42.6% |
| 2. Reducing curbside parking | 74.1% | 66.2% | 73.4% | 22.4% | 19.7% | 44.4% |
| 3. Transforming car lanes into space for pedestrians and bicyclists | 79.9& | 71.1% | 76.8% | 20.4% | 31.2% | 38.3% |
| Equity and the environment | ||||||
| 5. Providing subsidies for low-income riders to use AV TNC services | 81.0% | 28.1% | 27.7% | 68.1% | 30.5% | 61.0% |
| 6. Requiring AVs to be zero-emissions vehicles | 79.3% | 26.4% | 13.4% | 73.9% | 26.8% | 64.1% |
| 7. Requiring a minimum level of service for AV TNC operators | 70.5% | 27.5% | 11.3% | 76.6% | 17.0% | 74.5% |
| The transportation system | ||||||
| 8. Implementing a single payment system for both transit and AV TNC service | 86.4% | 26.8% | 27.5% | 64.8% | 28.9% | 61.3% |
| 9. Redesigning transit system to account for AV TNC service options | 88.4% | 30.2% | 35.0% | 54.5% | 23.8% | 63.6% |
| 10. Implementing a public data clearinghouse that collects and releases data about AV TNC trips | 85.0% | 26.4% | 19.7% | 72.5% | 23.9% | 64.1% |
| 11. Implementing distance- and congestion-based road pricing | 74.1% | 18.1% | 11.4% | 70.0% | 9.3% | 68.6% |
1 Number of respondents: 141. Source: Web survey of officials. Note: “No” answers are not included on this table. In addition, policies 4 and 12 are not included here, or on several of the following tables, as they were added for the second round of interviews only.
Table 4.
Ordered probit regression of officials’ perspective on need for local regulations related to the following issues 1.
Table 4.
Ordered probit regression of officials’ perspective on need for local regulations related to the following issues 1.
| Variable | A. Reduce Sprawl | B. Increase Street Space for Pedestrians | C. Increase Low-Income Mobility | D. Increase Disabled Mobility | E. Reduce Pollution | F. Reduce VMT | G. Increase Transit Use | H. Reduce Private Car Use |
|---|---|---|---|---|---|---|---|---|
| Per-capita expenditures | 0.14 (0.27) | 0.35 (0.31) | 0.19 (0.25) | 0.03 (0.27) | 0.02 (0.27) | 0.30 (0.27) | 0.36 (0.26) | −0.17 (0.26) |
| Political ideology | −0.69 (0.26) *** | −1.21 (0.33) *** | −0.87 (0.36) ** | −0.45 (0.34) | −0.54 (0.32) * | −0.49 (0.37) | −0.56 (0.29) * | −0.34 (0.31) |
| Log(pop.) | 0.32 (0.21) | 0.63 (0.34) * | 0.66 (0.25) *** | 0.91 (0.24) *** | 0.66 (0.27) ** | 0.63 (0.22) *** | 0.55 (0.24) ** | 0.84 (0.26) *** |
| Pop. change | 0.38 (0.29) | 0.33 (0.21) | 0.14 (0.23) | −0.14 (0.22) | −0.12 (0.28) | 0.01 (0.26) | 0.13 (0.19) | 0.09 (0.29) |
| % adults with BA + | −0.11 (0.27) | −0.08 (0.35) | −0.14 (0.33) | 0.29 (0.34) | −0.16 (0.28) | −0.03 (0.29) | −0.05 (0.27) | 0.23 (0.27) |
| Log(med. HH inc.) | 0.09 (0.38) | −0.18 (0.41) | −0.41 (0.44) | −0.29 (0.42) | −0.44 (0.41) | −0.32 (0.43) | 0.05 (0.41) | −0.43 (0.49) |
| Pop. density | −0.08 (0.35) | −0.40 (0.44) | −0.22 (0.30) | 0.04 (0.33) | 0.13 (0.39) | 0.21 (0.40) | −0.21 (0.33) | 0.47 (0.40) |
| Med. Housing value | −0.41 (0.35) | −0.08 (0.39) | −0.23 (0.40) | −0.49 (0.40) | 0.36 (0.38) | 0.55 (0.40) | −0.61 (0.36) * | 0.21 (0.46) |
| Member of planning dept. | 0.24 (0.19) | 0.46 (0.23) ** | −0.02 (0.20) | 0.05 (0.21) | −0.02 (0.20) | −0.03 (0.19) | −0.04 (0.19) | 0.04 (0.22) |
| Thresholds | ||||||||
| No|Maybe | −0.83 (0.16) *** | −1.55 (0.20) *** | −0.78 (0.15) *** | −0.97 (0.17) *** | 0.00 (0.16) | −0.05 (0.15) | −0.68 (0.14) *** | 0.57 (0.17) *** |
| Maybe|Yes | 0.09 (0.14) | −0.46 (0.16) *** | −0.05 (0.15) | −0.27 (0.16) * | 0.55 (0.17) *** | 0.71 (0.16) *** | 0.05 (0.14) | 1.16 (0.18) *** |
| Model | ||||||||
| Respondents | 153 | 155 | 154 | 152 | 153 | 154 | 154 | 153 |
| Log−likelihood | −145.38 | −99.87 | −136.13 | −127.89 | −136.71 | −139.15 | −146.79 | −108.26 |
1 Source: Web survey of officials. Model was ordered based on responses of “yes”, “maybe”, or “no;” those answering “private companies should intervene”, “other levels of government should intervene”, and “this is not an important policy” all categorized as “no”. Standardized coefficients; robust standard errors in parentheses. *** p < 0.01; ** p < 0.05; * p < 0.1.
Table 5.
Binary logit regression on personal support for on-the-ground policies 1.
| Variable | 1. Reduce Min. Parking | 2. Reduce Curbside Parking | 3. Transform Car Lanes for Ped./Bike | 5. Low-Income Subsidies | 6. Require Zero-Emissions | 7. Require Min. Service | 8. Single Payment System | 9. Redesign Transit System | 10. Public Data Clearing-House | 11. Implement Road Pricing |
|---|---|---|---|---|---|---|---|---|---|---|
| Per-capita expenditures | 0.10 (0.12) | 0.10 (0.19) | 0.28 (0.13) ** | 0.30 (0.13) ** | 0.00 (0.14) | 0.28 (0.18) | 0.06 (0.15) | 0.41 (0.12) *** | −0.11 (0.16) | 0.28 (0.16) |
| Political ideology | −0.48 (0.15) *** | −0.53 (0.21) ** | −0.54 (0.17) *** | −0.49 (0.20) ** | −0.07 (0.24) | −0.23 (0.24) | −0.17 (0.18) | −0.07 (0.15) | −0.33 (0.20) * | −0.57 (0.20) *** |
| Log(pop.) | 0.14 (0.09) | 0.41 (0.13) *** | 0.22 (0.12) * | 0.15 (0.12) | −0.01 (0.13) | 0.23 (0.13) * | 0.26 (0.11) ** | 0.11 (0.15) | 0.20 (0.11) * | −0.08 (0.15) |
| Pop. change | 0.24 (0.09) ** | 0.13 (0.17) | −0.12 (0.17) | 0.12 (0.18) | 0.11 (0.16) | −0.13 (0.22) | 0.08 (0.08) | −0.02 (0.09) | 0.15 (0.09) * | 0.03 (0.14) |
| % adults with BA + | 0.14 (0.12) | −0.56 (0.20) *** | −0.31 (0.19) * | −0.37 (0.22) * | 0.25 (0.22) | −0.02 (0.23) | −0.19 (0.17) | −0.03 (0.20) | −0.20 (0.21) | −0.46 (0.22) ** |
| Log(med. HH inc.) | −0.03 (0.17) | 0.37 (0.28) | 0.14 (0.28) | 0.24 (0.30) | −0.59 (0.30) * | 0.45 (0.34) | 0.23 (0.22) | 0.38 (0.26) | 0.18 (0.27) | 0.50 (0.29) * |
| Pop. density | −0.20 (0.13) | −0.28 (0.22) | −0.43 (0.18) ** | −0.34 (0.17) ** | 0.04 (0.19) | −0.10 (0.21) | −0.17 (0.17) | −0.34 (0.19) * | −0.23 (0.14) | −0.18 (0.19) |
| Med. Housing value | −0.20 (0.18) | −0.23 (0.24) | −0.14 (0.24) | 0.04 (0.23) | 0.45 (0.21) ** | −0.56 (0.29) * | −0.14 (0.17) | −0.30 (0.20) | 0.10 (0.23) | −0.07 (0.25) |
| Member of planning dept. | 0.37 (0.10) *** | −0.08 (0.14) | 0.20 (0.13) | 0.11 (0.13) | 0.32 (0.14) ** | 0.06 (0.15) | −0.15 (0.12) | 0.03 (0.11) | 0.15 (0.13) | −0.04 (0.15) |
| Intercept | 0.57 (0.09) *** | 0.51 (0.09) *** | 0.49 (0.09) *** | 0.56 (0.09) *** | 0.42 (0.11) *** | 0.38 (0.11) *** | 0.8 (0.07) *** | 0.78 (0.07) *** | 0.63 (0.09) *** | 0.50 (0.10) *** |
| Model | ||||||||||
| Degrees of freedom | 130 | 128 | 128 | 126 | 129 | 128 | 129 | 127 | 129 | 124 |
| Multiple R2 | 0.23 | 0.15 | 0.20 | 0.10 | 0.11 | 0.08 | 0.06 | 0.12 | 0.06 | 0.09 |
| Adjusted R2 | 0.18 | 0.09 | 0.14 | 0.04 | 0.05 | 0.02 | −0.00 | 0.06 | −0.01 | 0.03 |
1 Number of respondents: 142. Source: Web survey of officials. Note: Standardized coefficients; robust standard errors in parentheses. *** p < 0.01; ** p < 0.05; * p < 0.1.
Table 6.
Summary of follow-up interviews, by on-the-ground policy 1.
| Policy | Response Summary | Indicative Quotes |
|---|---|---|
| Land use and the public right-of-way | ||
| 1. Reducing min. parking required for new developments |
|
|
| 2. Reducing curbside parking |
|
|
| 3. Transforming car lanes into space for peds. and bikers |
|
|
| 4. Ban single-occupancy autos. from all or parts of city |
|
|
| Equity and the environment | ||
| 5. Providing subsidies for low-income riders to use (AV) TNC services |
|
|
| 6. Requiring new vehicles to be zero-emissions |
|
|
| 7. Requiring a minimum level of service for (AV) TNC operators |
|
|
| The transportation system | ||
| 8. Implementing a single payment system for transit and (AV) TNC service |
|
|
| 9. Redesigning transit system to account for (AV) TNC service options |
|
|
| 10. Implementing a public data clearinghouse |
|
|
| 11. Implementing distance- and congestion-based road pricing |
|
|
| 12. Increasing road capacity |
|
|
1 Number of respondents: 25. Source: Phone survey of officials.
Publisher’s Note: MDPI stays neutral with regard to jurisdictional claims in published maps and institutional affiliations. |
© 2020 by the authors. Licensee MDPI, Basel, Switzerland. This article is an open access article distributed under the terms and conditions of the Creative Commons Attribution (CC BY) license (http://creativecommons.org/licenses/by/4.0/).
Share and Cite
MDPI and ACS Style
Freemark, Y.; Hudson, A.; Zhao, J. Policies for Autonomy: How American Cities Envision Regulating Automated Vehicles. Urban Sci. 2020, 4, 55. https://0-doi-org.brum.beds.ac.uk/10.3390/urbansci4040055
AMA Style
Freemark Y, Hudson A, Zhao J. Policies for Autonomy: How American Cities Envision Regulating Automated Vehicles. Urban Science. 2020; 4(4):55. https://0-doi-org.brum.beds.ac.uk/10.3390/urbansci4040055
Chicago/Turabian StyleFreemark, Yonah, Anne Hudson, and Jinhua Zhao. 2020. "Policies for Autonomy: How American Cities Envision Regulating Automated Vehicles" Urban Science 4, no. 4: 55. https://0-doi-org.brum.beds.ac.uk/10.3390/urbansci4040055