Article

Health Benefit Assessment of Running in Urban Areas against the Background of Particulate Matter 2.5 Concentration: The Munich Olympic Park

Sport and Health Management, Technical University of Munich, Uptown Munich—Campus D, 80992 Munich, Germany
*
Author to whom correspondence should be addressed.
Submission received: 13 October 2020 / Revised: 3 November 2020 / Accepted: 5 November 2020 / Published: 12 November 2020

Abstract

:
Air pollution while exercising is a health threat to urban residents. The study’s purpose is to conduct a health benefit assessment for running against the background of the Particulate Matter (PM) 2.5 concentration, taking the Munich Olympic Park as a case. The health benefit assessment was done under the assumption that people exercise at different PM2.5 concentrations and with varying duration and intensity. PM2.5 concentrations in and around the Olympic Park area were measured on 25 rain-free days from July until November 2019, using DC1700 (Dylos). The results show that, for the example of a 60-min run at a moderate intensity (60% VO2max), the PM2.5 concentration at which running no longer leads to additional health benefits amounts to 55 μg/m3 (tipping point). Harms outweigh health benefits at 95 μg/m3 (break-even point). The average PM2.5 concentration during the runs to and inside the Olympic Park was above the tipping point on one day, but did not reach the break-even point on any of the days. The average concentration across all days did not reach the tipping or break-even points for any running duration. The Munich Olympic Park provides a potentially health-enhancing space to residents from the perspective of PM2.5-related air pollution.

1. Introduction

Particulate matter (PM) is a pollutant, which harms organs and body functions [1]. Since many people around the world are continuously exposed to levels above WHO guideline values, the total health impact of PM exposure is large [2]. PM-polluted air is a particular threat to runners, because, compared to other active travellers (such as cyclists and walkers), they inhale more air in a given time frame [3]. The consequence is a proportional increase in the amount of pollutants inhaled and an increased airflow velocity, transferring pollutants deeper into the respiratory tract. Additionally, a larger fraction of air bypasses the normal nasal mechanisms when inhaled by mouth breathing during increased exercise [4]. More precisely, Pasqua et al. [5] estimated the inhaled dose of air pollutants (PM2.5; PM10) during two simulated 30-min moderate continuous exercise routines in the cleanest and dirtiest cities reported by the WHO considering air quality. They and others [6] used two specific thresholds to compare benefits and risks: the tipping point, that is, the point where an incremental increase in physical activity will no longer lead to an increase in health benefits (i.e., benefits are at their maximum); the break-even point, that is, the point where risks from air pollution start outweighing the benefits of physical activity (i.e., compared to not being physically active, there are no net benefits any more—the activity is getting harmful).
In Pasqua et al.’s [5] study, the relative risk assessment of an all-cause mortality analysis showed that exercising in the cleanest cities improved health benefits throughout up to 90 min of running (i.e., the longest time-period that was considered by the authors; no tipping or break-even points were identified for running durations between 0 and 90 min). In the dirtiest cities, however, no further health benefits occurred after 15 min of exercising (tipping point); after 75 min, air pollution health risks surpassed benefits (break-even point). Tainio et al. [6] examined the risk–benefit balance between active travel related physical activity and exposure to PM2.5 across a range of air pollution and physical activity scenarios. They found that, for the global average urban PM2.5 concentration (22 µg/m3), benefits of physical activity outweigh risks from air pollution by far, even under the most extreme levels of active travel. In areas with PM2.5 concentrations of 100 µg/m3, harms exceed benefits after 90 min of cycling per day or more than 10 h of walking per day. The authors calculated that the tipping point for 30 min of cycling every day was 95 μg/m3 (about 1% of all cities in the world based on data from 2014 exceeded this value). Furthermore, the break-even point for 30 min of cycling every day was set at 160 μg/m3. Giallouros et al. [7] contrast cycling and walking to work, respectively, with working from home or using public transport to get to work. Their health impact assessment showed that walking and cycling reduce all-cause mortality even in high air pollution environments (Beijing and New Delhi were considered in their study). Switching to public transportation or working from home on days with high PM2.5 concentrations had no effect on the long-term risk for all-cause mortality in lowly or moderately polluted cities, but in highly polluted cities (where risks would increase if cycling and walking were restricted on days below 150 μg/m3).
While Pasqua et al. [5] considered running as an activity in their study, they did not calculate PM2.5 concentrations of the tipping and break-even points for different running intensities. Tainio et al. [6] referred to cycling and walking as active travel modes with lower ventilation per minute compared to running [3]. To close this research gap, the goal of the present study is to calculate the values of the PM2.5 concentration for the tipping and break-even points for running at different intensities (at 40%, 60%, 80%, and 85% VO2max (maximum rate of oxygen consumption)—these intensities can be considered as low, medium, high, and very high and they have been used in prior studies [8]) and to assess whether PM2.5 concentrations during a run to and in an urban park (green space) reach the tipping and break-even points, considering the Munich Olympic Park as the case.

2. Materials and Methods

2.1. Health Benefit Assessment

The reduction in all-cause mortality due to running was estimated by converting the time spent running at the metabolic equivalent of task (MET) depending on the running intensity (40% VO2max = 11.4 MET, 60% VO2max = 17.4 MET, 80% VO2max = 22.6 MET, and 85% VO2max = 24.3 MET) based on Jackson et al. [9]. The risk reduction in all-cause mortality for running was set at 0.73 according to a meta-analysis from Pedisic et al. [10]. For calculating the risk reduction using dose–response functions, the 0.50 power transformation from Kelly et al. [11] was used. It is a trade-off between linear and extremely non-linear dose–response functions. Non-linearity in a dose–response function means that the health benefits of increased running level out at an earlier point in time and that the different thresholds (break-even and tipping points) are reached earlier than with more linear dose–response functions [6].
The health risks of PM2.5 were estimated by converting background PM2.5 concentrations to running exposure concentrations and by taking increased ventilation rates during running into account. For the background concentrations, values between 5 and 200 μg/m3 with intervals of 5 μg/m3 were chosen [6]. The total number of deposited particles was estimated by multiplying the background PM2.5 concentrations with 4.0 for running [12,13]. The counterfactual scenario for the time spent running was assumed to be staying at home [6]. Furthermore, the differences in ventilation rates for running at 40% VO2max, 60% VO2max, 80% VO2max, and 85% VO2max, respectively, were taken into account when converting exposure to inhaled doses. Ventilation rates of 2.9, 4.3, 5.7, and 6.1, respectively, were used based on the Pasqua et al.’s [5] and Tainio et al.’s [6] findings. For the PM2.5 dose–response function, a relative risk value of 1.07 per 10 μg/m3 change in exposure was used [6,14]. The sleep time was assumed to be 8 h in all scenarios and the resting time was 16 h minus the time for running [6].

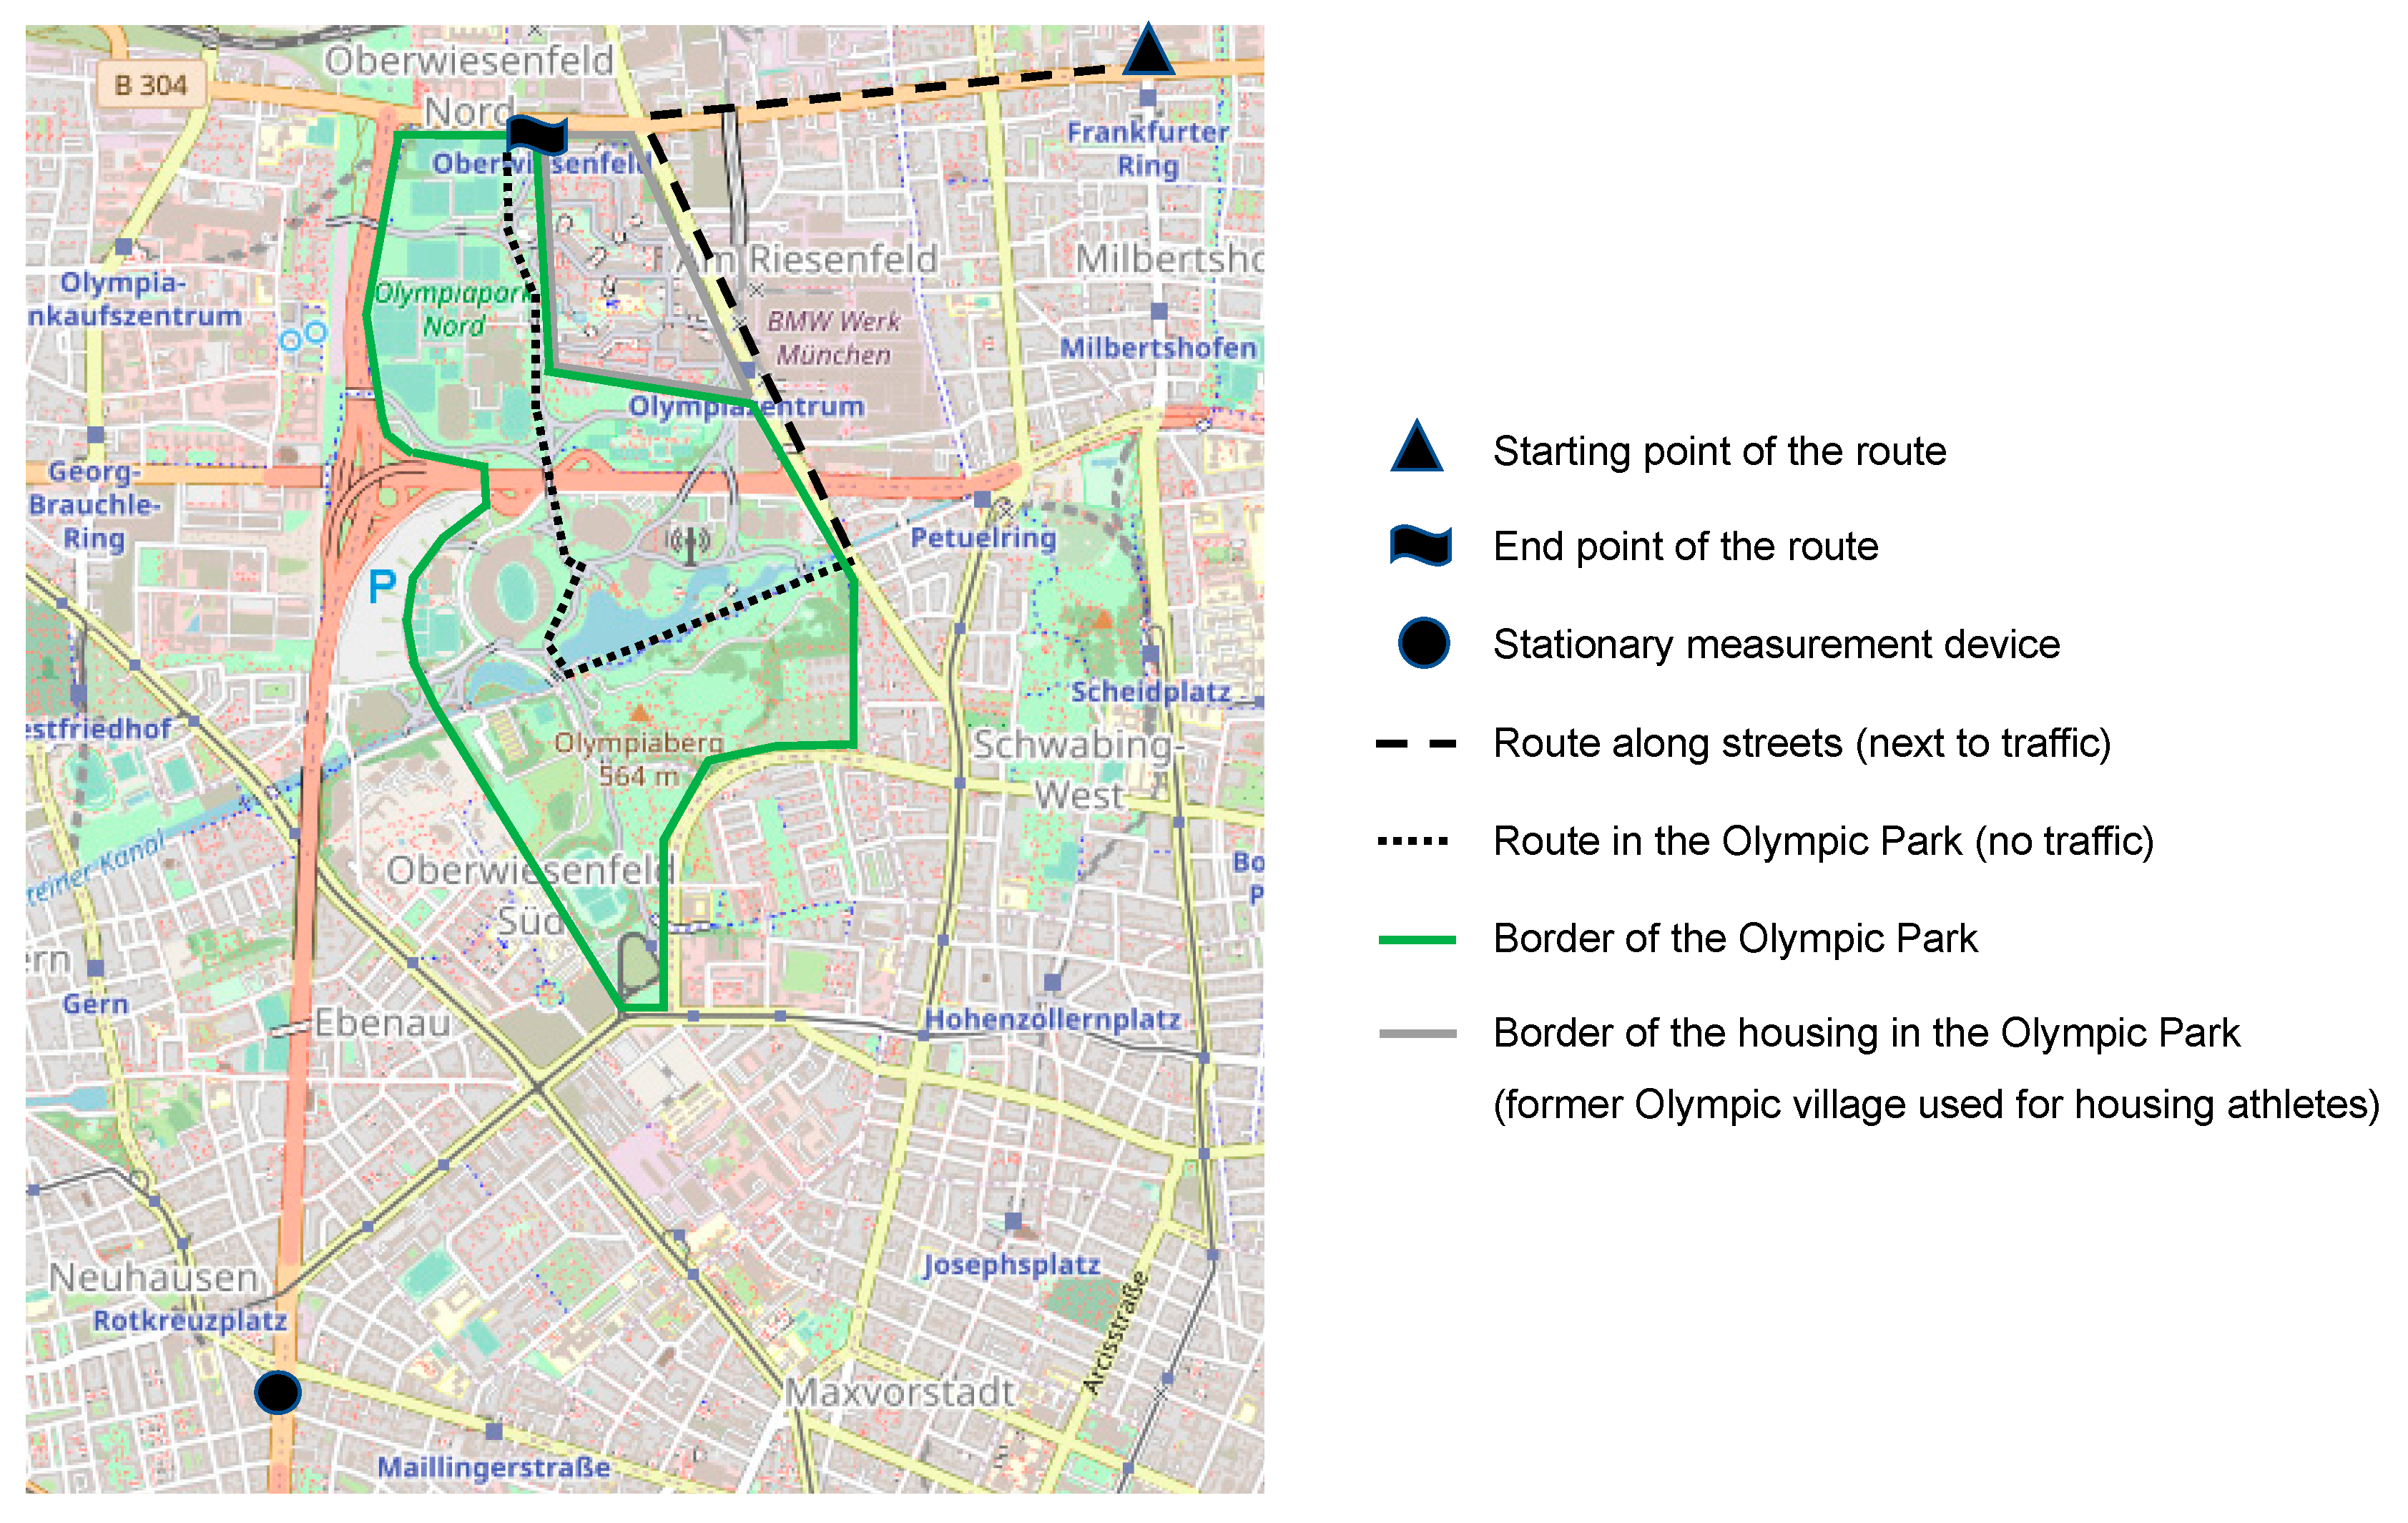
2.2. PM2.5 Concentration in the Munich Olympic Park

The Munich Olympic Park was chosen as the research site. It provides residents with green space as part of the legacy of the 1972 Olympic Games. Green space, besides infrastructure, is a typical legacy of the hosting of mega-sport events [15]. The park has been largely unchanged since 1972 and is 160 hectares in size. There is almost no traffic inside the park and it includes a hill, a lake, and several sporting facilities—with the back-then goal to form an “Olympic landscape”, according to architect Günther Benisch [16]. Today, millions of people visit the Olympic Park in their leisure time, and running is one of the most popular activities.
To measure PM2.5 concentrations, the DC1700 air quality monitor from Dylos Corporation was used. The direct-reading device measures the number of particles with a size between 0.5 and 2.5 microns as well as the number of particles with a size of more than 2.5 microns (which is out of interest to the present study). The instrument uses the principle of light scattering technology. The fan of the DC 1700 draws fine particles through the inlet into the sensing zone where a red laser beam illuminates the air flow. Then, each individual particle scatters the light inside this sensing chamber [17]. The scattered light determines the number of particles. Although the main purpose of the DC1700 is to measure indoor air quality, several studies showed that it is a valid tool for measuring outdoor air quality, too [18,19]. In the study, the sampling rate was 60 s.
Between 7 July and 21 November 2019, measurements were taken on 25 non-rainy and non-school or national/state holiday days in the evenings (6–7 p.m.), when most German runners exercise during a typical weekday (here, Monday–Thursday [20]). Information about relative humidity and air temperature were retrieved from the official homepage of the Deutscher Wetterdienst for every measurement day at 6 p.m. Based on Arling, O’Connora, and Mercieca’s [21] formula, PM2.5 was calculated taking into account the number of particle counts and the mass of particle, adjusted by a humidity factor and a dry or a rain factor (PM concentration [μg/m3] = number of particles × 3531.5 × particle mass × relative humidity factor × dry or rain factor).
The device was fixated on a bicycle, where a wind-protective tool was mounted, to ensure low-impact movement and unwanted biases from strong winds. The bicycle was moved at a pace of 10 km/h along a five-kilometre route (to simulate running speed). Global Positioning System (GPS) data were used to track the device (so that time spent in areas in green space (with a distance of more than five meters to traffic) and outside green space (with a distance of five meters or less to traffic) could be referred to the location). A situation was simulated, in which a resident lives one kilometre away from the park (a distance that allows all people of the German population to access green space around their place of residence; [22]). The route went along streets that lead to the park for 2.5 kilometres (route nearby traffic); next, it went inside the Olympic Park area for another 2.5 kilometres (route in green space). Appendix A shows the route that was taken. Also, the PM 2.5 concentration measurements, the values were compared with the values provided by the nearest stationary air-quality equipment, installed by the Bayerisches Landesamt für Umwelt [23] at Landshuter Allee (see Appendix A).

3. Results

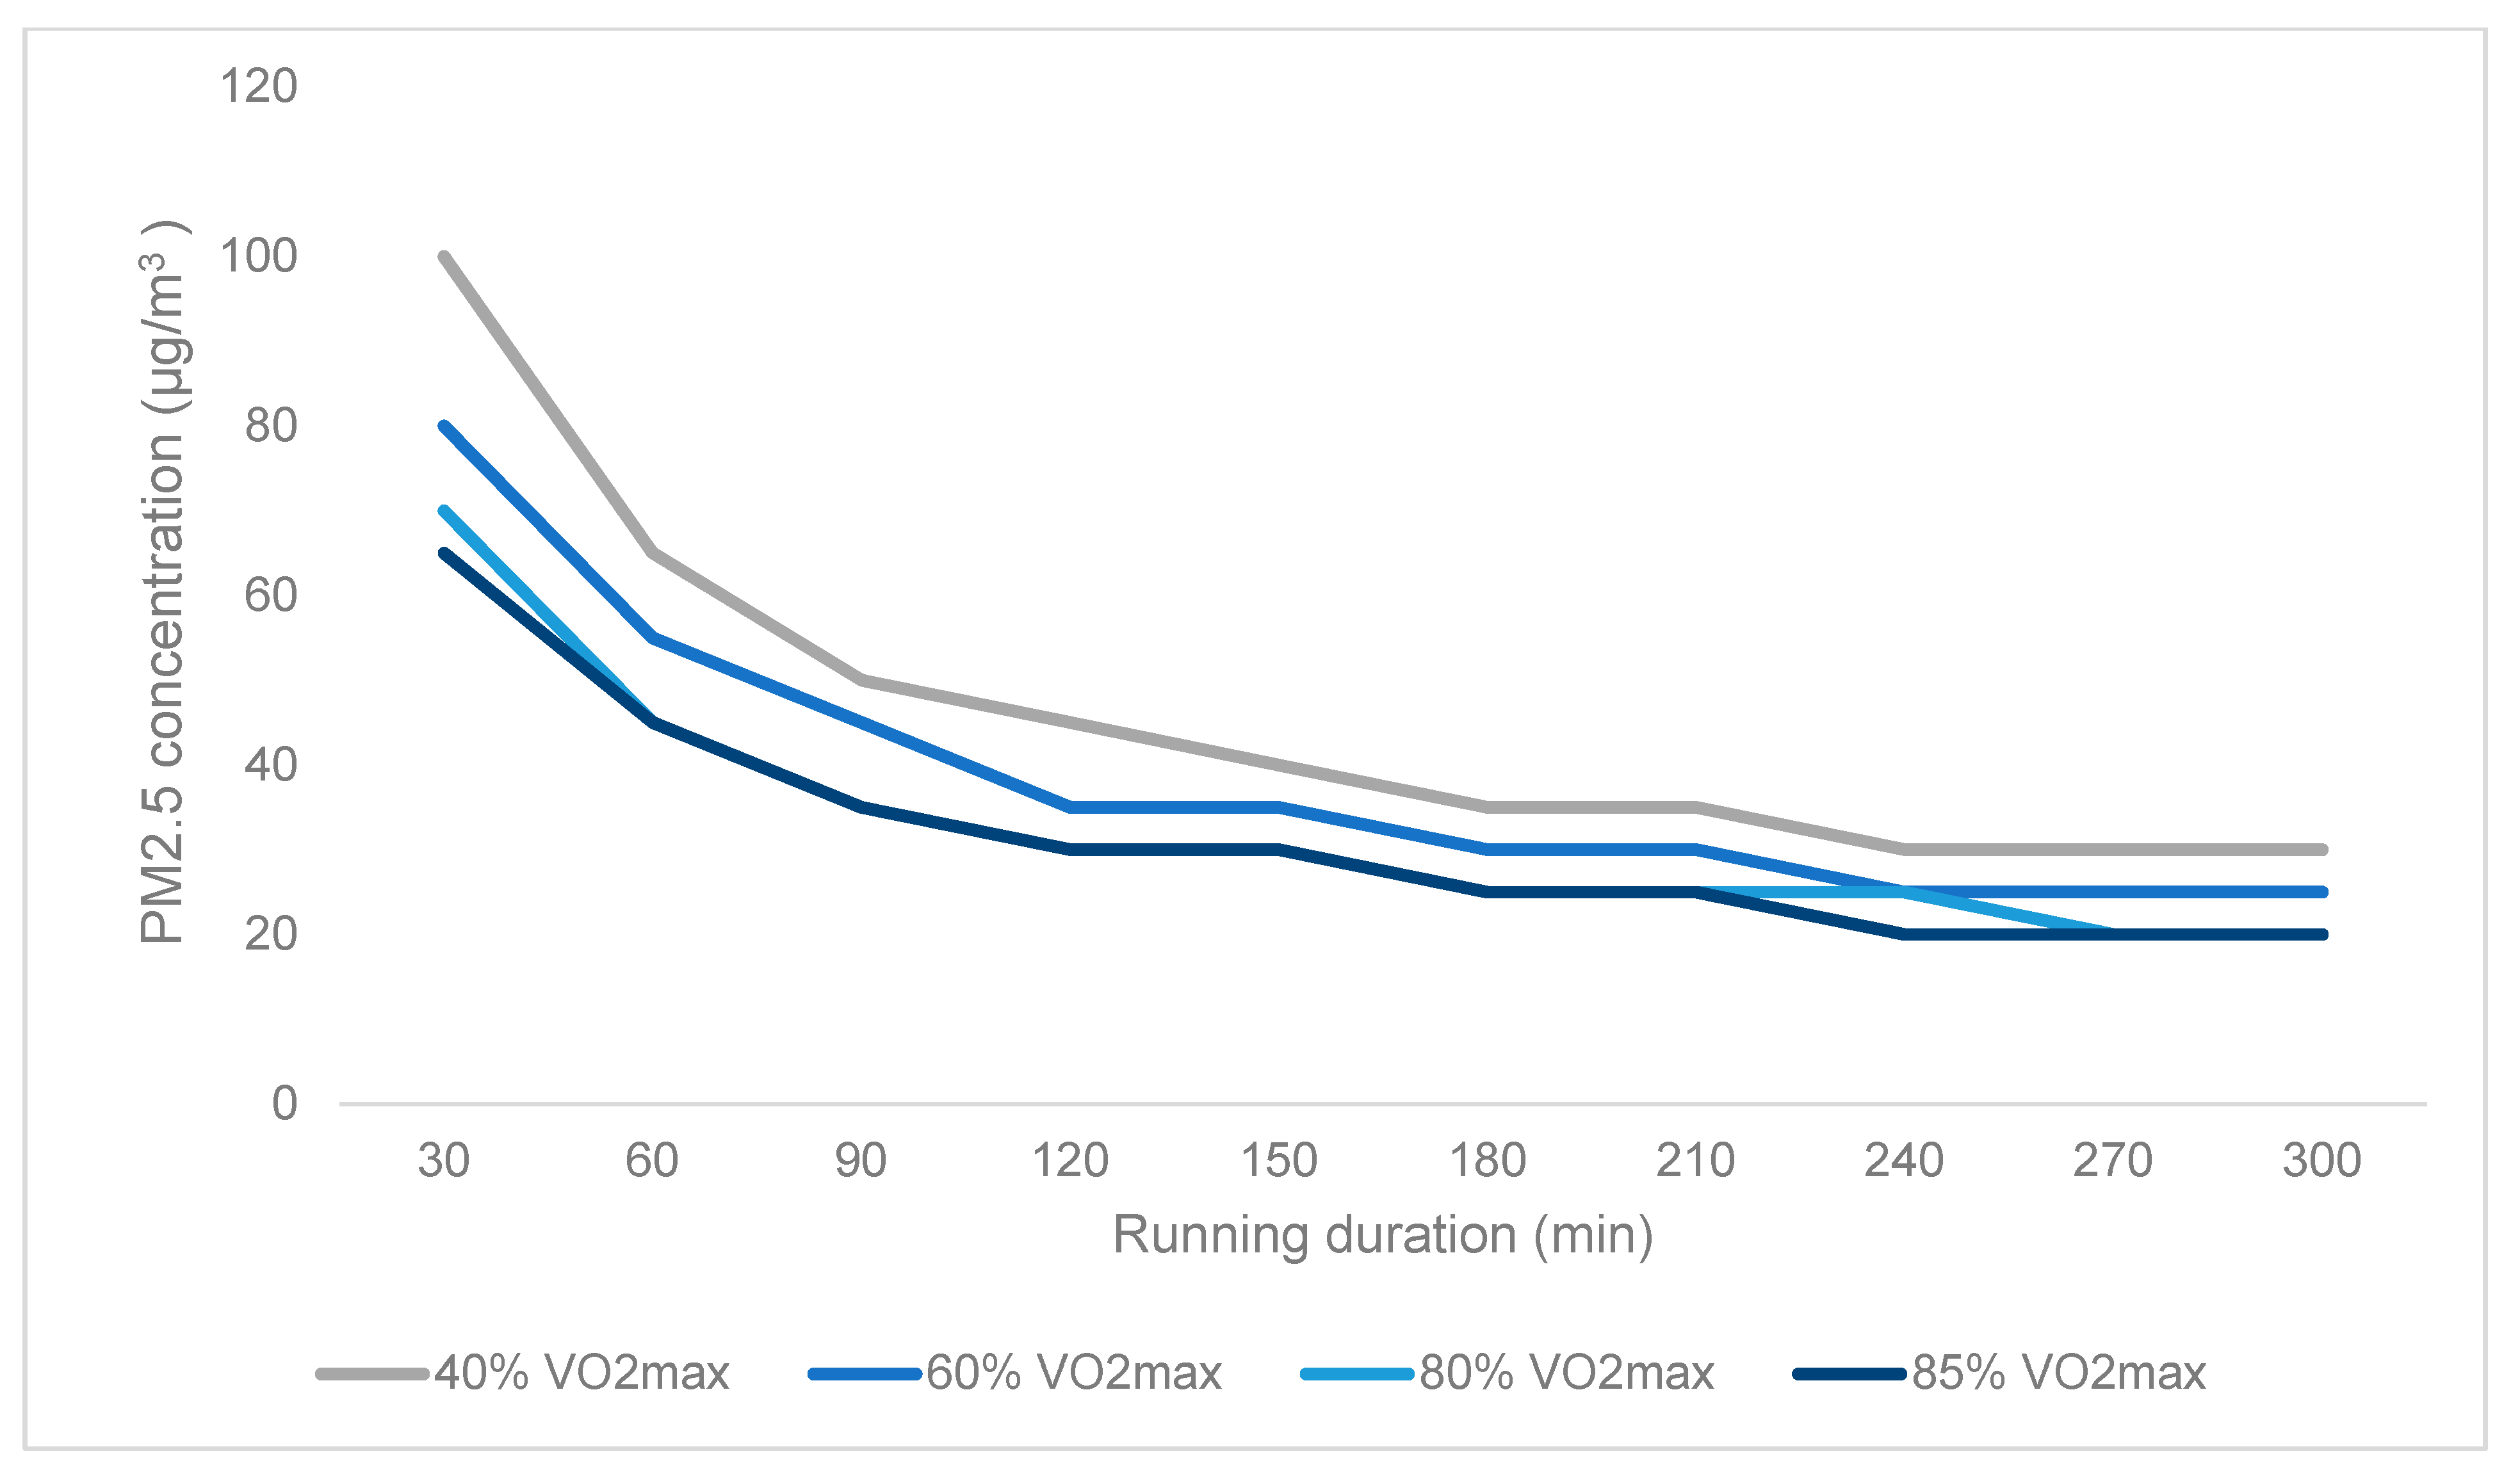
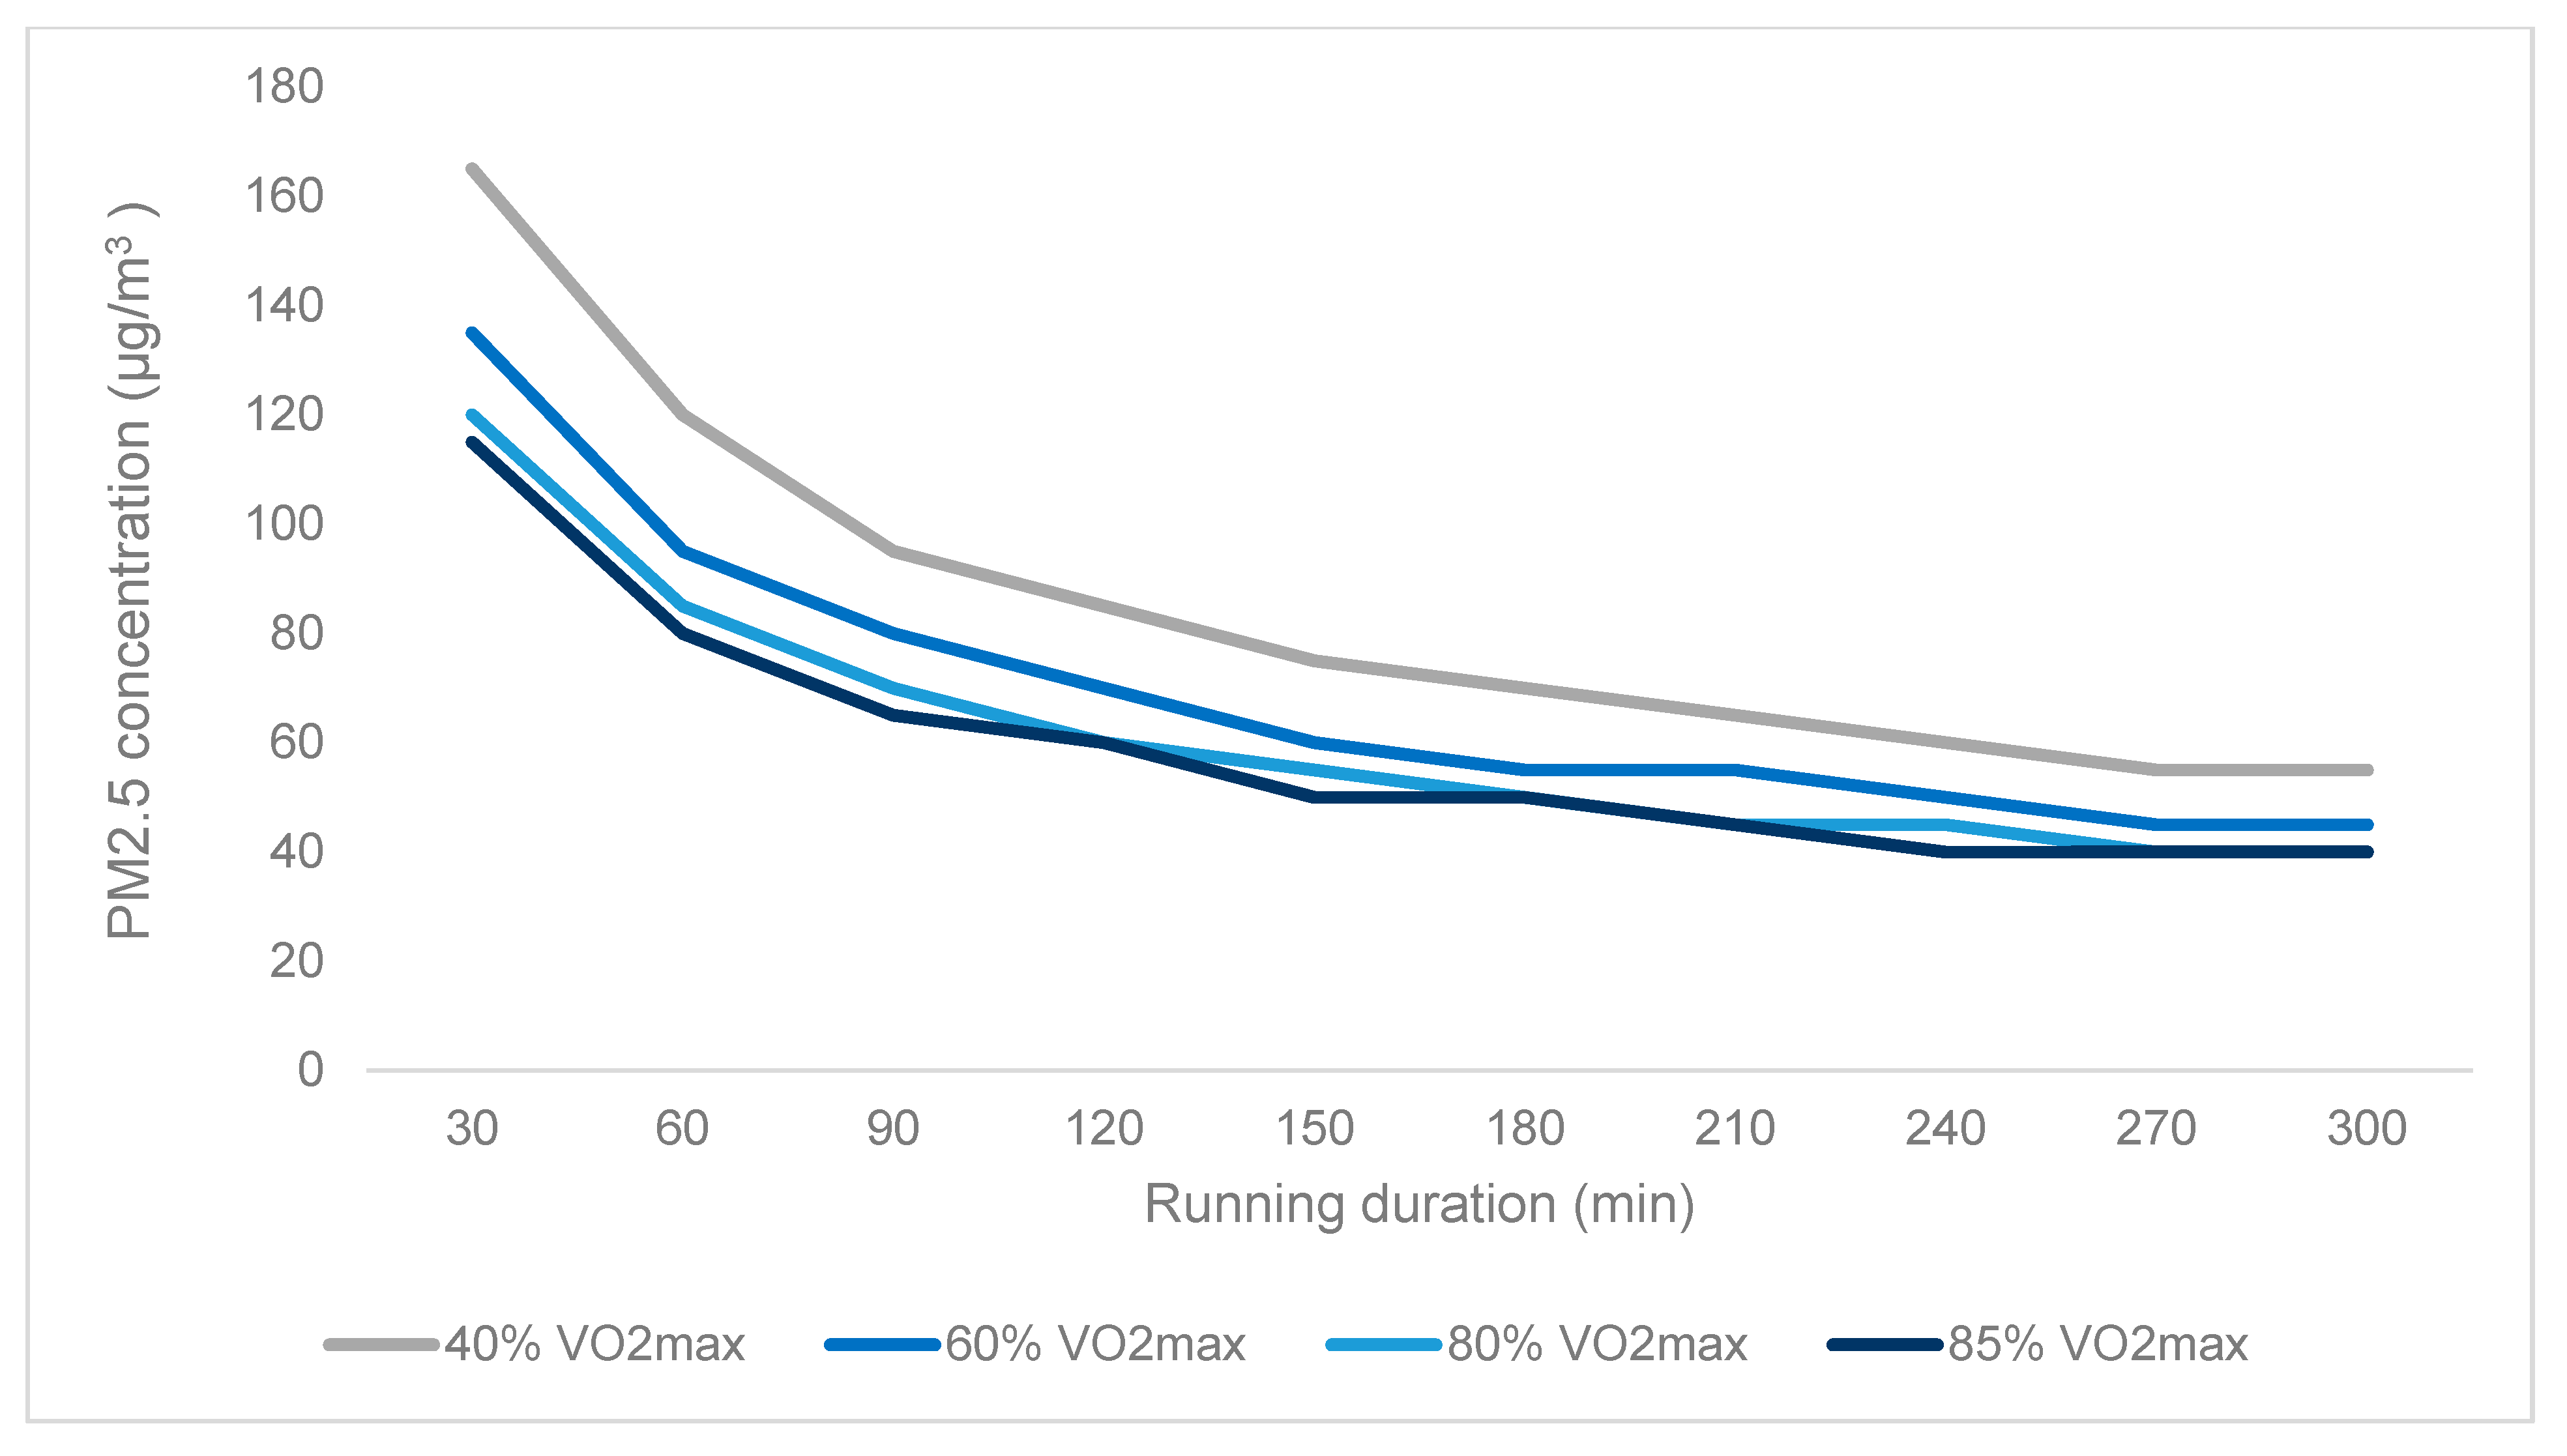
3.1. Tipping and Break-Even Points

The health benefit assessment revealed a tipping point of 65 μg/m3 (40% VO2max), 55 μg/m3 (60% VO2max), and 45 μg/m3 (80% VO2max and 85% VO2max), respectively, for a 60-min run. Furthermore, the assessment revealed a break-even point of 120 μg/m3 (40% VO2max), 95 μg/m3 (60% VO2max), 85 μg/m3 (80% VO2max), and 80 μg/m3 (85% VO2max), respectively, for a 60-min run. Figure 1 and Figure 2 display the tipping and break-even points for different running durations and intensities.

3.2. PM2.5 Concentrations in the Munich Olympic Park

Average PM2.5 concentration was 12.94 µg/m3 (SD = 16.46). The value was generated based upon 746 data points collected across 25 days. The minimum and maximum values, as well as the figures for temperature and humidity, are shown in Table 1.
The average PM2.5 concentration across all measurement days (12.94 µg/m3) did not reach the tipping or break-even points for any duration of the run. The daily average PM2.5 concentration was above the tipping point for a 60-min run at all considered intensities on one of the 25 days (i.e., 21 November 2019; M = 69.9., SD = 13.2). It reached the tipping point for a 30-min run with an intensity of 80% and 85% VO2max, but not with an intensity of 40% and 60% VO2max. The daily average PM2.5 concentration did not reach the break-even point on any of the days for both a 60-min and a 30-min run.
To compare the PM2.5 concentration measurements with official data, a correlation analysis was conducted with values provided by the nearest stationary air-quality equipment, installed by the Bayerisches Landesamt für Umwelt ([19]; M = 13.48 µg/m3 for the 25 measurement days) at Landshuter Allee (a high-traffic road to the South of the Olympic Park; see Appendix A). The correlation of the daily average PM2.5 concentration measured by the mobile device and, provided by stationary equipment for 6 p.m., it was r = 0.65, p < 0.01, indicating a strong relationship.
When taking into account areas in green space (without traffic nearby) vs. areas nearby traffic during the run (as revealed by GPS data), there was no difference in PM2.5 concentration (green space: M = 12.77 µg/m3, SD = 17.68; nearby traffic: M = 13.18 µg/m3, SD = 15.16). The difference in means was non-significant, t (744) = 0.29, p = 0.77. The value of 13.18 µg/m3 is close to the value provided by the Bayerisches Landesamt für Umwelt ([23]; M = 13.48 µg/m3) for Landshuter Allee.

4. Discussion

The purpose of the study was to calculate the PM2.5 concentration values for the tipping and break-even points for running at different intensities and durations, and to assess whether PM2.5 concentrations during a run in an urban park (green space)—considering the Munich Olympic Park as the case—reach the tipping and break-even points. Big cities around the world have been hosting mega-sport events, producing legacies of various formats. Green space is one of these legacies, which is potentially valuable to residents and visitors, because it provides opportunities for health enhancing leisure-time activities, such as running and cycling. The results of the analysis showed that, for a 60-min run at a moderate intensity (60 % VO2max), the PM2.5 concentration at which running no longer leads to additional health benefits amounts to 55 μg/m3 (tipping point). Harms outweigh health benefits at a PM2.5 concentration of 95 μg/m3 (break-even point). The average PM2.5 concentration measured during five-kilometre runs to, and inside, the Munich Olympic Park was above the tipping point on one of the 25 days, but did not reach the break-even point on any of the days. For any running intensity and duration, the average PM2.5 concentration that was measured across all measurement days (12.94 µg/m3) did not reach the tipping or break-even points.
The findings contribute to the literature in three ways. First, values for PM2.5 concentration of the tipping and break-even points for running at different intensities (40%, 60%, 80%, and 85% VO2max) and durations (0–300 min) were calculated, extending the results obtained from Tainio et al. [6], who considered cycling and walking as active travel modes with lower ventilation per minute [3]. The findings inform researchers and practitioners around the world when comparing city- or area-specific values with these tipping and break-even points: 80 μg/m3 (55 μg/m3) for a 30-min (60-min) run and 135 μg/m3 (95 μg/m3) for a 30-min (60-min) run at a moderate intensity, respectively.
Second, the study did not observe any differences in PM2.5 concentrations between running in green space and running nearby traffic (here: to get to the green space). Giles and Koehle [24] have reviewed the literature on the effects of acute exposure to PM while exercising, particularly to vulnerable population groups. We found no difference in PM2.5 concentrations between running next to streets with traffic to get to the park and running inside the park, where there is no traffic. This might be due to the relatively low purification effect of some urban parks [25]. The Olympic Park in Munich is located near streets with the highest traffic volumes in Munich, and this might negatively affect air quality inside and nearby the park (see Appendix A). On the other hand, Schneidemesser et al. [26] reported 22% lower PM2.5 concentrations in green space in Berlin, compared to urban areas without green space. Unfortunately, there are no data to assess the differences in park characteristics between Munich and Berlin (e.g., vegetation structure, wind conditions) that would allow us to identify the reasons for the differences in findings.
Third, of relevance to public health bodies and city managers, the study found large differences in PM2.5 concentrations across measurement days. This has been observed by other researchers too [26,27,28] and implies that day-specific information should be provided to residents and visitors to decrease health risks. Although the average PM2.5 concentration across all measurement days (12.94 µg/m3) did not reach the tipping or break-even points for any intensity and duration of running in the present study, values on five out of the 25 days (20%) were above the daily PM2.5 concentration limit of the World Health Organization (25 μg/m3). Public health organizations and city managers might inform active travellers on these days about the potential harm posed by the high PM2.5 concentrations.
The study has some important limitations. The health benefit assessment applies to healthy individuals (but not to people with diseases) and considers the long-term consequences of running in various PM2.5 concentrations; short-term exposure effects are not considered [6]. In the present study, only all-cause mortality was considered.
Furthermore, other pollutants, such as nitrogen dioxide [29] and black carbon [30], were not assessed in the study, but might be considered in future research. Additionally, the study only considered running, but did not compare running to other means of exercising outdoors or indoors. The addition of another comparison group would allow researchers assessing relative effects [7,31].
The study is also limited in the sense that it considered a specific case, that is, a particular running route to, and inside, a particular park (Munich Olympic Park). Measurements were taken on 25 days only. The findings may not replicate for a different city or a different park. Still, the results are revealing. Future research is needed to assess why there was little purification effect of the park in the present study (assuming that green space has the potential to purify air), and—if nearby traffic contributes to the low purification effect—how areas can be identified that provide runners with the lowest PM2.5 concentrations.

Author Contributions

Conceptualization, L.Z. and J.K.; methodology, L.Z. and J.K; formal analysis, L.Z.; investigation, L.Z.; resources, J.K.; writing—original draft preparation, L.Z.; writing—review and editing, L.Z. and J.K; visualization, L.Z.; supervision, J.K. All authors have read and agreed to the published version of the manuscript.

Funding

This research received no external funding.

Conflicts of Interest

The authors declare no conflict of interest.

Appendix A

Figure A1. Route taken during the mobile PM2.5 concentration measurement (map retrieved from [32]).
Urbansci 04 00062 g0a1

References

  1. Kim, K.H.; Kabir, E.; Kabir, S. A review on the human health impact of airborne particulate matter. Environ. Int. 2015, 74, 136–143. [Google Scholar] [CrossRef] [PubMed]
  2. Brauer, M.; Amann, M.; Burnett, R.T.; Cohen, A.; Dentener, F.; Ezzati, M. Exposure assessment for estimation of the global burden of disease attributable to outdoor air pollution. Environ. Sci. Technol. 2012, 46, 652–660. [Google Scholar] [CrossRef] [PubMed] [Green Version]
  3. Berry, M.J.; Dunn, C.J.; Pittman, C.L.; Kerr, W.C.; Adair, N.E. Increased ventilation in runners during running as compared to walking at similar metabolic rates. Eur. J. Appl. Physiol. 1996, 73, 245–250. [Google Scholar] [CrossRef] [PubMed]
  4. Kargarfard, M.; Poursafa, P.; Rezanejad, S.; Mousavinasab, F. Effects of exercise in polluted air on the aerobic power, serum lactate level and cell blood count of active individuals. Int. J. Prev. Med. 2011, 2, 145–150. [Google Scholar]
  5. Pasqua, L.A.; Damasceno, M.V.; Cruz, R.; Matsuda, M.; Garcia Martins, M.; Lima-Silva, A.E.; Marquezini, M.; Saldiva, P.H.N.; Bertuzzi, R. Exercising in air pollution: The cleanest versus dirtiest cities challenge. Int. J. Environ. Res. Public Health 2018, 15. [Google Scholar] [CrossRef] [Green Version]
  6. Tainio, M.; Nazelle, A.; Götschi, T.; Kahlmeier, S.; Rojas-Rueda, D.; Nieuwenhuijsen, M.J.; Sá, T.H.; Kelly, P.; Woodcock, J. Can air pollution negate the health benefits of cycling and walking? Prev. Med. 2016, 87, 233–236. [Google Scholar] [CrossRef] [PubMed] [Green Version]
  7. Giallouros, G.; Kouis, P.; Papatheodorou, I.; Woodcock, J.; Tainio, M. The long-term impact of restricting cycling and walking during high air pollution days on all-cause mortality: Health impact assessment study. Environ. Int. 2020, 140, 105679. [Google Scholar] [CrossRef]
  8. Swain, D.P.; Abernathy, K.S.; Smith, C.S.; Lee, S.J.; Bunn, S.A. Target heart rates for the development of cardiorespiratory fitness. Med. Sci. Sports Exerc. 1994, 26, 112–116. [Google Scholar] [CrossRef]
  9. Jackson, A.S.; Sui, X.; O’Connor, D.P.; Church, T.S.; Lee, D.-C.; Artero, E.G.; Blair, S.N. Longitudinal cardiorespiratory fitness algorithms for clinical settings. Am. J. Prev. Med. 2012, 43, 512–519. [Google Scholar] [CrossRef] [Green Version]
  10. Pedisic, Z.; Shrestha, N.; Kovalchik, S.; Stamatakis, E.; Liangruenrom, N.; Grgic, J.; Titze, S.; Biddle, S.J.H.; Oja, P. Is running associated with a lower risk of all-cause, cardiovascular and cancer mortality, and is the more the better? A systematic review and meta-analysis. British J. Sports Med. 2019, 54, 898–905. [Google Scholar] [CrossRef] [PubMed]
  11. Kelly, P.; Kahlmeier, S.; Götschi, T.; Orsini, N.; Richards, J.; Roberts, N.; Scarborough, P.; Foster, C. Systematic review and meta-analysis of reduction in all-cause mortality from walking and cycling and shape of dose response relationship. Int. J. Behav. Nut. Phys. Act. 2014, 11, 132. [Google Scholar] [CrossRef] [PubMed] [Green Version]
  12. Daigle, C.C.; Chalupa, D.C.; Gibb, F.R. Ultrafine particle deposition in humans during rest and exercise. Inhal. Toxicol. 2003, 15, 539–552. [Google Scholar] [CrossRef]
  13. Oravisjarvi, K.; Pietikainen, M.; Ruuskanen, J. Effects of physical activity on the deposition of traffic-related particles into the human lungs in silico. Sci. Total Environ. 2011, 409, 4511–4518. [Google Scholar] [CrossRef]
  14. WHO. WHO Expert Meeting: Methods and Tools for Assessing the Health Risks of air Pollution at Local, National and International Level. Meeting Report. Available online: http://www.euro.who.int/__data/assets/pdf_file/0010/263629/WHO-Expert-Meeting-Methods-and-tools-for-assessing-the-health-risks-of-air-pollution-at-local,-national-and-international-level.pdf (accessed on 10 October 2020).
  15. Koenigstorfer, J.; Bocarro, J.N.; Byers, T.; Edwards, M.B.; Jones, G.J.; Preuss, H. Mapping research on legacy of mega sporting events: Structural changes, consequences, and stakeholder evaluations in empirical studies. Leis. Stud. 2019, 38, 729–745. [Google Scholar] [CrossRef]
  16. Haas, O.; Kösler, W. Offizieller Olympiaführer der Spiele der XX. Olympiade München 1972. Organisationskomitee für die Spiele der XX. Olympiade München 1972 [Official Guide for the XX Olympic Games in Munich 1972, Released by the Organizing Committee of the XX Olympic Games 1972]; Atlas Verlag GmbH: München, Germany, 1972. [Google Scholar]
  17. Morpurgo, A.; Pedersini, F.; Reina, A. A low-cost instrument for environmental particulate analysis based on optical scattering. Presented at the Instrumentation and Measurement Technology Conference (I2MTC), IEEE International, Graz, Austria, 13–16 May 2012. [Google Scholar]
  18. Han, I.; Symanski, E.; Stock, T.H. Feasibility of using low-cost portable particle monitors for measurement of fine and coarse particulate matter in urban ambient air. J. Air Waste Manag. 2017, 67, 330–340. [Google Scholar] [CrossRef] [Green Version]
  19. Holstius, D.M.; Pillarisetti, A.; Smith, K.; Seto, E. Field calibrations of a low-cost aerosol sensor at a regulatory monitoring site in California. Atmos. Meas. Tech. Discuss. 2014, 7, 1121–1131. [Google Scholar] [CrossRef] [Green Version]
  20. Müller, N. Wer Läuft Wann?—Die Bevorzugten Joggingzeiten Weltweit [Who Runs When? Preferred Running Times around the World]. Available online: https://www.netzathleten.de/lifestyle/sports-inside/item/5419-wer-laeuft-wann-die-bevorzugten-joggingzeiten-weltweit on 03/15/2020 (accessed on 10 October 2020).
  21. Arling, J.; O’Connor, K.; Mercieca, M. Air quality sensor network for Philadelphia. Eng. Man. 2010. Available online: http://aqicn.org/data/dylos/Air-Quality-Sensor-Network-for-Philadelphia.pdf (accessed on 7 November 2020).
  22. Wüstemann, H.; Kalisch, D.; Kolbe, J. Access to urban green space and environmental inequalities in Germany. Landsc. Urban Plan. 2017, 164, 124–131. [Google Scholar] [CrossRef]
  23. Bayerisches Landesamt für Umwelt. Messwertarchiv [Archive of Measurement Values]. Available online: https://www.lfu.bayern.de/luft/immissionsmessungen/messwertarchiv/index.htm (accessed on 10 October 2020).
  24. Giles, V.L.; Koehle, M.S. The health effects of exercising in air pollution. Sports Med. 2014, 44, 223–249. [Google Scholar] [CrossRef]
  25. Xing, Y.; Brimblecombe, P. Role of vegetation in deposition and dispersion of air pollution in urban parks. Atmos. Environ. 2019, 201, 73–83. [Google Scholar] [CrossRef]
  26. Von Schneidemesser, E.; Steinmar, K.; Weatherhead, E.C.; Bonn, B.; Quedenau, J.; Gerwig, H. Air pollution at human scales in an urban environment: Impact of local environment and vehicles on particle number concentrations. Sci. Total Environ. 2019, 688, 691–700. [Google Scholar] [CrossRef] [PubMed]
  27. Boogaard, H.; Borgman, F.; Kamminga, J.; Hoek, G. Exposure to ultrafine and fine particles and noise during cycling and driving in 11 Dutch cities. Atmos. Environ. 2009, 43, 4234–4242. [Google Scholar] [CrossRef]
  28. Dunea, D.; Iordache, S.; Ianache, C. Relationship between airborne particulate matter and weather conditions in Targoviste urban area during cold months. Rev. Roum. Chim. 2014, 60, 595–601. [Google Scholar]
  29. WHO. Ambient Air Pollution: Pollutants. Available online: https://www.who.int/airpollution/ambient/pollutants/en/ on 02/16/2019 (accessed on 10 October 2020).
  30. Laeremans, M.; Dons, E.; Avila-Palencia, I.; Carrasco-Turigas, G.; Orjuela-Mendoza, J.P.; Anaya-Boig, E.; Cole-Hunter, T.; de Nazelle, A.; Nieuwenhuijsen, M.; Standaert, A.; et al. Black carbon reduces the beneficial effect of physical activity on lung function. Med. Sci. Sports Exerc. 2018, 50, 1875–1881. [Google Scholar] [CrossRef] [Green Version]
  31. Panis, L.I.; de Geus, B.; Vandenbulcke, G.; Willems, H.; Degraeuwe, B.; Bleux, N.; Mishra, V.; Thomas, I.; Meeusen, R. Exposure to particulate matter in traffic: A comparison of cyclists and car passengers. Atmos. Environ. 2010, 44, 2263–2270. [Google Scholar] [CrossRef]
  32. OpenStreetMap.org. Open Database License ODbL. Available online: https://www.openstreetmap.org/search?query=M%C3%BCnchen#map=13/48.1764/11.5624 (accessed on 11 November 2020).
Figure 1. PM2.5 concentrations of the tipping points at different running durations and intensities.
Urbansci 04 00062 g001
Figure 2. PM2.5 concentrations of the break-even points at different running durations and intensities.
Urbansci 04 00062 g002
Table 1. PM2.5 concentration, temperature and humidity for 746 measurements on 25 days.
VariableMeanStandard DeviationMinimumMaximum
Overall PM2.5 concentration (µg/m3)12.9416.460.8989.11
PM2.5 concentration in green space (µg/m3)12.7717.680.8989.11
PM2.5 concentration nearby traffic (µg/m3)13.1815.161.1580.95
Temperature (°C)16.547.783.0034.00
Humidity (%)62.5119.0328.0091.00
Publisher’s Note: MDPI stays neutral with regard to jurisdictional claims in published maps and institutional affiliations.

