Article

Lessons Learned from Applying an Integrated Land Use Transport Planning Model to Address Issues of Social and Economic Exclusion of Marginalised Groups: The Case of Cape Town, South Africa

by
Hazvinei Tsitsi Tamuka Moyo
1,*,
Mark Zuidgeest
1 and
Hedwig van Delden
2
1
Centre for Transport Studies, Engineering and Built Environment, University of Cape Town, Cape Town 7701, South Africa
2
Research Institute for Knowledge Systems (RIKS), 6200 AL Maastricht, The Netherlands
*
Author to whom correspondence should be addressed.
Submission received: 3 December 2020 / Revised: 24 December 2020 / Accepted: 3 January 2021 / Published: 18 January 2021

Abstract

:
The Group Areas Act of 1950 has resulted in post-apartheid South African cities being characterised by spatial patterns with limited access to social and economic opportunities for the black and coloured population. Typically, high-density low-income housing is located peripherally, while low density high-income housing is located in accessible central areas. With increased rural-to-urban migration, the demand for formal housing has historically surpassed supply, which has increased the growth of informal settlements. Current discourse within South African land use policy suggests that in-situ upgrading of informal housing is a viable response to integrate informal settlements into the formal city. In parallel, it is proposed that new low-income residential areas and employment-generating land uses should be located along transport corridors to improve access to transport, its infrastructure and the opportunities it provides for previously marginalised groups. This study uses Cape Town as a case city to explore two land-use driven development strategies directed at informal settlements and low-income housing. A dynamic land use transport model based on a cellular automata land use model and a four-stage transport model was used to simulate land use and transport changes. Specifically, in-situ upgrading of informal settlements and strategically locating new low-income residential and employment generating land uses along transport corridors were considered. The results from the analysis suggest that in-situ upgrading is a viable option only if new informal settlements are in areas with easy access to economic centres. With regards to low-income housing, targeted interventions aimed at ‘unlocking’ low-income housing activities along transport corridors were found to be useful. However, it was also observed that middle-income residential development and employment generating activities were also attracted to the same corridors, thus, resulting in mixed land uses, which is beneficial but can potentially result in rental bids between low and middle-income earners thus displacing low-income earners away from these areas.

1. Introduction

An estimated 1 billion people live in informal settlements where there is limited access to jobs and infrastructure for basic services, such as water and sanitation [1]. It is befitting that Sustainable Development Goal (SDG) 11 emphasises on ensuring that cities and human settlements are inclusive, safe, resilient and sustainable [2]. While the issues underscored in SDG 11 resonate with most countries, the global South discourse has focused on issues pertaining to human settlements mostly housing for the marginalised groups in particular housing for informal settlements/slums or housing for low-income earners. While urbanisation has been beneficial for some population cohorts, informal settlement dwellers have experienced social, spatial and economic exclusion [1,3]. In developing countries where informal settlements are part of the urban fabric and rapid urbanisation is accompanied by a mismatch between housing supply and demand, informal housing provides an affordable housing market [4,5,6]. As a result, informal settlements/housing not only has a value, but they are also a means through which value is exchanged [7]. However, while these settlements provide housing, they are characterised by poor living conditions and poverty [6,8]. Therefore, within developing countries, urban planning should pay attention to the spatial patterns that are unique to informality and how this impacts urban development [4]. While, informal settlements are a response to the lack of planning [6,9,10,11] they are also an organic process and urban infrastructure such as roads allow them to thrive by allowing informal settlement dwellers to fulfil their mobility and accessibility needs.

Informal Settlement and the Urban Densities Debate in South Africa

In South African, the General Household Survey (2017) revealed that 2.2 million people live in informal settlements. Two diametrically opposed views form part of the urban discourse with regards to informal settlements in South Africa. One argument suggests that informal settlements are an avenue through which people are uplifted out of poverty as they provide affordable housing, while giving its dwellers access to the urban labour market [12,13]. Juxtaposing this, informal settlements are viewed to perpetuate poverty as they are mostly located in the peripheries where there is limited access to transport, its infrastructures and the opportunities it presents [12]. Regardless of these opposing views on informal settlements, it is common knowledge that, in order to develop equitable cities, there is an urgent need to integrate informal settlements into the economy. This is, either to limit their growth or to upgrade them so that people who live in these areas have better access to transport and the opportunities it provides [1]. Policies, such as the Breaking New Ground through the Upgrading of Informal Settlements Programme (UISP) are clear on the need to integrate informal settlements into the urban fabric [14]. However, several authors argue that there is a disjuncture in policy with regards to the response on informal settlements [13,15,16]. One theme that consistently emerges is the prioritisation of in-situ upgrading of informal settlements instead of relocation as relocation might result in a loss of social networks by informal settlements dwellers. These social networks are considered to the be at the core of the survival of residents of informal settlements [13,17,18,19,20,21].
Additionally, the transition from apartheid to democracy resulted in several initiatives such as the Reconstruction and Development Programme (RDP) [22] and Urban Development Framework (UDF) [23], now the Integrated Urban Development Framework (IUDF) [24], among others to provide formal housing to an ever-growing urban population. Almost three decades into democracy, the South African government is confronted with low-income housing delivery backlogs, which was estimated to be 2.1 million in 2018 [25]. While there have been efforts to deliver housing, a wave of criticism has occurred as the location of the new housing units is consistently in the peripheries thus perpetuating apartheid spatial patterns [26]. Further, post-apartheid planning ideologies have also been criticised for perpetuating the polarisation of economic centres in affluent suburbs with good access to transport leaving the low-income segregated. While, initiatives, such as UDF create cities that are spatially and socio-economically integrated, and enable people to make residential and employment choices that allow them to thrive in an economy [24], this is a realisation that is yet to be enjoyed by the low-income and informal settlement dwellers who are located in the peripheries of the city.
From a transport provision perspective, the urban spatial patterns have resulted in low urban land use densities which make it difficult to provide a viable public transport system [27]. Policies such as the White Paper on National Transport Policy (1996) and the National Land Transport Transition Act. 2000 (NLTTA) [28,29] emphasise on land use development on transport corridors, high density land uses and infilling as a way of redressing some of the spatial inequalities created by the apartheid spatial structure. While there has been limited progress in addressing urban spatial issues [26,30] there are still opportunities to direct future urban development, such that previously marginalised groups have access to employment and other social activities.
In view of the issues mentioned, this research questions how land use driven planning, especially related to informal settlement growth and low-income residential areas, can help in improving access to employment or centres of economic activities for marginalised groups. By using Cape Town as a case city, the paper simulates land use changes for Cape Town mainly focusing on the land use dynamics of informal settlements and low-income housing. An integrated land use transport model developed within the METRONAMICA framework [31], is calibrated and validated. The model is then used as a spatial decision support tool to evaluate land use polices and their impact on urban change from 2010 to 2030. Specifically, the model is used to assess whether the urban development scenarios are viable options in improving the social and economic inclusion of marginalised groups while integrating them into the Cape Town formal economy.

2. Materials and Methods
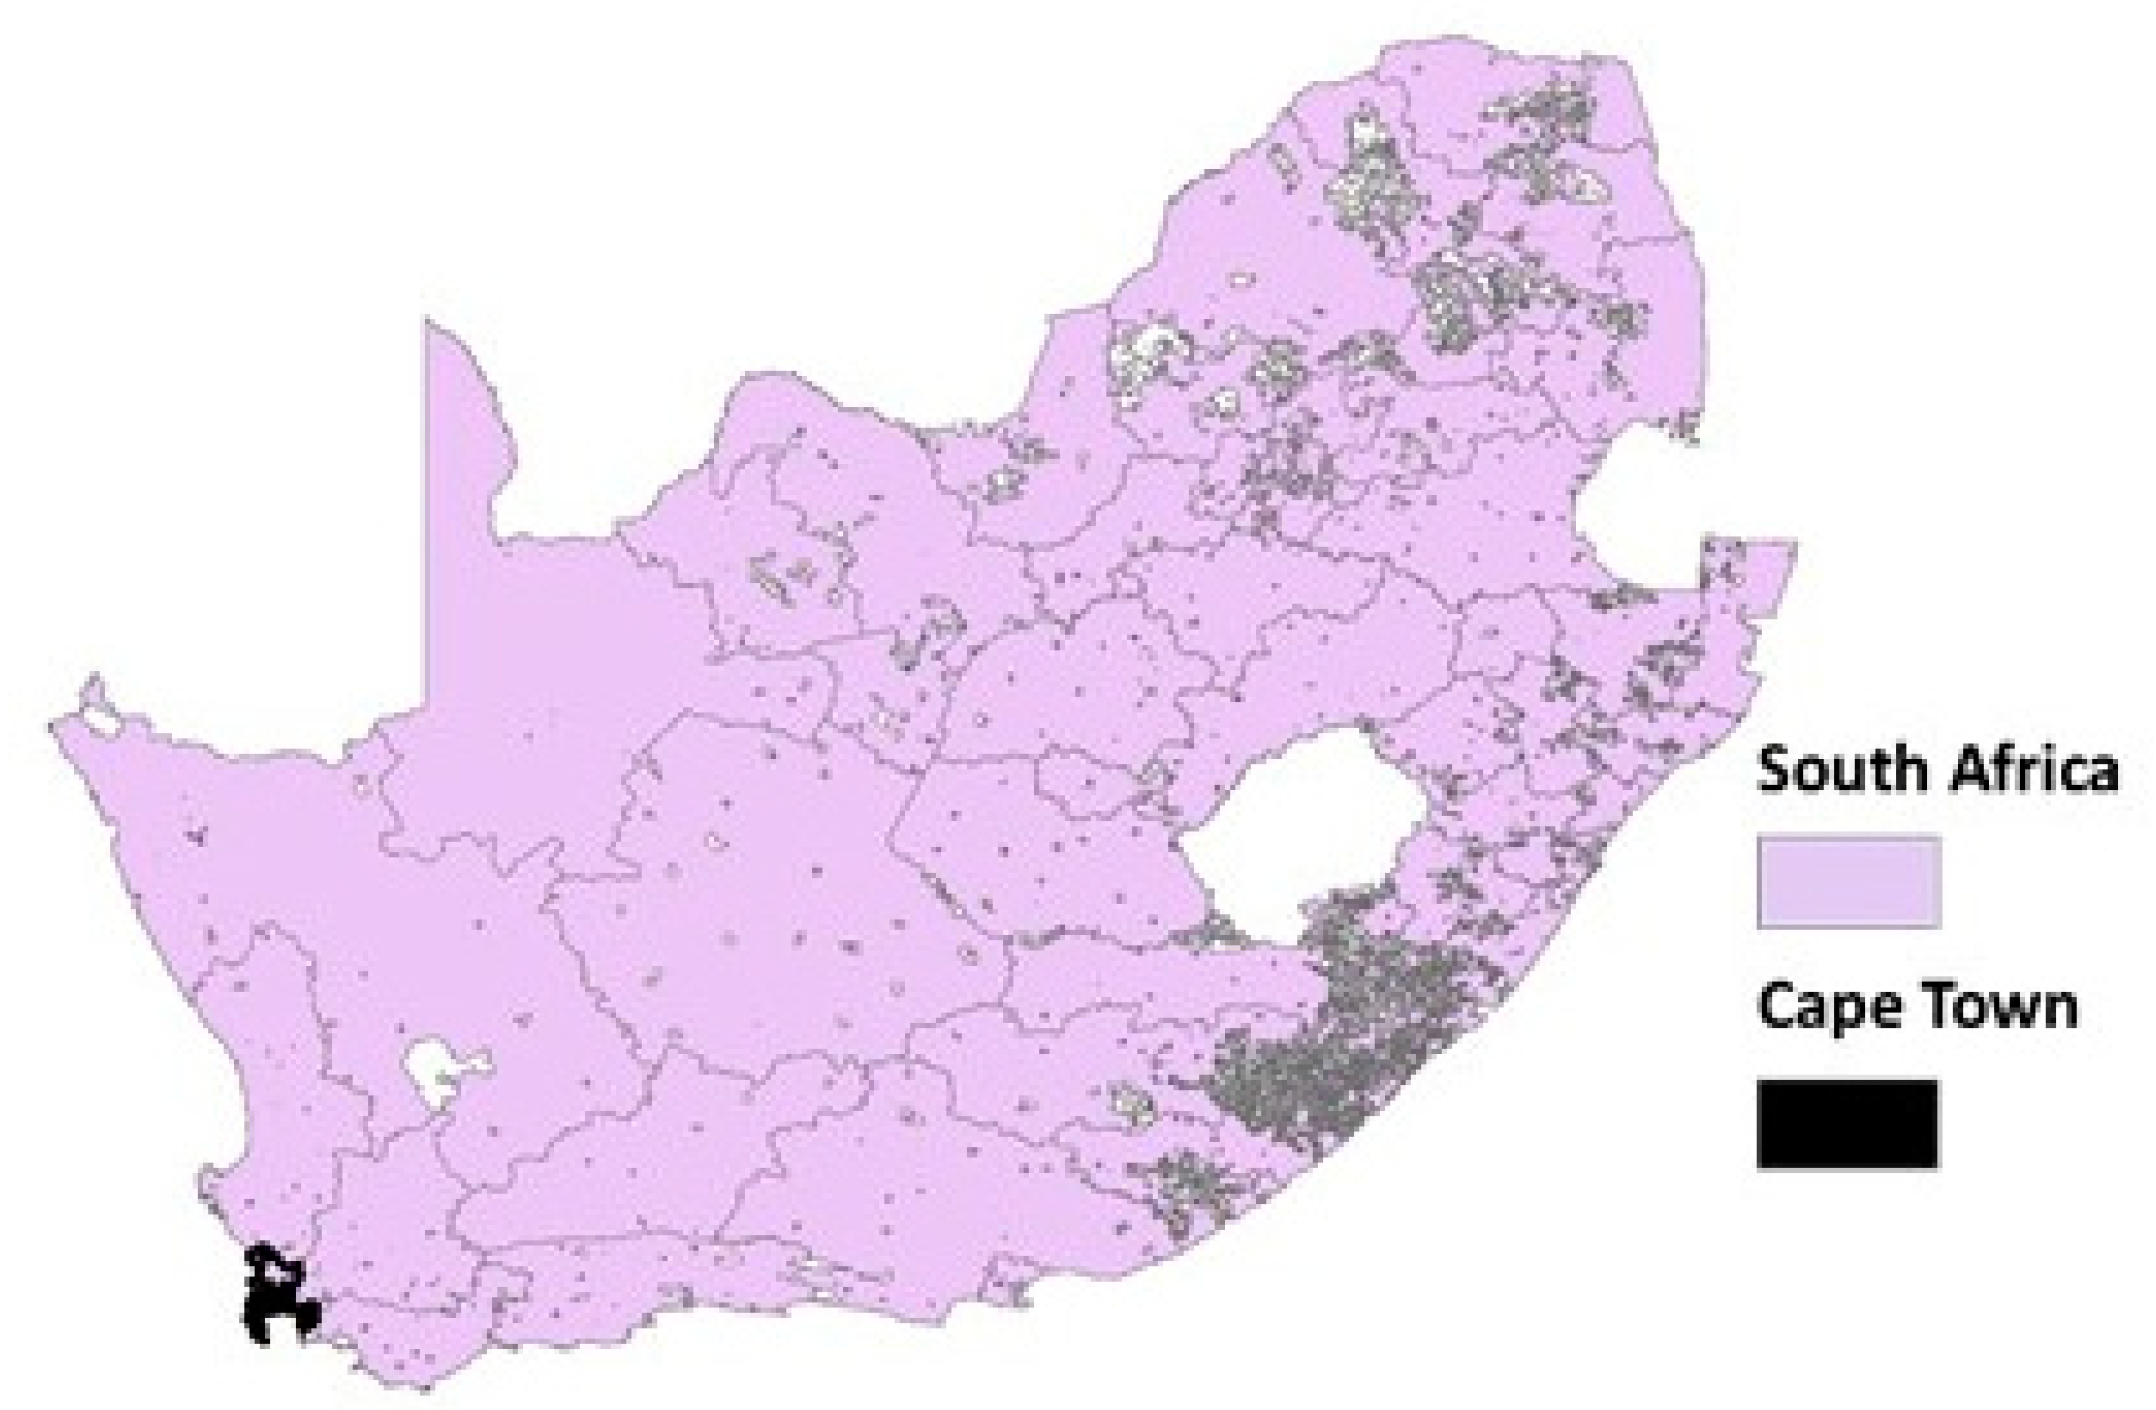
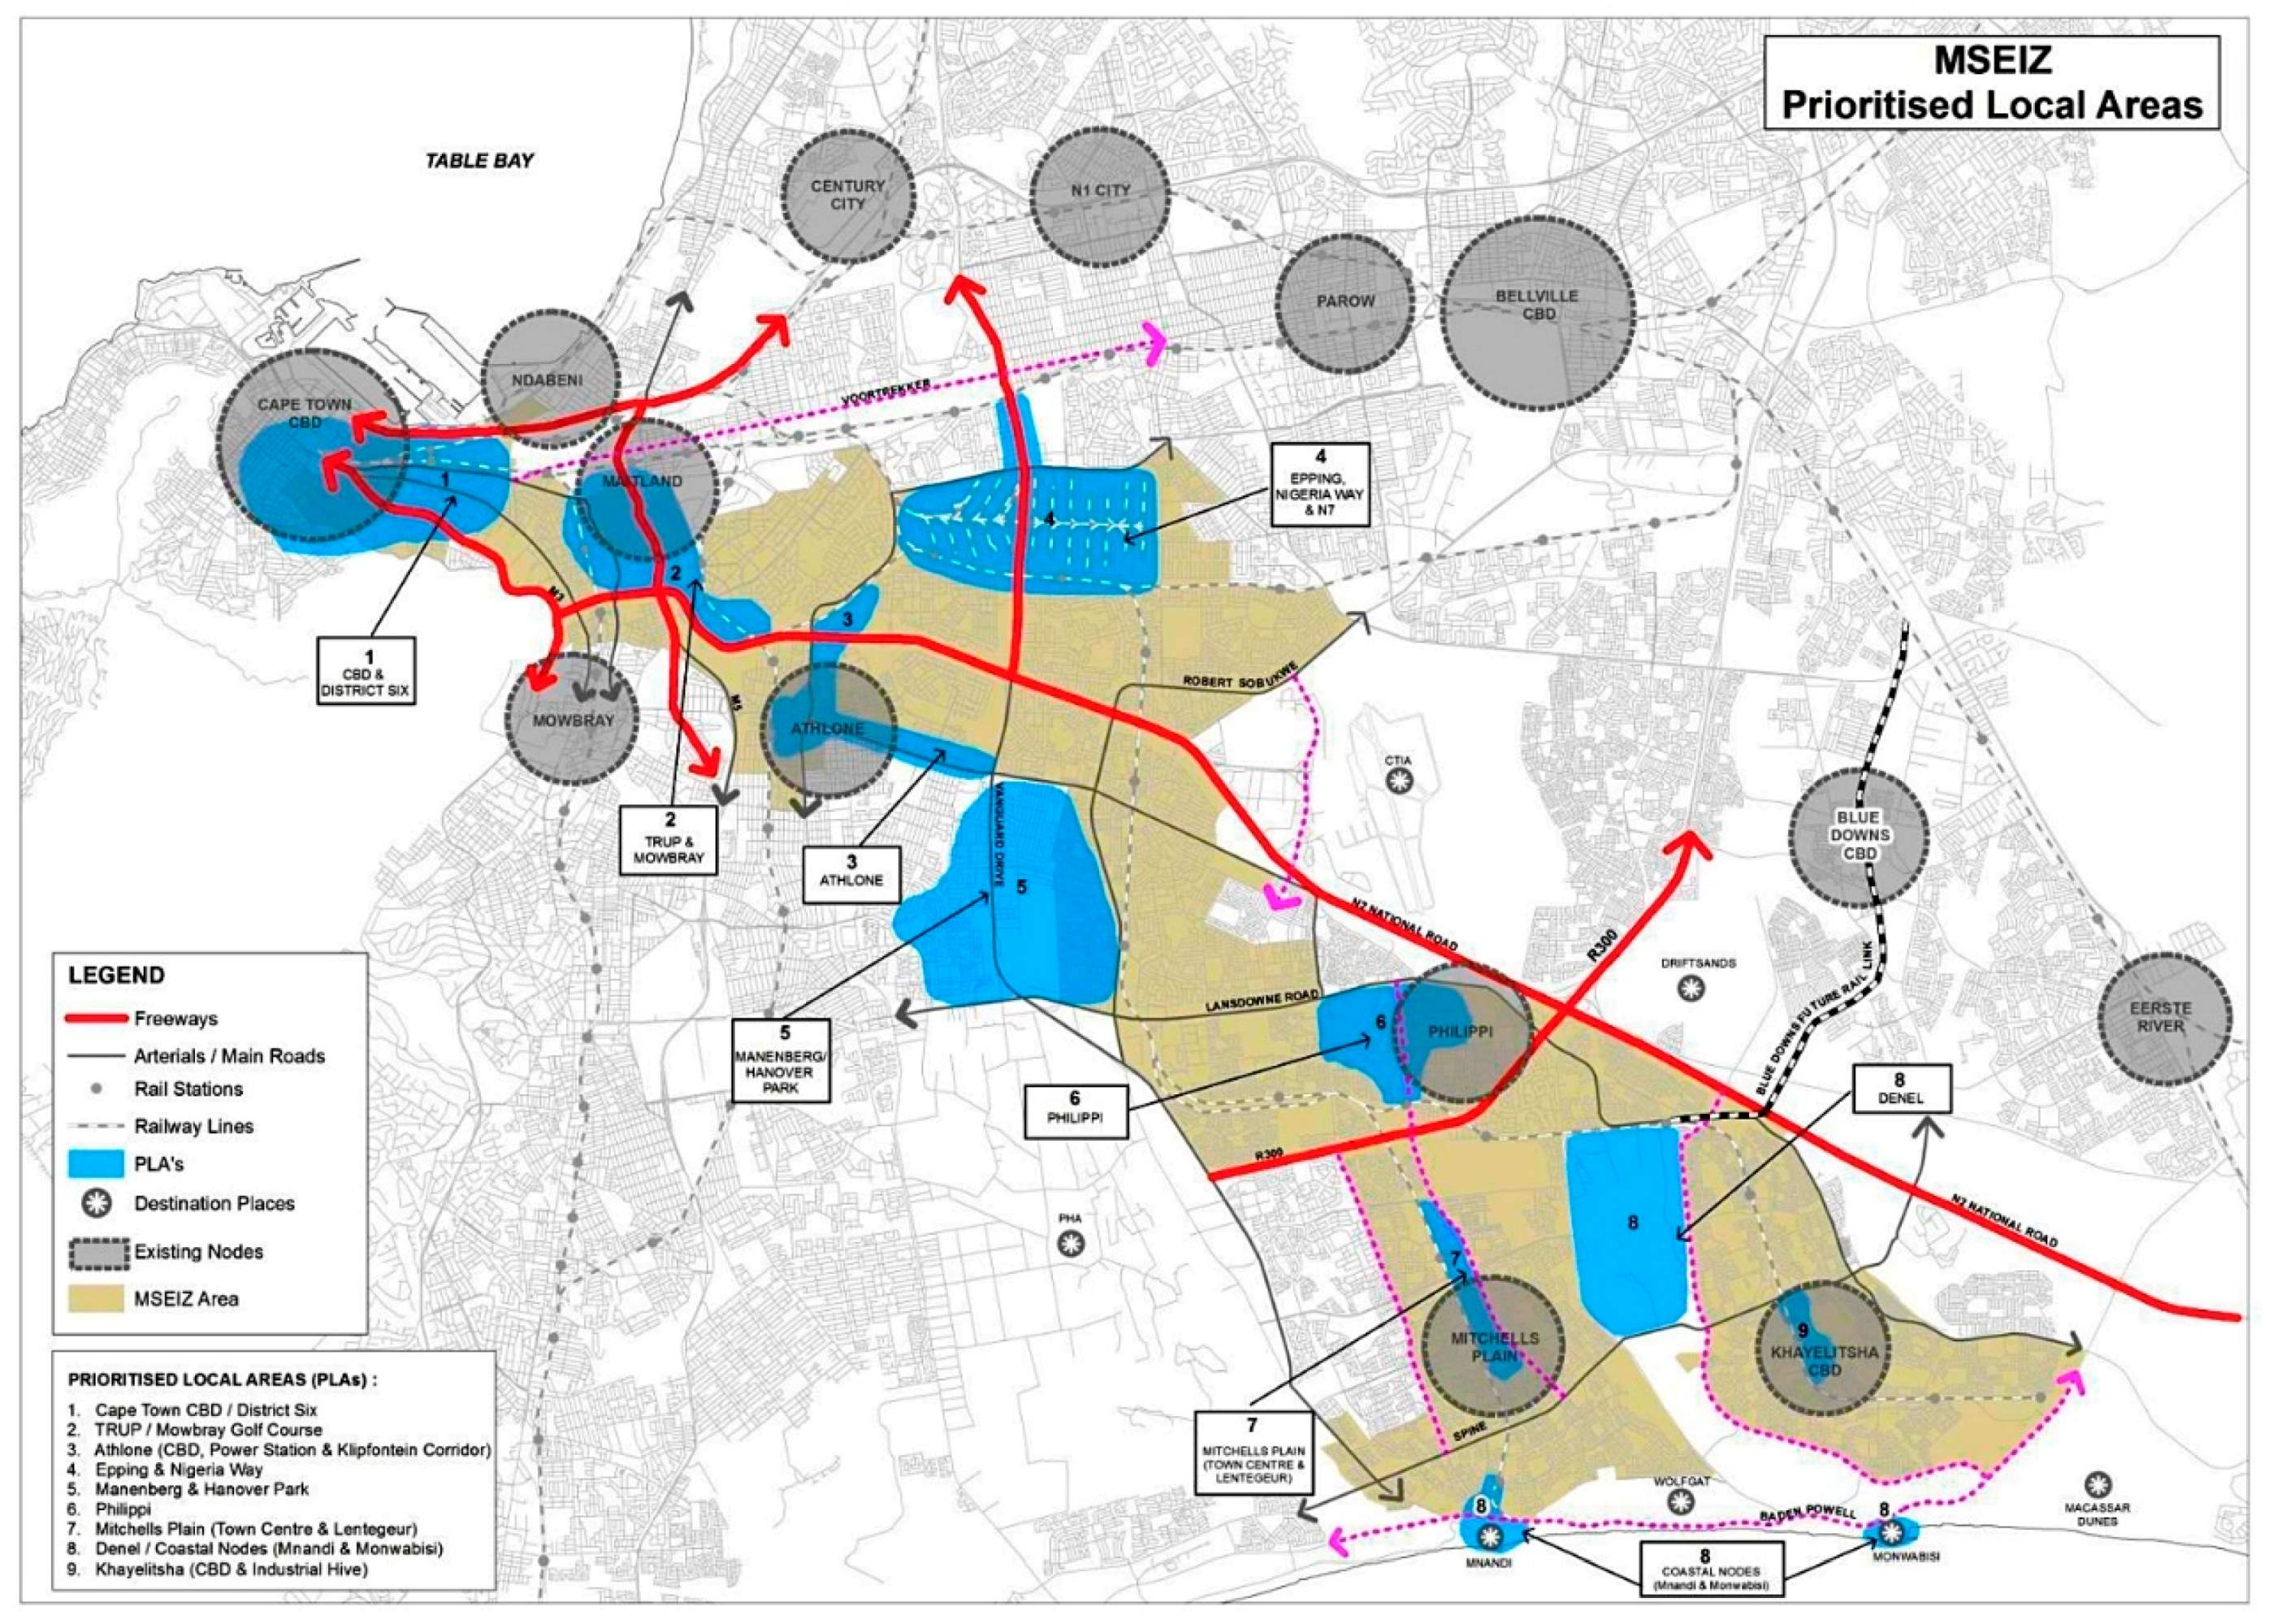
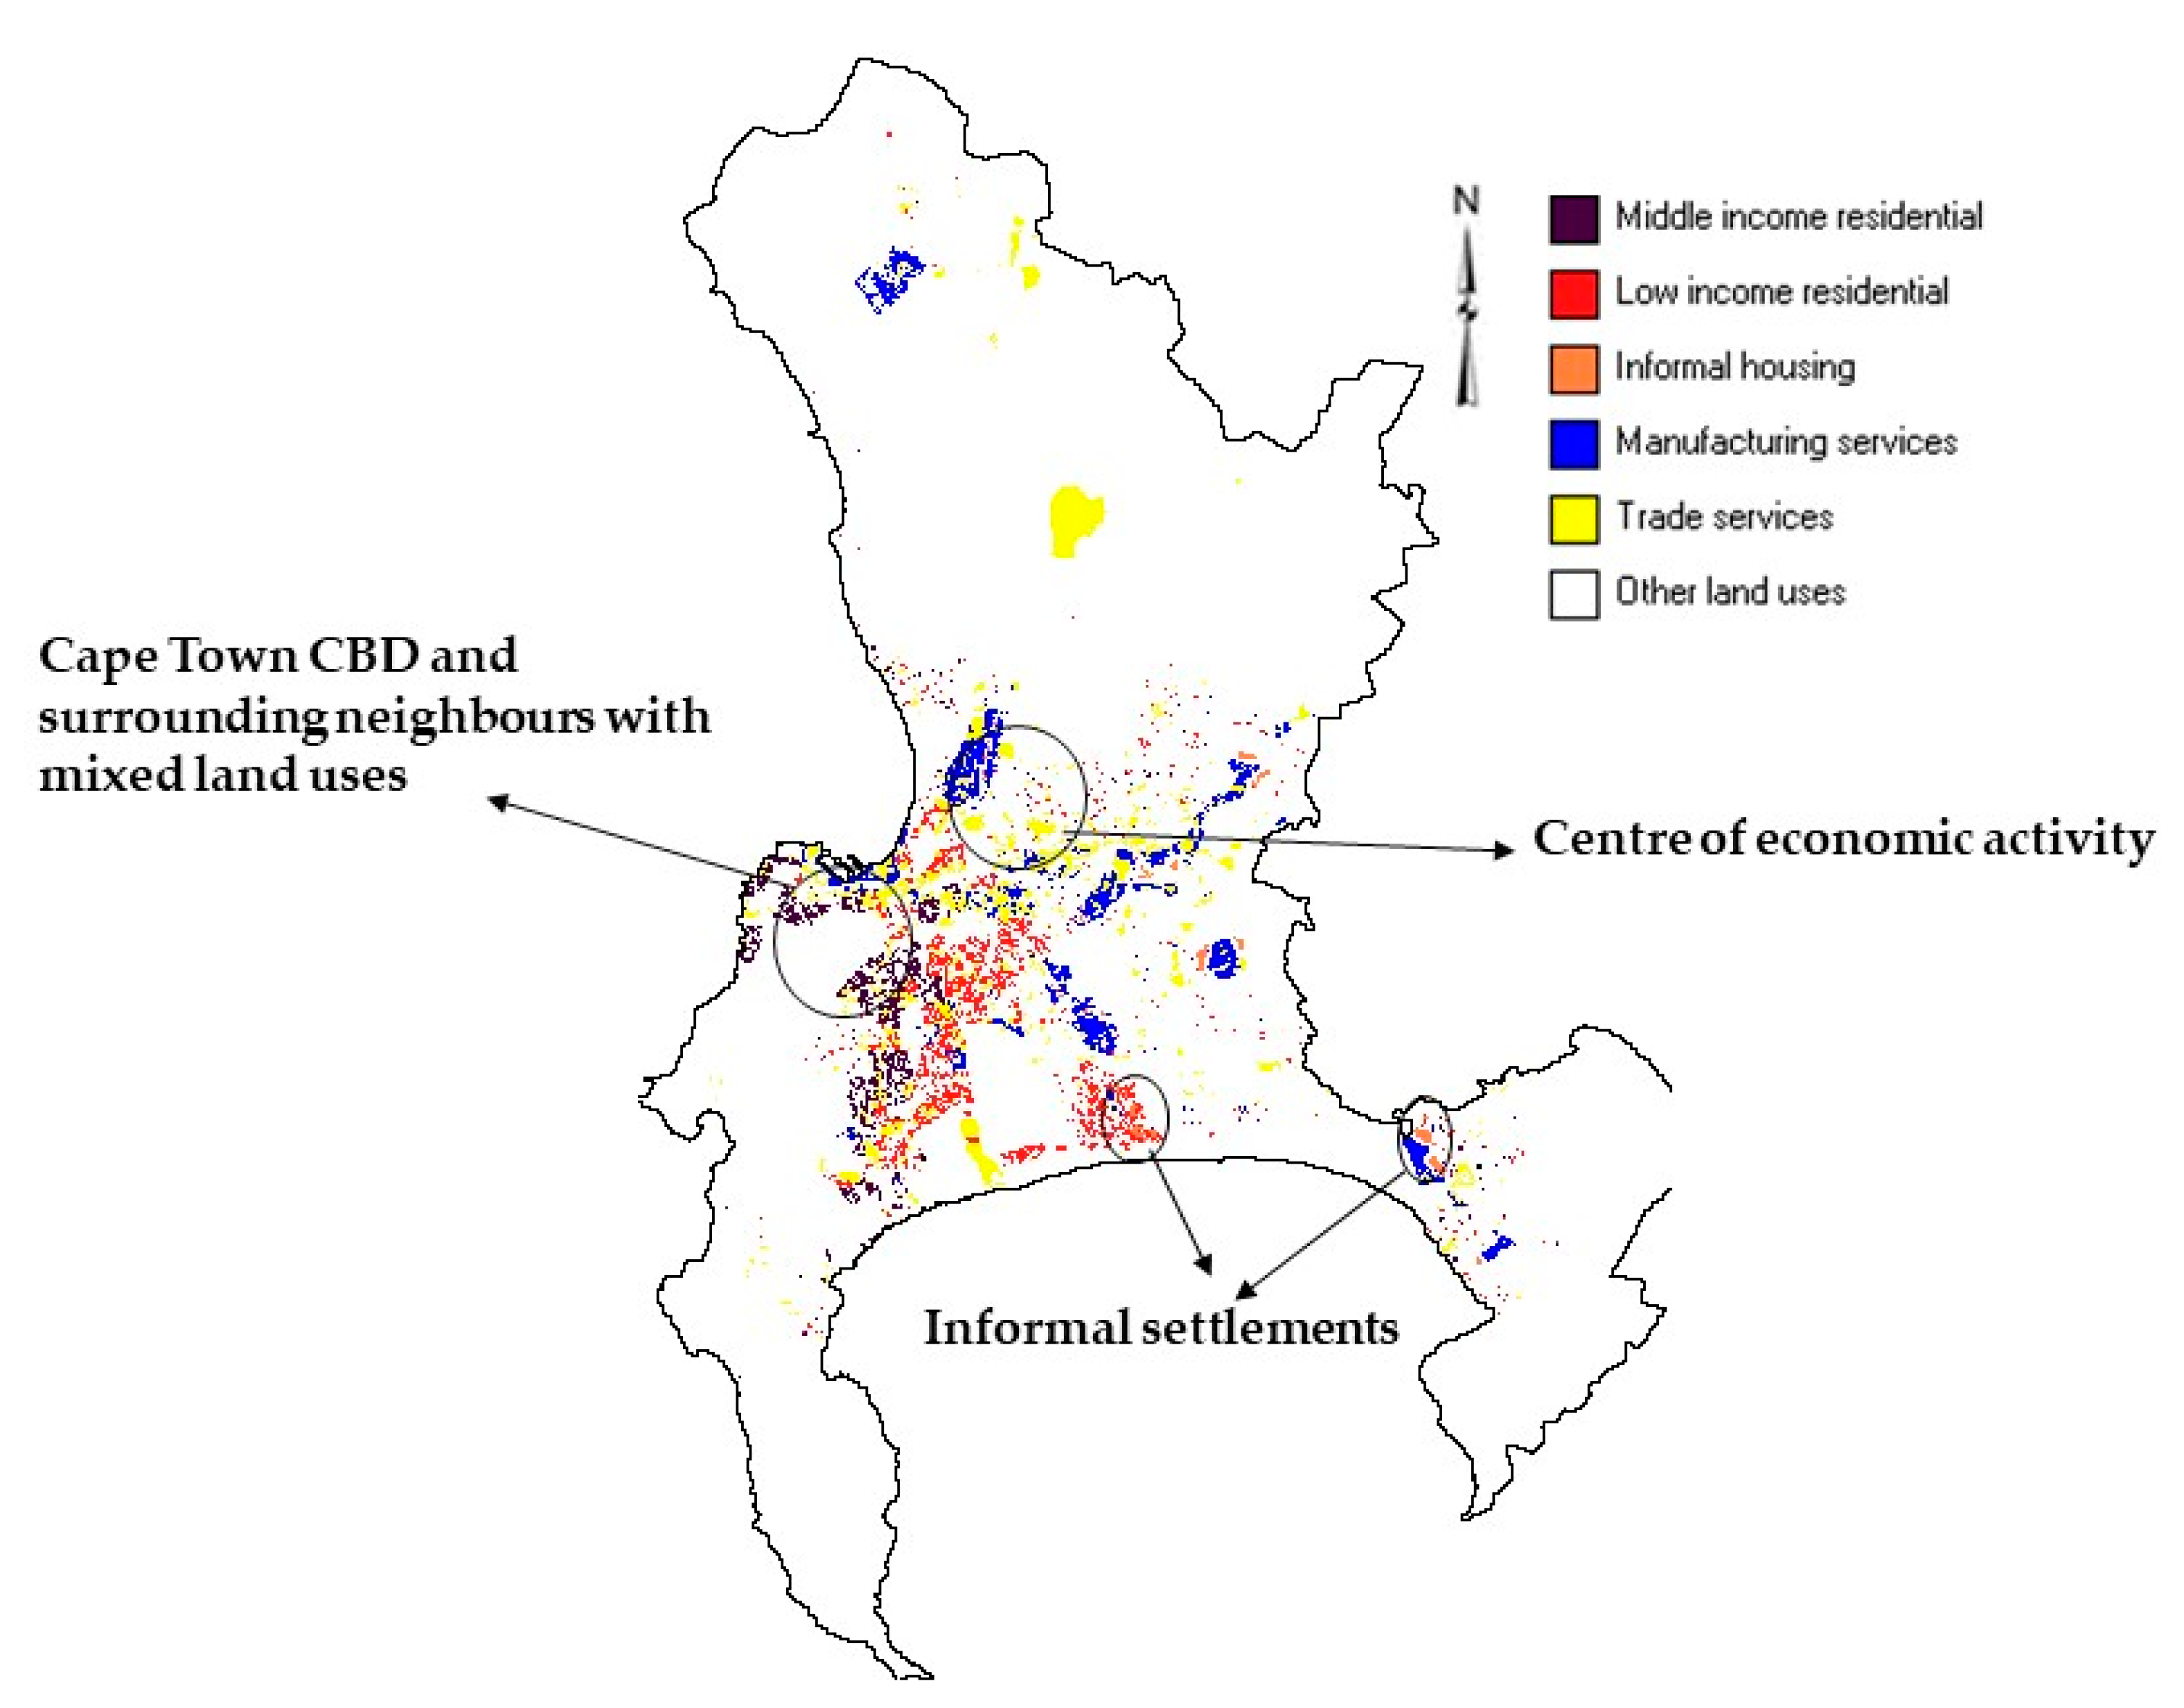
2.1. Study Area

Cape Town occupies 22,240 km2 of the Western Cape and is the second most populous city in South Africa. The number of informal settlements in the city is estimated to have increased from 50 in 1993, to 230 in 2010, and then to 379 settlements in 2014 [32]. This equates to around 20.5% of the city’s population in 2013 [33]. Further, there is a clear demarcation between low, middle and high-income housing due to apartheid and post-apartheid land use policies. While informal settlements have continued to grow, new housing for the low-income communities continues to be located in the peripheries [34] thus precipitating marginalisation of this cohort of individuals. Figure 1 shows the location of Cape Town.

2.2. The METRONAMICA Land Use Transport Model (M-LUT)

The mutual interaction of land use and transport has been widely documented [35,36,37,38] and models developed using these principles have been useful in the evaluation of policy and planning, such as the MEPLAN model for Leeds and Dortmund [39] and PECAS for Montgomery and Alberta [40,41]. For this paper, a cellular automata-based integrated land use transport model developed within the METRONAMICA framework by the Research Institute for Knowledge System (RIKS) [31] and used by amongst others [42,43,44,45,46,47] is presented here to show the relationship between land use and transport. This model was selected because the literature review revealed that there was a gap in both South African and African literature on the application and utilisation of a cellular automata (CA)-based land use transport model to understand urban dynamics, in that regard, METRONAMICA was an ideal model. In addition, because of the focus of assessing planning options, the CA-based land use component offered the possibility to incorporate and assess detailed spatial plans, something that would not be possible with many of the other LUTI model, which apply a statistically driven land use approach at transport zone level. The model comprises of the interaction between land use activities within the built environment and transport related activities. Further, the model assumes that there is an interdependence between the transport and land use activities which results in feedback loops between the two subsystems. Within the model, land use demands, suitability, zoning, accessibility and a set of rules that characterise the relationship between land uses are considered as the main drivers of land use change. The potential of a cell to convert (also referred to as the transition potential) from one state to another land use is determined by the influence of each of these drivers [48,49] is given by Equation (1),
P f ,   i = f ( r f , c , A f . c , S f . c , Z f . c , N f , c )
where:
  • P f , c   = potential for land use class f in cell c,
  • A f . c   = total accessibility for land use f in cell c,
  • S f . c = physical suitability for land use class f in cell c,
  • Z f . c   = zoning status which are laws and regulations pertaining to land use class f in cell c,
  • N f , c   = neighbourhood effect for land use f in cell c and
  • r f , c = random perturbation term which controls the scatter and density of land uses on the landscape.
Three types of land uses are modelled, function, vacant, and feature land uses. Function or active dynamic land uses have an exogenous demand and are responsible for simulating key urban dynamics. Vacant classes, or passive dynamic classes, take up the space that is left after allocation of the function classes, and hence, decrease with urban expansion. Feature land uses are static and therefore do not change during the course of a simulation, unless explicit interventions are imposed. They are not influenced by land uses within their neighbourhood, but they have an influence on surrounding function land uses [50,51].
The transport model operationalised here is a conventional four-step transport model after [52]. The model is adopted to represent the flow of transport and its intensity on the transport network. Reciprocal relationships between transport and land use dynamics are included in the model through a dynamic link between both components. The land use model provides input for the production and attraction of trips in the transport model, while the transport model provides information on the accessibility used as a key driver in the land use model, which is used in the allocation of urban land use classes. Total accessibility within METRONAMICA is comprised of four components of which local and zonal accessibility are the most important. Local accessibility is based on the distance to various network elements, while zonal accessibility incorporates the traffic information from the transport model and is defined as the ease of access to opportunities from a zone and how well the transport system facilitates this access [31,53]. Transport costs and the distribution of activities are the key factors that influence zonal accessibility and make up the generalised cost for travelling between and within zones. All equations of the land use and transport model are available as part of the Metronamica model description [31] and an excerpt of the accessibility equations is provided in Appendix A.

2.2.1. Application of the M-LUT in Cape Town

This section discusses the application of the METRONAMICA land use transport is applied to Cape Town. Transport modes within the M-LUT framework are modelled as either endogenous (private cars) or exogenous (public transport) modes where endogenous modes are used to assign traffic onto the network between the different zones. For the Cape Town application, adjustments were made in the way transport modes are modelled. This was influenced by the transport user system in Cape Town where both formal and informal modes of transport utilise the transport network and have competing intensities. In Cape Town, the middle and high-income individuals use private cars, while the low-income utilises minibus taxis and other modes of public transport [54]. This means that low-income earners have limited options with regards to mode choice and are, thus, captive to public transport, in this case minibus taxis. For the present application, to fully represent the transport user system in Cape Town, private cars and minibus taxis are modelled as endogenous modes while the bus mode was considered as the exogenous mode. While, only the road-based transport is modelled, the rail infrastructure was incorporated to allow for the impact of the train infrastructure on the land use dynamics. This is especially important in the forecasting period where different land use development scenarios are explored.
An integrated land use transport model for Cape Town was set up to simulate land use and transport changes between 1995 and 2005. A digital space of 100 m by 100 m cells (c) was used and 154 transport analysis zones (TAZ) were used to represent the activity zones in the Cape Town metropolitan region. A total of nine land uses were classified into either vacant, feature and function land uses and this was mainly determined by the influence of policy on the spatial distribution of land uses. The complete land use classification is presented in Table 1. For a full description of the methods used to classify the land uses see a previous article by the authors [30].
While the research focuses on the dynamics relating to informal settlements and low-income housing; to have a realistic representation of the urban land use dynamics, middle-income, high-income residential housing, manufacturing services and trade services were also modelled as function land uses. These land uses were identified to make up the main work-related origins and destinations in Cape Town and are, thus, essential in understanding social and economic inclusion trends within the city.

2.2.2. Land Use Model Data

Land use maps for the Cape Town metropolitan area for 1995, 2005, 2010 presented in Figure 2 were collated from the City of Cape Town (CoCT) database. To delineate residential areas by income, the census data on income for 1996, 2001 and 2011 [55] was used.

2.2.3. Transport Model Data

To derive trip productions and attractions data for the 154 TAZ, the population census and other sources [8,18,25,55,56,57,58,59,60], October Household Survey [57,58,60], National Household Travel Survey (NHTS) [61] and previous transport studies by the City of Cape Town were used. The road network maps from 1995, 2002 and 2006 were obtained with road network links clearly differentiating between road hierarchies. The 1995 road network layer was used as the initial input in the model while network changes for 2002, 2006 and 2010 were added as increments during the model simulation. The transport zone map and road network are presented in Figure 3.

2.3. Calibration and Validation of the Model for Cape Town

A manual and sequential approach was implemented to calibrate and validate the model after [36,62]. The first step was to calibrate the land use and transport models independently before calibrating the link between the two models. The land use model was calibrated by evaluating simulated land use changes between 1995 and 2005 and using the real land use map for 2005 as the reference map. For the transport model, the 1995 map was utilised as an input in the transport model to provide the initial land use activities in the form of trip productions and attractions. Due to the data disparities, the transport model was simulated to reproduce transport activities between 1995, 2003 and 2004, with 2003 and 2004 data used as reference data. This was also used to evaluate the performance of the transport model during the calibration period.
Once the calibration of the individual blocks was satisfactory, the zonal accessibility parameter which provides the link between land use and transport was calibrated. The aim during the calibration of this parameter was to identify a minimum threshold that resulted in land use patterns observed in the real map for 2005. A decision to introduce a new parameter was based on the extent to which each accessibility parameter affected the dynamics developed within the land use model, especially the influence of the parameter on known land use relationships. During the calibration of zonal accessibility, the sensitivity to cost parameter, which allocates land uses to transport zones for different trip purposes was also calibrated.

2.3.1. Method Used to Assess the Performance of the Cape Town Land Use Transport Model

To assess the performance or goodness of fit of the land use model, the predictive and process accuracy of the model were evaluated. Predictive accuracy focuses on the ability of the model to reproduce land use patterns that are similar to those observed in the region or environments under consideration [63,64]. Process accuracy entails evaluating the ability of a model to replicate processes that lead to land use changes similar to observed dynamics [63,64]. For the Cape Town application, the Kappa statistics, Kappa Simulation, Fuzzy Kappa Simulation and Fuzzy Kappa for individual land uses were used to compare the simulated map for 2005 to the actual land use map for 2005. The Kappa and Fuzzy Kappa statistic ranges between −1 and 1 where 1 indicates a perfect agreement between the simulated and real map and −1 shows that there are no similarities between the land use maps. When the Kappa value is equal to 0, this indicates land use similarities that can be attributed to chance and not accurate land use simulations [65]. Special attention is given to the Kappa Simulation and Fuzzy Kappa Simulation, as they express land use transitions and whether the transitions are in the right locations, while correcting for land use persistence [63,66]. Kappa simulation values range from −1 to 1, where 1 indicates a perfect agreement and 0 represents a special case where the agreement is as good as can be expected from a random distribution of the class transitions. On the other hand, the values below 0 indicate class transitions that are less accurate than can be expected from a random allocation of the given class transitions [67]. The model results, of the Kappa Simulation (KS), Fuzzy Kappa (FK) and Fuzzy Kappa Simulation (FKS) statistics for simulated maps are compared to a Random Constraint Match (RCM) model, which is used as a benchmark on which to assess the model performance. For the calibration or validation of the model to be acceptable, at the minimum, the model simulation results should outperform the benchmark. The RCM model creates a reference map with the correct land-use classes and their distribution by making small adjustments to the initial land use map such that the final map has the same composition as the real map used at the end of the calibration or validation period [65]. In the case of process accuracy, the fractal dimension was used, after [68,69] as it reveals the complexity of land use patches especially urban land [68]. The fractal dimension for the simulated landscape is compared to the fractal dimension of the actual study area to compare the similarity between the two statistics, thus, assessing the similarities between the simulated and real urban landscape patterns. For the model to be considered successfully calibrated, the different Kappa variants and the fractal dimension of the simulated maps have to outperform the benchmark [70,71].
The performance of the transport model during the calibration period was assessed by comparing the trip generation for work and education trips simulated by the model in 2003 to those reported in the National Household Travel Survey in 2003. This was done for the bus, car and minibus taxi mode as they are the only modes used in the study. A comparison was also made for trip generation for the bus for three suburbs that were recorded among the highest trip generators in the morning peak. The simulated results were compared to the 2004/05 Current Public Transport Record (CPTR) [72] for Cape Town. The modal splits simulated by the model for 2003 were also compared to the modal split in the 2003 NHTS for Cape Town. Average commuting distances simulated by the model were also compared to those reported by the City of Cape Town in the comprehensive development plan [73].

2.4. Results from the Calibration and Validation of the Model

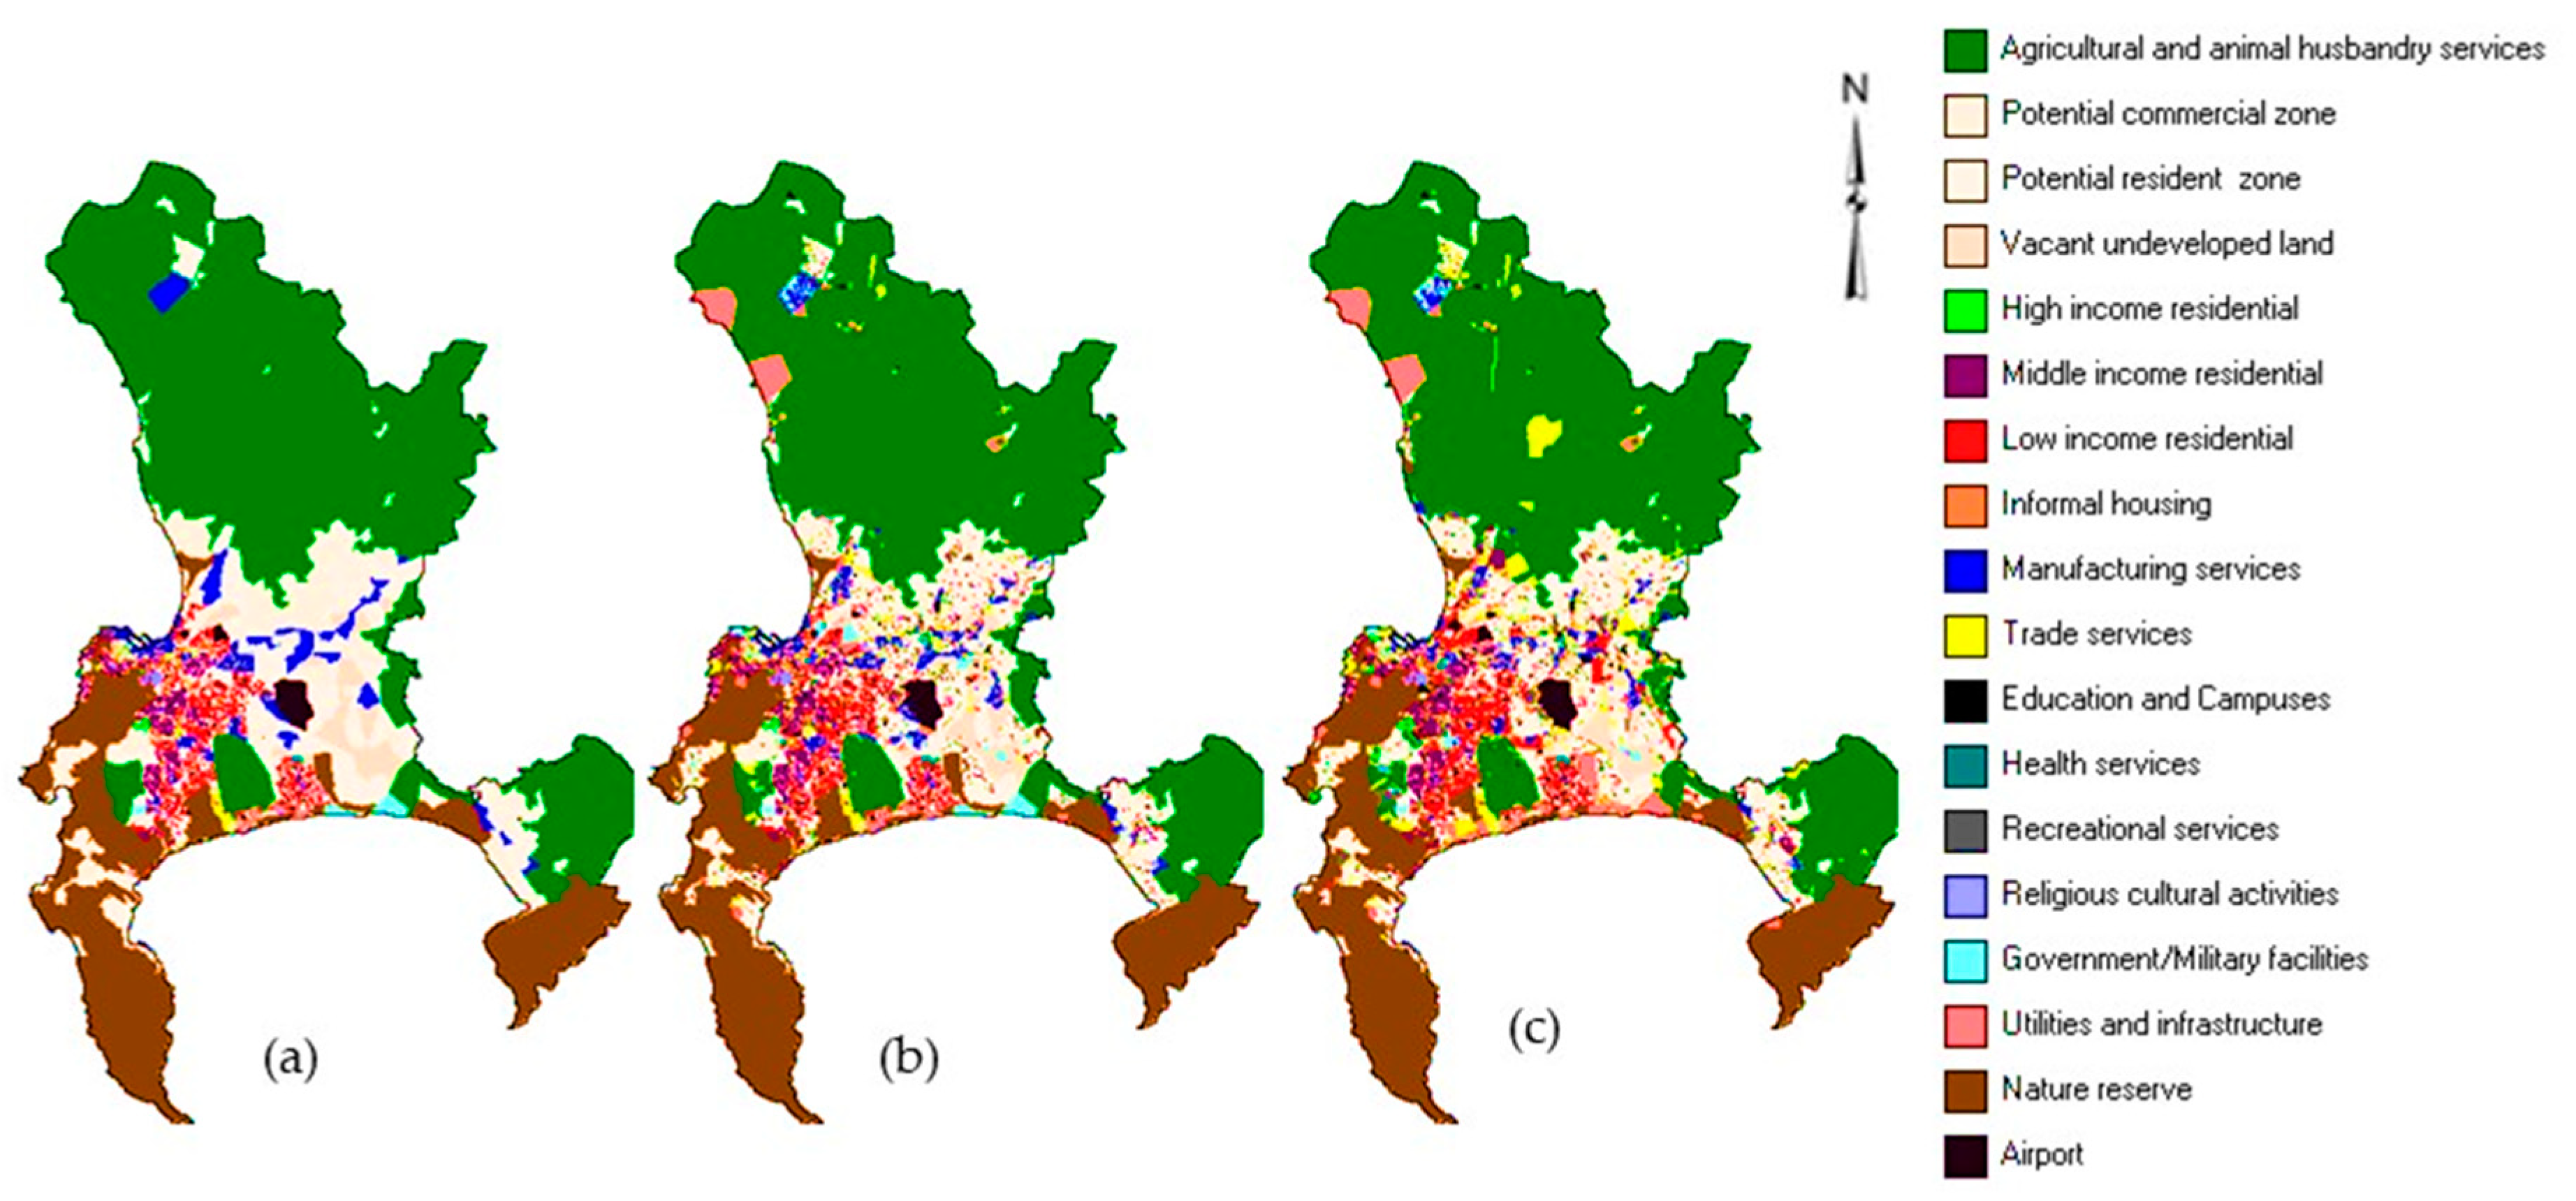
2.4.1. Land Use Model Results

The results in Table 2 show that the FK scores for all dynamic land uses are relatively high except for informal settlements. This can be attributed to the complexity in replicating the land use dynamics associated with this land use as it is unpredictable and does not conform to regular land use transition rules. Land use persistence is a plausible explanation for the high FK scores for other residential land uses as residential land uses tend to persist in their locations. In the case of manufacturing and trade services, the high FK value is encouraging as these land uses respond to market forces which make them amenable to both short- and long-term changes which might influence their location.
To verify the plausibility of these findings, land use transitions were assessed using Kappa Simulation (KS) for both the calibration and validation period, the results are presented in Table 3. As mentioned in Section 2.3.1, kappa simulation values range from −1 to 1, with 1 indicating a perfect agreement and 0 represents a special case where the agreement is as good as can be expected from a random distribution of the class transitions. Values below 0 indicate class transitions that are less accurate than can be expected from a random allocation of the given class [67]. As expected, KS scores for both periods are lower than the computed FK scores for individual land uses as the KS accounts for land use persistence. The KS scores for the calibration and validation period for model simulations are both above zero, while for the RCM, these scores are below zero. This indicates the capability of the model to simulate land use changes for individual land uses. Interestingly, the KS score for informal settlements and high-income residential areas are the lowest indicating that the model struggles to reproduce land use changes for these land uses. For high-income residential areas, it might be attributed to the difficulties encountered in identifying appropriate rules between high-income and informal settlements, as there are cases where informal settlements are located close to high-income residential areas. In the case of the validation period, the model parameters are not fined- tuned during the validation which can potentially make it difficult for the model to accurately predict land use changes.
The low KS for trade services might be due to significant changes this land use went through, which makes it difficult for the model to predict land use changes accurately. This is expected as it becomes more difficult to simulate land use changes when a land use undergoes significant changes [74]. While, the model performance decreases during the validation period, it still outperforms the benchmark as can be seen by the KS results for the benchmark. The fractal dimension (presented in Table 4) is used to evaluate the process accuracy of the model.
The results show that the fractal dimension values, calculated based on the 2005 and 2010 simulated maps is close to the fractal dimension of the actual 2005 and 2010 land use maps. There is a deviation of around 0.004 in the fractal dimension between the simulated maps and the real maps. This is comparable to other studies [63] who reported a 0.008 deviation. This is an encouraging finding as it indicates that the model simulates land use patterns that are consistent with reality. Further, this also suggests that the neighbourhood rules developed to describe land use relationships are suitable for the Cape Town region as they generated realistic land use patterns. Additionally, the model outperforms the benchmark as the fractal dimension for the benchmark has a higher deviation from the real map.

2.4.2. Transport Model Results

The total number of work and education trips predicted by the model for 2003 are 626,854 and 321,707 respectively while the NHTS survey metropolitan reports for 2003 show that the observed work and education trips are 637,235, and 317,609, respectively. This represents a 98.37% prediction accuracy for the work trips and a 98.73% prediction accuracy for the educational trips. This shows that the model slightly under predicted work trips and over predicted education trips. Based on the results, most of these trips are morning peak trips, which is consistent with the time when work and education trips occur in Cape Town. Further, the model was able to allocate most trips to suburbs that are characterised as the main trip origins by bus, this is similar to findings in the City of Cape Town’s integrated plan [75]. For selected trip origins the results show that the model has estimation errors for the number of trips for some neighbourhoods by a range between 8% and 23.4%. Other studies, such as [36], have reported estimation errors ranging from 12.3% to 18.2% in estimating the number of trips. The Cape Town estimation errors are slightly higher compared to [36], but the lowest estimation error is 8% for the Cape Town model compared to 12.3% for the Jeddah case, this indicates that the performance of the Cape Town model is generally good.
A comparison of the modal split simulated by the model and that reported in the NHTS shows that the Cape Town model was able to allocate most trips to the car mode, followed by minibus taxis, which is similar to the pattern observed in the NHTS (2003). However, the model under-predicts car trips by 17% and over predicts the minibus taxi trips by 3%. The low estimation of car trips can be attributed to the underestimation of the number of people who use private cars for intrazonal trips. Overall, based on the results, the calibration of the transport model was successful and comparable to reality.

2.4.3. Calibration of the Link between the Land Use and Transport Model

The calibration of the zonal accessibility parameter used a manual trial and error correction method until the model produced realistic land use patterns. The initial parameter implemented in the model was 0.6 and the land use patterns were evaluated after each model run. The final calibrated parameter was 0.7 and this resulted in land use patterns similar to those observed in the 2005 real map and also those reported in a previous article by authors [30]. The integrated model was then evaluated for process and predictive accuracy using the different variants of the Kappa statistic and the fractal dimension.

2.4.4. Results from the Calibration and Validation of the Integrated Model

The Kappa statistics and its variants are used to evaluate the calibration and validation results, specifically looking at the goodness of fit of the integrated model. The results compare the different variants of the Kappa statistic and the fractal dimension for actual and simulated land use maps of 2005 and 2010. The results are presented in Table 5.
The Kappa and FK scores for all models for both the calibration (2005) and validation (2010) are close to 1 and outperform the benchmark. In fact, there are clear differences in the Kappa statistic and its variants between the model simulations with and without the link to the transport model for 2005 and 2010. With the incorporation of the transport model, KS increased from 0.580 to 0.6884 for the calibration period, while FKS increased from 0.616 to 0.704. This improvement in the Kappa statistics and its variants suggests that the introduction of the link between land use and transport adds value in explaining urban dynamics. Noteably, there is a slight decline in the model performance during the validation period. This is expected as the predictive accuracy of the model becomes limited over time and is even more difficult when there are more land use changes to predict over time [76]. Further, the parameters used during the validation period, are the same parameters defined during the calibration stage, this potentially impacts the model performance as the parameters are implemented on a different dataset. Overall, the Cape Town model outperforms the benchmark which shows that the model has been successfully calibrated. Though a decline in the KS and FKS is observed between the calibration and validation period, the results show that the KS (0.2927) and FKS (0.3251) are above zero, indicating that the model does simulate land use changes sufficiently also over the validation period.

3. Application of the Model to Explore Different Land Use Development Strategies

There is a consensus that South African cities need to be restructured, specifically by redressing apartheid spatial planning to attain equitable, socially and economically inclusive cities. There has been an emphasis on the densification of transport corridors and locating new low-income housing close to well-developed transport corridors to improve access to opportunities for the marginalised groups. The overarching aim of this paper is to apply the Cape Town model as a spatial decision support tool to explore two land-use driven development strategies directed at informal settlements and low-income housing. Therefore, this section focuses on assessing whether land use driven planning and policies under different urban development scenarios are viable options to improve the social and economic inclusion of marginalised groups in Cape Town. Two urban development scenarios and a business-as-usual scenario are simulated in the model from 2010–2030 to show the land use and transport changes in Cape Town and their associated impacts.

3.1. Scenario 1: Business as Usual (BAU)

This is the baseline scenario and considers a continuation of the status quo in the growth trajectory of land use and the associated interactions from 1995 to 2010. In addition, in-situ upgrading of informal settlements and the revival of inner-city activities is also encouraged in this scenario. The aim is to test the impacts of maintaining the current growth trajectory on access to employment.

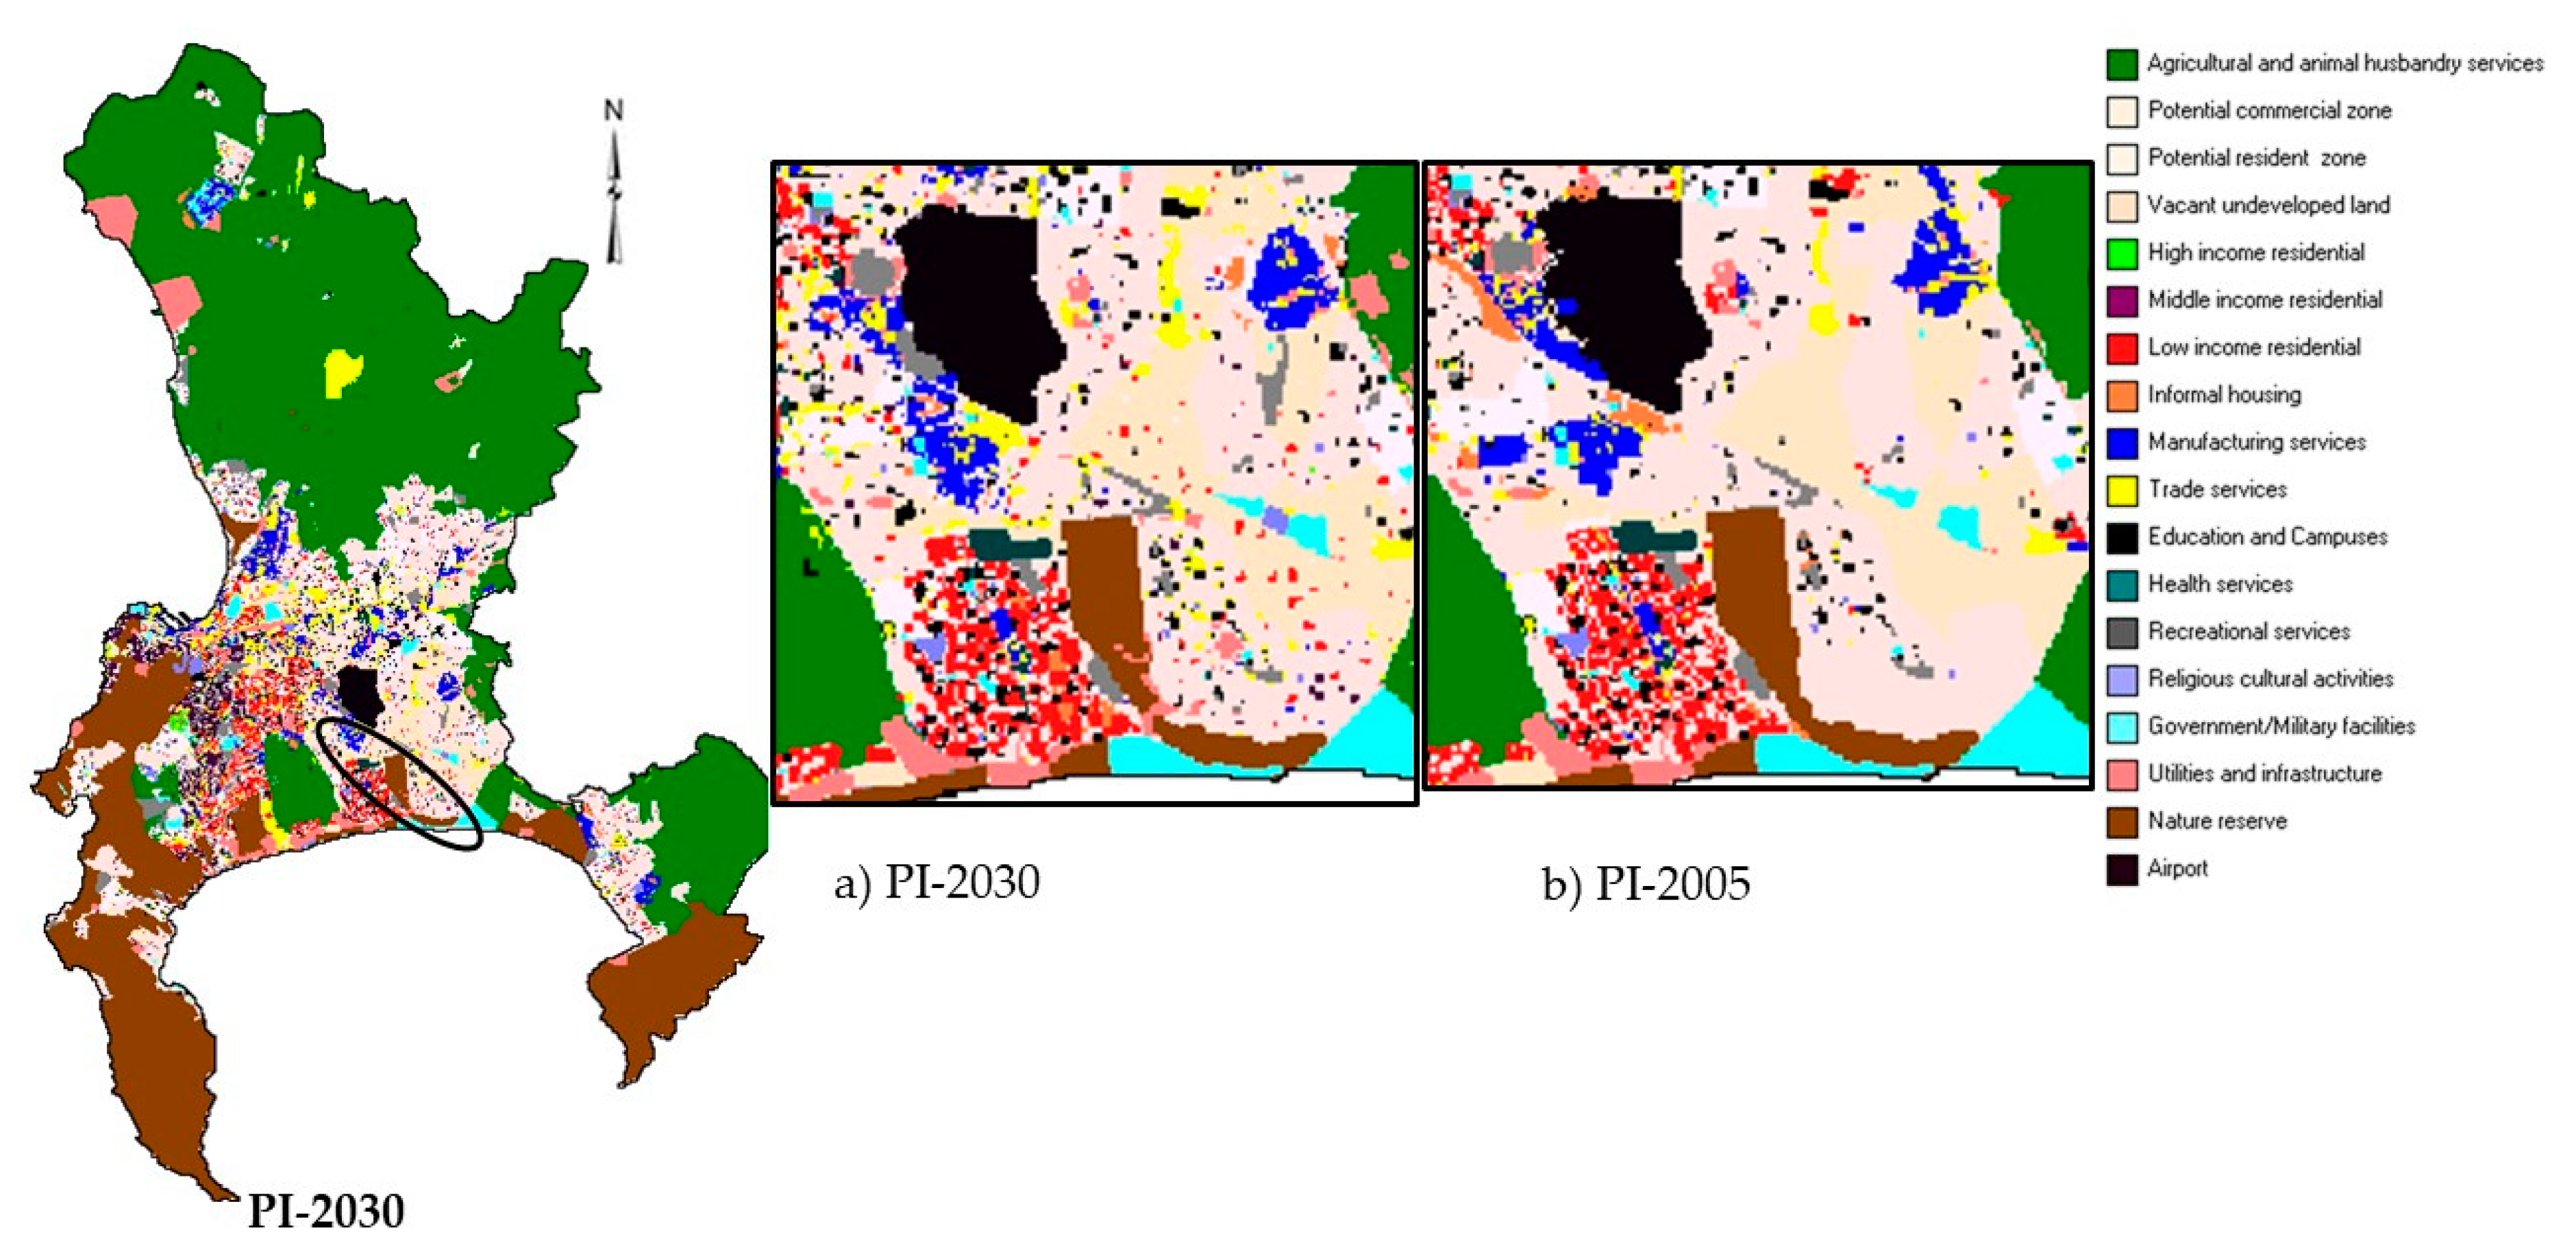
3.2. Scenario 2: Proliferation of Informal Settlements (PI) Scenario

Informal settlements are an urban phenomenon in South African cities, one that continues to tether South Africa to its historical past. While policies, such as the Breaking New Ground are clear with regards to informal settlements [14], other authors [13,15,38] note that there is still ambivalence in policy. Flowing from that, this scenario is similar to the BAU scenario, but there are no restrictions on the growth of informal settlements and an annual growth of 3% per year is expected. This scenario tests the potential impacts of some of the urban development strategies proposed in the Cape Town as a solution to addressing informal settlements. The hope is that this information provides additional knowledge on the prediction of informal settlement growth and locations in Cape Town and help in evaluating whether the new locations of informal settlements and the eventual in-situ upgrading are in line with housing policy aimed at improving accessibility for the low-income.

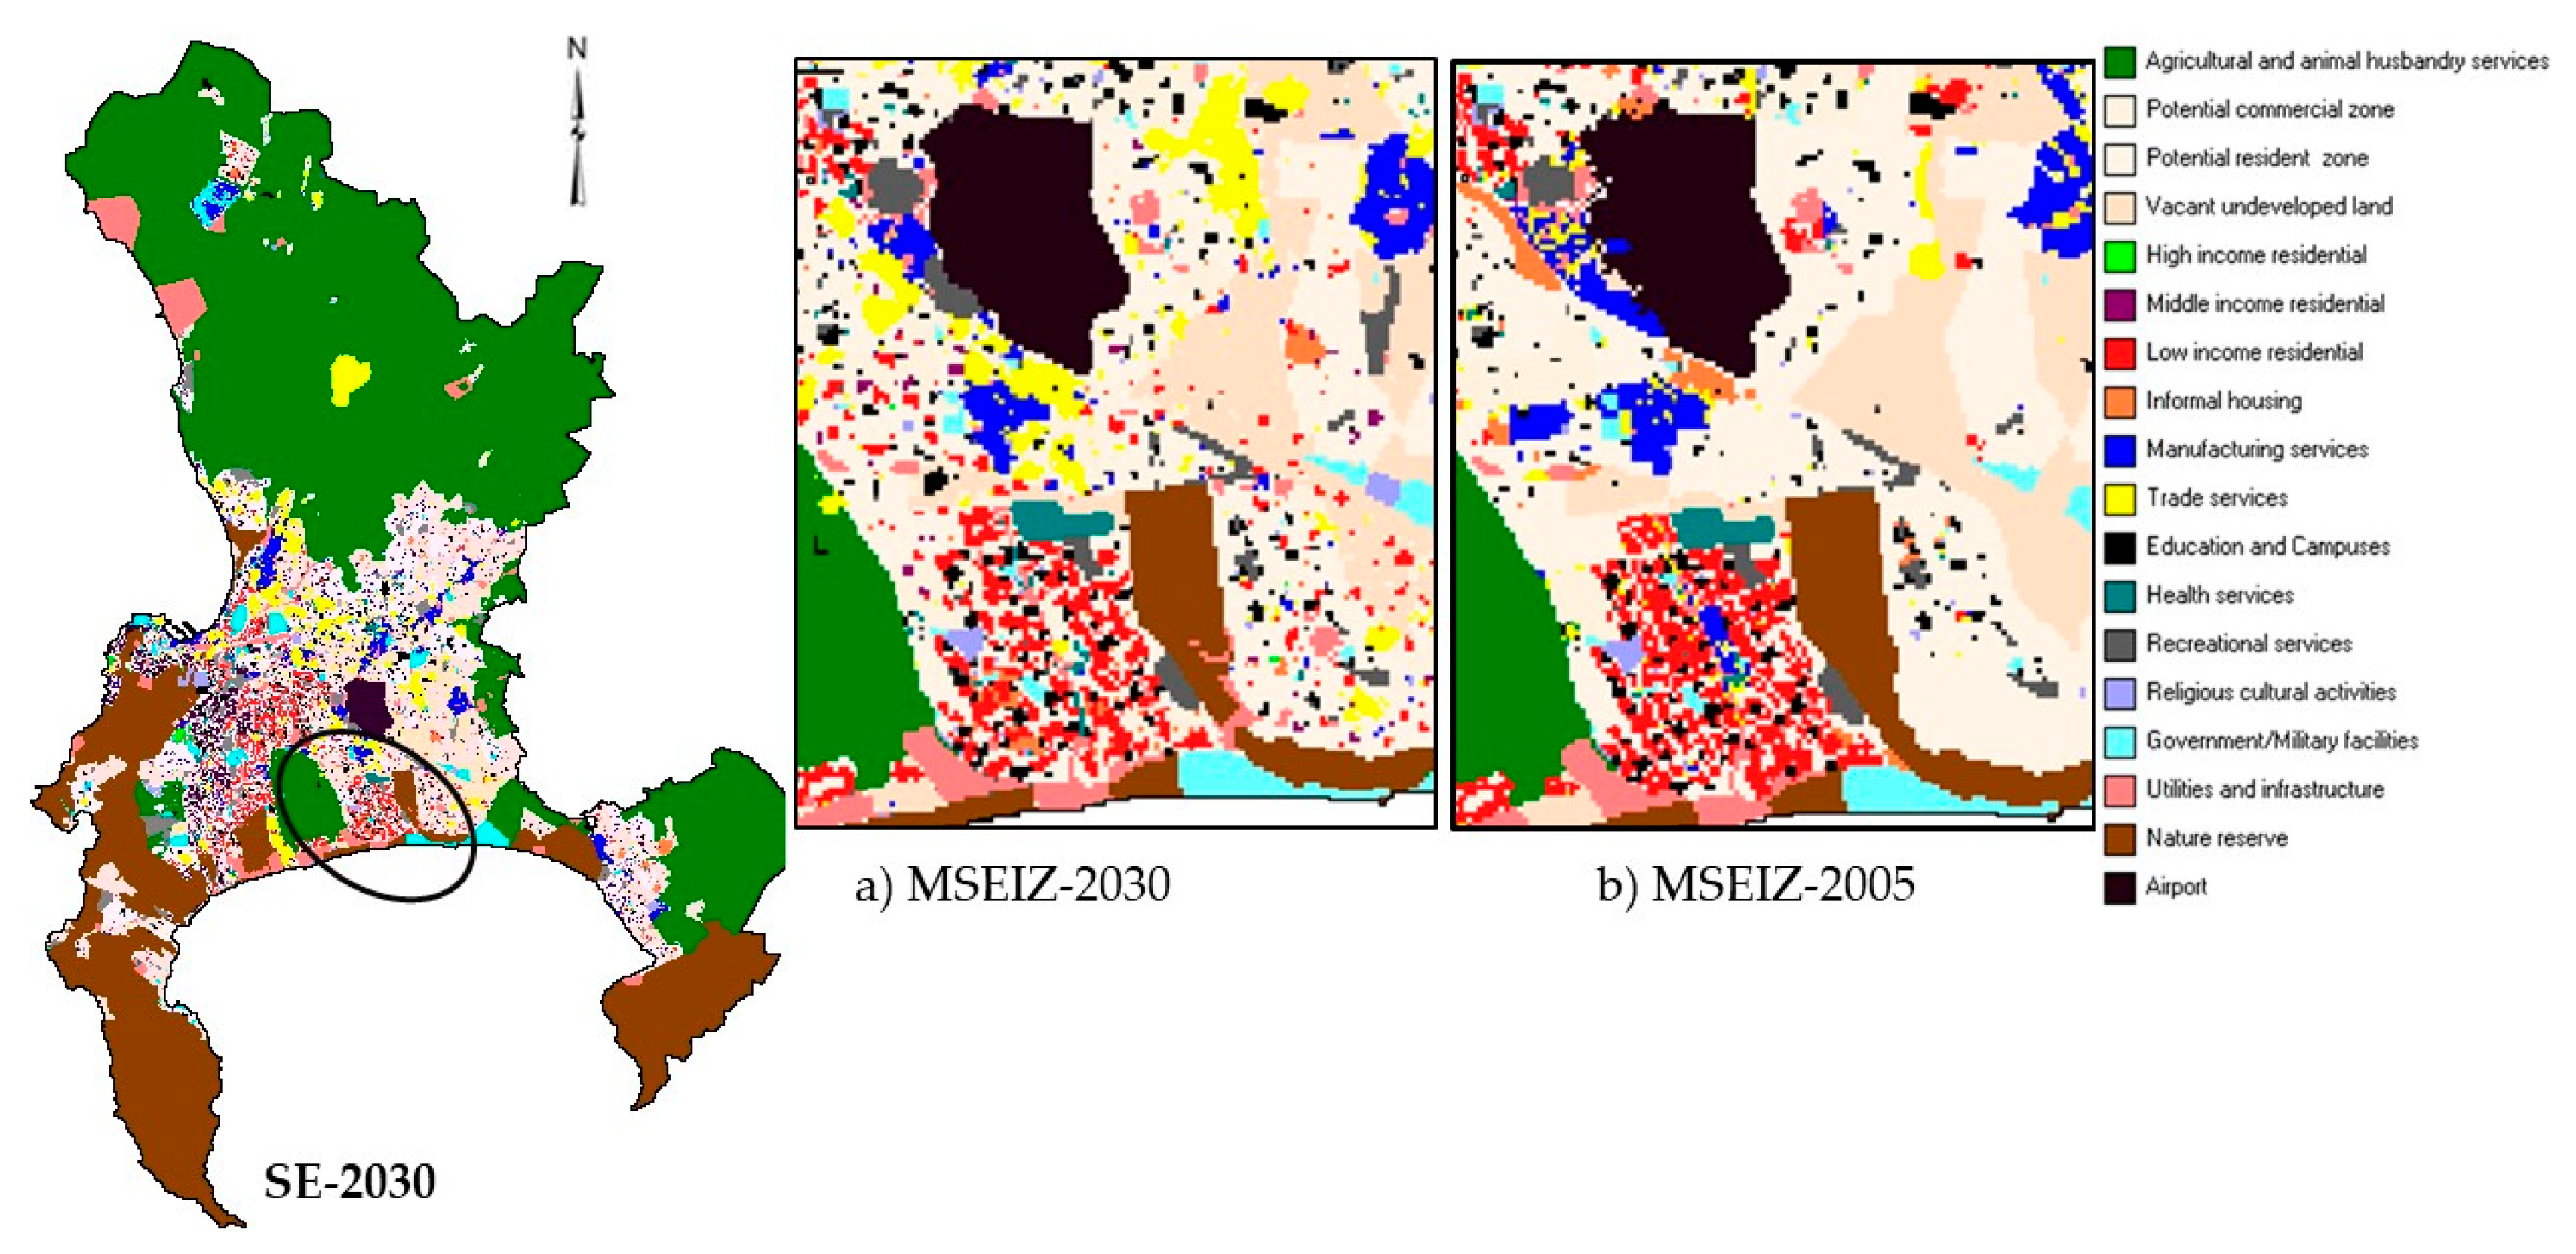
3.3. Scenario 3: Redressing of Social Exclusion (SE) Scenario

Like Scenario 3, this scenario also tests components of proposed urban development strategies in Cape Town, specifically it focuses on redressing some of the spatial issues in the City by ‘unlocking’ low-income housing in areas with fully developed transport infrastructure with access to economic opportunities. The scenario considers compact growth or densification strategies where the focus is on the extensive development of the Metro South East Integration Zone (MSEIZ) specifically the area with low-income areas, such as Philippi, Mitchells Plain and Khayelitsha. This corridor houses 40% of Cape Town’s population of which most of them are marginalised with low income, have poor access to essential services and are also in need of formal housing [77,78]. Therefore, this scenario allocates all of the 1% low income housing which the city is estimated to deliver yearly [79] on the MSEIZ to test the potential benefits of redressing social exclusion. Figure 4 presents the spatial structure of the MSEIZ.
To simulate different land use development scenarios, a set of assumptions were made for each of the urban development scenarios. These are presented in Table 6.

3.4. Results from the Urban Development Scenarios

This section presents the results from the urban development scenarios that were simulated using the model. To evaluate the outcomes of each urban development scenario, a set of indicators were developed to show the spatial expansion and urban patterns on the landscape. Specifically, indicators were developed to:
  • determine the spatial development of the city under different scenarios until 2030.
  • evaluate the change in zonal accessibility for manufacturing and trade and services in relation to informal and low-income residential areas.
  • determine the distance to locations with manufacturing and trade and services from the informal and low-income housing.
  • determine the average commuting distance to economic centres from informal and low-income housing under different scenarios.

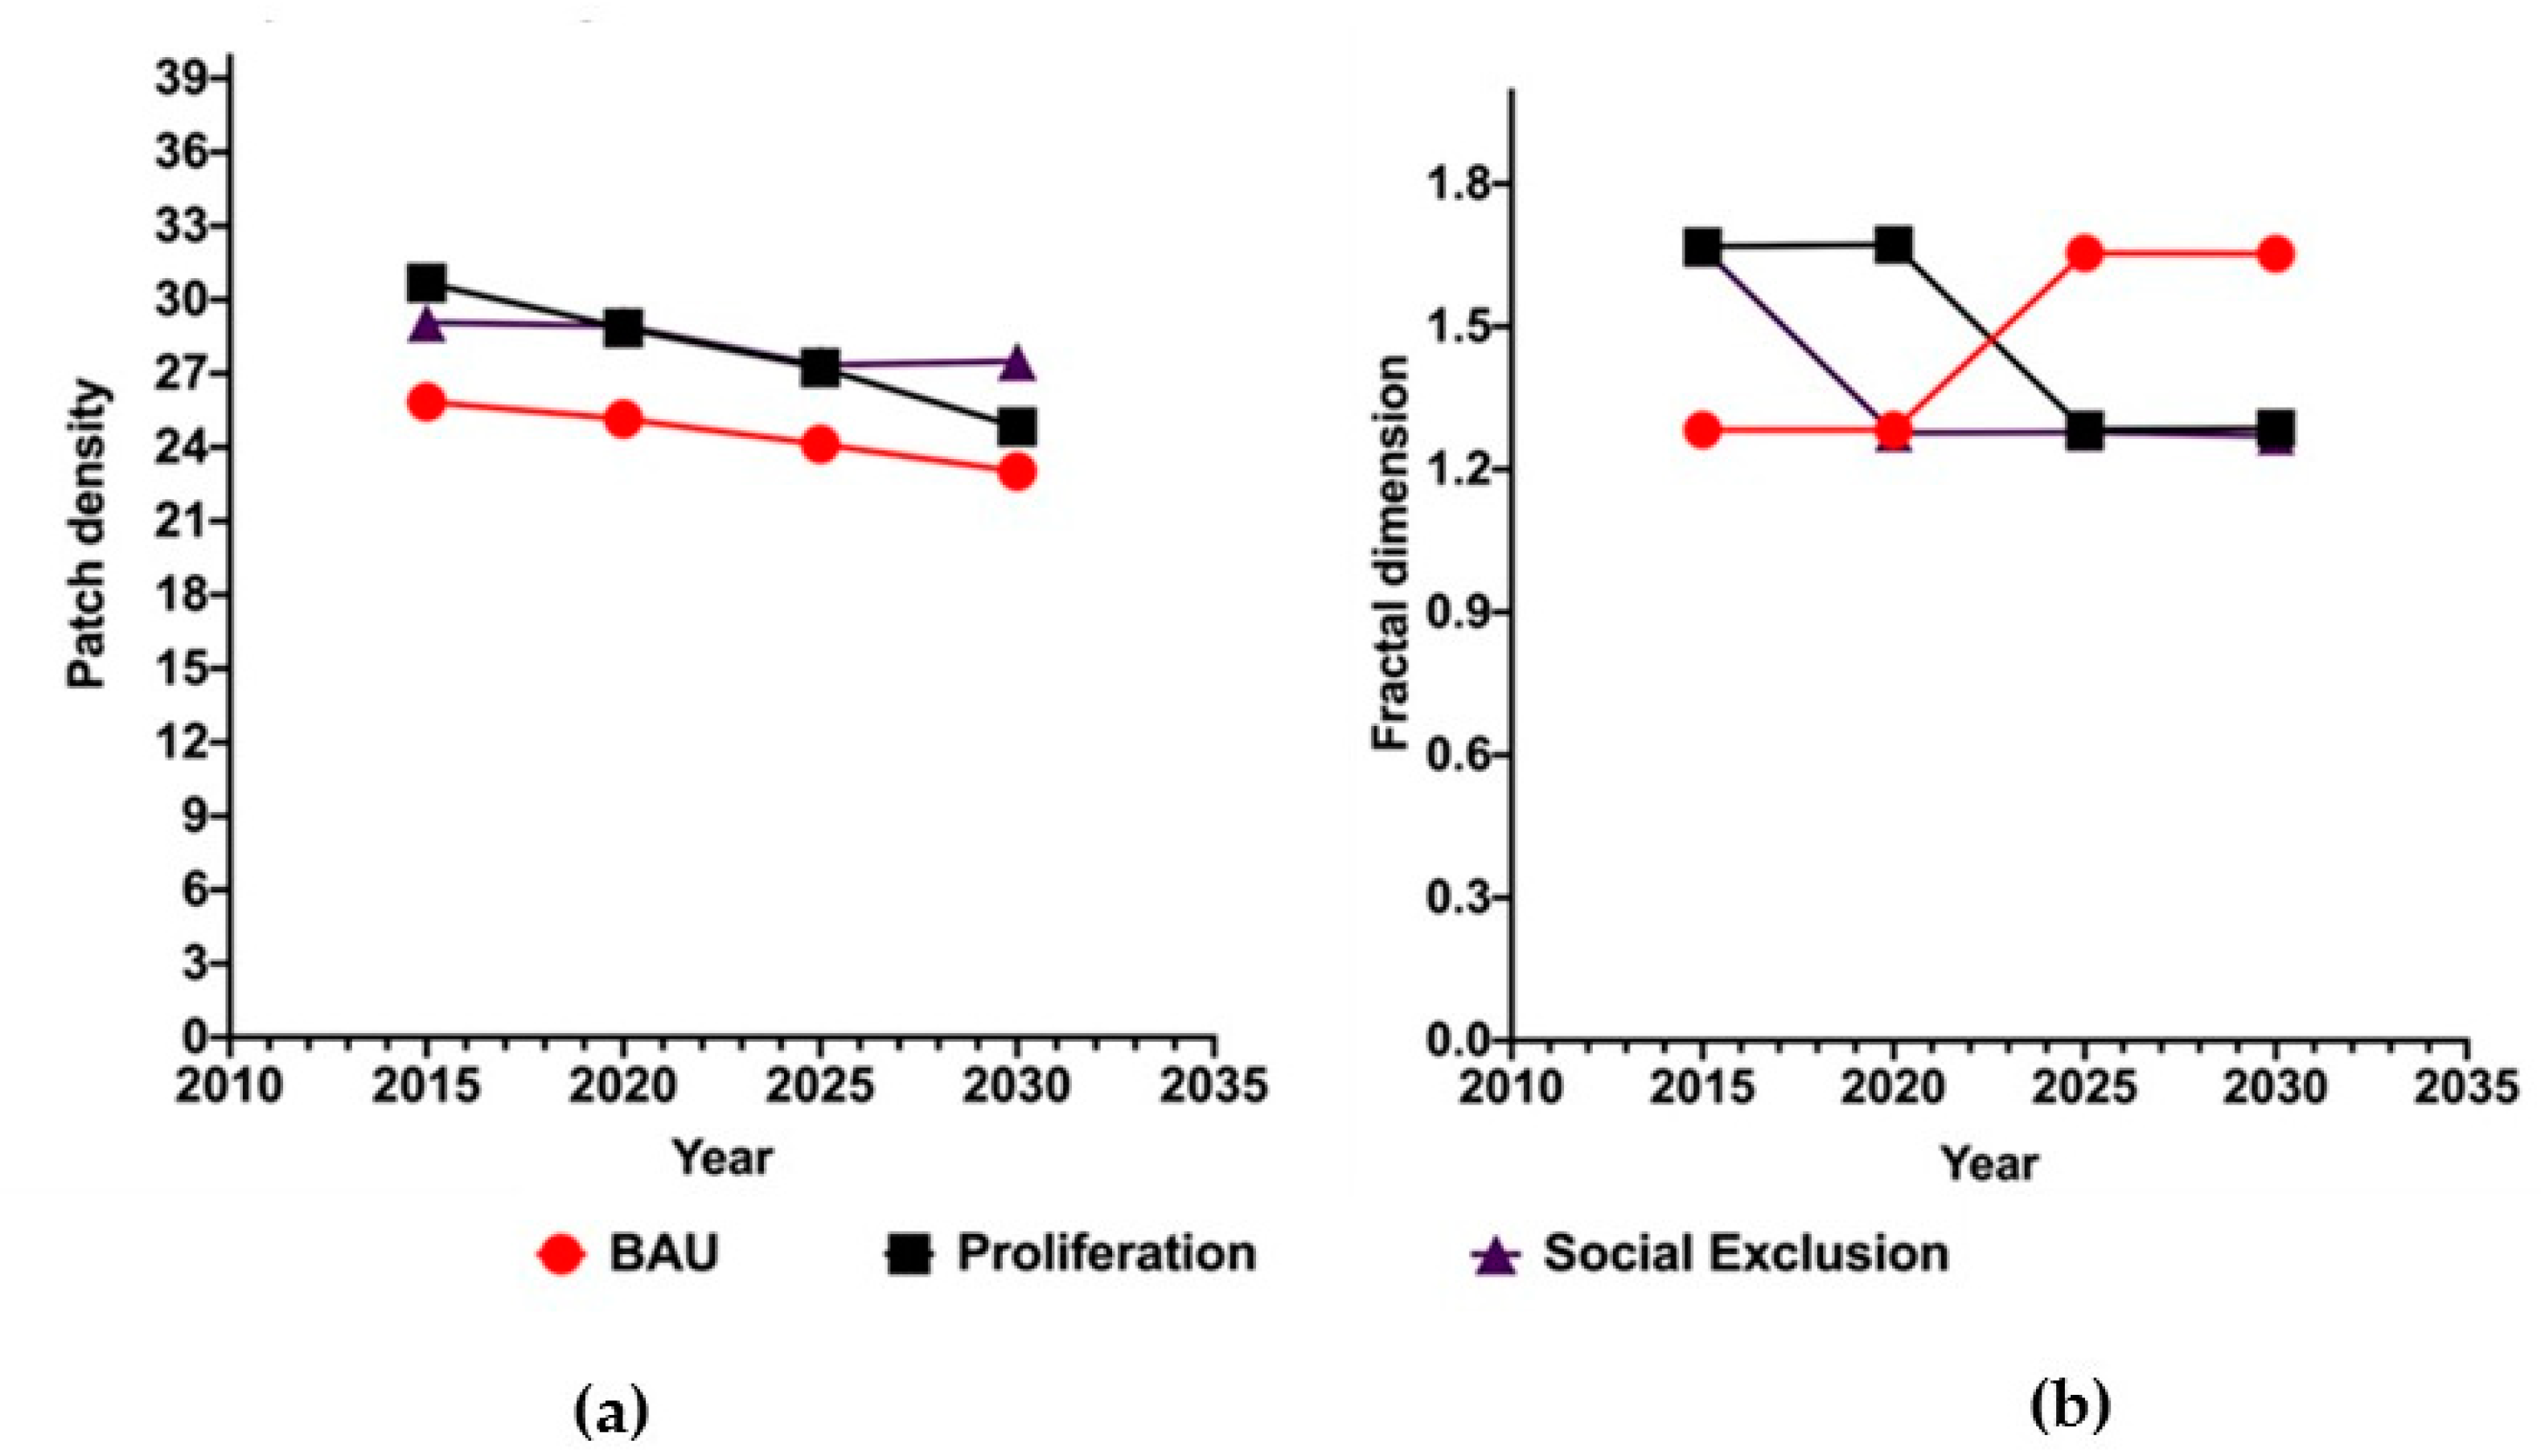
3.4.1. Spatial Expansion under All Scenarios

The resulting spatial structure of Cape Town in 2030 under different urban development scenarios is discussed in the section below. Figure 5 compares the MSEIZ in 2005 and in 2030 under the redressing of social exclusion scenario.
As indicated in Figure 5b, the MSEIZ was characterised by low urban land use densities. The results shown in Figure 5a show that under the SE scenario, stimulating the growth of low- income housing along the MSEIZ has resulted in low-income housing locating along the primary and secondary roads which is expected as these areas allow for better accessibility Interestingly, while the scenario focused on ‘unlocking’ low-income housing; commercial activities and middle-income housing development was also directed into the MSEIZ. This has resulted in mixed land uses on the corridor comprising of trade and services, low-income and middle-income housing. The fractal dimension (Figure 6b) also supports this finding as there is an aggregation of previously isolated patches along the corridor thus representing a more regular and aggregated landscape, this can be attributed to the coalescing of land uses along the MSEIZ corridor especially trade and services. This is further explained by the low patch density under the SE scenario (Figure 6a. This is an expected finding as the scenario focused on compact growth especially through infilling hence the patch density consequently decreased. Another observation is that there has been a limited growth in new manufacturing services along the MSEIZ corridor.
The spatial structure under the PI as shown in Figure 7, shows that new manufacturing land use development in the low-income south eastern suburbs, which can be linked to a potential increase in access to opportunities for the low-income cohort in these neighbourhoods. Interestingly, the fractal dimension (Figure 6b) under the PI scenario decreases between 2015 and 2020 and becomes stable showing a delayed response in land use changes. This shows that there is a time lapse between policy implementation and the change in the spatial patterns of targeted urban land uses.
As expected, under the BAU scenario (Figure 8), low-income housing is observed to scatter towards the peripheries while informal settlements were observed to form into large clusters as opposed to “mushrooming” in new locations. However, some new locations of informal settlements were also observed on previously vacant land close to manufacturing services and in some cases close to low-income housing. Additionally, informal settlements are observed to locate adjacent to low-income residential areas and manufacturing services.
Another observation under the SE (Figure 5) and PI (Figure 7) scenarios was that the growth in low-income residential areas was not necessarily accompanied by urban expansion. This was linked to the redevelopment of old buildings into new low and middle-income residential areas, especially along the southern suburb corridors. Overall, there are noticeable differences on the MSEIZ corridor towards the low-income eastern suburbs where there are high land use densities under the SE (Figure 6) scenario, compared to the BAU (Figure 8) and PI (Figure 7) scenarios. This is expected as the SE scenario focused on stimulating land use development especially low-income housing along well-developed transport corridors. This finding is supported by the low patch density under the SE scenario (Figure 6a) where the focus on land use development was along the MSEIZ corridor which previously was characterised by low land use densities. This is an expected finding as the scenario focused on compact growth especially through infilling hence the patch density consequently decreased.
While for all scenarios, the patch density (Figure 6a) has decreased indicating that some land use patches are becoming connected, the changes are minimal as the slopes of all curves are very low. Notably, the PI scenario has the highest percentage decrease in patch density of 19%, while for the BAU and SE scenario the patch density has decreased by 10.9%, and 5%, respectively.
While the BAU scenario has been mainly characterised by sprawled growth (Figure 8) a close look shows a decrease in patch density over time, this can be attributed to infilling in urban development. Infill is mostly observed closer to the urban core due to the Urban Development Zone (UDZ) tax incentive, which might have resulted in the coalescing of some urban land uses, primarily commercial. Additionally, the growth of informal settlements into large patches adjacent to low-income housing as shown in Figure 8 and close to manufacturing land uses results in continuous urban patches, which influences the patch density. Interestingly, the fractal dimension for the BAU scenario has increased over the period indicating an increase in the complexity and landscape fragmentation; this can be linked to the sprawled nature of some land uses in this scenario.

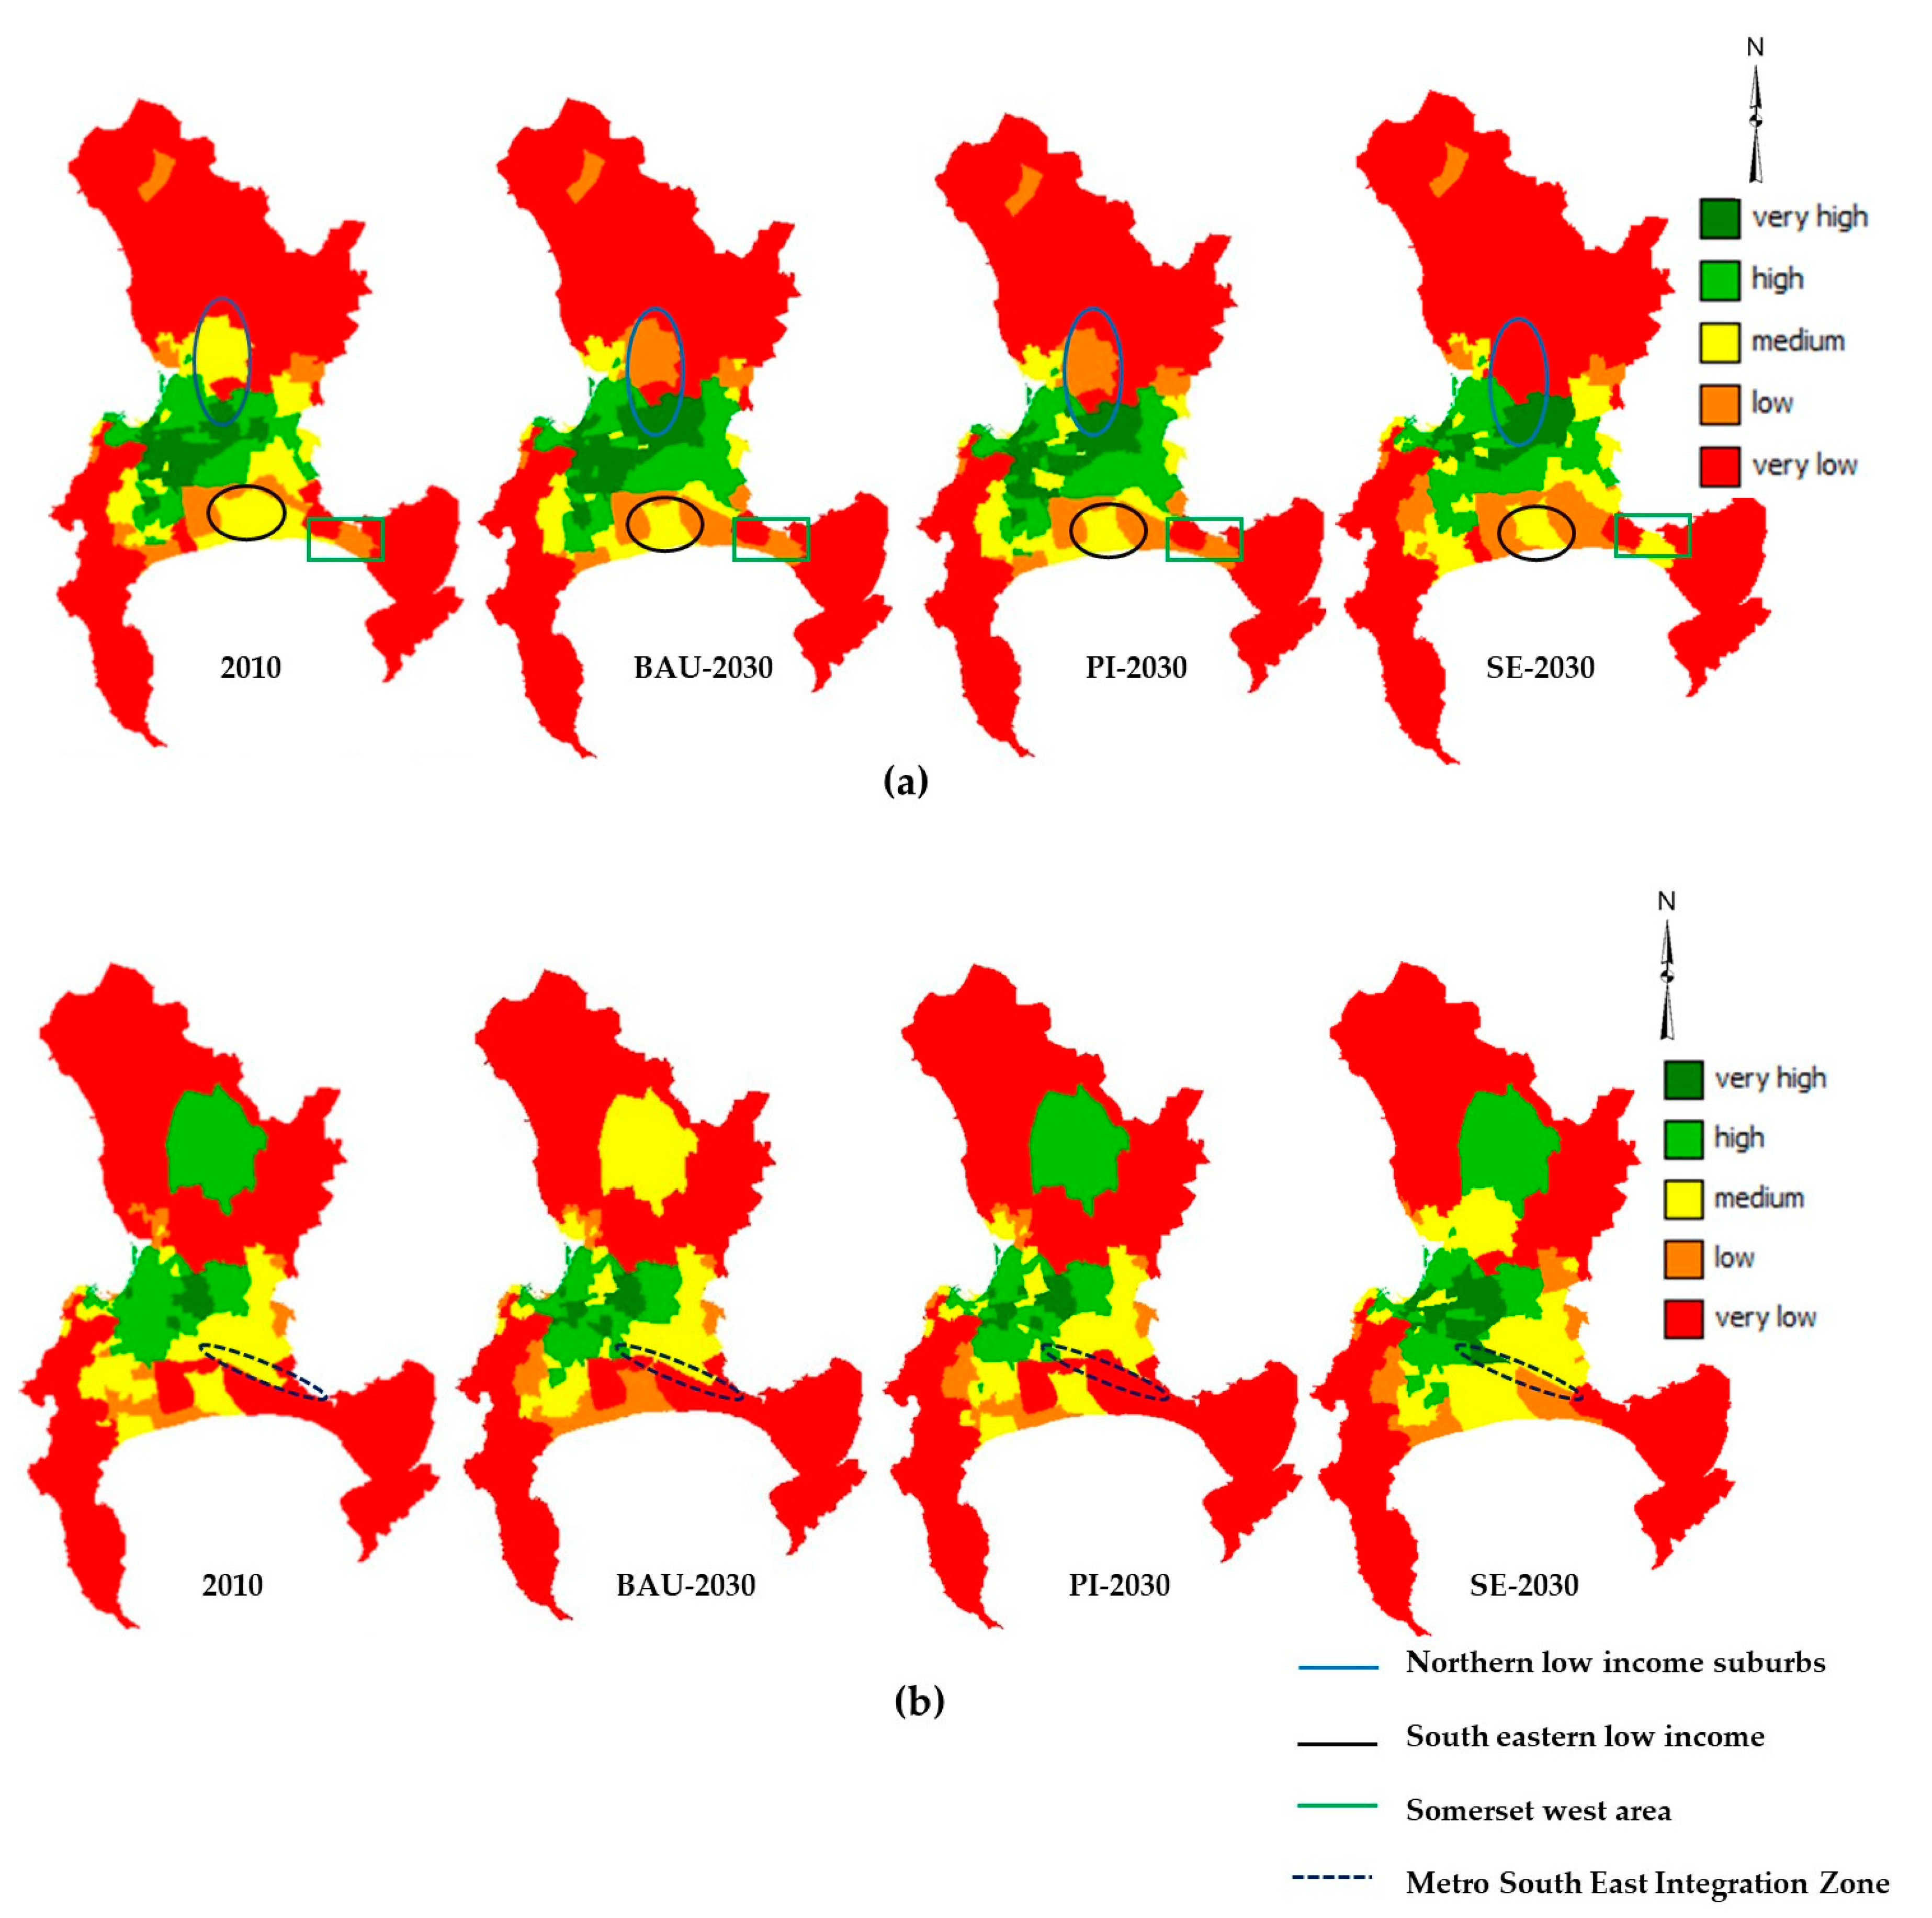
3.4.2. Change in Zonal Accessibility to Economic Centres for Low-Income and Informal Settlement Dwellers

Zonal accessibility can be used to evaluate how accessible different land uses are. The zonal accessibility trend for 2010 indicates that people residing in the south eastern suburbs (low-income) and informal settlement dwellers have poor access to manufacturing and trade and services. Figure 9 provides a comparison for zonal accessibility for manufacturing and trade and services respectively between 2010 and 2030 for all scenarios.
The results show a decrease in accessibility in 2030 to manufacturing services under the BAU scenario for low-income earners especially in the south eastern suburbs. In the northern low income-suburbs, there is also a loss in accessibility between 2010 and 2030. This indicates that manufacturing services are becoming less accessible. While there has been a decline in zonal accessibility in some parts of the north, there are sections of the northern suburbs that have experienced an increase in accessibility to manufacturing services. This can be linked to the growth in manufacturing services in this area as depicted in Figure 8. On the other hand, accessibility to manufacturing services in some sections of the eastern parts of the Cape Town city centre (such as Somerset West) has remained constant under the BAU and PI scenarios while there is a significant positive change under the SE scenario.
Although there is an emergence of new manufacturing services in the low-income south eastern suburbs under the PI scenario, this did not accrue into an increase in zonal accessibility. It is possible that the net gains in manufacturing activities were lower than the loss in manufacturing activities. Noteworthy is that the loss in accessibility to manufacturing services by the low-income cohort is greatest in the Cape flats under the SE scenario compared to other scenarios. This is expected as the urban development intervention failed to stimulate sufficient growth in manufacturing services along the MSEIZ corridor. However, under this scenario, an increase in zonal accessibility was observed in the eastern part of the city with the accessibility to manufacturing services increasing. Additionally, low-income and trade services were attracted to the MSEIZ under the SE scenario as these land use activities were actively stimulated along this corridor. This has resulted in an improvement in zonal accessibility in some low-income areas. While economic activities have been encouraged on the MSEIZ corridor in the SE scenario, the accessibility to economic activities within the Cape Town CBD has consistently remained high. This suggests that the city centre will continue to be a key activity hub in the future while remaining inaccessible to the low-income cohort.

3.4.3. Difference in Commuting Distance

Commuting distances between the different scenarios presented in Table 7 were compared to evaluate the potential for time and monetary savings.
The results show that the low income and informal settlement dwellers have longer commutes under the BAU. Interestingly with intervention, the same cohort has significantly shorter commuting distances under the SE and PI scenarios compared to the BAU scenario. This indicates that with urban development intervention, it is possible to reduce the commuting distances for the low-income cohort. At a disaggregate level, some low-income neighbourhoods have shorter commuting distances (below 1 km under the SE scenario which can be translated to better access to both manufacturing and trades and services. This can be attributed to land use development interventions in the SE scenario which resulted in mixed land uses mostly residential and economic activities. This is an encouraging finding as the low-income cohort is located closer to economic activities in this scenario, which is viewed as a viable solution in addressing issues of accessibility for this cohort.

4. Discussion

Antithetical views exist with regards to informal settlements, where on one hand, there is the notion that informal settlements can, potentially, uplift people out of poverty while on the other hand, they lock the low-income cohort into poverty [12,80]. Two key findings emerged from this research concerning informal settlements. First, in-situ upgrading was found to be a viable option in the city when informal settlements were located in areas with easy access to economic centres. This allows dwellers to access employment thus uplifting people out of poverty. Second, there was a high propensity for informal settlements to locate close to low-income residential areas, thus, suggesting a link between the socio-economic circumstances of informal settlement dwellers and low-income housing, which then drives the location of informal settlements in these areas. Although, this spatial location trend might allow for informal settlement dwellers to maintain their social networks, in-situ upgrading in these locations might not be a viable option as these areas are in the peripheries. Mostly, in-situ upgrading in these locations might perpetuate the relegation of the low-income cohort to the outskirts where there is limited access to economic activities and where transport becomes expensive. Further, this finding brought more questions on whether all the informal settlements simulated by the model are indeed informal settlements especially when informal settlements locate adjacent to low-income housing. This is a worrying finding given the prevalence of another form of informal housing structure that locates adjacent to low-income housing of the city. Further work is needed in this space. Perhaps the use of remote sensing might provide more information in the initial stages of land use data preparation to better categorise the different housing structures.
With regards to low-income residential areas, the results suggest that it is possible to locate low-income housing in accessible areas, but it is important to link this with policies to ensure that the benefits are “locked in”. This is especially important as it was observed that when low-income housing located close to “mature” primary and secondary arterials middle-income housing development grew in those areas too. While this is a positive outcome, due to the mixed developments that emerge, there are potential disadvantages linked to this outcome as low-income earners might be pushed out of these areas due to rent bidding by the middle income. Further, along the southern suburb’s corridor, characteristics of gentrification were observed where redevelopment of some areas led to the displacement of low-income housing. In that regard, it is essential that policies that address issues of social and economic exclusion do not result in dispossessing of another group especially those that are most vulnerable. Efforts to reduce social and economic exclusion by intensifying growth on the MSEIZ have been observed to potentially result in gains in the zonal accessibility for the low-income and informal settlement dwellers. An interpretation of these gains with regards to access to economic centres suggests that the loss of these gains in the long run is possible if this is not accompanied by appropriate land use and social policy.
Additionally, a reduction in commuting distances is a good indicator of an improvement in accessibility, however, there is a need to evaluate if the decrease is sufficient to allow for the use of non-motorised transport. There is a need to align this with transport infrastructure provision such that where walking is a viable option for the marginalised, the right infrastructure is also put in place to facility their mobility needs.

5. Conclusions

There is consensus within South African policy on the importance of redressing social and economic exclusion and residential informality especially in a context where cities continue to grow. However, the lack of tools to evaluate policies before implementation has resulted in slow progress in addressing urban issues. This research has introduced a dynamic land use and transport model to understand the urban dynamics due to land use and transport changes in Cape Town. While the use of integrated land use and transport decision tools is still growing in South Africa, this research has shown that decision support tools can be used to aid in the development of proactive approaches to land use and transport planning. The main aim of the research was to evaluate whether land use driven policies can be effective in addressing issues of social and economic exclusion and their related impact on accessibility. The use of the model to evaluate different policy alternatives has shown that these tools have the potential to provide invaluable lessons, which may aid in the development and implementation of land use policies. Further, with the use of spatial decision support tools, it is possible to obtain a better understanding of areas that might be affected by wider economic impacts of transport and land use changes due to infrastructural projects.
From the different urban development simulations that have been carried out in this research, the results show that the Cape Town CBD will continue to be a major activity hub. Given that, it might be essential to allocate land for some low-income housing units closer to the CBD to ensure that low-skill jobs in the city centre are accessible to the low-income cohort. However, this can only be a viable option if there is commitment in investing in low-income housing from both the private sector and government in locations that are developed and have access to transport infrastructure. However, a cross-pollination of knowledge and partnerships between government, private sector and civil groups is required such that policies pertaining to housing for the marginalised groups respond to the needs of this cohort. This is especially important given that most South African cities are still growing, and urbanisation has also been accompanied by informal settlements, hence, urban development should be structured such that it benefits all stakeholders in an economy.
In conclusion, this study has shown that spatial development has an impact on the economic benefits that accrue to different societal groups, and thus, it is essential to evaluate these impacts on different population cohorts. More importantly, given that planners have the ability to influence social policy, this is an opportunity for planners to leverage their influence on spatial development, in order to facilitate the social and economic processes that lead to prosperity especially for the most vulnerable groups of society.

Author Contributions

H.T.T.M. and M.Z. have made contributions in the development of ideas for this research since conception. H.T.T.M. wrote the article, calibrated and validated the model and also analysed the results. H.v.D. helped in the calibration and validation of the model and the development of the exploratory urban development strategies. M.Z. and H.v.D. edited and revised the article and provided a critical eye for the article. All authors have read and agreed to the published version of the manuscript.

Funding

The authors gratefully acknowledge funding from the National research foundation of South Africa, grant number: 106346 and the Carnegie Corporation of New York for funding this research.

Institutional Review Board Statement

Not applicable.

Informed Consent Statement

Not applicable.

Data Availability Statement

Publicly available datasets were analyzed in this study. This data can be found here: https://web1.capetown.gov.za/web1/OpenDataPortal/AllDatasets and https://www.datafirst.uct.ac.za/. To access the data from the datafirst website, you may require registering on the website.

Acknowledgments

We would like to thank the Research Institute of Knowledge Systems (RIKS) in the Netherlands for providing support and the software used in this research.

Conflicts of Interest

The authors declare no conflict of interest.

Appendix A

This appendix provides a summary of accessibility, for a detailed explanation please see RIKS (2011). The total accessibility is comprised of local, explicit, implicit and zonal accessibility.
Total accessibility is given by:
A f , c = { E A f , c                                                                                                     if     f ( c ) < L U I Z A f , z c × L A s , f , c   × I A f , c                                       otherwise                    
where:
  • E A f , c   = explicit accessibility at cell c for land use f if cell c is occupied by an impassable land use,
  • Z A f , z c   = zonal accessibility of land use f in the zone zc where cell c is located,
  • L A s , f , c     = local accessibility at cell c of land use f to link type s,
    f(c) = denotes the land use in cell c, and
  • I A f , c   = implicit accessibility at cell c for land use f.
  • L U 1 = set of impassable land uses

Appendix A.1. Local Accessibility

The local accessibility reflects the importance of a road network link for a land use to perform its function. Different land uses have different local accessibility needs; and this changes over distance and reflect the importance of a road network link for a land use to perform its function. Local accessibility in the land use model is thus given by:
LA s , f , c = { a s , f D s , c + a s , f i f   a s , f > 0 0 i f   a s , f = 0 1 | a s , f | D s , c + | a s , f | otherwise
where:
  • L A s , f , c = local accessibility of cell c for land use f to link type s,
  • D s , c = distance between cell c and the nearest link covered by link type s, and
  • a s , f = distance decay (a calibrated parameter) and represents the change in local accessibility given a land use type f and link type s over a unit of distance.

Appendix A.2. Implicit Accessibility

Implicit accessibility captures the notion that if an area has an urban land use, infrastructure is put in place to ensure that it is accessible. Hence, implicit accessibility makes a location more attractive in the future as the presence of road infrastructure provides an opportunity for future land use development. This is given by:
I A f , c = { U L f , i f   ( c ) L U u N U L f otherwise
where:
  • I A f , c =   implicit accessibility of cell c for land use f,
  • U L f ,   = implicit accessibility for land use f of a cell that has an urban land use,
  • N U L , f = implicit accessibility for land use f of a cell with a non-urban land use,
  • f(c) = denotes the land use in cell c,
  • L U u   = represent the set of urbanised land uses

Appendix A.3. Explicit Accessibility

Within urban areas, natural landscapes sometimes make it difficult to access surrounding function land uses. This also applies in the case of restricted areas, such as military airbases and airports where road networks do not cut across these land uses, these land uses are referred to as impassable land uses. Road networks around these areas are not easily accessible due to the presence of an impassable land use. However, this does not hinder the impassable land use from performing its function or to generate its activities, but the accessibility of the surrounding land uses is affected. Hence, explicit accessibility as a component of total accessibility provides an avenue through which this variation in accessibility can be expressed. It is represented as:
E A f , c = { I A f , c , i f   f ( c ) f 0 otherwise
where:
  • E A f , c   = explicit accessibility for land use f at cell,
  • f(c) = denotes the land use in cell c,
  • I A f , c   = implicit accessibility of cell c for land use f if it is impassable
The zonal accessibility forms the main linkage between land use and transport Zonal accessibility within METRONAMICA is defined as the ease of access to opportunities from a zone and how well the transport system and m facilitates this access [31,36], and is calculated by the transport model. Transport costs and the distribution of activities are the key factors that influence zonal accessibility and make up the generalised cost for travelling between and within zones. Zonal accessibility is given by:
Z A j , a a c t i v i t y   = z T A i a exp ( C a v g i j z o n e   . γ a a c t i v i t y   )  
where:
  • Z A j , a a c t i v i t y   = the zonal accessibility for activity a in zone j,
  • T A i a = is the percentage share of activity a in zone i .
  • γ a a c t i v i t y   = sensitivity to cost for activity a, and
  • C a v g ,   i j z o n e     = is the average transport costs between zone i and j
Different zones have varying zonal accessibility levels, therefore, there is a need to determine the maximum zonal accessibility for an activity. The maximum zonal accessibility for an activity is defined as:
Z A j , a a c t i v i t y   = m a x ( 1 ,   max z ( Z A j , a a c t i v i t y   ) )
This value ranges between 0 and 1 with 1 being the maximum zonal accessibility a land use activity can have. Some transport zones have mixed land use activities; in those instances, the zonal accessibility is represented as a function of all activity types or the weighted mean across all activity types and is given by Equation (A7) below:
Z A f , j f u n c t i o n = Z A m i n + ( 1 Z A m i n ) . a F A f , a . Z A j , a a c t i v i t y   Z A j , a a c t i v i t y  
where:
  • Z A f , j f u n c t i o n   = the weighted zonal accessibility for activity a in zone j,
  • F A f , a = is the function land use f for transport activity a and Z A m i n represents the minimum zonal accessibility.

References

  1. UN. The Sustainable Development Goals Report; United Nations: New York, NY, USA, 2018. [Google Scholar]
  2. UN. World Urbanisation Prospects: The 2014 Revision; United Nations: New York, NY, USA, 2015. [Google Scholar]
  3. Jones, P. Formalizing the informal: Understanding the position of informal settlements and slums in sustainable urbanization policies and strategies in Bandung, Indonesia. Sustainability 2017, 9, 1436. [Google Scholar] [CrossRef] [Green Version]
  4. Dowall, D.E. Comparing Karachi’s informal and formal housing delivery systems. Cities 1991, 8, 217–227. [Google Scholar] [CrossRef]
  5. Baross, P. Sequencing land development: The price implications of legal and illegal settlement growth. Transform. Land Supply Syst. Third World Cities 1990, 57, 64–65. [Google Scholar]
  6. Malavolti, C. Towards Resilience: Informality and affordable housing in the inner city of Johannesburg. In Urban Solutions: Metropolitan Approaches, Innovation in Urban Water and Sanitation, and Inclusive Smart Cities; Wilson Centre: Washington, DC, USA, 2016; pp. 72–89. ISBN 9781938027529. [Google Scholar]
  7. Ward, P. Self-help Housing: A Critique. In The Wiley-Blackwell Encyclopedia of Urban and Regional Studies; Alexandrine Press, Mansell Publishing Ltd.: London, UK, 1982; pp. 1–6. [Google Scholar]
  8. Naik, M. Informal Rental Housing Typologies and Experiences of Low-income Migrant Renters in Gurgaon, India. Environ. Urban. Asia 2015, 6, 154–175. [Google Scholar] [CrossRef]
  9. Hermanson, J.A. Slums, Informal Settlements and Inclusive Growth in Cities: Examples from Morocco and Colombia; IHC Global Coalition for Inclusive Housing and Sustainable Cities: Washington, DC, USA, 2016. [Google Scholar]
  10. Roy, A. Why India cannot plan its cities: Informality, insurgence and the idiom of urbanization. Plan. Theory 2009, 8, 76–87. [Google Scholar] [CrossRef]
  11. Roy, A. Urban Informality. J. Am. Plan. Assoc. 2005, 71, 147–158. [Google Scholar] [CrossRef]
  12. Turok, I. Informal Settlements: Poverty Traps or Ladders to Work? 2015. Available online: https://www.researchgate.net/publication/283583113_Informal_settlements_poverty_traps_or_ladders_to_work (accessed on 6 January 2021).
  13. Misselhorn, M. Position Paper on Informal Settlements Upgrading: Part of a Strategy for the Second Economy for the Office of the South African Presidency; Urban Landmark: Cape Town, South Africa, 2008. [Google Scholar]
  14. DoH. “Breaking New Ground” a Comprehensive Plan for the Development of Sustainable Human Settlements; Department of Housing: Pretoria, South Africa, 2004.
  15. Fitchett, A. Adaptive Co-management in the Context of Informal Settlements. Urban. Forum 2014, 25, 355–374. [Google Scholar] [CrossRef]
  16. Bradlow, B.; Bolnick, J.; Shearing, C. Housing, institutions, money: The failures and promise of human settlements policy and practice in South Africa. Environ. Urban. 2011, 23, 267–275. [Google Scholar] [CrossRef]
  17. Brown-Luthango, M.; Reyes, E.; Gubevu, M. Informal settlement upgrading and safety: Experiences from Cape Town, South Africa. J. Hous. Built Environ. 2017, 32, 471–493. [Google Scholar] [CrossRef]
  18. HDA. Participatory Action Planning for Informal Settlement Upgrading; Housing Development Agency: Johannesburg, South Africa, 2015. [Google Scholar]
  19. Massey, R. Integral Theory: A Tool for Mapping and Understanding Conflicting Governmentalities in the Upgrading of Cape Town’s Informal Settlements. Urban. Forum 2015, 26, 303–319. [Google Scholar] [CrossRef]
  20. Del Mistro, R.; Hensher, D.A. Upgrading Informal Settlements in South Africa: Policy, Rhetoric and what Residents really Value. Hous. Stud. 2009, 24, 333–354. [Google Scholar] [CrossRef]
  21. Massey, R.T. The Effect of Informal Settlement Upgrading on Women’s Social Networks: Layout Versus Location. Urban. Forum 2017, 28, 205–217. [Google Scholar] [CrossRef]
  22. RSA. White Paper on Reconstruction and Development; Government of South Africa: Johannesburg, South Africa, 1994; Volume 353, pp. 1–82.
  23. DoH. Urban Development Framework; Department of Housing: Pretoria, South Africa, 1997.
  24. RSA. Integrated Urban. Developments Framework; Government of South Africa: Pretoria, South Africa, 2016.
  25. Gerber, J. R10bn Budget Slash for Human Settlements Department. Available online: https://www.news24.com/news24/SouthAfrica/News/r10bn-budget-slash-for-human-settlements-department-20180510 (accessed on 6 January 2021).
  26. Turok, I. Persistant polarisation post apartheid? Progress towards urban integration in Cape Town. Urban. Stud. 2002, 38, 2349–2377. [Google Scholar] [CrossRef]
  27. Palmer, I.; Brown-Luthango, M.; Berrisford, S. The Economic and Fiscal Costs of Inefficient Land Use Patterns in South Africa; Finance and Fiscal Commission, World Bank Group: Washingtion, DC, USA, 2011. [Google Scholar]
  28. DoT. White Paper on National Transport Policy; Governmnet of South Africa: Pretoria, South Africa, 1996.
  29. DoT. The National Land Transport Strategic Framework (NLTSF); Government of South Africa: Pretoria, South Africa, 2009.
  30. Tamuka Moyo, H.; Zuidgeest, M.H. Analyzing the temporal location of employment centers relative to residential areas in Cape Town: A spatial metrics approach. J. Transp. Land Use 2018, 11, 519–540. [Google Scholar] [CrossRef]
  31. RIKS. Metronamica Documentation; Research Institute of Knowledge Systems: Maastricht, The Netherlands, 2011. [Google Scholar]
  32. DoH. Strategic Plan 2015–2020; Government of South Africa: Pretoria, South Africa, 2015.
  33. CoCT. Integrated Human Settlements Five-Year Strategic Plan. July 2012–June 2017; CoCT City of Cape Town: Cape Town, South Africa, 2013.
  34. Turok, I.; Watson, V. Divergent development in South African cities: Strategic challenges facing Cape Town. Urban. Forum 2001, 12, 119–138. [Google Scholar] [CrossRef]
  35. Acheampong, R.A.; Silva, E. Land use–transport interaction modeling: A review of the literature and future research directions. J. Transp. Land Use 2015, 11–38. [Google Scholar] [CrossRef]
  36. Aljoufie, M.; Zuidgeest, M.; Brussel, M.; van Vliet, J.; van Maarseveen, M. A cellular automata-based land use and transport interaction model applied to Jeddah, Saudi Arabia. Landsc. Urban. Plan. 2013, 112, 89–99. [Google Scholar] [CrossRef]
  37. Wegener, M.; Fuerst, F. Land-Use Transport Interaction: State of the Art. SSRN Electron. J. 2011. [Google Scholar] [CrossRef]
  38. Waddell, P. Integrated land use and transportation planning and modelling: Addressing challenges in research and practice. Transp. Rev. 2011, 31, 209–229. [Google Scholar] [CrossRef]
  39. Echenique, M.H.; Flowerdew, A.D.J.; Hunt, J.D.; Mayo, T.R.; Skidmore, I.J.; Simmonds, D.C. The Meplan models of bilbao, Leeds and Dortmund: Foreign summaries. Transp. Rev. 1990, 10, 309–322. [Google Scholar] [CrossRef]
  40. Zhong, M.; Hunt, J.D.; Abraham, J.E. Design and Development of a Statewide Land Use Transport Model for Alberta. J. Transp. Syst. Eng. Inf. Technol. 2007, 7, 79–89. [Google Scholar] [CrossRef]
  41. Clay, M.J. Developing an integrated land-use/transportation model for small to medium-sized cities: Case study of Montgomery, Alabama. Transp. Plan. Technol. 2010, 33, 679–693. [Google Scholar] [CrossRef] [Green Version]
  42. Harvey, E.P.; Cardwell, R.C.; McDonald, G.W.; van Delden, H.; Vanhout, R.; Smith, N.J.; Joon-hwan, K.; Forgie, V.E.; van den Belt, M. Developing integrated models by coupling together existing models; land use, economics, demographics and transport in Wellington, New Zealand. Comput. Environ. Urban. Syst. 2019, 74, 100–113. [Google Scholar] [CrossRef]
  43. Shahumyan, H.; Convery, S.; Casey, E. Exploring land use-transport interactions in the Greater Dublin Region using the MOLAND model. In Proceedings of the 1st Annual Conference of the Irish Transport Research Network, Dublin, Ireland, 30 August–1 September 2010. [Google Scholar]
  44. Barredo, J.I.; Demicheli, L.; Lavalle, C.; Kasanko, M.; McCormick, N. Modelling future urban scenarios in developing countries: An application case study in Lagos, Nigeria. Environ. Plan. B Plan. Des. 2004, 31, 65–84. [Google Scholar] [CrossRef] [Green Version]
  45. Guzman, L.A.; Escobar, F.; Peña, J.; Cardona, R. A cellular automata-based land-use model as an integrated spatial decision support system for urban planning in developing cities: The case of the Bogotá region. Land Use Policy 2020, 92, 104445. [Google Scholar] [CrossRef]
  46. Aljoufie, M.; Brussel, M.; Zuidgeest, M.; van Delden, H.; van Maarseveen, M. Integrated analysis of land-use and transport policy interventions. Transp. Plan. Technol. 2016, 39, 329–357. [Google Scholar] [CrossRef]
  47. Ustaoglu, E.; Williams, B.; Petrov, L.O.; Shahumyan, H.; van Delden, H. Developing and assessing alternative land-use scenarios from the MOLAND Model: A scenario-based impact analysis approach for the evaluation of rapid rail provisions and urban development in the Greater Dublin Region. Sustainability 2017, 10, 61. [Google Scholar] [CrossRef] [Green Version]
  48. White, R.; Engelen, G. A Calibration Procedure for Constrained Large Neighbourhood Cellular Automata based Land Use Models. In Proceedings of the 13th European Colloquium on Theoretical and Quantitative Geography, Lucca, Italy, 5–9 September 2003; pp. 11–17. [Google Scholar]
  49. van Delden, H.; Hurkens, J. A generic Integrated Spatial Decision Support System for urban and regional planning. In Proceedings of the 19th International Congress on Modelling and Simulation, Perth, Australia, 12–16 December 2011. [Google Scholar]
  50. White, R.; Engelen, G. Cellular automata and fractal urban form: A cellular modelling approach to the evolution of urban land-use patterns. Environ. Plan. A 1993, 25, 1175–1199. [Google Scholar] [CrossRef] [Green Version]
  51. White, R.; Engelen, G.; Uljee, I. The use of constrained cellular automata for high-resolution modelling of urban land-use dynamics. Environ. Plan. B Plan. Des. 1997, 24, 323–343. [Google Scholar] [CrossRef]
  52. De Dios Ortuzar, J.; Willumsen, L.G. Modelling Transport, 4th ed.; John Wiley & Sons Ltd.: Chichester, UK, 2011; ISBN 9780470760390. [Google Scholar]
  53. Aljoufie, M.; Zuidgeest, M.; Brussel, M.; van Maarseveen, M. Urban growth and transport: Understanding the spatial temporal relationship. WIT Trans. Built Environ. 2011, 116, 315–328. [Google Scholar] [CrossRef] [Green Version]
  54. Hitge, G.; Van der Schuren, M. Comparison of travel time between private car and public transport in Cape Town. J. S. Afr. Inst. Civ. Eng. 2015, 57, 35–43. [Google Scholar] [CrossRef]
  55. STATSSA. NHTS Provincial Report Western Cape Profile; Statistics South Africa: Pretoria, South Africa, 2014; ISBN 9780621431414.
  56. Turok, I.; Borel-Saladin, J. Is urbanisation in South Africa on a sustainable trajectory? Dev. S. Afr. 2014, 31, 675–691. [Google Scholar] [CrossRef]
  57. STATSSA. October Household Survey; Statistics South Africa: Pretoria, South Africa, 1996.
  58. STATSSA. October Household Survey; Statistics South Africa: Pretoria, South Africa, 1997.
  59. STATSSA. South Africa Population Census; Statistics South Africa: Pretoria, South Africa, 1996.
  60. STATSSA. October Household Survey; Statistics South Africa: Pretoria, South Africa, 1995.
  61. DoT. Key Results of the National Household Travel Survey: The First South. African National Household Travel Survey 2003; Statistics South Africa: Pretoria, South Africa, 2003.
  62. Abraham, J.E.; Hunt, J.D. Parameter Estimation Strategies for Large Scale Urban Models. Transp. Res. Board Annu. Meet. 2000, 1722, 9–16. [Google Scholar] [CrossRef]
  63. van Vliet, J.; Hagen-Zanker, A.; Hurkens, J.; van Delden, H. A fuzzy set approach to assess the predictive accuracy of land use simulations. Ecol. Model. 2013, 261–262, 32–42. [Google Scholar] [CrossRef]
  64. Brown, D.G.; Page, S.; Riolo, R.; Zellner, M.; Rand, W. Path dependence and the validation of agent-based spatial models of land use. Int. J. Geogr. Inf. Sci. 2005, 19, 153–174. [Google Scholar] [CrossRef] [Green Version]
  65. van Vliet, J.; Bregt, A.K.; Hagen-Zanker, A. Revisiting Kappa to account for change in the accuracy assessment of land-use change models. Ecol. Model. 2011, 222, 1367–1375. [Google Scholar] [CrossRef]
  66. Newland, C.P.; Zecchin, A.C.; Maier, H.R.; Newman, P.; Delden, H. Van Empirically derived method and software for semi-automatic calibration of Cellular Automata land-use models. Environ. Model. Softw. 2018, 108, 208–239. [Google Scholar] [CrossRef]
  67. van Vliet, J. Calibration and Validation of Land-Use Models; Wageningen University: Wageningen, The Netherlands, 2013. [Google Scholar]
  68. Clarke, K.C.; Couclelis, H.; Clarke, K.C. The role of spatial metrics in the analysis and modeling of urban land use change. Comput. Environ. Urban. Syst. 2005, 29, 369–399. [Google Scholar] [CrossRef]
  69. Hewitt, R.; Díaz-Pacheco, J. Stable models for metastable systems? Lessons from sensitivity analysis of a Cellular Automata urban land use model. Comput. Environ. Urban. Syst. 2017, 62, 113–124. [Google Scholar] [CrossRef]
  70. Wickramasuriya, R.C.; Bregt, A.K.; van Delden, H.; Hagen-Zanker, A. The dynamics of shifting cultivation captured in an extended Constrained Cellular Automata land use model. Ecol. Model. 2009, 220, 2302–2309. [Google Scholar] [CrossRef]
  71. Hagen-Zanker, A.; Lajoie, G. Neutral models of landscape change as benchmarks in the assessment of model performance. Landsc. Urban. Plan. 2008, 86, 284–296. [Google Scholar] [CrossRef] [Green Version]
  72. TDA. 2013–2018 Comprehensive Integrated Transport Plan; TDA City of Cape Town: Cape Town, South Africa, 2012.
  73. TDA. Comprehensive Integrated Transport Plan 2017–2022; TDA City of Cape Town: Cape Town, South Africa, 2017.
  74. Pontius, R.; Huffaker, D.; Denman, K. Useful techniques of validation for spatially explicit land-change models. Ecol. Model. 2004, 179, 445–461. [Google Scholar] [CrossRef]
  75. CoCT. Integrated Development Plan 2017–2022; CoCT City of Cape Town: Cape Town, South Africa, 2017.
  76. Haase, D.; Schwarz, N. Simulation models on human-nature interactions in urban landscapes: A review including spatial economics, system dynamics, cellular automata and agent-based approaches. Living Rev. Landsc. Res. 2009, 3. [Google Scholar] [CrossRef]
  77. TDA. Built Environment Performance Plan. 2018/19; TDA City of Cape Town: Cape Town, South Africa, 2018.
  78. Herron, B. City Committed to Creating an Inclusive Cape Town. Available online: http://www.housinginsouthernafrica.co.za/opinionistas/225-city-committed-to-creating-an-inclusive-cape-town (accessed on 25 September 2018).
  79. McGaffin, R. Housing in Cape Town in 2018: A Draft Discussion Document; Urban Real Estate Research Unit: University of Cape Town, Cape Town, South Africa, 2018. [Google Scholar]
  80. Turok, I.; Borel-Saladin, J. Backyard shacks, informality and the urban housing crisis in South Africa: Stopgap or prototype solution? Hous. Stud. 2016, 31, 384–409. [Google Scholar] [CrossRef]
Figure 1. Location of Cape Town relative to South Africa.
Urbansci 05 00010 g001
Figure 2. Land use maps for (a) 1995 (b) 2005 (c) 2010 that were used in the model calibration and validation.
Urbansci 05 00010 g002
Figure 3. (a) The Traffic Analysis Zone (TAZ) boundaries; (b) the road network and link types used in the Cape Town model.
Urbansci 05 00010 g003
Figure 4. Metro South East Integration Zone in Cape Town (Source City of Cape Town).
Urbansci 05 00010 g004
Figure 5. Metro South East Integration Zone; (a) MSEIZ-2030 under the SE scenario; (b) MSEIZ in 2005.
Urbansci 05 00010 g005
Figure 6. Characterisation of the Cape Town landscape using; (a) patch density; (b) fractal dimension.
Urbansci 05 00010 g006
Figure 7. Metro South East Integration Zone; (a) MSEIZ under the PI-2030 scenario; (b) MSEIZ in 2005.
Urbansci 05 00010 g007
Figure 8. Location of informal settlements and low-income residential areas relative to the CBD and other centres of economic activities under the BAU scenario.
Urbansci 05 00010 g008
Figure 9. Comparison of the Zonal accessibility for; (a) manufacturing; (b) trade and services in 2030 under different scenarios as well as 2010.
Urbansci 05 00010 g009
Table 1. Land use classes modelled in the Cape Town Model.
VacantFunctionsFeatures
  • Agricultural and animal husbandry services
  • Potential commercial zone
  • Potential resident zone
  • Vacant undeveloped land
  • High-income residential
  • Middle-income residential
  • Low-income residential
  • Informal housing
  • Manufacturing services
  • Trade and services
  • Education and Campuses
  • Health services
  • Recreational services
  • Religious, cultural activities
  • Government/Military facilities
  • Utilities and infrastructure
  • Nature reserve
  • Airport
Table 2. Results from the calibration and validation of the land use model.
Fuzzy KappaCape Town Model (Data 2005 vs. Simulated 2005)Benchmark Random Constraint Match
High-income residential0.8010.771
Middle-income residential0.9070.874
Low-income residential0.8850.858
Informal housing0.0580.023
Manufacturing services0.8730.806
Trade services0.5890.379
Table 3. Kappa Simulation results for the calibration and validation period.
Kappa SimulationCape Town Model Calibration (Real 2005 vs. Simulated 2005)Cape Town Model Validation (Real 2010 vs. Simulated 2010)
High income residential0.1040.136
Middle income residential0.2120.163
Low income residential0.2520.143
Informal housing0.0050.002
Manufacturing services0.5240.119
Trade services0.2340.284
Table 4. Results from evaluating the process accuracy of the model.
Land use MapsFractal Dimensions
Real map 19951.033
Real map 20051.032
Simulated map 20051.027
Real map 20101.031
Simulated map 20101.027
RCM (Benchmark)1.266
Table 5. Calibration and Validation results for the integrated land use and transport model.
Integrated Model
Calibration Period
Integrated Model
Validation Period
Random Constraint Match (Benchmark)
200520102010
Kappa0.9340.8490.797
Kappa Simulation0.6880.293N/A
Fuzzy Kappa0.9500.8810.840
Fuzzy Kappa Simulation0.7040.325N/A
Fractal dimension1.0231.0271.266
Table 6. Assumptions made in developing the land use development scenarios.
ScenariosPopulationSpatial Development
Suggested policy interventionsBusiness as usual (BAU)
  • Assumes that the current population trends will continue.
  • Assumes that the current spatial trends to continue.
  • Continued construction of low-income housing in the peripheries
  • Preference of centres of economic activities to locate in the affluent suburbs.
Proliferation of informal settlements (PI)
  • Assumes that the current population trends will continue.
  • Assumes that the current spatial trends to continue.
  • In situ upgrading of the informal settlements to low income residential
  • Revival of the inner city by stimulating mixed land uses
  • 3% annual growth in informal settlements.
Redressing social exclusion (SE)
  • Assumes that the current population trends will continue.
  • Construction of about 1% of new low-income housing on the Metro South East corridor and close to transport infrastructure.
  • In-situ upgrading of the informal settlements to low income residential
  • New centres of economic activities locate along the Metro South East corridor.
Table 7. Comparison of commuting distances between scenarios.
Urban Development ScenarioLand UseDistance to Centres of Economic Activities (km)
Business-as-usual (BAU)Low-income residential
Informal settlements
13.4
12.0
Proliferation of Informal Settlements (PI)Low-income residential
Informal settlements
6.9
10.0
Social Exclusion (SE)Low-income residential
Informal settlements
7.0
7.6
Publisher’s Note: MDPI stays neutral with regard to jurisdictional claims in published maps and institutional affiliations.

