Article

Contemporary Urban Expansion in the First Fastest Growing Metropolitan Region of China: A Multicity Study in the Pearl River Delta Urban Agglomeration from 1980 to 2015

Key Laboratory for Earth Surface Processes of the Ministry of Education, College of Urban and Environmental Sciences, Peking University, Beijing 100871, China
*
Author to whom correspondence should be addressed.
Submission received: 30 November 2020 / Revised: 16 January 2021 / Accepted: 18 January 2021 / Published: 21 January 2021

Abstract

:
Contemporary urbanization in the Pearl River Delta (PRD) Urban Agglomeration is the epitome of China’s urbanization process as the PRD is the first fastest growing metropolitan region of China. Here, we mapped and quantified the spatiotemporal dynamics of urban expansion for seven major cities in the PRD between 1980 and 2015, using remotely sensed data integrated with landscape metrics, urban growth form, and rank clocks. Results showed that rapid land urbanization occurred in all the seven cities since the execution of reform and opening up, with the annual increase rate ranging from 8.1% to 11.3% among cities, suggesting a relatively equal level of urbanization within the PRD. Socioeconomic drivers underlying urban expansion in Guangzhou, Shenzhen, and Zhuhai can be characterized as “top–down” mechanisms led by the municipal government, while those in Foshan, Jiangmen, Dongguan, and Zhongshan are “bottom–up” ones from low–level administrative organizations. The trajectory of urban expansion in Shenzhen conformed to the diffusion–coalescence urban growth hypothesis in terms of temporal evolution of landscape metrics and urban growth types. This is related to the fact that Shenzhen, the first special economic zone established by the Chinese government, was the first mover of urbanization in China and functioned under the umbrella of a robust socialist market economy relative to a highly centralized planned economy for other cities. The changes of Shenzhen in rank order in terms of both urban population and urbanization area were the largest, exemplifying its evolution from a small fishing village to a metropolis. Furthermore, we found that moving up in the rank order in terms of land use efficiency of wealth creation over time for all cities was accompanied with rank clocking up of population per area (crowd). How to balance trade–offs between the benefits and costs of urbanization is the challenge faced by the urban agglomeration.

1. Introduction

Over the past several decades, we have witnessed the accelerating urbanization process, with more than half of the world’s population now living in cities [1]. This unprecedented urbanization has the features of dramatic urban population growth and land transformation from other types to urban land [2]. From 1970 to 2000, the area of urban land expanded by 58,000 km2, increasing twice as much as the rate of urban population growth [3]. It is predicted that in the future the increase in urban land around the world will mainly be in developing countries such as China and India [4]. Land urbanization has various impacts on the natural environment and human beings [2]. Metropolitan regions, especially in developing countries [5], are facing the great challenge of managing trade–offs between fast urbanization and exacerbated environmental problems such as urban heat island [6,7], atmospheric pollution [8], and biodiversity loss [9]. In China, astonishing land urbanization has happened over the past four decades [10]. As one of the most important growth engines of China, the Pearl River Delta has undergone rapid urbanization in parallel with its economic prosperity since the execution of the “reform and opening up” policy, attracting much attention from the scientific community [11,12].
Longitudinal dynamics and horizontal patterns of urban expansion are both indispensable aspects in studies about the land urbanization process of urban agglomeration [13]. Over past few decades, the increasing availability of satellite remote sensing data has enabled quantitative analysis spatially and temporally across large geographic areas on the patterns of urban land dynamics [14]. Therefore, impervious surface areas and areal extent have been emerging efficient and alternative measures to understand the characteristics of urbanization [15,16]. As an indispensable component of urbanization, urban land growth has been recognized as a reference for developing urban structure planning and management strategies [17,18]. Gong et al. [19] used a Dyna–CLUE model to explore the urban growth mode of Guangzhou during 1990–2020 and found it has a large scale and continuing encroachment on agricultural land and forest. Chen et al. [20] found the favorable driving effects of industrial structure and government policies in urban sustainable development in 1990–2008 through comparing Shenzhen and Dongguan. Taking Guangzhou and Phoenix as the case cities of developing and developed countries, Tian and Wu [21] made a comparative analysis of their rapid urban development and highlighted the influence of physical conditions and land use policies on urbanization patterns. Haas and Ban [22] compared the magnitude and speed of urban expansion in the Beijing–Tianjin–Hebei region, Yangtze River Delta, and Pearl River Delta from 1990 to 2010. Most of these previous studies discussed urban expansion of one or two major cities within the Pearl River Delta (PRD) Urban Agglomeration, with much less intraregion or intracity quantitative analysis. In particular, a long–term and spatially explicit comparative study in the PRD with emphasis on the quantitative properties of the urban expansion form, city spatial–temporal evolution theory, and especially the urban land structure is still lacking. A sophisticated understanding of cities could provide further insight into the urbanization process and support development planning and management strategies to achieve sustainable development in metropolitan regions [23,24].
Here, through multisource remote sensing data with patch analysis and landscape metrics analysis, we explored the dynamics in the dimension of time and space of the physical land urbanization in seven major cities of the PRD from 1980 to 2015. Specifically, the aims of this study are to (1) dynamically delineate the spatial and temporal changes of urban land; (2) quantify and compare the similarities and differences of magnitudes, rates, typologies, and forms of urban expansion in seven cities; (3) track urban growth trajectory by testing the diffusion–coalescence urban growth hypothesis and rank clocks. Such comparative studies and portfolios from various biophysical, political and economic contexts are the fundamental basis for the development of general urbanization theories to support a sustainable urban future.

2. Materials and Methods
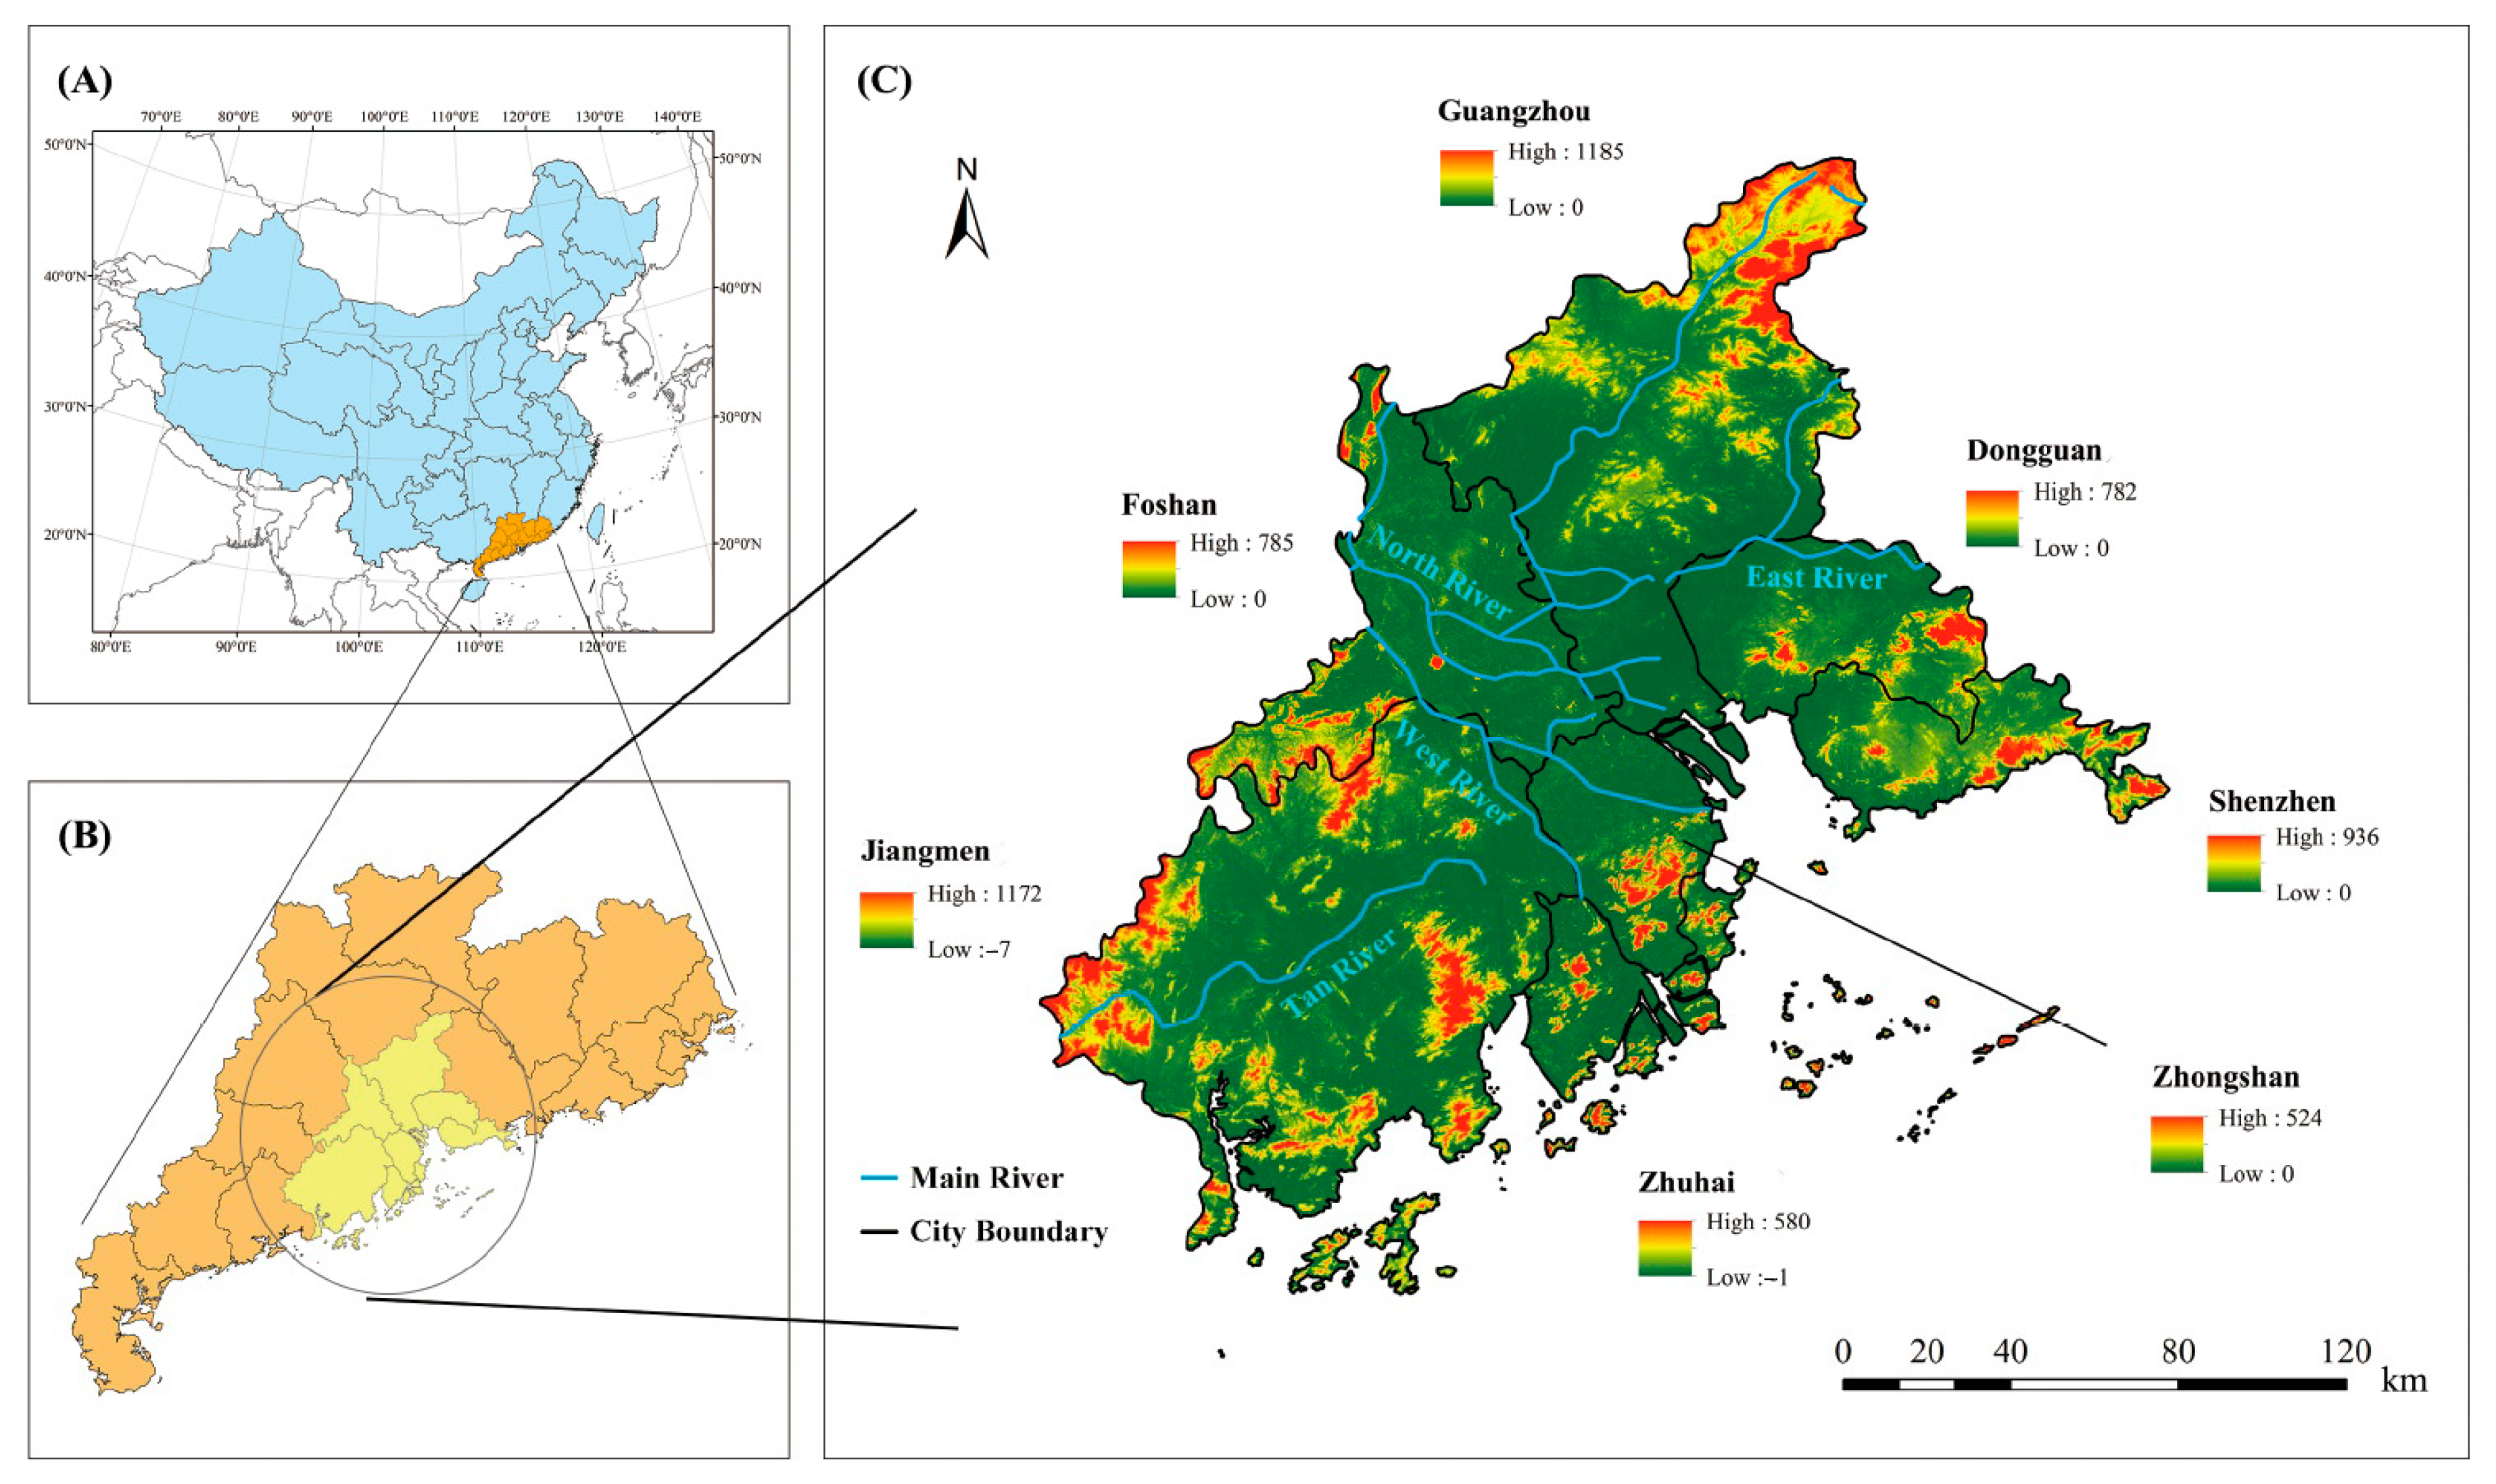
2.1. Study Area

Located in the south–central part of Guangdong, China, the Pearl River Delta is densely covered with rivers, and is the gate of the Pearl River to the South China Sea. In the concept of urban agglomeration, the PRD covers Guangzhou, Shenzhen, Foshan, Dongguan, Huizhou, Zhongshan, Zhuhai, Jiangmen, and Zhaoqing (Urban Agglomeration in the Pearl River Delta Yearbook 2016). Its total area is about 54.8 thousand km2, with a total resident population of about 71.9 million and total GDP accounting for 9.1% of China in 2016. Now, the PRD is confronted with industrial restructuring [25] and environmental problems [11,26]. At the same time, to build the Greater Pearl River Delta Urban Agglomeration is also urgent [27]. Across the PRD, the basic information for Guangzhou, Shenzhen, Foshan, Dongguan, Zhongshan, Zhuhai, and Jiangmen (Figure 1) has been listed in Table 1.

2.2. Remote Sensing Data and Data Processing

The original terrestrial imagery data were acquired from NASA (https://earthexplorer.usgs.gov/). We chose the satellite images of the Multispectral Scanner (MSS, bands 1–4, resolution 60 m), Landsat Thematic Mapper (TM, bands 1–5 and 7, resolution 30 m), Enhanced Thematic Mapper (ETM+, bands 1–5 and 7, resolution 30 m), and Operational Land Imager (OLI, bands 1–6, resolution 30 m) with little cloud, which represented seven time points including 1980, 1990, 1995, 2000, 2005, 2010, and 2015. The detailed information of these images used in the study was listed in Table 2. We used ERDAS Imagine 2015 and ArcGIS 10.3 software to process downloaded images. Then the Maximum Likelihood Classification (MLC) method was applied to map land cover into five types—namely, urban land, arable land, vegetation, bare land, and water body. The definition of urban land was the same criteria as our previous work, in which urban land was regarded as all impervious surfaces and built environments created by humans, such as roads and buildings [10]. Furthermore, all land cover types except urban land were merged as the main concern was the dynamics of urban land. The accuracy analysis of the classified products was based on the Kappa coefficient, using the high–resolution image from Google Earth as a reference. Since there were no high–resolution images in some of the study areas before 2014 in Google Earth, we supposed that the transformation process to urban land was irreversible, and carried out the validation of classification results through the images in 2015. In this method, we calculated the Kappa coefficients of (1) the classification results of 2015, and (2) the classification results before 2015 where land cover remained unchanged from 1980 to 2015. As a result (Table 3), all the Kappa coefficients were larger than 0.80, which was adequate for the assessment of land cover classification [28].

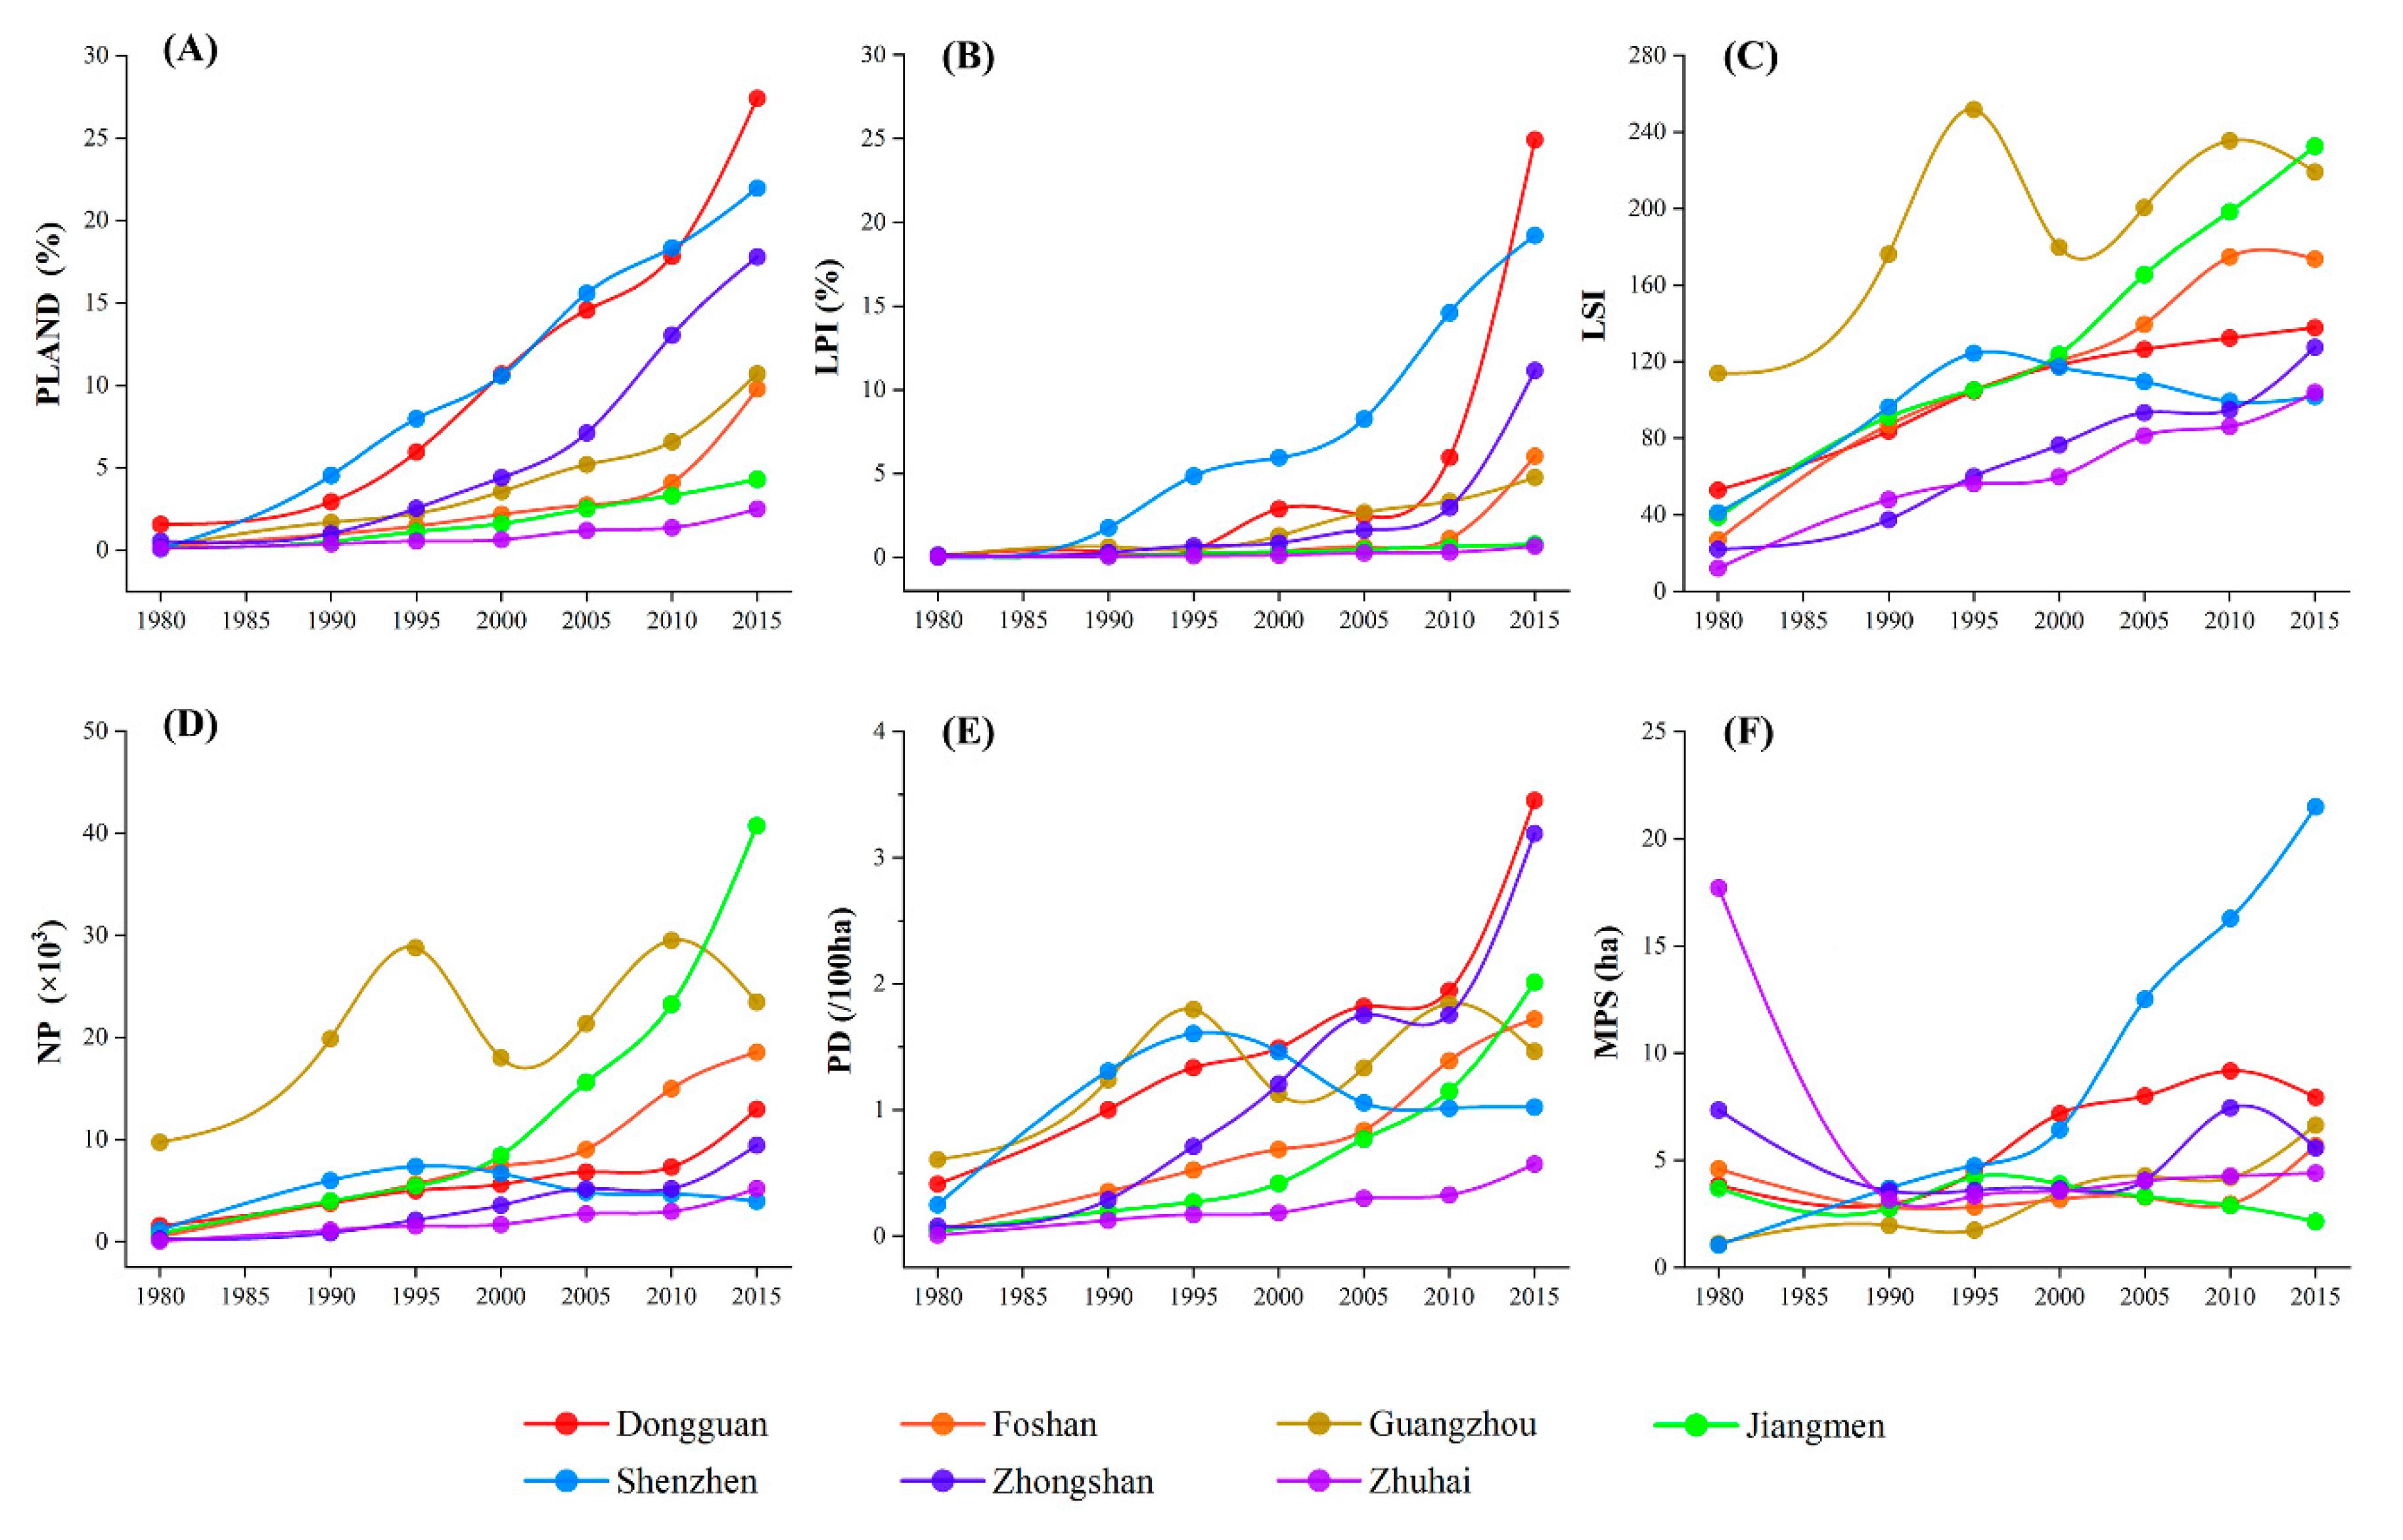
2.3. Landscape Metric

Landscape metrics can reflect the features of urban land patches and is helpful to identify the dynamics of urban evolution process [29]. A patch is defined as a relatively homogeneous area that differs from its surroundings [30]. Therefore, as shown in Table 4, six metrics were selected including the Percentage of Landscape (PLAND), Largest Patch Index (LPI), Landscape Shape Index (LSI), Number of Patches (NP), Patch Density (PD), and Mean Patch Size (MPS). Fragstat 4.2 was used to perform the calculation of metrics.

2.4. The Average Annual Growth of Urban Land

To describe the scale of land urbanization, two indicators were calculated—namely, annual growth and annual increase rate. The annual growth directly indicates the absolute magnitude of urban land expansion, and the latter excludes influence from the city’s overall size, reflecting the speed of urban expansion [32]. The two indicators were computed through the following formula, representing the average growth of urban land over a period of time:
A G = U e n d U s t a r t d
A I R = 100 % × ( U e n d U s t a r t d 1 )
A G (km2 per year) is annual growth and A I R (%) is the annual increase rate. U s t a r t and U e n d represent the initial area and the final area of urban land in a certain period, and d refers to the length of time period.

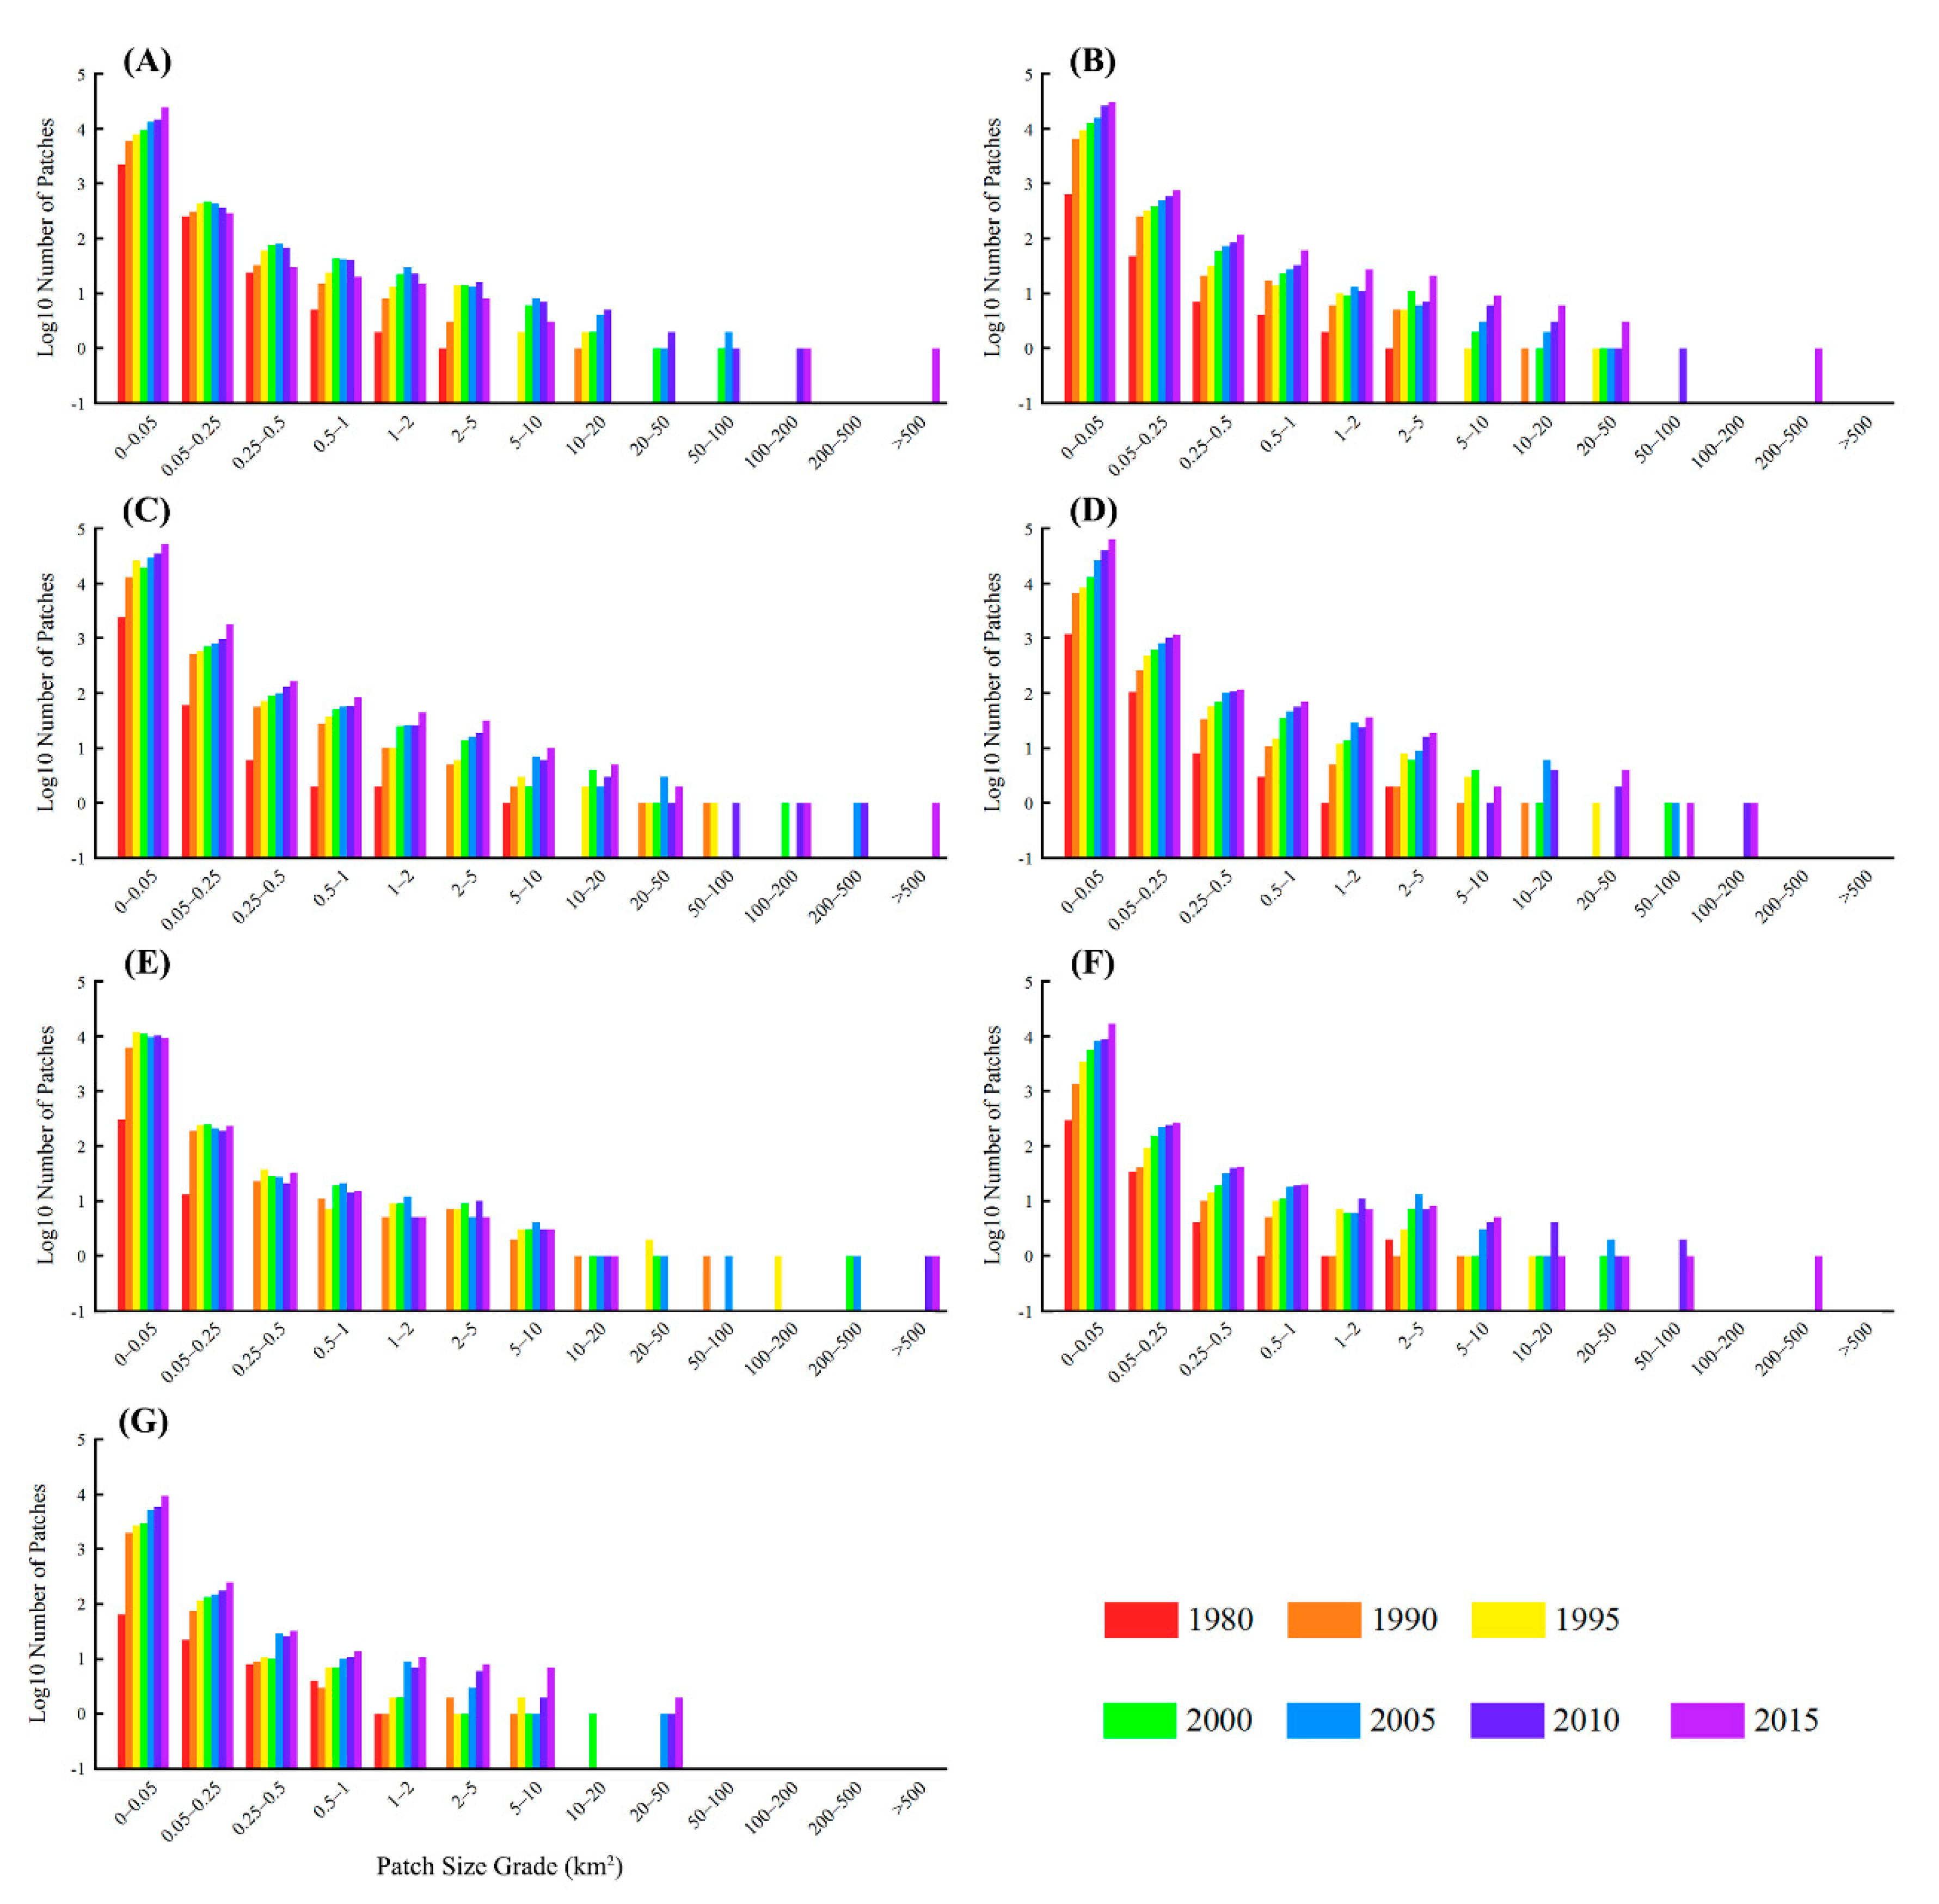
2.5. Patch Size Grading Analyses

With the urbanization process, urban land patches in different sizes always continue appearing and extending over time. Size grading could provide evidence and inference for a comprehensive understanding of regional urban expansion. The dynamics of patch number at a given size, especially the smallest and largest size classes, could reveal the similarities and differences in the evolution of urban land structures. In our study, we divided patches into 13 categories, including 0–0.05 km2, 0.05–0.25 km2, 0.25–0.5 km2, 0.5–1 km2, 1–2 km2, 2–5 km2, 5–10 km2, 10–20 km2, 20–50 km2, 50–100 km2, 100–200 km2, 200–500 km2, and >500 km2. The frequency of patches in all classes were calculated for comparison.

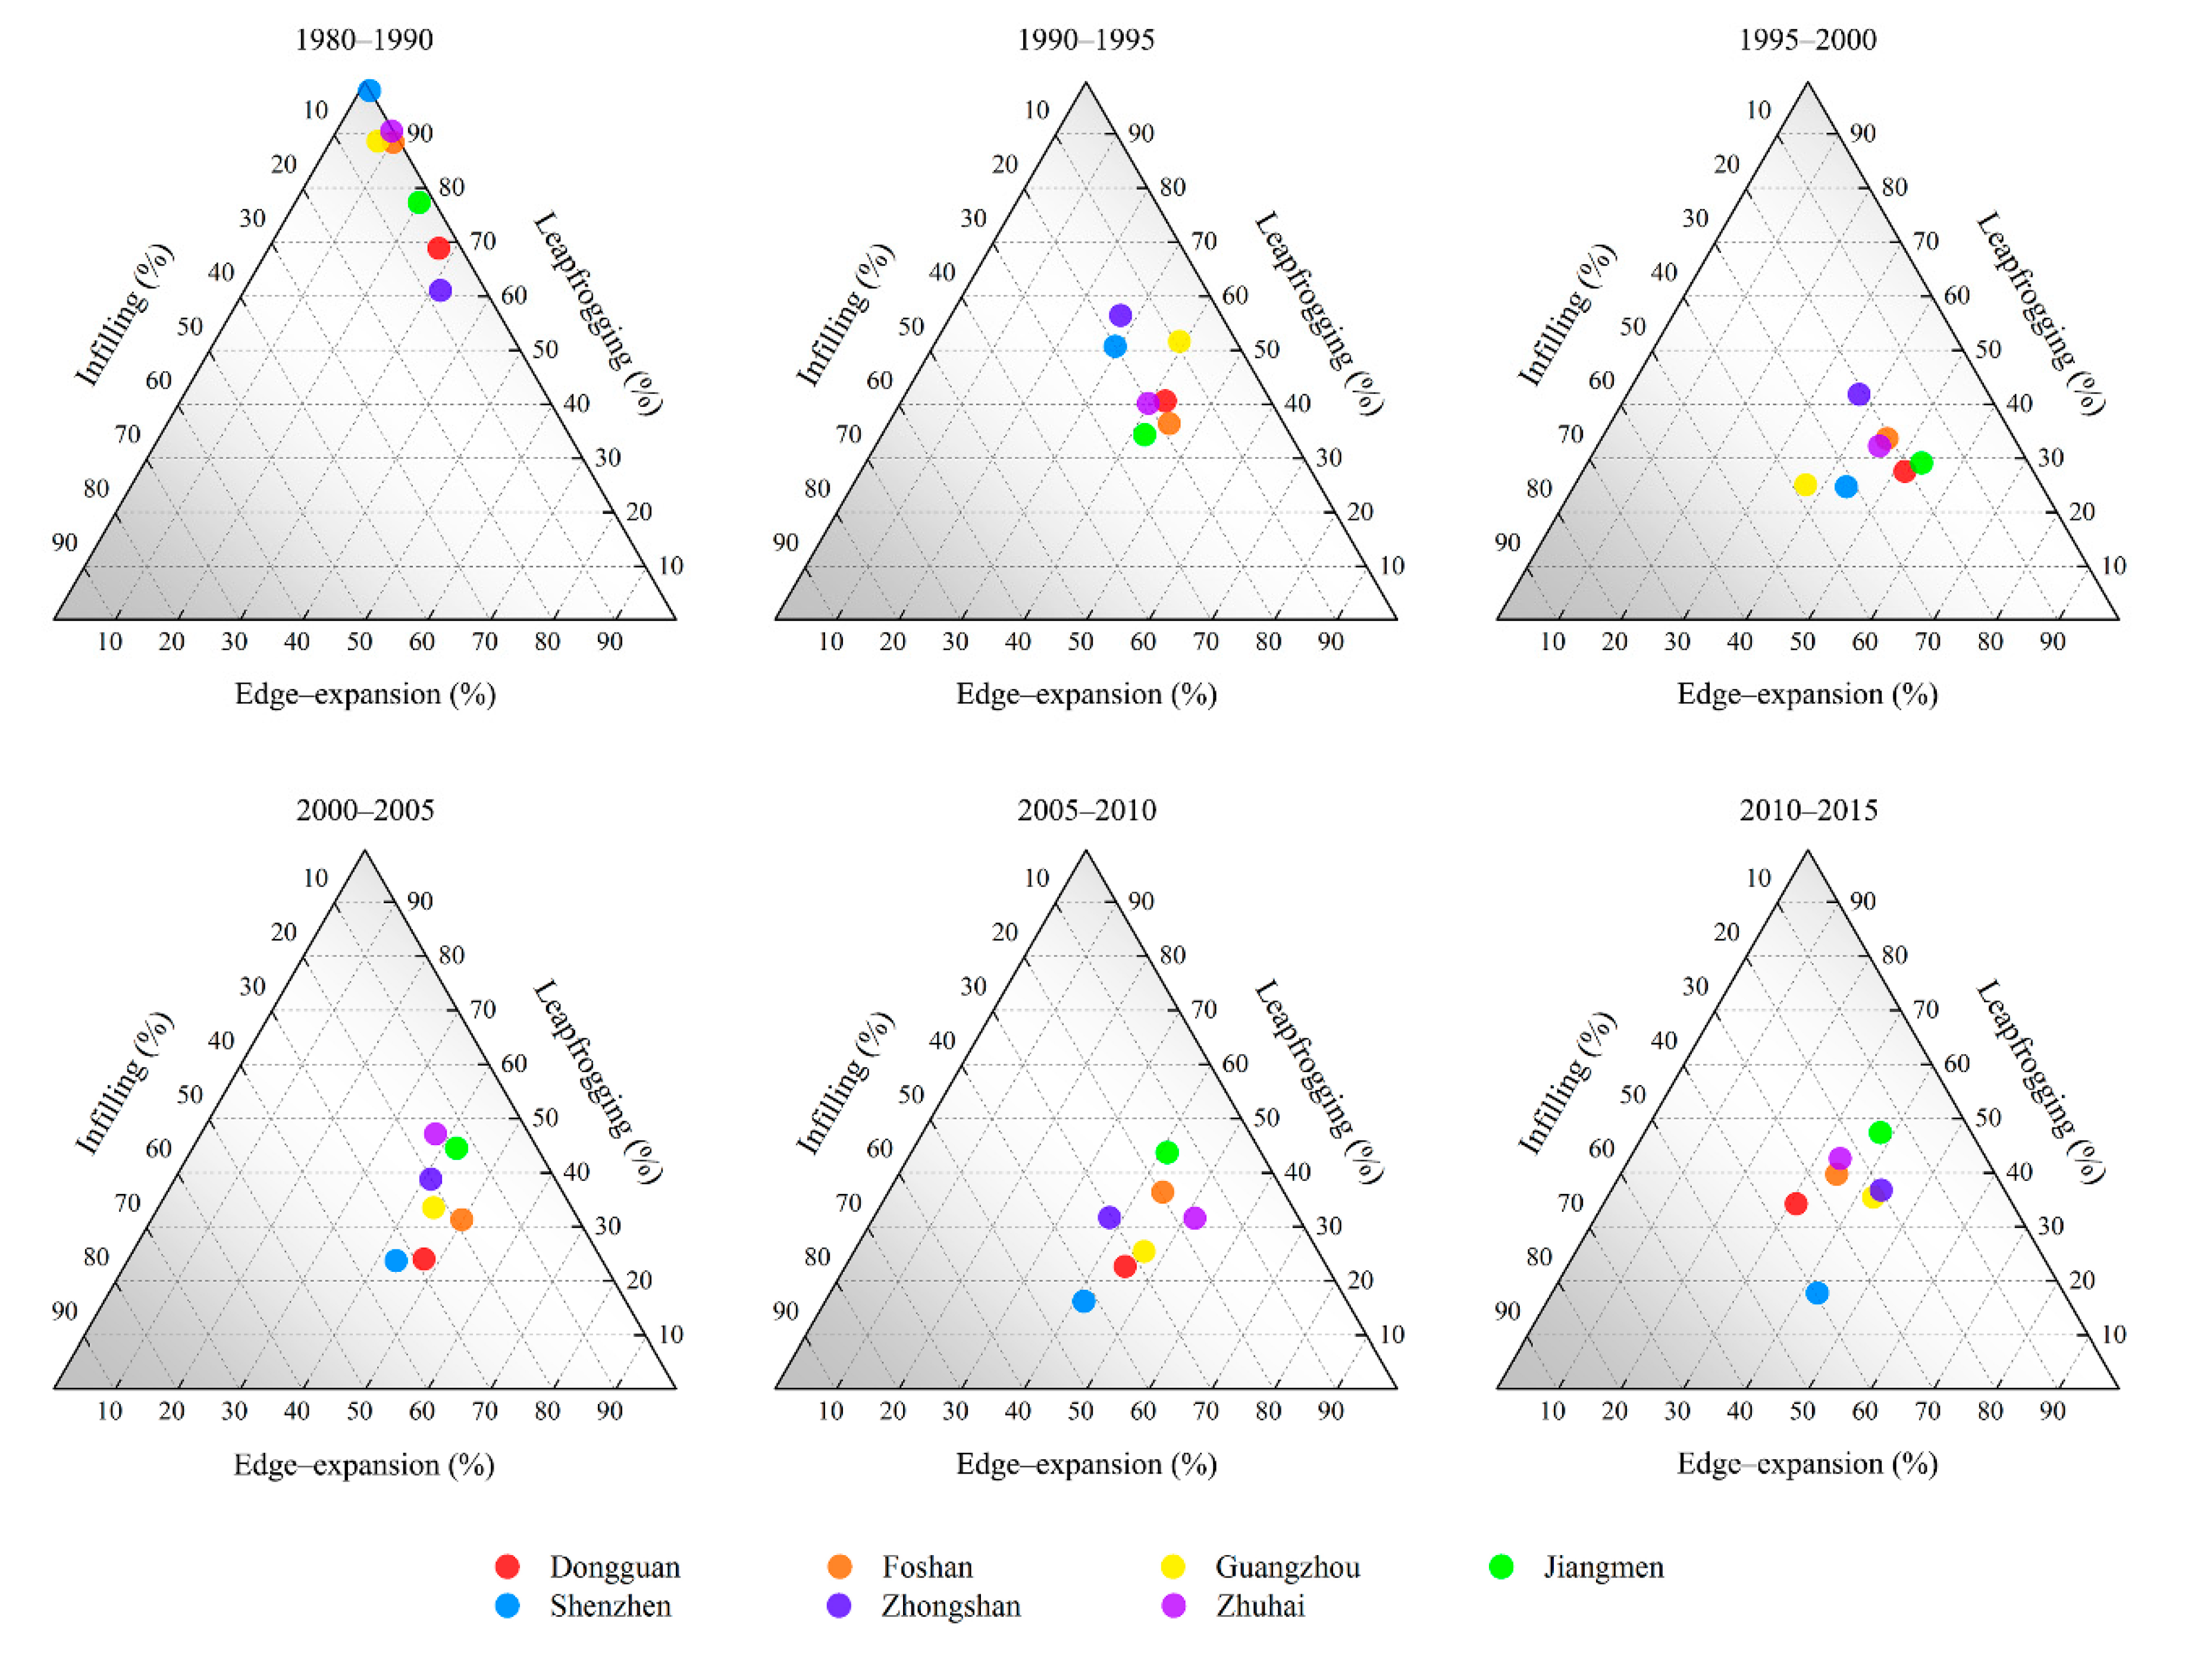
2.6. Urban Growth Type

To understand urban land expansion in detail, urban patches were divided into three growth types following our previous work—namely, infilling, edge–expansion, and leapfrogging [10]. These three types were defined through numerical calculations:
G T I = L c o m P n e w
In the formula, P n e w represents the perimeter of the new urban patch and L c o m refers to the length of the shared border between existing patches and the new patch. The calculated G T I is the indicator of urban growth type, valued from 0 to 1. When G T I = 0, the new developed patch is defined as a leapfrogging patch; when 0 < G T I ≤ 0.5, an edge–expansion patch; an infilling patch when 0.5 < G T I ≤ 1.

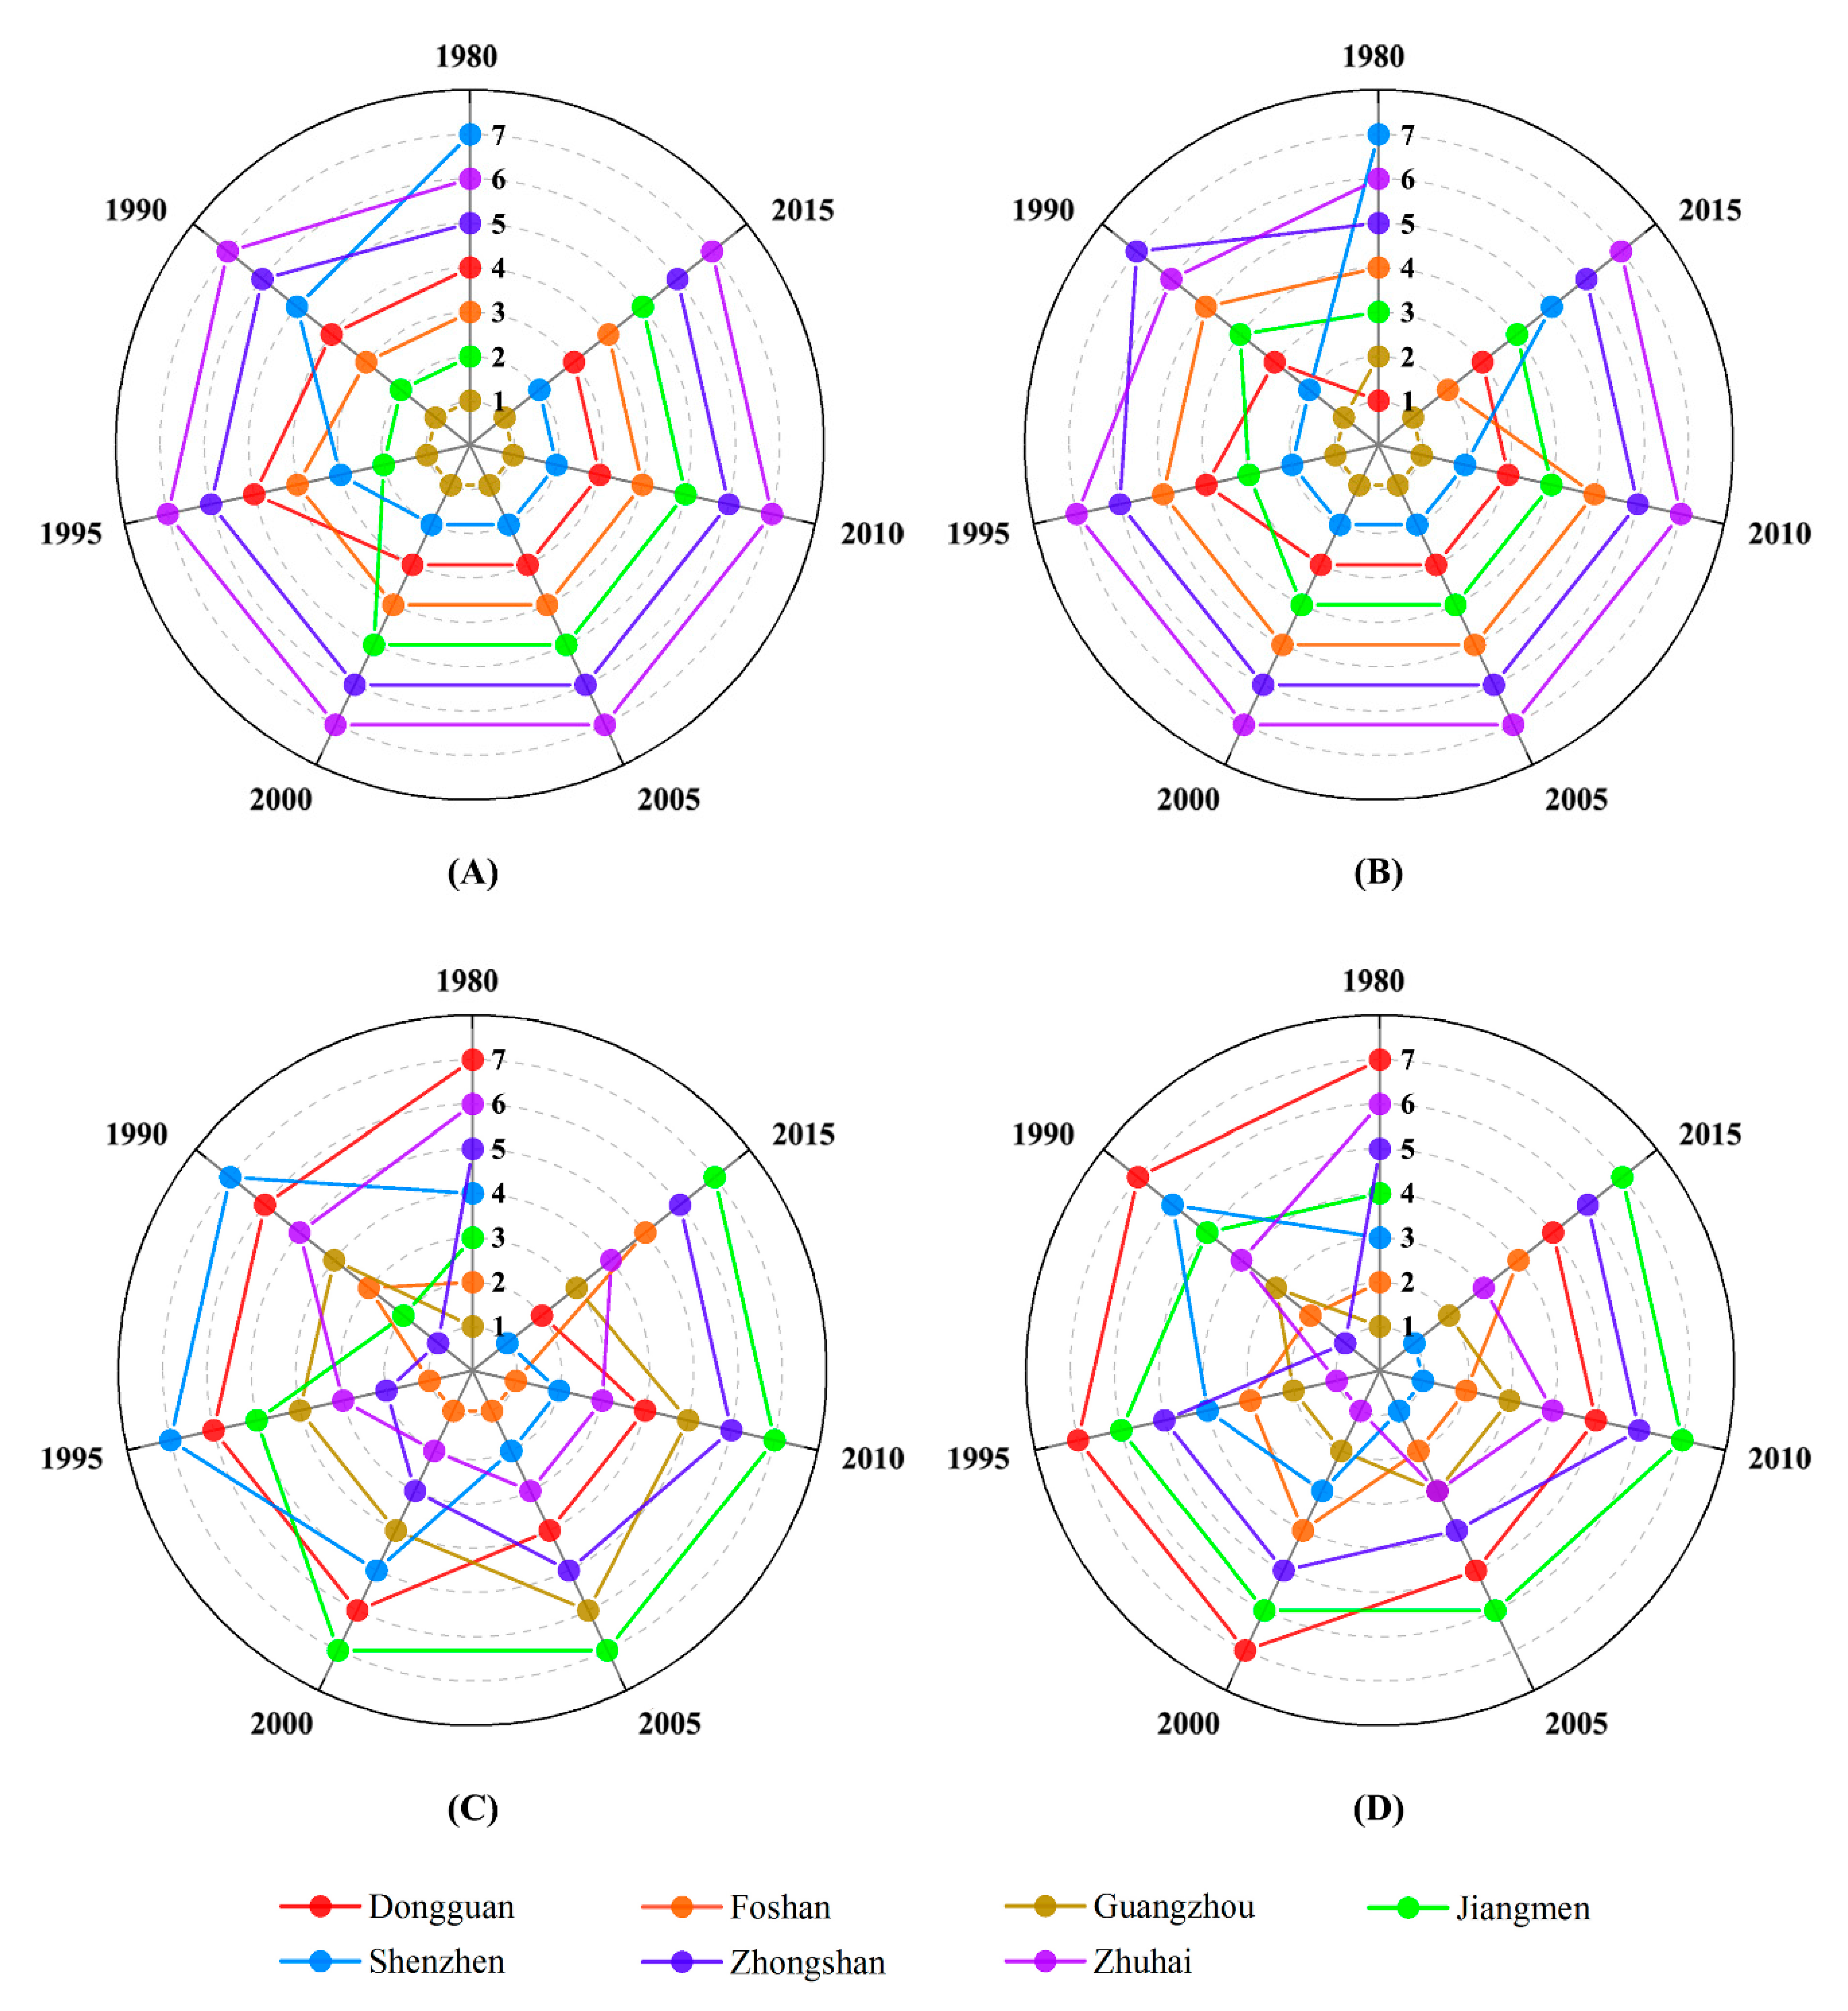
2.7. The Evolution of Urban Rank Size

Four characteristics were chosen for illuminating the dynamics of urban rank distribution, including population, area of urban land, population per unit urban land area, and GDP per unit urban land area. The former two indicators are commonly used to describe the urbanization level in many studies [16,33]. Combining them, we could get the third metric population per unit area, which contains information on population density. Furthermore, GDP per unit of urban land area was used to present land use efficiency of wealth creation [34,35]. We ranked these four indicators to explore the differences among cities and intraurban agglomeration dynamics.

3. Results

3.1. Magnitude and Rates of Urban Expansion

All of these seven cities in the PRD underwent rapid urban land expansion from 1980 to 2015, as shown in Figure 2 and Table 5. Over the past 35 years, the total urban land areas in the PRD expanded by 26.2 times (5898.3 km2) as large as those in 1980. The average annual increase rates in urban land areas in Dongguan, Foshan, Guangzhou, Jiangmen, Shenzhen, Zhongshan, and Zhuhai were 8.2%, 11.3%, 8.1%, 9.8%, 11.0%, 9.8%, and 9.0%, respectively.
The magnitude and rates of urban growth varied across cities and time periods (Table 5). In the metropolitan region of the PRD, the annual growth showed an upward trend and reached a maximum of 443.4 km2 in 2010–2015. The annual urban increase rate of the metropolitan region was the highest (15.1%) in the early stage of urbanization and gradually decreased to about 8% afterward. Among these seven cities, Guangzhou and Shenzhen demonstrated their highest Annual Increase Rate (AIR) in 1980–1990, pioneering the rapid urbanization process in the PRD. Notably, the annual growth of Guangzhou stayed at a high level continuously over 35 years. Since 1990, other cities with high Annual Growth (AG) and AIR such as Dongguan, Zhongshan, and Jiangmen entered their stage of rapid urban growth at different time periods. While in Zhuhai, the annual growth of urban land was much less during most of the study period compared to other cities.

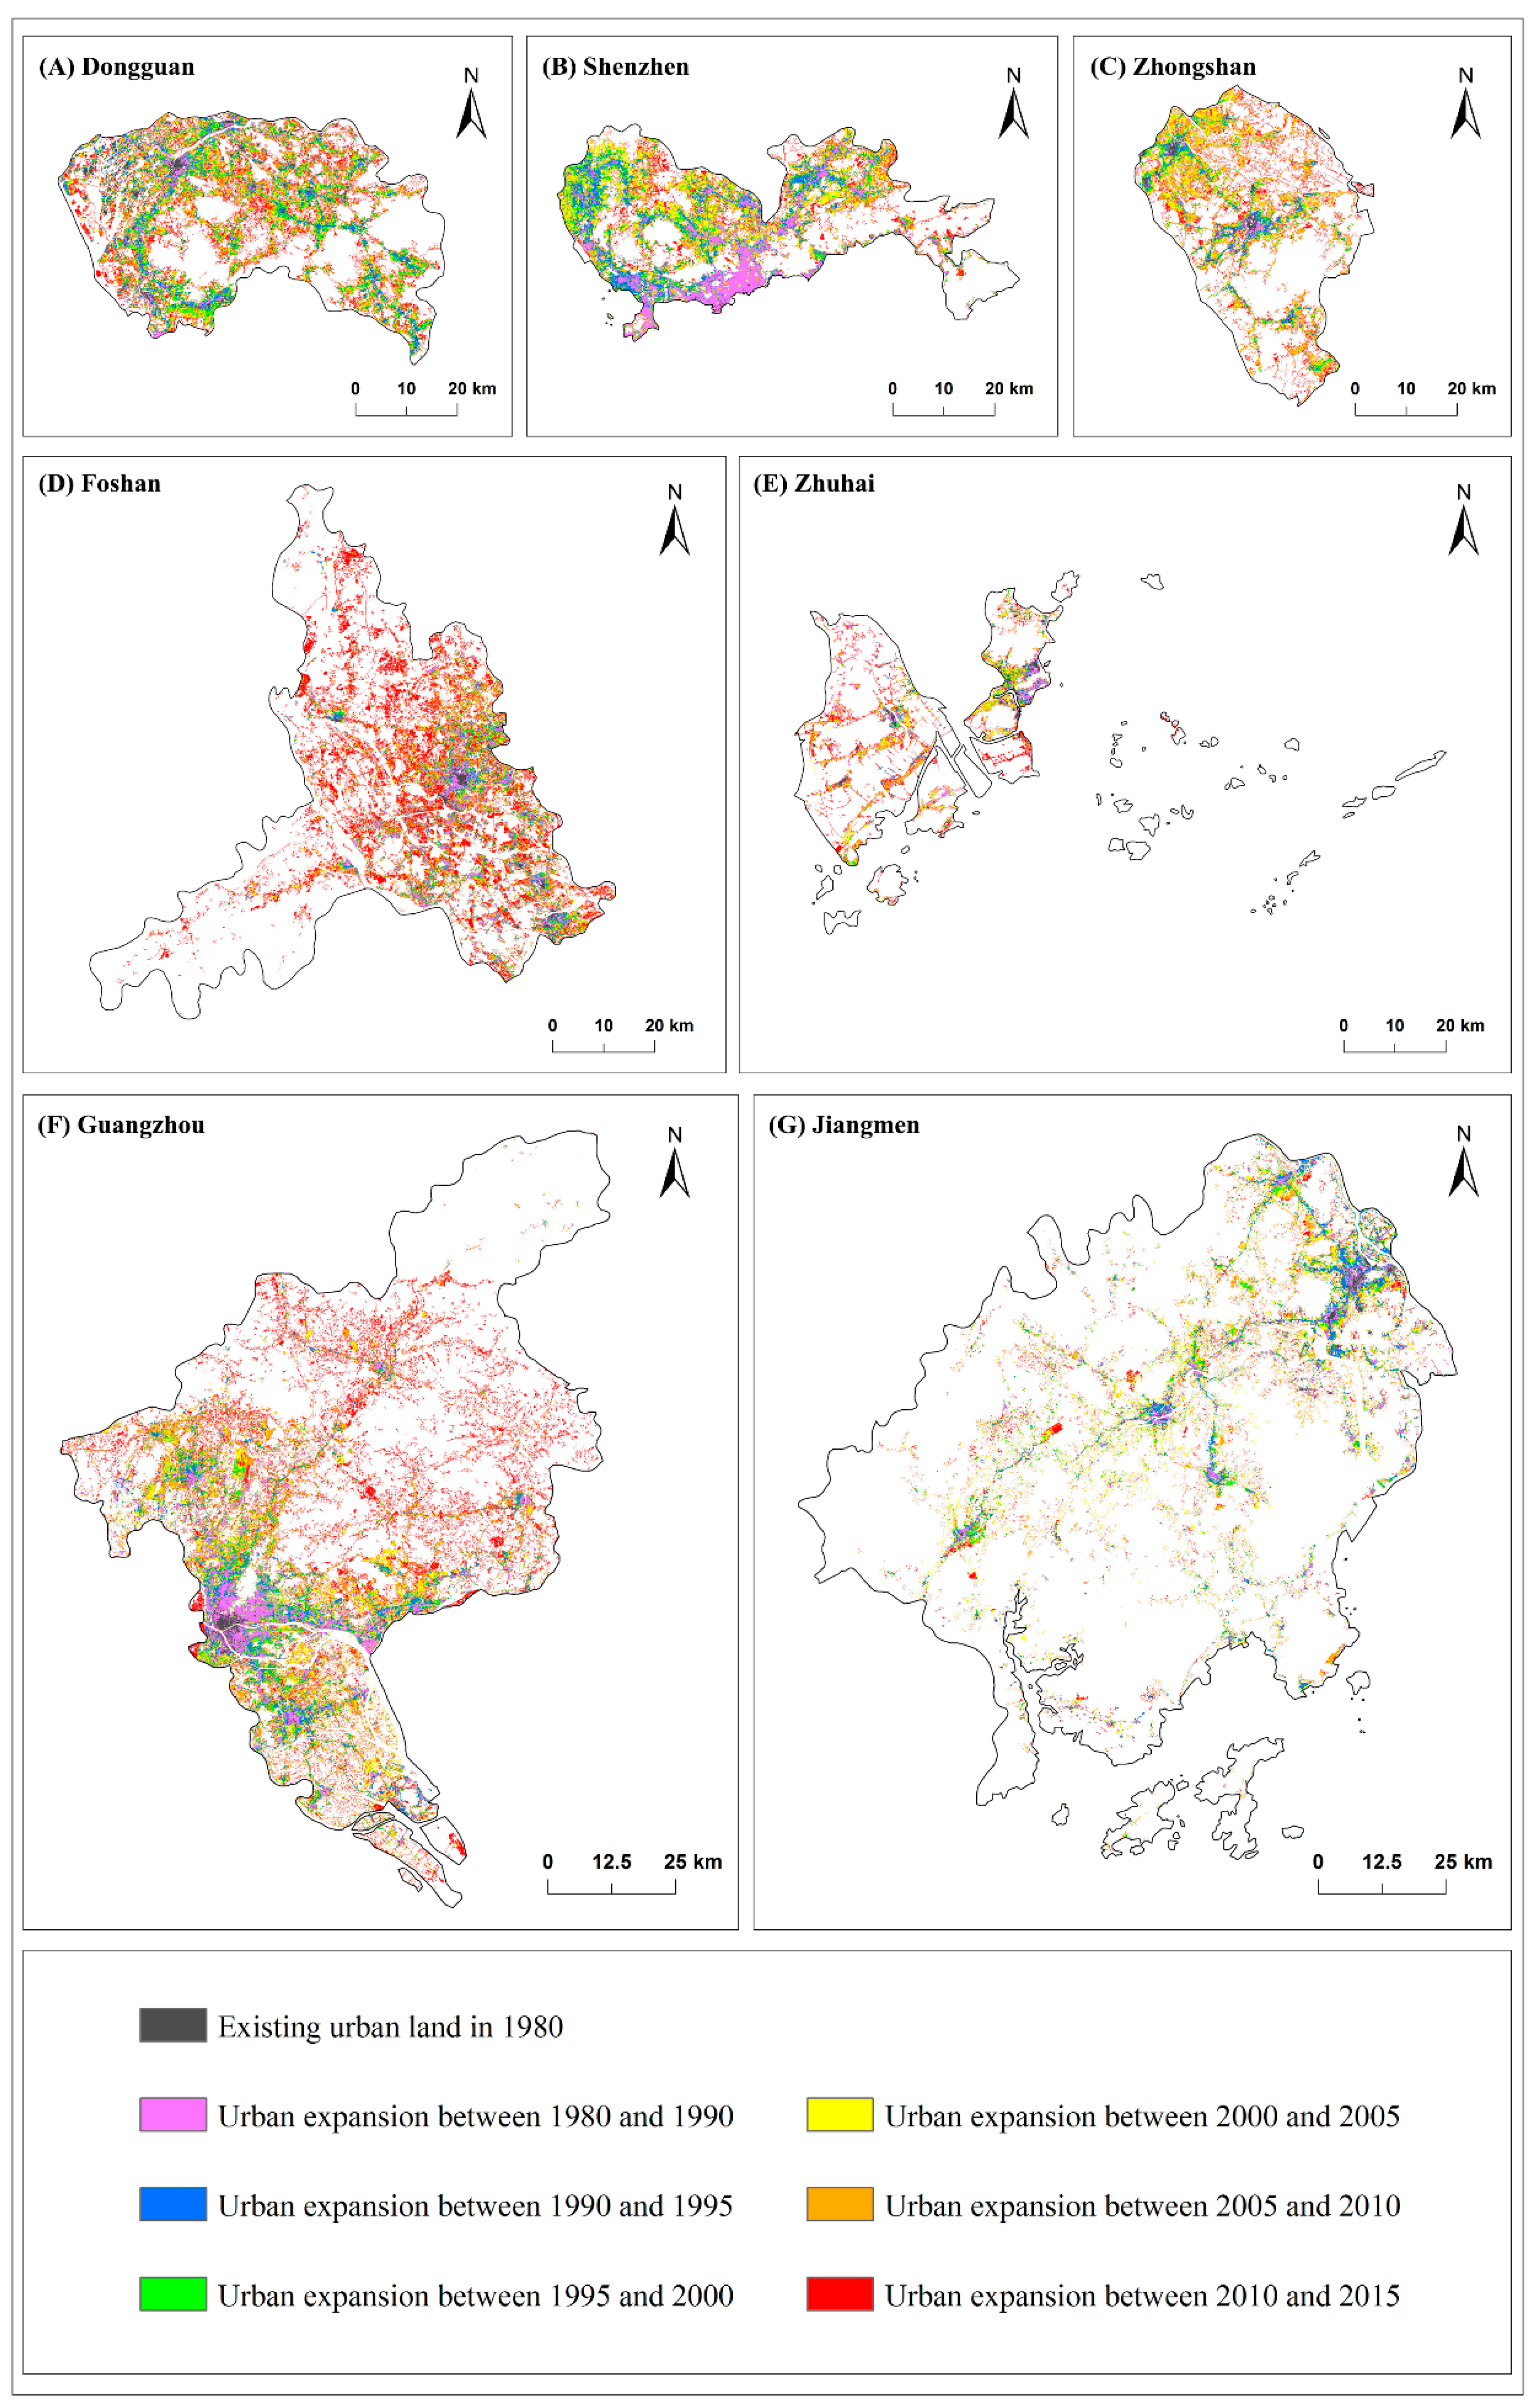
3.2. Spatiotemporal Pattern of Urban Expansion

Diverse spatiotemporal expansion patterns of every single city in six periods can be seen in Figure 2. Specifically, the extensions of urban land in Guangzhou, Foshan, and Jiangmen had single expansion cores at the early urbanization stage. The initial core of Guangzhou was located in the southwest of the city. Over time, urban land in Guangzhou extended to different directions along rivers and roads from the initial largest urban core. While in Foshan and Jiangmen, subcores emerged in different parts of the city and became gradually larger than the initial core. In Zhongshan and Zhuhai, two urban land expansion cores were separated by vast farmland or watercourse. Additionally, the land between two cores in the north (e.g., Xiaolan Town) and the middle of Zhongshan considerably transformed into a type of construction area after 2000. The urban land expansion in Shenzhen and Dongguan occurred simultaneously in many parts of the city. For Shenzhen, the expansion mainly happened in the southern region near Hong Kong in 1980–1990. Later on, with the extension of the special economic zone, the urban land increase took place progressively in the rest of available areas for construction. As for Dongguan, urban land expansion has developed since 1995 in a rather dispersed pattern.
The rapid urbanization process profoundly influenced the landscape structure. Figure 3 illustrates the temporal variation of landscape metrics for seven cities from 1980 to 2015. The PLAND and LPI of all the cities had monotonous increase trajectories, and substantial increases were observed in Shenzhen, Dongguan, and Zhongshan due primarily to their small initial urban land areas and high urban land extension rates. In terms of the metrics of LSI, NP, and PD, the trajectory curve of Shenzhen was single–hump shaped while that of Guangzhou demonstrated a double–hump shaped pattern. In other cities, a simply increasing pattern of these three metrics was found. In addition, MPS evolved as a function of both PLAND and PD.
To further depict the features of urban expansion, we compared the variation of the compositions of three urban growth types for each city over six periods (Figure 4). During 1980–1990, most cities were located on the right side of the growth triangle, indicating that the proportion of infilling type was the smallest. Meanwhile, leapfrogging occupied the dominant position, with its weight exceeding 50% in all cities and even approaching 100% in Shenzhen, reflecting a dispersed urban expansion in the early stage of urbanization. From 1990 to 2005, the infilling and leapfrogging showed direction–opposite fluctuations in all cities. When the ratio of infilling rose, the contribution of leapfrogging declined, and vice versa. After 2005, the proportion of edge–expansion and leapfrogging was higher than that of the infilling type of urban expansion in most cities, except Shenzhen and Dongguan. In Guangzhou, the proportion of leapfrogging experienced two ups and downs during the entire study period. These results suggest a diverged urban development trajectory among different cities during the late stage of urbanization.
Figure 5 displays the frequency distribution of the patch number according to the patch size classes for each city. In Shenzhen, the number of patches smaller than 0.05 km2 increased from 1980 to 1995 and then remained stable, while that in all other six cities increased constantly during the past 35 years. On the other hand, the distribution dynamics of the largest urban patch, generally characterizing the evolution of urban core or center of the city, were more complicated. Guangzhou, Foshan, and Jiangmen had the single largest patch for the whole period in 1980–2015. Taking Guangzhou as an instance, the largest patch (100–200 km2) was two classes higher than the second–largest patch (20–50 km2) in 2000. As for Zhongshan, there were two patches distinctly distributed in the top two largest classes during the study period, especially in 2005 and 2010, which can also be seen in Figure 2C.

3.3. Rank Size and Rank Clocks

The dynamics of the urban rank clocks over time are illustrated in Figure 6. Regarding the population rank (Figure 6A), Guangzhou has been the top rank since 1980 (at the center of the clock). Shenzhen ranked last in 1980 as a small fishing village but since 2000 it has been increasing and now ranks in the top two. In terms of the urban land area (Figure 6B), Guangzhou was ranked first for the entire period except for 1980 when Dongguan was the top rank. Shenzhen started as the bottom rank in 1980, upgraded to the second in rank and then declined to the fifth in 2015. As for population per urban land area, Guangzhou, as the most urbanized city, fell out from the top rank in 1980 to the third–sixth over time. On the contrary, as rapidly developed cities with small administrative areas, Foshan was located at the center of the clock most of the time, and the rankings of Shenzhen and Dongguan rose constantly until they were ranked first and the second in 2015, respectively. The metric of GDP per unit area was sorted as shown in Figure 6D. Guangzhou, as the capital of Guangdong province, was stable in terms of land use efficiency of wealth creation, ranking from first to third over time. While the change of rank for Shenzhen was volatile, rising from the sixth in 1990 to the first in 2005 and held the top rank since.

4. Discussion

4.1. Characteristics of Urban Land Expansion in the Pearl River Delta

The Pearl River Delta has undergone continual large–scale urban land expansion over the past 35 years. Overall, the PRD has experienced a relatively equal level of urbanization, as indicated by the average annual increase rates ranging from 8.1% to 11.3% among cities, but with distinct temporal profiles.
Guangzhou and Shenzhen were two powerful engines, especially at the beginning of “reform and opening up” policy implementation, with high annual growth of urban land (Table 5). In Guangzhou, the industry and service industry foundation, as well as the strong policy support, might facilitate the rapid and continual urban land expansion [36,37]. Differently, Shenzhen benefited from sufficient investment and the loose development environment under the umbrella of the socialist market economy, which intensively stimulated its rapid land urbanization [38]. Limited by administrative boundaries [39], the proportion of infilling patches began to rise, particularly from 1995, suggesting that urban expansion in Shenzhen gradually slowed down and focused on the adjustment of land use intensity and structure. On the contrary, with adequate unexploited land resources, Guangzhou continued its circus–like expansion (Figure 2) in accordance with its urban master planning during the study time [40], characterized by high annual growth and another round rise of leapfrogging (Figure 4).
Other cities in the PRD also acted as the impetus for urban land expansion. The administrative division adjustment has shown a clear imprint on the urbanization process and high annual growth occurred after restructuring of the administrative division, such as the adjustment of Foshan in 2002 and Jiangmen in 1992. Urban growth in the PRD was also closely associated with foreign investments and policies [41]. For example, Dongguan is known as the world’s factory due to its manufacturing and export–oriented economy, and its annual increase rate exceeded that of Guangzhou and Shenzhen in 1990–2000, in line with its high–speed economic development stage.
The establishment of the Guangdong–Hong Kong–Macao Greater Bay Area (GBA) was first announced in March 2015. This large urban agglomeration contains 11 cities, seven of which were included in our studies. The findings on the characteristics of urban growth in the PRD could be informative for the construction of this world’s largest metropolitan regions to achieve prosperous and sustainable development in this special and large urban agglomeration [42,43].

4.2. The Applicability of Diffusion–Coalescence Theory

Previous research has found that the spatial–temporal evolution of the city could be described as the process of diffusion and coalescence [44]. In terms of dynamic coevolution of multiple landscape and urban growth metrics [45], we found distinct evolution patterns of the seven studied cities in the PRD.
Seen from the trajectories of landscape metrics and urban growth types during 1980–2015, only Shenzhen presented a typical diffusion–coalescence process. Metric PLAND and MPS continuously increased in Shenzhen all the time. The trajectory curve of PD was hump–shaped and reached its maximum value in 1995 when the transition of diffusion and coalescence in Shenzhen occurred. In terms of urban growth type, the proportion of three types changed from almost all being leapfrogging to 2:1:2 (infilling: leapfrogging: edge–expansion), a typical characteristic of the coalescence process [10]. Therefore, the urban development trajectory in Shenzhen was consistent with Dietzel’s diffusion–coalescence theory.
Compared with the typical diffusion–coalescence evolution of Shenzhen, the land urbanization distinctly showed different characteristics in other cities. In Guangzhou, the proportion of leapfrogging experienced a large fluctuation, which might be related to the government–leading urban development pattern in Guangzhou. For example, the weight of leapfrogging increased in 2000–2005, probably because of the administrative division adjustment of Panyu and Huadu in 2000, which might stimulate land urbanization in the outer suburban area in Guangzhou. Consequently, Guangzhou evidenced two rounds of diffusion–coalescence processes (i.e., 1980–2000 and 2000–2015). Similarly, in Foshan and Jiangmen, the ratio of leapfrogging increased gradually after 2000 and 1995, respectively, due to adjustments of administrative division in 2002 (i.e., Foshan) and 1992 (i.e., Jiangmen). In Dongguan, after the general diffusion–coalescence process during 1980–2010, there was an abrupt increase in leapfrogging in 2010–2015, signifying that Dongguan entered a new diffusion process; Zhongshan was still undergoing a diffusion process, with a substantial number of leapfrogging patches appearing around the existing northwest, central, and southern urban areas during 2010–2015 (Figure 2C). Unlike the six cities mentioned above, Zhuhai changed frequently in the proportion of urban growth types, which might be attributed to the frequent change of the city center position [46]. The complexities of Zhuhai’s urban development were unable to be captured by the diffusion–coalescence theory.

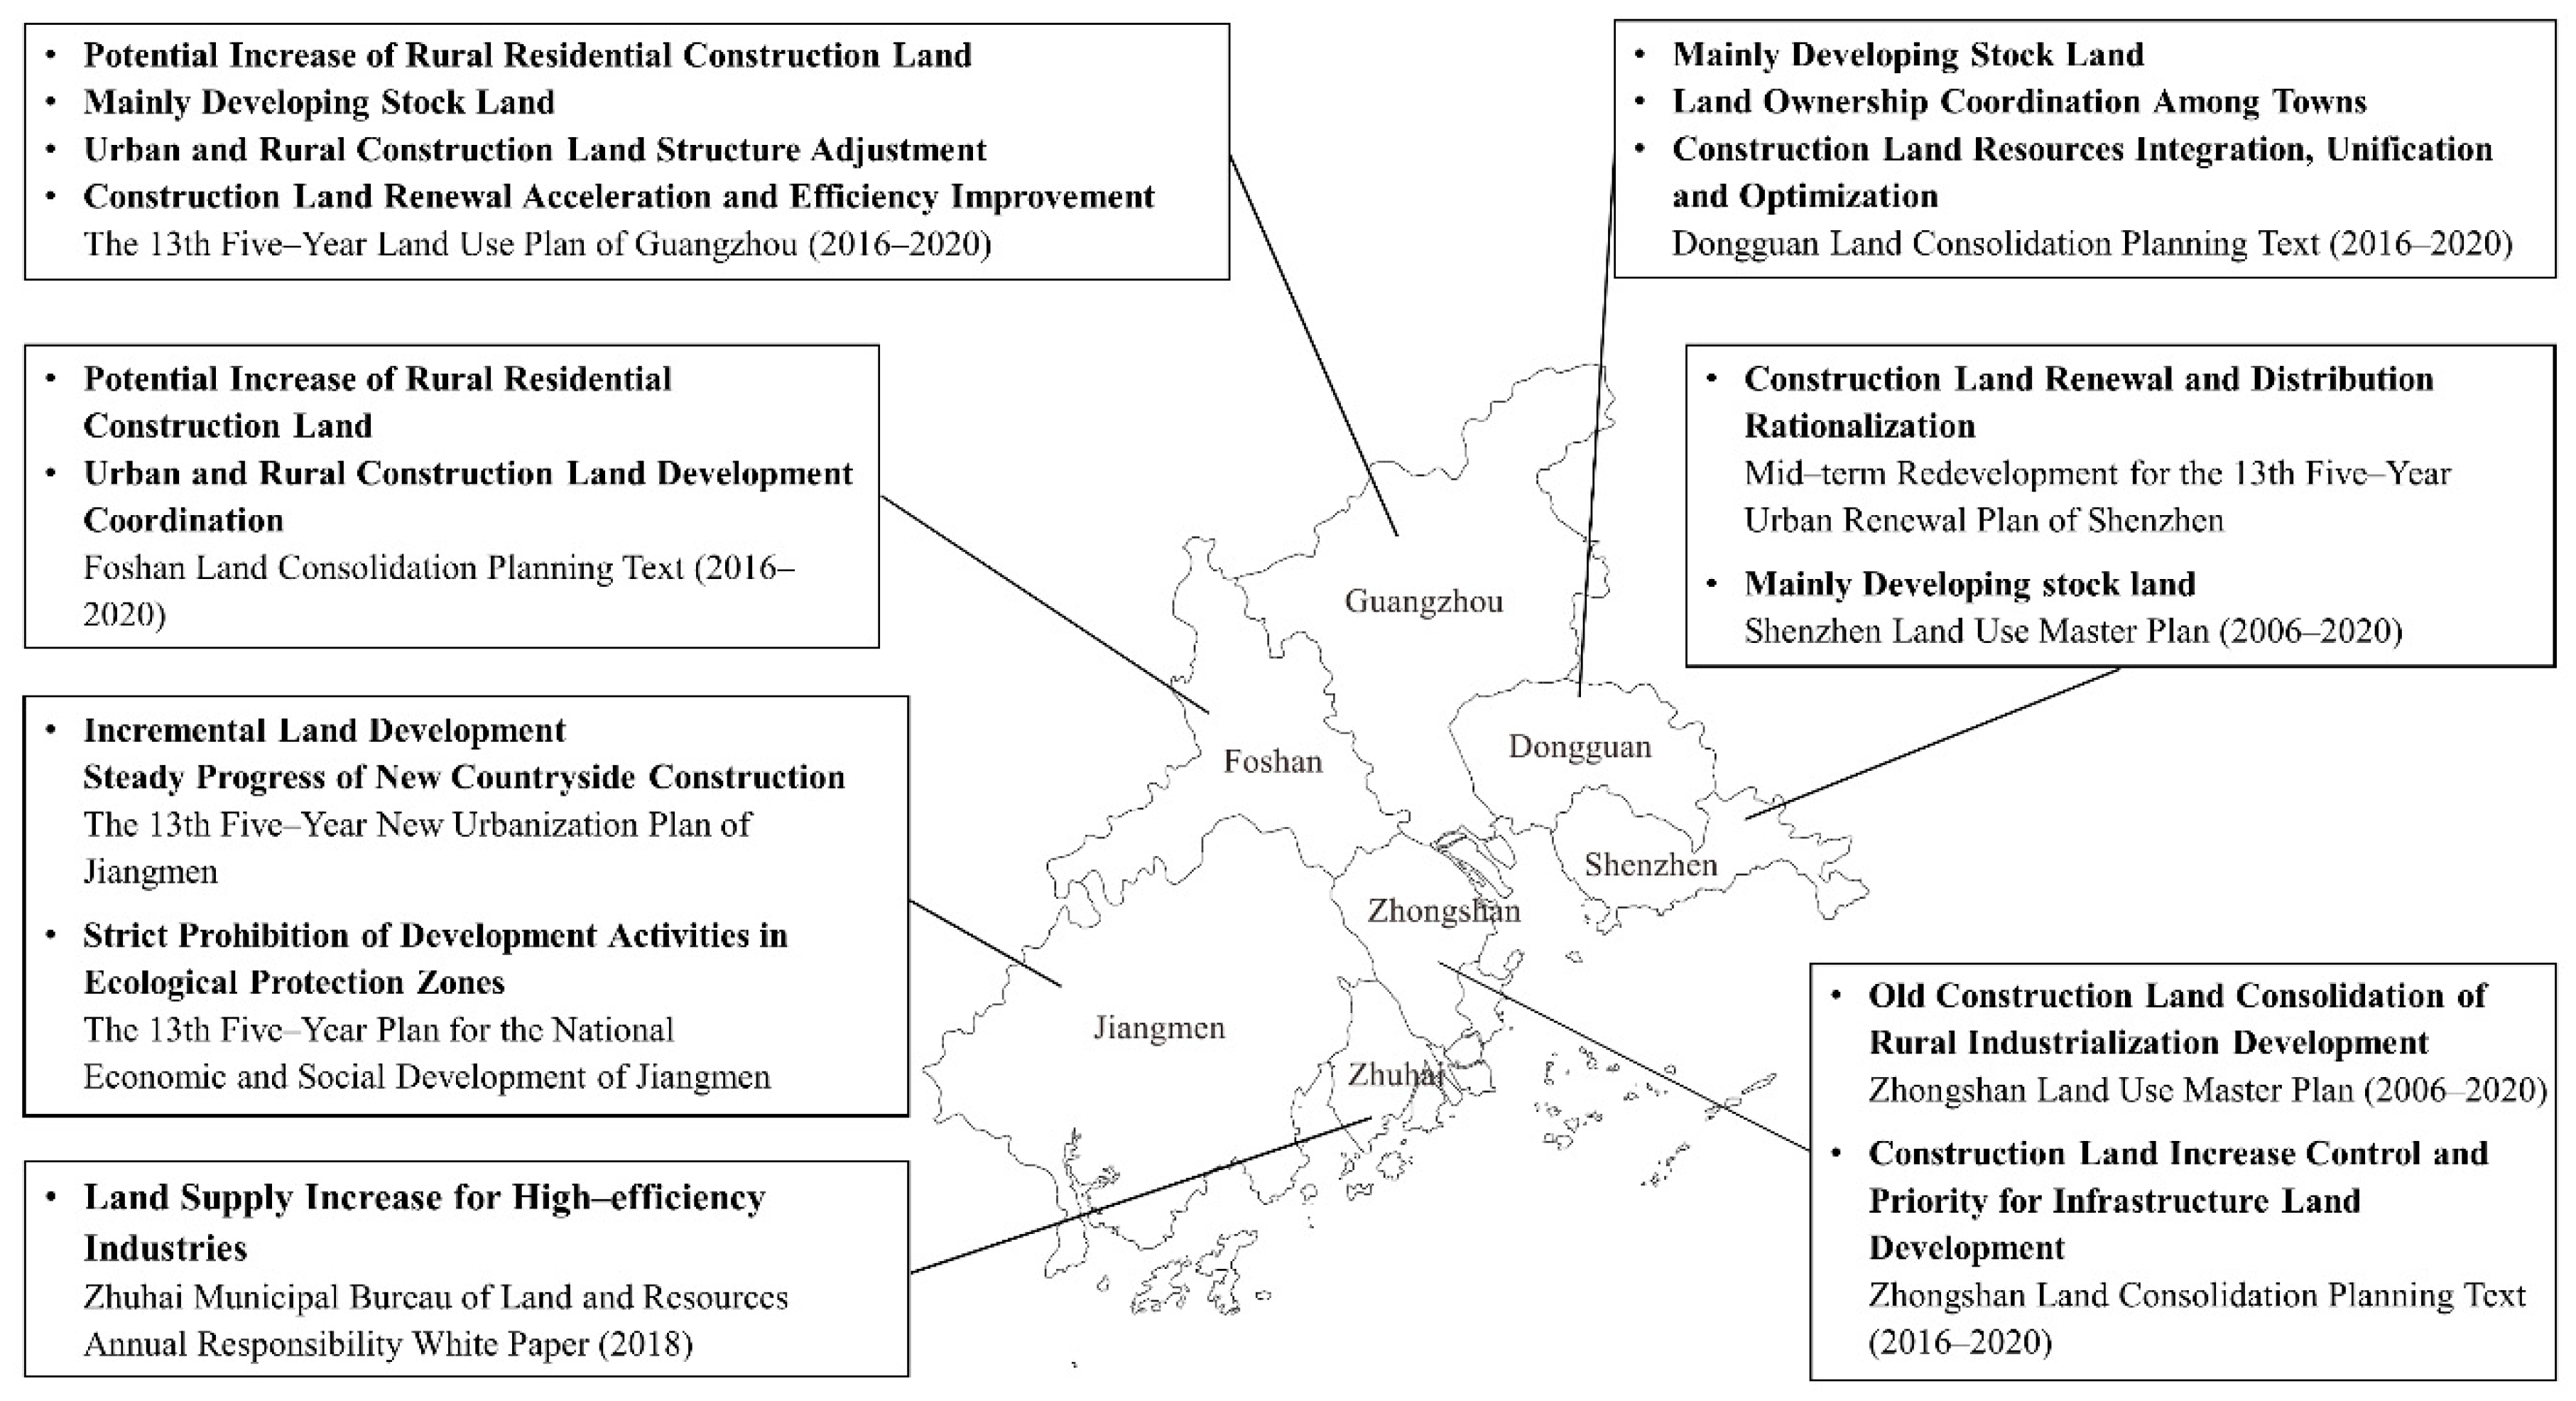
4.3. Mechanism of Land Urbanization in the Pearl River Delta

The mechanisms of urbanization in different cities of the PRD demonstrated diverse characteristics. In the study area (Figure 2), the urban extension patterns in Guangzhou, Foshan, and Jiangmen were of small difference—as was that in Shenzhen and Dongguan, Zhongshan, and Zhuhai. Specifically, the urban expansion patterns in Guangzhou, Foshan, and Jiangmen were single–nucleated in the early stages of urbanization, when the initial urban core was dominated in urban expansion and became multinucleated afterward with subcores emerging, as shown in Figure 2 and Figure 5. Shenzhen and Dongguan witnessed dispersed urban construction and experienced multinucleated expansion after 1990; Zhongshan and Zhuhai generally went through a dual–nucleated expanding pattern, in which there were two large urban expansion cores of similar size for most of the study period. Both physical and socioeconomic factors contributed to the distinctive urban expansion patterns in the seven studied cities. Previous studies have found that the urban area might increase with the decline of distance to rivers and roads and the impacts of rivers on urbanization might be stronger than roads in Guangzhou [21]. Our results (Figure 2) also found the facilitating effect of rivers, evidenced by the concentrated distribution of a newly urbanized area in northern Guangzhou, southeastern Foshan, and northwestern Zhongshan.
The socioeconomic driving mechanisms underlying land urbanization among the cities were different. We summarized the development of Guangzhou, Shenzhen, and Zhuhai as “top–down” patterns led by the municipal government, while Foshan, Jiangmen, Dongguan, and Zhongshan were summarized as “bottom–up” development models.
The urban planning and land system dominated by the municipal government might be the main forces for urban land expansion in the “top–down” development model. During 1980–2015, the land urbanization of Zhuhai was far behind other cities such as Shenzhen, as can be seen by its low rank in rank clocks (Figure 6B) and small value in growth rates (Table 5). To achieve the conception of a garden–style coastal city, Zhuhai repeatedly changed its position based on environmental protection [46]. Prior awareness of environmental–friendly development was likely to limit its growth of industry. To solve the predicament, Zhuhai is planning to increase land supply for high–efficiency industries in the future (Figure 7). Urban expansion in Guangzhou benefited from urban master planning [47]. Along with the urban master planning, rapid infrastructure construction and efficient administrative division adjustment deployed in Guangzhou. Rapid transportation line extension and urban expansion made Guangzhou form a clear multipoint and multidirection expansion skeleton along rivers and roads from a single–nucleated pattern (Figure 2F). Moreover, the land system established by the government determined its land use pattern (e.g., landscape structure and urban growth type) of urbanization. Starting with the first land use payment system in 1987, Shenzhen realized large–scale and multinucleated construction land spread from 1980 to 2005, taking advantage of the low–cost land acquisition and the high–priced land sell with public service [48]. Thereafter, during 2005–2015, the urban growth rate of Shenzhen slowed down, and about 40% of newly developed patches were infilling type. The municipal government realized the past unsustainable land use pattern and took efforts to optimize its land use system and management activities through various policy measures, in which land renewal and distribution rationalization played important roles (Figure 7).
In the “bottom–up” pattern, the power driving land urbanization came from low–level administrative organizations, including villages, townships, and counties. Within the context of reform and opening up, power decentralization took place in most cities [49,50], in which the ownership and use system of land and labor were under the control of the local government in villages or towns [51]. In Foshan and Jiangmen, power decentralization resulted in the development of county–level regions, making urban expansion transform from a single–nucleated to multinucleated pattern (Figure 2D,G). As for Dongguan, the whole city was composed of townships without county–level administrative units, and as such power decentralization and dispersed rural urbanization were more prominent in this city. For example, by 2002, village industry was the dominant component of the industry in Dongguan [51], which might have stimulated the urban expansion in the rural area with scattered distribution rather than in the urban center.

4.4. Distinct Features of the Urbanization Process in the Pearl River Delta Urban Agglomeration

To further explore the distinct features of the PRD, we compared it with the other two major urban agglomerations of China—namely, the Beijing–Tianjin–Hebei (BTH) Urban Agglomeration and the Yangtze River Delta (YRD) Urban Agglomeration.
Cities in the PRD had relatively smaller differences in terms of administrative level. In the BTH, the existence of Beijing and Tianjin, two municipalities, made the regional administrative hierarchy complicated. As the capital of China, Beijing enjoys policy priority compared with other cities including Tianjin [52]. The significant difference in administrative hierarchy led to polarization in the BTH, resulting in a “polarization period”, in which the polarizing effect of Beijing and Tianjin exceeded their promotion effect on Hebei province [53]. Further, the excessive gap in development level [54] resulted in the well–known “poverty belt around Beijing–Tianjin” [55]. On the contrary, in the PRD the total annual growth and increase rate was not always dominated by one or two particular cities, as Table 5 shows. Additionally, the rank orders of the cities in terms of GDP per unit area rose and fell (Figure 6C), suggesting that the development advantage of cities was constantly changing over time. A more balanced development path was formed in the PRD, in which no city could be superior to other cities in the administrative level similar to Beijing.
Cities in the PRD were all within the jurisdiction of Guangdong province, meaning that developing planning and management strategies could be formulated from a regional perspective with small obstacles. For instance, Guangzhou and Foshan have been developing an integrated Guangzhou–Foshan metropolitan area since 2002 [56]. Nevertheless, it was rather difficult to achieve in the YRD, mainly because the cities in the YRD were distributed in four provincial–level administrative regions, including Shanghai, Jiangsu, Zhejiang, and Anhui. Therefore, it was quite a challenge to coordinate the relationship and profit among different cities and provinces [57]. In Guangdong province, with the impact of “top–down” growing over time, the development planning of cities was complementary to each other, in line with the national conditions of China’s process of urban development and integration [58]. A regional development strategy guided the development of individual cities in the PRD. As was illustrated in Figure 7, Jiangmen was instructed to preserve ecological land and Dongguan planned to improve the level of land use and infrastructure, undertaking the industrial radiation roles of Shenzhen and Guangzhou (Outline Development Plan for the Guangdong–Hong Kong–Macao Greater Bay Area, 2019). Moreover, these cities all need to ensure the high efficiency of new construction land and optimize the structure of old construction land, including Guangzhou, Foshan, and Jiangmen, which had relatively more stocks of land than others (Figure 7).
In addition, admittedly, the development of urban agglomeration is always inseparable from the leading city, such as Beijing for the BTH and Shanghai for the YRD. In the PRD, Shenzhen acts as one of the leading cities, developing rapidly under the robust socialist market economy. There is no doubt that Hong Kong was the key to the development of Shenzhen in the early stages, providing a variety of supports for its development such as capital, management, and producer service [59]. As time went on, Shenzhen began to act similar to Hong Kong, driving the development of nearby cities such as Dongguan. However, the land resource scarcity forced Shenzhen to use stock land and transfer some production industry to other cities in order to improve its land use efficiency and realize sustainable development. This can be seen from the fact that urban land expansion in Shenzhen has been becoming increasingly compact over time.

5. Conclusions

The massive urban growth in the Pearl River Delta is a microcosm of China’s rapid urbanization process. In our study, we explored the magnitudes, rates, form, and mechanism of land urbanization across seven major cities of the PRD, and provided valuable comparative studies and portfolios for a comprehensive understanding of China’s urbanization.
Rapid land urbanization has occurred in the whole study area over the past 35 years. The average annual increase rate was ranked in the order of Shenzhen, Guangzhou, Foshan, Zhongshan, Jiangmen, Zhuhai, and Dongguan. Guangzhou and Shenzhen were the two most powerful engines for rapid urbanization of the PRD, and other cities also acted as the continuous impetus. Shenzhen’s growth trajectory was in line with Dietzel’s diffusion–coalescence theory, while those of the other six cities differed because of their respective characteristics. Different cities had diverse internal mechanisms of urban expansion—namely, “top–down” and “bottom–up” patterns. From a regional perspective, the PRD walked on a more balanced development path compared to other urban agglomerations, making it the earliest rapidly growing region and the earliest trier of the region integration process in China. The relationship of Shenzhen and Hong Kong is the key for rapid development of the PRD, and now Shenzhen is playing the role Hong Kong played 35 years ago to other cities nearby.
This study could contribute to the understanding of sustainable and integrated development of urban agglomerations in China and provide instructive insights for the sustainable development of the Guangdong–Hong Kong–Macao Greater Bay Area.

Author Contributions

S.Z. designed the research; S.X., Y.S. and S.Z. performed research, analyzed data and wrote the paper. All authors have read and agreed to the published version of the manuscript.

Funding

This research was funded by the National key R&D plan of China Grant (2018YFA0606104), the National Natural Science Foundation of China Grants (41771093 and 42071120), and the Undergraduate Student Research Training Program of the Ministry of Education.

Institutional Review Board Statement

Not applicable.

Informed Consent Statement

Not applicable.

Data Availability Statement

Not applicable.

Acknowledgments

We acknowledge all members in Shuqing Zhao’s lab for their assistance with the data processing.

Conflicts of Interest

The authors declare no conflict of interest.

References

  1. United Nations. World Urbanization Prospects: The 2012 Revision; United Nations, Department of Economic and Social Affairs, Population Division: New York, NY, USA, 2013. [Google Scholar]
  2. Grimm, N.B.; Faeth, S.H.; Golubiewski, N.E.; Redman, C.L.; Wu, J.; Bai, X.; Briggs, J.M. Global change and the ecology of cities. Science 2008, 319, 756–760. [Google Scholar] [CrossRef] [PubMed] [Green Version]
  3. Seto, K.C.; Fragkias, M.; Güneralp, B.; Reilly, M.K. A meta–analysis of global urban land expansion. PLoS ONE 2011, 6, 23777. [Google Scholar] [CrossRef] [PubMed]
  4. Angel, S.; Parent, J.; Civco, D.L.; Blei, A.; Potere, D. The dimensions of global urban expansion: Estimates and projections for all countries, 2000–2050. Prog. Plan. 2011, 75, 53–107. [Google Scholar] [CrossRef]
  5. Cohen, B. Urbanization in developing countries: Current trends, future projections, and key challenges for sustainability. Technol. Soc. 2006, 28, 63–80. [Google Scholar] [CrossRef]
  6. Zhou, D.; Zhao, S.; Liu, S.; Zhang, L.; Zhu, C. Surface urban heat island in China’s 32 major cities: Spatial patterns and drivers. Remote Sens. Environ. 2014, 152, 51–61. [Google Scholar] [CrossRef]
  7. Imam, A.U.; Banerjee, U.K. Urbanisation and greening of Indian cities: Problems, practices, and policies. Ambio 2016, 45, 442–457. [Google Scholar] [CrossRef] [Green Version]
  8. Chan, C.K.; Yao, X. Air pollution in mega cities in China. Atmos. Environ. 2008, 42, 1–42. [Google Scholar] [CrossRef]
  9. Güneralp, B.; Perlstein, A.S.; Seto, K.C. Balancing urban growth and ecological conservation: A challenge for planning and governance in China. Ambio 2015, 44, 532–543. [Google Scholar] [CrossRef] [Green Version]
  10. Zhao, S.; Zhou, D.; Zhu, C.; Qu, W.; Zhao, J.; Sun, Y.; Huang, D.; Wu, W.; Liu, S. Rates and patterns of urban expansion in China’s 32 major cities over the past three decades. Landsc. Ecol. 2015, 30, 1541–1559. [Google Scholar] [CrossRef]
  11. Zhang, N.; Wang, X.; Chen, Y.; Dai, W.; Wang, X. Numerical simulations on influence of urban land cover expansion and anthropogenic heat release on urban meteorological environment in Pearl River Delta. Theor. Appl. Climatol. 2016, 126, 469–479. [Google Scholar] [CrossRef]
  12. Yu, Z.; Yao, Y.; Yang, G.; Wang, X.; Vejre, H. Spatiotemporal patterns and characteristics of remotely sensed region heat islands during the rapid urbanization (1995–2015) of Southern China. Sci. Total Environ. 2019, 674, 242–254. [Google Scholar] [CrossRef]
  13. McPhearson, T.; Pickett, S.T.; Grimm, N.B.; Niemelä, J.; Alberti, M.; Elmqvist, T.; Weber, C.; Hasse, D.; Breuste, J.; Qureshi, S. Advancing urban ecology toward a science of cities. BioScience 2016, 66, 198–212. [Google Scholar] [CrossRef] [Green Version]
  14. Gómez, C.; White, J.C.; Wulder, M.A. Optical remotely sensed time series data for land cover classification: A review. ISPRS J. Photogramm. Remote Sens. 2016, 116, 55–72. [Google Scholar] [CrossRef] [Green Version]
  15. Liu, J.; Zhan, J.; Deng, X. Spatio–temporal patterns and driving forces of urban land expansion in China during the economic reform era. Ambio 2005, 34, 450–456. [Google Scholar] [CrossRef] [PubMed]
  16. Schneider, A.; Woodcock, C.E. Compact, dispersed, fragmented, extensive? A comparison of urban growth in twenty–five global cities using remotely sensed data, pattern metrics and census information. Urban Stud. 2008, 45, 659–692. [Google Scholar] [CrossRef]
  17. Andersson, E.; Barthel, S.; Borgström, S.; Colding, J.; Elmqvist, T.; Folke, C.; Gren, Å. Reconnecting cities to the biosphere: Stewardship of green infrastructure and urban ecosystem services. Ambio 2014, 43, 445–453. [Google Scholar] [CrossRef] [PubMed] [Green Version]
  18. Artmann, M. Assessment of soil sealing management responses, strategies, and targets toward ecologically sustainable urban land use management. Ambio 2014, 43, 530–541. [Google Scholar] [CrossRef] [Green Version]
  19. Gong, J.; Hu, Z.; Chen, W.; Liu, Y.; Wang, J. Urban expansion dynamics and modes in metropolitan Guangzhou, China. Land Use Policy 2018, 72, 100–109. [Google Scholar] [CrossRef]
  20. Chen, J.; Chang, D.K.; Zhang, X. Comparing urban land expansion and its driving factors in Shenzhen and Dongguan, China. Habitat Int. 2014, 43, 61–71. [Google Scholar] [CrossRef]
  21. Tian, G.; Wu, J. Comparing urbanization patterns in Guangzhou of China and Phoenix of the USA: The influences of roads and rivers. Ecol. Indic. 2015, 52, 23–30. [Google Scholar] [CrossRef]
  22. Haas, J.; Ban, Y. Urban growth and environmental impacts in Jing–Jin–Ji, the Yangtze, River Delta and the Pearl River Delta. Int. J. Appl. Earth Obs. Geoinf. 2014, 30, 42–55. [Google Scholar] [CrossRef]
  23. Luo, X.; Shen, J. A study on inter–city cooperation in the Yangtze river delta region, China. Habitat Int. 2009, 33, 52–62. [Google Scholar] [CrossRef]
  24. Fang, C.; Yu, D. Urban agglomeration: An evolving concept of an emerging phenomenon. Landsc. Urban Plan. 2017, 162, 126–136. [Google Scholar] [CrossRef]
  25. Yang, C. Restructuring the export–oriented industrialization in the Pearl River Delta, China: Institutional evolution and emerging tension. Appl. Geogr. 2012, 32, 143–157. [Google Scholar] [CrossRef]
  26. Peng, X.; Yu, Y.; Tang, C.; Tan, J.; Huang, Q.; Wang, Z. Occurrence of steroid estrogens, endocrine–disrupting phenols, and acid pharmaceutical residues in urban riverine water of the Pearl River Delta, South China. Sci. Total Environ. 2008, 397, 158–166. [Google Scholar] [CrossRef]
  27. Hui, E.C.M.; Li, T.C.; Lang, W. Deciphering the spatial structure of China’s megacity region: A new bay area—The Guangdong–Hong Kong–Macao Greater Bay Area in the making. Cities 2018, 105, 102168. [Google Scholar] [CrossRef]
  28. Foody, G.M. Status of land cover classification accuracy assessment. Remote Sens. Environ. 2002, 80, 185–201. [Google Scholar] [CrossRef]
  29. Herold, M.; Scepan, J.; Clarke, K.C. The use of remote sensing and landscape metrics to describe structures and changes in urban land uses. Environ. Plan. A Econ. Space 2002, 34, 1443–1458. [Google Scholar] [CrossRef] [Green Version]
  30. Forman, R.T. Land Mosaics: The Ecology of Landscapes and Regions; Cambridge University Press: Cambridge, UK, 1995; pp. 43–80. [Google Scholar]
  31. McGarigal, K. FRAGSTATS: Spatial Pattern Analysis Program for Quantifying Landscape Structure; US Department of Agriculture, Forest Service, Pacific Northwest Research Station: Corvallis, OR, USA, 1995; p. 122.
  32. Xiao, J.; Shen, Y.; Ge, J.; Tateishi, R.; Tang, C.; Liang, Y.; Huang, Z. Evaluating urban expansion and land use change in Shijiazhuang, China, by using GIS and remote sensing. Landsc. Urban Plan. 2006, 75, 69–80. [Google Scholar] [CrossRef]
  33. Bettencourt, L.M.A. The origins of scaling in cities. Science 2013, 340, 1438–1441. [Google Scholar] [CrossRef] [Green Version]
  34. Wang, L.; Li, C.; Ying, Q.; Cheng, X.; Wang, X.; Li, X.; Hu, L.; Liang, L.; Yu, L.; Huang, H.; et al. China’s urban expansion from 1990 to 2010 determined with satellite remote sensing. Chin. Sci. Bull. 2012, 57, 2802–2812. [Google Scholar] [CrossRef] [Green Version]
  35. Zhao, S.; Liu, S.; Xu, C.; Yuan, W.; Sun, Y.; Yan, W.; Zhao, M.; Henebry, G.M.; Fang, J. Contemporary evolution and scaling of 32 major cities in China. Ecol. Appl. 2018, 28, 1655–1668. [Google Scholar] [CrossRef] [PubMed]
  36. George, T.Y. China in Transition: Economic, Political, and Social Developments; University Press of America: Lanham, MD, USA, 1993; pp. 281–292. [Google Scholar]
  37. Bracken, G. Aspects of Urbanization in China: Shanghai, Hong Kong, Guangzhou; Amsterdam University Press: Amsterdam, The Netherlands, 2012; pp. 25–76. [Google Scholar]
  38. Ng, M.K. Shenzhen. Cities 2003, 20, 429–441. [Google Scholar] [CrossRef]
  39. Lv, Z.Q.; Wu, Z.F.; Wei, J.B.; Sun, C.; Zhou, Q.G.; Zhang, J.H. Monitoring of the urban sprawl using geoprocessing tools in the Shenzhen Municipality, China. Environ. Earth Sci. 2011, 62, 1131–1141. [Google Scholar] [CrossRef]
  40. Wu, Y.; Li, S.; Yu, S. Monitoring urban expansion and its effects on land use and land cover changes in Guangzhou city, China. Environ. Monit. Assess. 2016, 188, 54. [Google Scholar] [CrossRef]
  41. Yeung, G. Foreign Investment and Socio–economic Development: The Case of Dongguan; Springer: Berlin/Heidelberg, Germany, 2001; pp. 93–140. [Google Scholar]
  42. Shao, Q.; Liu, X.; Zhao, W. An alternative method for analyzing dimensional interactions of urban carrying capacity: Case study of Guangdong–Hong Kong–Macao Greater Bay Area. J. Environ. Manag. 2020, 273, 111064. [Google Scholar] [CrossRef]
  43. Wang, W.; Wu, T.; Li, Y.; Xie, S.; Han, B.; Zheng, H.; Ouyang, Z. Urbanization impacts on natural habitat and ecosystem services in the guangdong–hong kong–macao ˝megacity˝. Sustainability 2020, 12, 6675. [Google Scholar] [CrossRef]
  44. Dietzel, C.; Oguz, H.; Hemphill, J.J.; Clarke, K.C.; Gazulis, N. Diffusion and coalescence of the Houston Metropolitan Area: Evidence supporting a new urban theory. Environ. Plan. B Plan. Des. 2005, 32, 231–246. [Google Scholar] [CrossRef] [Green Version]
  45. Xu, C.; Liu, M.; Zhang, C.; An, S.; Yu, W.; Chen, J.M. The spatiotemporal dynamics of rapid urban growth in the Nanjing metropolitan region of China. Landsc. Ecol. 2007, 22, 925–937. [Google Scholar] [CrossRef]
  46. Sheng, N.; Tang, U.W. Zhuhai. Cities 2013, 32, 70–79. [Google Scholar] [CrossRef]
  47. Gong, J.; Chen, W.; Liu, Y.; Wang, J. The intensity change of urban development land: Implications for the city master plan of Guangzhou, China. Land Use Policy 2014, 40, 91–100. [Google Scholar] [CrossRef]
  48. Qian, J.; Peng, Y.; Luo, C.; Wu, C.; Du, Q. Urban land expansion and sustainable land use policy in Shenzhen: A case study of China’s rapid urbanization. Sustainability 2016, 8, 16. [Google Scholar] [CrossRef] [Green Version]
  49. Ma, L.J.C. Urban administrative restructuring, changing scale relations and local economic development in China. Political Geogr. 2005, 24, 477–497. [Google Scholar] [CrossRef]
  50. Shen, J. Scale, state and the city: Urban transformation in post–reform China. Habitat Int. 2007, 31, 303–316. [Google Scholar] [CrossRef]
  51. McGee, T.; Lin, G.C.; Wang, M.; Marton, A.; Wu, J. China’s Urban Space: Development Under Market Socialism; Routledge: Abington–Thames, UK, 2007; pp. 96–120. [Google Scholar]
  52. Chung, J.H.; Lam, T.C. China’s Local Administration: Traditions and Changes in the Sub–National Hierarchy; Routledge: Abington–on–Thames, UK, 2009; pp. 39–61. [Google Scholar]
  53. Guo, M.; Xu, Y.; Tian, Y. Spatial analysis of economic growth convergence mechanism in Beijing–Tianjin–Hebei Metropolitan Region. Geogr. Res. 2007, 26, 590–598. (In Chinese) [Google Scholar]
  54. Sun, Y.; Zhao, S. Spatiotemporal dynamics of urban expansion in 13 cities across the Jing–Jin–Ji urban agglomeration from 1978 to 2015. Ecol. Indic. 2018, 87, 302–313. [Google Scholar] [CrossRef]
  55. Li, Y. Resource Flows and the Decomposition of Regional Inequality in the Beijing–Tianjin–Hebei Metropolitan Region, 1990–2004. Growth Ch. 2012, 43, 335–357. [Google Scholar] [CrossRef] [Green Version]
  56. Ye, L. State–led metropolitan governance in China: Making integrated city regions. Cities 2014, 41, 200–208. [Google Scholar] [CrossRef]
  57. Li, Y.; Wu, F. The emergence of centrally initiated regional plan in China: A case study of Yangtze River Delta Regional Plan. Habitat Int. 2013, 39, 137–147. [Google Scholar] [CrossRef]
  58. Fang, C. Important progress and future direction of studies on China’s urban agglomerations. J. Geogr. Sci. 2015, 25, 1003–1024. [Google Scholar] [CrossRef] [Green Version]
  59. Shen, J. Urban and regional development in post–reform China: The case of Zhujiang delta. Prog. Plan. 2002, 57, 91–140. [Google Scholar] [CrossRef]
Figure 1. The location and administrative divisions of the study area: (A) Guangdong province in China, (B) the seven cities in the Pearl River Delta Urban Agglomeration, and (C) the topography (from NASA Digital Elevation Model data) of seven cities and the main rivers across them.
Urbansci 05 00011 g001
Figure 2. The spatial distribution of urban extent of seven cities from 1980 to 2015: (A) Dongguan, (B) Shenzhen, (C) Zhongshan, (D) Foshan, (E) Zhuhai, (F) Guangzhou, (G) Jiangmen. Dark grey represents the location of existing urban land at the initial study period and the distribution of newly urbanized areas are displayed in colors with 5–year intervals.
Urbansci 05 00011 g002
Figure 3. The temporal dynamics of landscape metrics for urban land in seven cities from 1980 to 2015: (A) Percentage of Landscape (PLAND) (%), (B) Largest Patch Index (LPI) (%), (C) Landscape Shape Index (LSI), (D) Number of Patches (NP), (E) Patch Density (PD) (N/100 ha), and (F) Mean Patch Size (MPS) (ha).
Urbansci 05 00011 g003
Figure 4. The temporal evolution of proportional composition of three urban growth types (edge–expansion, infilling, and leapfrogging), calculated from their number of patches in seven cities during 1980–2015.
Urbansci 05 00011 g004
Figure 5. The frequency distribution of patch number in different grades of urban land patch size in seven cities from 1980 to 2015: (A) Dongguan, (B) Foshan, (C) Guangzhou, (D) Jiangmen, (E) Shenzhen, (F) Zhongshan, (G) Zhuhai. Dynamics of patch number at a given size, especially the smallest and largest size categories, could reveal temporal evolution of the urban land structure (e.g., diffusion–coalescence and urban core).
Urbansci 05 00011 g005
Figure 6. The temporal evolution of rankings for seven cities from 1980 to 2015, in terms of four indicators: (A) population, (B) urban land area, (C) population per unit urban land area, (D) regional GDP per unit urban land area.
Urbansci 05 00011 g006
Figure 7. Momentous policies in cities of the Pearl River Delta (PRD) (collected from official documents published by the local governments for land management and social development). The land use plan of each city has something uniform, such as optimizing the structure and efficiency of land use; there are also certain differences, such as strict prohibition of development activities in ecological protection zones (i.e., Jiangmen) and priority for infrastructure land development (i.e., Zhongshan).
Urbansci 05 00011 g007
Table 1. The basic conditions of the seven major cities in the Pearl River Delta Urban Agglomeration (data acquired from Urban Agglomeration in the Pearl River Delta Yearbook 2016).
DongguanFoshanJiangmenGuangzhouShenzhenZhongshanZhuhai
Latitude (N)22°39′–23°09′22°23′–23°16′21°27′–22°51′22°26′–23°56′22°24′–22°52′22°11′–22°47′21°48′–22°27′
Longitude (E)113°31′–114°15′112°17′–113°14′111°59′–113°15′112°57′–114°03′113°46′–114°37′113°09′–113°46′113°03′–114°19′
Area (km2)2465387595057434199717831711
Population in 2016 (Million)8.37.44.513.511.43.21.6
GDP in 2016 (Billion RMB)627.5800.3224.01810.01750.3301.0202.5
Table 2. Information of used remoting sensing data (original data acquired from NASA).
CitiesPath/RowDatePath/RowDate
(WRS2) MSS1980(WRS2) TM(ETM+)
(OLI/TRIS)
199019952000200520102015
Dongguan131/441979/10/19122/441990/12/241994/10/242000/09/142005/07/182009/11/022015/10/18
Foshan131/441979/10/19122/441990/12/241994/10/242000/09/142005/07/182009/11/022015/10/18
132/441979/10/20123/441990/09/021994/09/292000/10/312005/09/122009/11/252015/04/16
Guangzhou131/431975/11/18122/431991/02/021995/12/302000/11/012005/11/232010/10/28
131/441975/11/18122/441990/10/131995/12/302000/11/012005/11/232010/10/28
Jiangmen131/441979/10/19122/441990/12/241994/10/242000/09/142005/07/182009/11/022015/10/18
131/451978/11/02122/451990/12/241994/10/242000/09/142005/07/182009/11/022014/11/16
132/441979/10/20123/441990/09/021994/09/292000/10/312005/09/122009/11/252015/04/16
132/451980/10/14123/451990/09/021993/10/222000/10/312005/09/112009/11/252015/04/16
Shenzhen130/441977/10/19121/441991/10/091995/12/231999/11/242004/10/122009/10/18
131/441975/11/18122/441990/10/131995/12/301999/11/152005/11/232010/10/28
131/451978/11/02
Zhongshan131/441978/10/19122/441991/10/091995/12/302000/09/042005/07/182009/11/022015/10/18
131/451978/11/02122/451990/12/241994/10/242000/09/142005/07/182009/11/022014/11/16
Zhuhai131/441979/10/19121/451989/07/151992/10/112000/01/032005/03/052010/01/142015/08/08
131/451978/11/02122/441990/12/241994/10/242000/09/142005/07/182009/11/022015/10/18
122/451990/12/241994/10/242000/09/142005/07/182009/11/022014/11/16
Table 3. Summary of accuracy assessment for classification results using the Kappa coefficient.
DongguanFoshanGuangzhouJiangmenShenzhenZhongshanZhuhai
Prior 20150.880.840.800.800.820.920.88
20150.900.840.880.840.900.900.92
Table 4. Landscape metrics used in this study, adopted from McGarigal [31].
AcronymFull Name of Metric (Units)Description
Area MetricPLANDPercentage of Landscape (%)The percentage of the landscape comprised by the corresponding patch type
LPILargest Patch Index (%)The percentage of the landscape comprised by the largest patch
Shape MetricLSILandscape Shape IndexThe total length of patch perimeter divided by that of a landscape with a standard shape (square) of the same size
Quantity MetricNPNumber of PatchesThe number of patches
PDPatch Density (N/100 ha)The number of patches divided by total landscape area
MPSMean Patch Size (ha)The average area of patch size
Table 5. Annual Growth (AG) in urban area (km2) and Annual Increase Rate (AIR) (%) of seven cities among six neighboring periods from 1980 to 2015.
City1980–19901990–19951995–20002000–20052005–20102010–2015
AG (km2)Dongguan4.728.329.629.130.759.8
Foshan7.713.012.712.136.9102.0
Guangzhou15.125.834.245.683.665.3
Jiangmen7.330.216.537.139.633.5
Shenzhen12.531.024.234.434.016.2
Zhongshan1.011.311.016.143.923.4
Zhuhai2.13.91.410.03.920.7
Region66.4113.1145.7195.5189.6443.4
AIR (%)Dongguan5.8319.2110.236.375.207.42
Foshan15.2810.436.754.6810.6315.55
Guangzhou9.797.397.146.798.644.81
Jiangmen12.5020.356.129.356.944.45
Shenzhen19.3813.326.887.245.252.04
Zhongshan4.6925.5811.5510.0716.355.30
Zhuhai10.969.482.5412.963.3812.75
Region11.215.17.38.28.17.5
Publisher’s Note: MDPI stays neutral with regard to jurisdictional claims in published maps and institutional affiliations.

