Article

Towards an Even More Spatially Diversified City? New Metropolitan Population Trends in the Post-Economic Crisis Period

by
Fernando Gil-Alonso
1,*,
Cristina López-Villanueva
2,
Jordi Bayona-i-Carrasco
1,3 and
Isabel Pujadas
1
1
Department of Geography, University of Barcelona, 08001 Barcelona, Spain
2
Department of Sociology, University of Barcelona, 08034 Barcelona, Spain
3
Centre for Demographic Studies, Autonomous University of Barcelona, 08193 Bellaterra (Barcelona), Spain
*
Author to whom correspondence should be addressed.
Submission received: 1 March 2021 / Revised: 26 April 2021 / Accepted: 4 May 2021 / Published: 14 May 2021
(This article belongs to the Special Issue Fragmented City: International Mobility and Housing in Spain)

Abstract

:
After the deep economic crisis that began in 2008, in 2014, Spain started to show signs of recovery, entering the so-called “post-crisis” period. Though it has not yet reached the entire population, economic improvement has had a positive impact on the real estate market, economic activity, and employment. Residential mobility has also increased, but flows have become more unstable and complex. The direction of these flows, the reasons for moving, and the ages and socioeconomic categories of migrants have diversified. These complex “new mobility” patterns are reconfiguring the spatial distribution of the population in Spanish urban areas. On the basis of Continuous Register (Padrón Continuo) microdata, this paper primarily aims to study population changes in the 69 Spanish functional urban areas (FUAs) defined by the National Institute of Statistics (INE)/Eurostat, focusing on their population growth or decline in their centers and peripheries during the crisis (2011–2015) and post-crisis (2015–2019) phases. Then, the paper analyzes the five major Spanish metropolises (Madrid, Barcelona, Valencia, Seville, and Bilbao) in greater depth. The findings confirm the hypothesis that, during the post-crisis period, the population growth of cores and rings and thus the spatial distribution of urban inhabitants have been changing, resulting in the growing demographic heterogeneity of Spanish urban areas that are diversifying both internally and compared to each other.

1. Introduction

The economic growth that Spain was experiencing after the mid-1990s abruptly ended in 2008 because of the global economic and financial crises. These exacerbated deindustrialization and globalization processes and favored inequality, which has grown in recent decades in both Spain and the majority of other capitalist countries [1]. In fact, this recession was partly caused by global financial markets that intended to maximize short-term benefits by investing in a secondary accumulation market linked to urban space production. These massive financial transactions targeted housing markets and produced a real estate bubble that, when it burst, triggered an economic recession in Spain, with the public and private debt crisis being another component. This observed urban basis of the economic crisis explains why the most negative effects were concentrated in large cities, reflecting the vulnerability of urban spaces [2].
This economic recession also affected international migration, Spain’s main driver of population and urban growth, at the beginning of the 21st century. The previous highly positive migratory growth became negative [3], return flows slightly increased, and the number of young Spaniards moving to other European countries also rose. In addition, the economic crisis had an impact on residential mobility by reducing suburbanization flows [4,5] and increasing the attractiveness of urban cores [6,7].
The literature on the effects of the economic expansion and crisis on residential flows and urban dynamics extensively covers the Spanish context [4,5,8,9,10], particularly its two main urban regions, Madrid and Barcelona [11,12,13,14,15,16,17]. However, few studies have analyzed the consequences of the post-crisis economic recovery on urban dynamics.
Indeed, in 2014, the country started to show signs of economic recovery [18]. Economic activity and employment levels progressively rose, which had an impact on the real estate market [19]. Simultaneously, residential mobility levels seemed to recover while socio-residential strategies began to diversify [20], subsequently transforming interactions between intra-metropolitan spaces [21].
Thus, together with changes in the economic cycle, Spanish urban areas shifted from unprecedented population growth to stagnation and once again, more recently, to a new population growth phase that abruptly ended due to the impact of the COVID-19 pandemic. Still a scarcely studied period, this brief recovery phase between around 2014 and March 2020, the period studied herein, seems to have its own specificities. Residential mobility flows did not regain their pre-economic crisis characteristics, becoming more unstable, complex, and fragmentary [22]. This means that the direction of movement, migrants’ reasons for moving, their socio-economic categories, and their ages all diversified, as did their impacts on Spanish urban cores and rings.
Therefore, our primary hypothesis is that, during the post-crisis period, Spanish urban areas experienced a great diversity of situations regarding the population growth of their cores and rings and that of whole metropolises. In other words, some city cores grew more than their peripheries, while, in other cases, suburbanization prevailed. At the same time, although the metropolitan population as a whole rose (again) in some areas, it continued to decline in others, as in the previous crisis period. Analyzing the population growth in Spanish urban areas while establishing a typology based on the increase and decline in core and peripheral populations, both in the economic crisis and post-crisis phases, is the first aim of this paper.
A secondary objective is to study the population growth and decline in the municipalities of the five largest Spanish metropolises for the same two four-year periods. Whereas the first part of the paper focuses on whether population change was diversifying among Spanish metropolitan areas in the post-crisis period, the second part analyzes whether this population growth heterogeneity increased within them.

2. Theoretical Background

Uneven population growth between the core and ring, this paper’s main subject, has been extensively studied and modeled, giving rise to the stages defined by the urban development model [23,24,25,26]. In short, the model claims that urban areas go through a series of successive stages depending on whether cores or rings grow and on whether the entire urban area increases or decreases. Therefore, the following four stages are extracted from the model: (1) urbanization or centralization; (2) suburbanization or decentralization, (3) desurbanization or counterurbanization, and (4) reurbanization. These four phases are also cyclical, returning to the first phase after the end of the fourth. This cyclical model also helps to explain internal migration between urban centers and peripheries, as core–periphery interactions are reconfigured at each urban population growth phase [27,28]. However, this model has been heavily criticized because empirical research has shown that it presents some major drawbacks [29,30,31,32]. For example, many urban areas show non-linear trajectories [29]; that is to say, the four phases do not always follow one another in the order that the model indicates [30]. Moreover, in a given country, some urban areas can be in the suburbanization phase while others are reurbanizing [31]. Simultaneously, it can include instances of both urban growth and shrinkage [32,33]. This diversity among urban areas, which is not explained by the model, can also be found within urban areas, as many suburban towns grow while the populations in their urban cores recover. This simultaneous suburbanization and recentralization may be caused by peripheries receiving inhabitants from city cores, which, in turn, are growing because of immigration from outside the urban area. These external flows are not adequately captured by the theoretical model of cyclical urban growth, which treats urban regions as closed systems. However, international migrants are not the only ones attracted to urban cores. Other groups, such as young adults, non-family households, and some parts of the middle to upper classes, have also shown a preference for living in city centers in the last decades, whereas young couples with children still tend to move to suburban peripheries. The residential behaviors of families explain why population growth is still higher in the suburbs than in the city cores in most urban areas [30].
Therefore, patterns of population growth and decline in different urban areas and within major metropolitan areas (in cores versus rings) cannot be explained by a cyclical urbanization model but rather by a series of external factors acting on urban areas. For example, economic development and, more specifically, economic cycle phases (expansion, crisis, recession, and recovery) influence urban growth and decline in multiple ways. They act directly through their influence on natural growth [34,35] and, above all, on internal and external migratory growth [21,22]. However, they also have an indirect effect on other mechanisms, such as the housing market, the labor market, family transformations, and changes in socio-residential patterns.
Starting with the housing market, urban development in general and residential and international migration flows in particular are highly dependent on the institutional factors affecting the way that housing market mechanisms function [36], including mortgage access [37] and public housing policies [38,39]. In fact, they are all conditioned by the current economic cycle phase of the country. For example, in Spain, as in other European Mediterranean countries, it is considerably difficult for young people, as well as certain immigrant groups, to afford housing [40]. These difficulties worsened when the economic crisis subsided because of rising purchase and rental prices, particularly in large cities [41]. Although household construction slightly picked up and it was easier to get a mortgage during the post-crisis period, these changes were not able to compensate for this housing affordability problem. On the contrary, financial globalization has favored a rise in prices since housing has become an attractive investment option for small investors and particularly for large funds, rather than satisfying a basic need [42,43]. In some large city neighborhoods, the transformation of dwellings into a financial asset has intensified gentrification [44]. Tourist pressure or “touristification” has also become an additional constraint [45,46,47,48] that causes that part of the housing stock is no longer used for residential purposes but rather for tourism demands, thereby reducing the housing supply. All of these processes linked to the housing market have led to a price rise, especially in large cities, resulting in increased residential mobility. Indeed, the growing problems related to housing accessibility and affordability in urban centers have displaced some of their residents, especially in the most attractive neighborhoods. This could be a possible explanation, at least in part, for the renewed native and immigrant population suburbanization flows that occurred during the post-crisis period. For example, after recentralizing during the economic crisis years, Latin American immigrants decentralized once again during the recovery years [49].
The labor market and, more specifically, the impact of economic cycles on the levels of labor insertion of foreign immigrants and native workers have also influenced changes in urban population via international and internal mobility [33]. There are two opposing hypotheses on this issue. The first, based on the “buffer theory” [50,51,52], claims that foreigners act as buffers that absorb labor market tensions. Therefore, during economic growth phases, the number of immigrants rises as a response to an increasing demand for workers. However, in deep economic crisis periods, they are expelled from the labor market in greater numbers than native workers. By contrast, the second hypothesis [53], based on a “new migration model” [54], maintains that, in developed countries, labor markets constantly need foreign workers to fill low-wage and unstable jobs. With this hypothesis, these immigrants, mainly from developing countries, replace national workers, even during recession periods. This is especially the case in countries with highly dual labor markets [55], such as those of Southern Europe in general [56] and Spain in particular [57,58], where foreign immigrants have filled occupational niches in low-added-value economic sectors, such as construction, tourism, intensive agriculture, and the care of elderly people.
Which hypothesis best explains foreign immigrants’ behavior in Spain during the 2008 economic crisis? Evidence shows that migrants behaved differently depending on their origin. On the one hand, Africans and Asians seem to have responded better to the “new migratory model,” as they have barely left Spain: Quite to the contrary, their numbers increased during that period. On the other hand, the “buffer theory” seems to better explain the behavior of Europeans and, particularly, Latin Americans [59]. The latter immigrant group left Spain in the greatest numbers during the economic crisis, either returning to their homeland or moving to a third country [60]. Similarly, Latin Americans are also the origin group for which the number of entries to Spain increased the most during the post-crisis period. This shows their great capacity to adapt to economic cycles and, therefore, to impact population growth and decline in Spanish urban areas, where they tend to concentrate.
In addition, due to their greater labor and housing instability, foreign immigrants, who have lower rates of home ownership, have higher internal migration rates compared to natives [61,62]. Indeed, due to the economic recession, many foreigners either changed their places of residence inside the country, migrating to provinces that suffered less from the economic crisis, or moved from one metropolitan municipality to another. Research carried out in the metropolitan areas of Barcelona and Madrid has shown that there was a recentralization of foreign migrants, particularly Latin Americans, as urban cores had more rental housing stocks, better public transport, and more jobs than peripheral municipalities. These features also explain the increasing attractiveness of urban cores and the reduced suburbanization flows among Spaniards during the recession period. The end of the economic crisis stimulated new suburbanization flows by these groups, which had already been moving to peripheries during the years of economic expansion before 2008 [4,5,49].
Nevertheless, residential mobility does not only respond to temporary fluctuations in the economic cycle. On the contrary, it varies for different reasons, some of which are more structural in nature. This is the case, for instance, of residential moves related to biographical events, that is, address changes caused by life course transitions, such as leaving parental homes, couple formation, birth of a new child, or retirement [63,64]. Another example is household and family transformations linked to the Second Demographic Transition model [65]. The increasing numbers of union break-ups [66] and of more unstable household types, such as single-parent and one-person households [67], among other changes, influence people’s residential mobility decisions. Classical contributions, such as Frey and Kobrin [68] or Buzar et al. [69], have provided in-depth knowledge on such issues. Finally, other authors have underlined that family relations, called entourage by Bonvalet and Lelièvre [70], also have an impact on migration. This would be the case for residential movements seeking family support.
These two connected factors—the increasing numbers of life cycle transitions and of more unstable household types compared to previous decades—could lead to the hypothesis that residential mobility has increased around the world. However, this is not the case for all types of mobility or for all geographical contexts [71]. For example, in some developed countries, residential mobility rates are presently lower than before [72]. In Spain, residential mobility levels have traditionally been lower than those of other European countries, and they decreased even more during the recession years, largely because fewer foreign immigrants (who change addresses more frequently than Spaniards) were arriving in Spain and fewer natives were leaving their parental homes and forming new families. The latter was caused by the “empty” cohorts—those born in the decades of low fertility (1980s and 1990s)—reaching adulthood [62].
Along with changes in housing and labor markets and family transformations, urban mobility has also been influenced by socio-residential pattern modifications. This relationship works in both directions since residential changes between (or within) cores and rings also modify the demographic and social composition of the different parts of urban areas [73]. In addition to population growth and decline (this paper’s main subject), mobility flows cause changes in age structure (rejuvenation or aging [74]) and have an impact on socioeconomic spatial distribution patterns, which can be measured by social class, income, or education level.
Several studies show the existing interaction between residential mobility and the spatial distribution patterns of the urban population by the socioeconomic characteristics of residents. In other words, it is a determinant of segregation and polarization processes in urban areas [75,76,77]. The literature analyzing urban socio-residential segregation in Spain’s metropolitan areas is relatively extensive. Several recent studies focused on the cases of Barcelona and Madrid (either the cities or the whole metropolitan areas) [39,78,79,80,81,82] or analyzed the case of Catalonia [83]. However, few have related socio-residential restructuration dynamics to residential mobility patterns [84,85], and most of them have focused on specific case studies: Madrid [17], Barcelona [86,87], Paris [88], or Buenos Aires [89], among others.
Similar to segregation, socio-spatial polarization is also produced by socioeconomic inequality. This polarization is related to urban space through mechanisms and structures, such as the way that the productive system works, existing social structure tensions, wealth distribution policies, and, as already mentioned, real estate market characteristics and housing policies [90]. In this sense, certain authors have claimed that rising socio-spatial polarization has produced a process called “the suburbanization of poverty,” leading to increased wealth in urban cores to the detriment of peripheries [73]. Some researchers have analyzed it as an independent phenomenon [91,92], while others have related it to gentrification [76,93]. This issue is not addressed in this paper. However, if the suburbanization of poverty is confirmed, the resulting greater spatial polarization could be related, as both a cause and a consequence, to growing intra-metropolitan residential mobility levels in the post-crisis period, to which the COVID-19 health crisis put an end.

3. Data and Methodology

The main aim of this paper is to study the demographic reconfiguration of Spanish urban regions during the post-crisis period from a municipal perspective. To this end, current population dynamics are compared to those of the previous economic crisis phase, focusing on the population growth or decline in the metropolitan city core and periphery. The criterion used to define the spatial units analyzed in this paper is that of functional urban areas (FUA) set by the Spanish National Institute of Statistics (INE, Madrid, Spain) and Eurostat. A functional urban area is a group of municipalities around a city, linked to it by commuting. The delimitation of FUAs considers the main city and its area of influence, or hinterland, as an integrated labor market and consumption area. Commuting between a city and its neighboring municipalities has been used to set the limits of the area of influence. The main selection criterion for a municipality is that at least 15% of its residents move daily to the city to work or study. There are exceptions to the general rule for very small municipalities. Though commuting remains the main criterion, others, such as contiguity, are also taken into account. The number of FUAs with more than 100,000 inhabitants has increased in Spain, from 45 in 2011 to 69 in 2019, which are analyzed in this paper. The advantage of using this definition is that it allows comparisons with the rest of the European urban areas [94].
The present research used microdata from the Padrón Continuo, an administrative population register that records each municipality’s residents, as its main data source. The National Institute of Statistics (INE) coordinates the collection and depuration of local data and publishes official population figures on 1 January every year. It also offers basic population data on the age, sex, place of birth, and nationality for all Spanish municipalities.
Cumulative annual growth rates (CAGRs) were calculated for both periods discussed in this paper. The first, ranging from 1 January 2011 (the highest population figures around the beginning of the economic crisis) to 1 January 2015 (the lowest population figures around the end of the crisis), is called the “crisis phase” in this paper; the second, lasting from 1 January 2015 to 1 January 2019 (the last official data available at the time of writing the paper), is the “post-crisis” phase.
The following formula was used to calculate the cumulative annual growth rates:
r = P i + n P i n 1 100
where n represents the number of years, Pi is the initial population, and Pi+n is the final population of the area under study.

4. Results

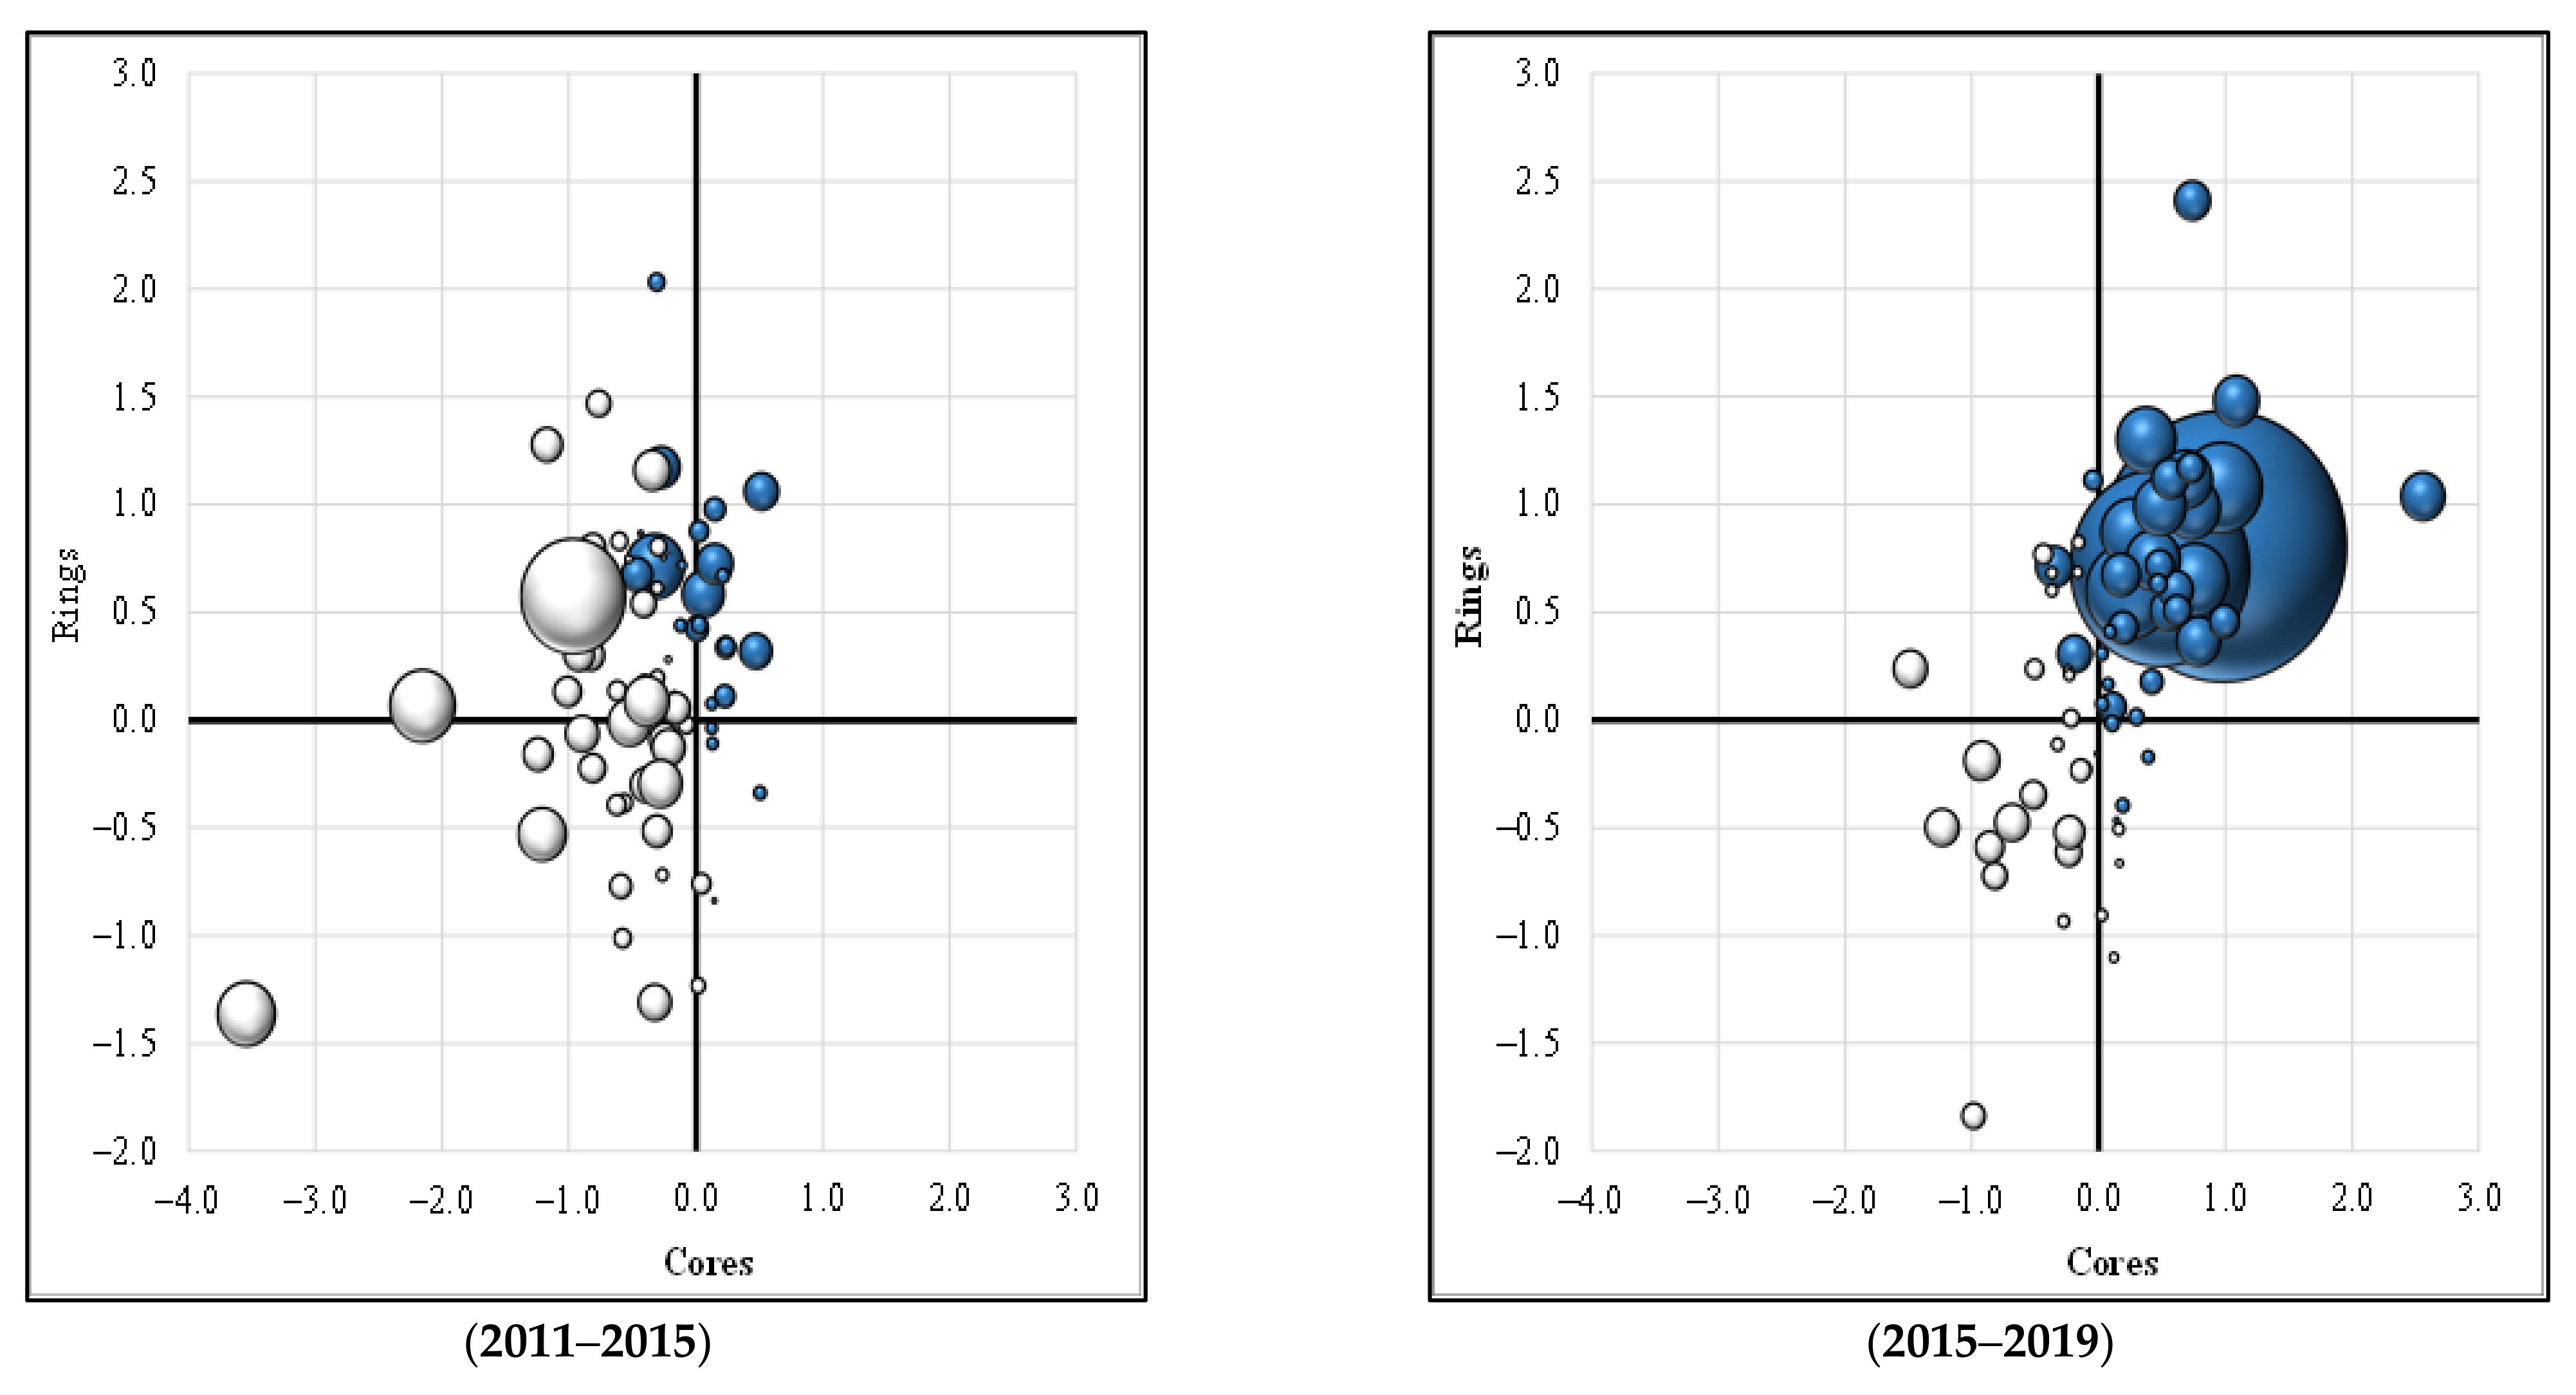
4.1. Population Growth in the 69 FUAs: Growing Diversity among Urban Areas

4.1.1. Urban Cores versus Peripheries: Comparing Economic Crisis and Post-Crisis Phases

Figure 1 shows annual growth rates for metropolitan cores and peripheries in both periods analyzed (for the complete dataset, see Appendix A, Table A1). Very significant and outstanding differences can be observed between the two intervals. In the economic crisis phase, most Spanish FUAs lost population (white spheres). Only 23 out of the 69 FUAs analyzed gained inhabitants (blue spheres). The largest group, containing 33 cases, experienced a combination of urban core population loss and peripheral population growth. In another 18 metropolitan areas, both cores and suburban municipalities lost population. There were just 12 cases where both areas of the FUAs gained residents, and only six urban cores grew as their peripheries lost inhabitants. In sum, between 2011 and 2015, the 69 FUAs lost residents, as they had a CAGR of −0.10%, and although the population of the periphery grew by 0.31%, that of urban cores decreased by −0.44%.
Although there were multiple circumstances, the deurbanization stage was the most common in the Spanish FUAs during the economic crisis phase. By contrast, in the post-crisis period, suburbanization (with relative decentralization, as rings acquired more inhabitants than cores) was the predominant urban stae. As a whole (taking cores and peripheries together), the 69 FUAs had an annual growth of 0.44% between 2015 and 2019, as cores increased by 0.32% and peripheries grew by slightly more (0.59%). In the vast majority of cases (40 out of the 69 FUAs analyzed), population growth became positive in this period, and in 32 of them, both city cores and their peripheries grew. At the other end of the spectrum, 29 FUAs lost population, and in 15 of them, both urban core and ring populations decreased simultaneously. By contrast, 14 city cores lost inhabitants, whereas their peripheral municipalities did not. Finally, the opposite phenomenon occurred in the eight remaining cases. Therefore, the general picture is especially diverse, resulting in multiple timing and (positive and negative) population growth combinations in urban cores and peripheries. Algeciras, Almería, Girona, Lleida, Málaga, Marbella, Santiago de Compostela, Toledo, and Vitoria were the only nine FUAs in which the populations of both areas of the FUAs increased throughout the whole period analyzed. By contrast, in Ávila, Avilés, Cádiz, Córdoba, Cuenca, Ferrol, Gijón, Linares, Oviedo, and Ponferrada (10 FUAs), both city cores and suburban municipalities lost population throughout the entire timeframe under examination.
Figure 2 presents the same data shown in Figure 1 from a new perspective, with graphs now focusing on differences between cores and peripheries. The data show that, in 24 out of the 51 urban cores that lost population during the economic crisis phase, growth was positive in the second period. This means that most of them, namely, 27 cities, all situated in FUAs where growth was negative (white spheres), continued to lose population. In the opposite quadrant, blue spheres show where FUA growth was positive: Nearly all urban cores that gained population during the economic crisis phase (16 out of 18) continued to grow in the post-crisis period. Cartagena and Jerez, the only two exceptions, reversed their previous trend. As for peripheries, those that grew in the economic crisis phase continued to do so during the post-crisis period and, in fact, experienced much greater increases than urban cores. Those that decreased in the first period continued to do so, though at a slower pace than cores.

4.1.2. Spanish FUA Classification: Many Diversifying Realities

In addition to core–periphery differences, Spanish urban areas can also be grouped according to their recent population changes.
(1)
The first group—“shrinking cities”—contains the 26 areas that lost population in the two periods under study. Ávila, Cáceres, Gijón, Linares, Lugo, and Pontevedra peripheries lost more population than their urban cores in both periods. Similarly, Benidorm, Córdoba, and Oviedo peripheries lost more population than urban cores, but only during the most recent period under examination. However, in the rest of the FUAs (Alcoy, Avilés, Burgos, Cádiz, Cuenca, Ferrol, Jaén, León, Ourense, Palencia, Ponferrada, Salamanca, Santander, Talavera, Torrevieja, Valladolid, and Zamora), urban cores lost more population than their suburban municipalities.
(2)
The second group—“dynamic cities”—is formed by 20 FUAs in which growth was positive throughout both periods under analysis. Albacete, Badajoz, Santiago, and Vitoria were the four most dynamic urban cores of this group, growing more than their rings in both phases. Algeciras, Irún, and Murcia also followed similar trends, though only in the last period. However, suburbanization predominated in the rest of this category’s FUAs, namely, Almería, Ciudad Real, Donostia, Girona, Granada, Guadalajara, Huelva, Lleida, Málaga, Marbella, Pamplona, Seville, and Toledo. Seville stands out for being the only one of the five largest FUAs in Spain in this group.
(3)
This third group—“recovering cities”—also contains 20 FUAs that, despite losing population during the economic recession phase, regained it in the post-crisis period. The four largest Spanish FUAs (Barcelona, Bilbao, Madrid, and Valencia) belong to this group. Elche is the only urban area in which the city core grew more than its periphery in both periods analyzed. However, in Arrecife, Bilbao, Madrid, Manresa, Reus, Tarragona, and Vigo, this was only the case for the last period under examination. Suburbanization always predominated in the rest of this group’s FUAs: A Coruña, Alicante, Barcelona, Castellón, Logroño, Lorca, Palma de Mallorca, Las Palmas de Gran Canaria, Sagunto, Santa Cruz de Tenerife, Valencia, and Zaragoza.
(4)
The last group—“delayed cities”—has only three FUAs (Cartagena, Jerez, and Mérida), which gained population between 2011 and 2015 but lost inhabitants between 2015 and 2019. In Cartagena, peripheries were more dynamic than its core, whereas the opposite occurred in the other two FUAs (Jerez de la Frontera and Mérida) throughout both periods analyzed.
Hence, these results show that FUAs are now quite diverse, making it harder to establish general urban development guidelines. However, all of their growth figures are now much lower than those at the beginning of the 21st century.

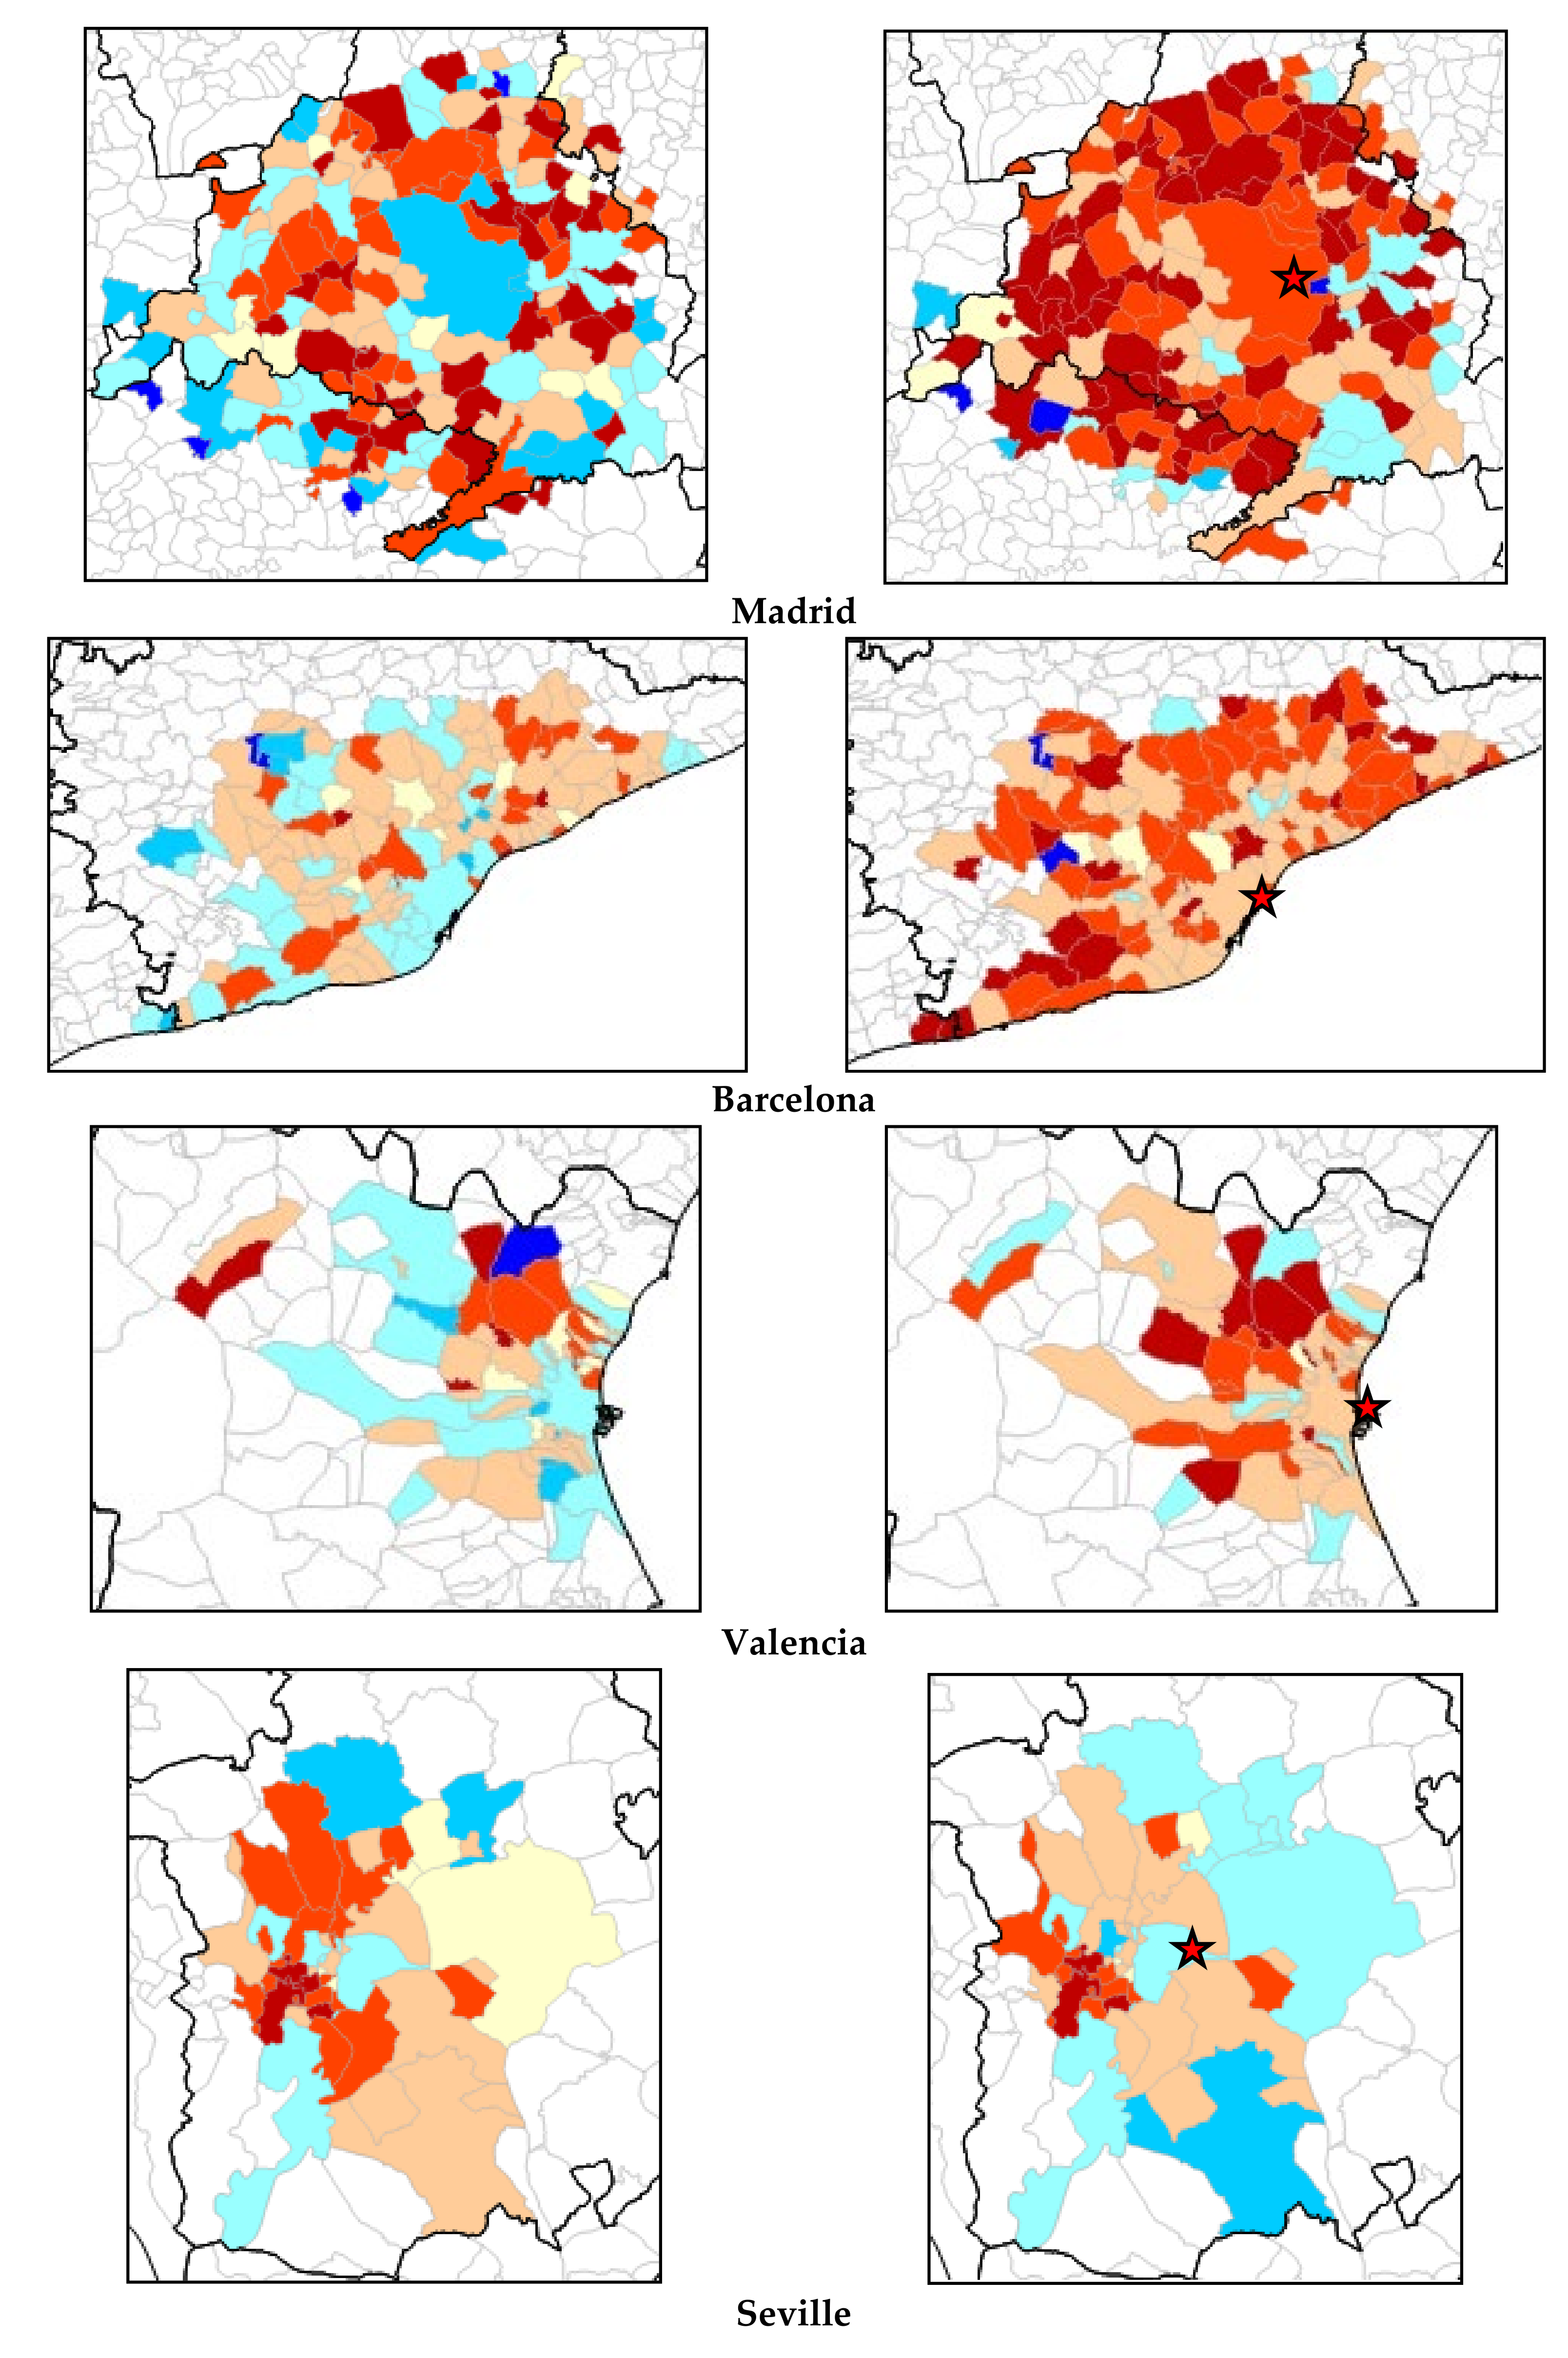
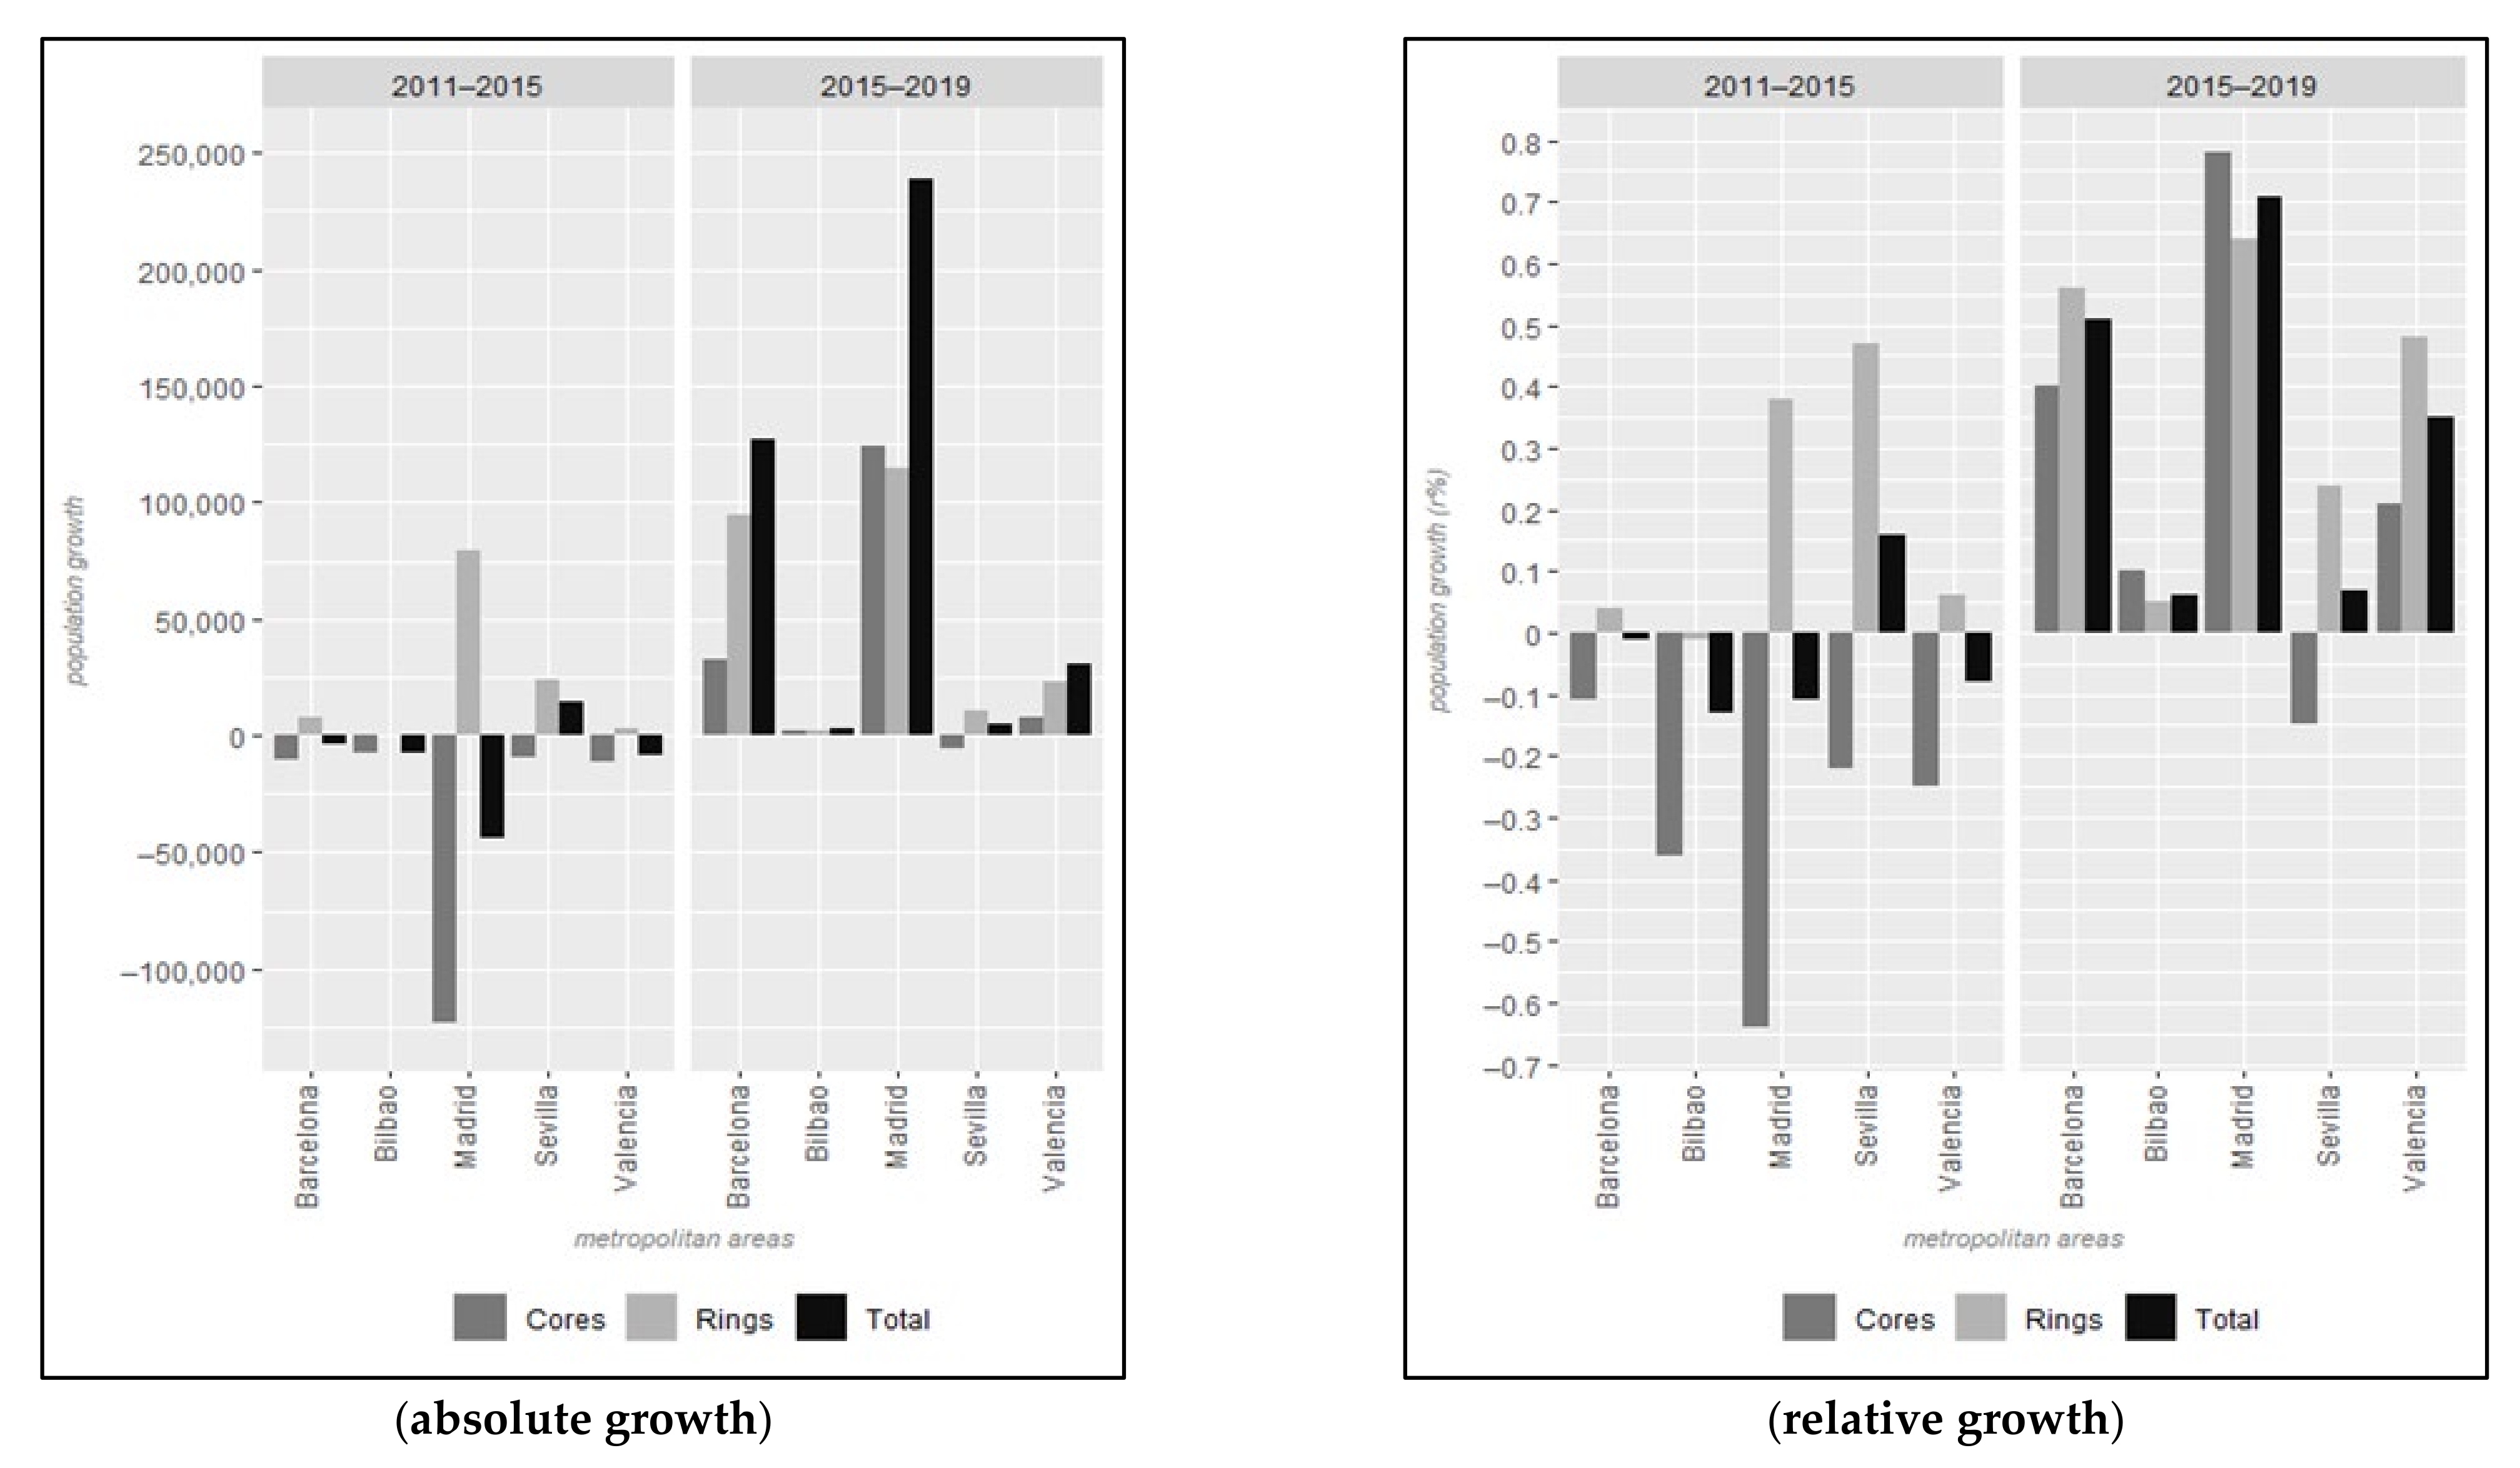
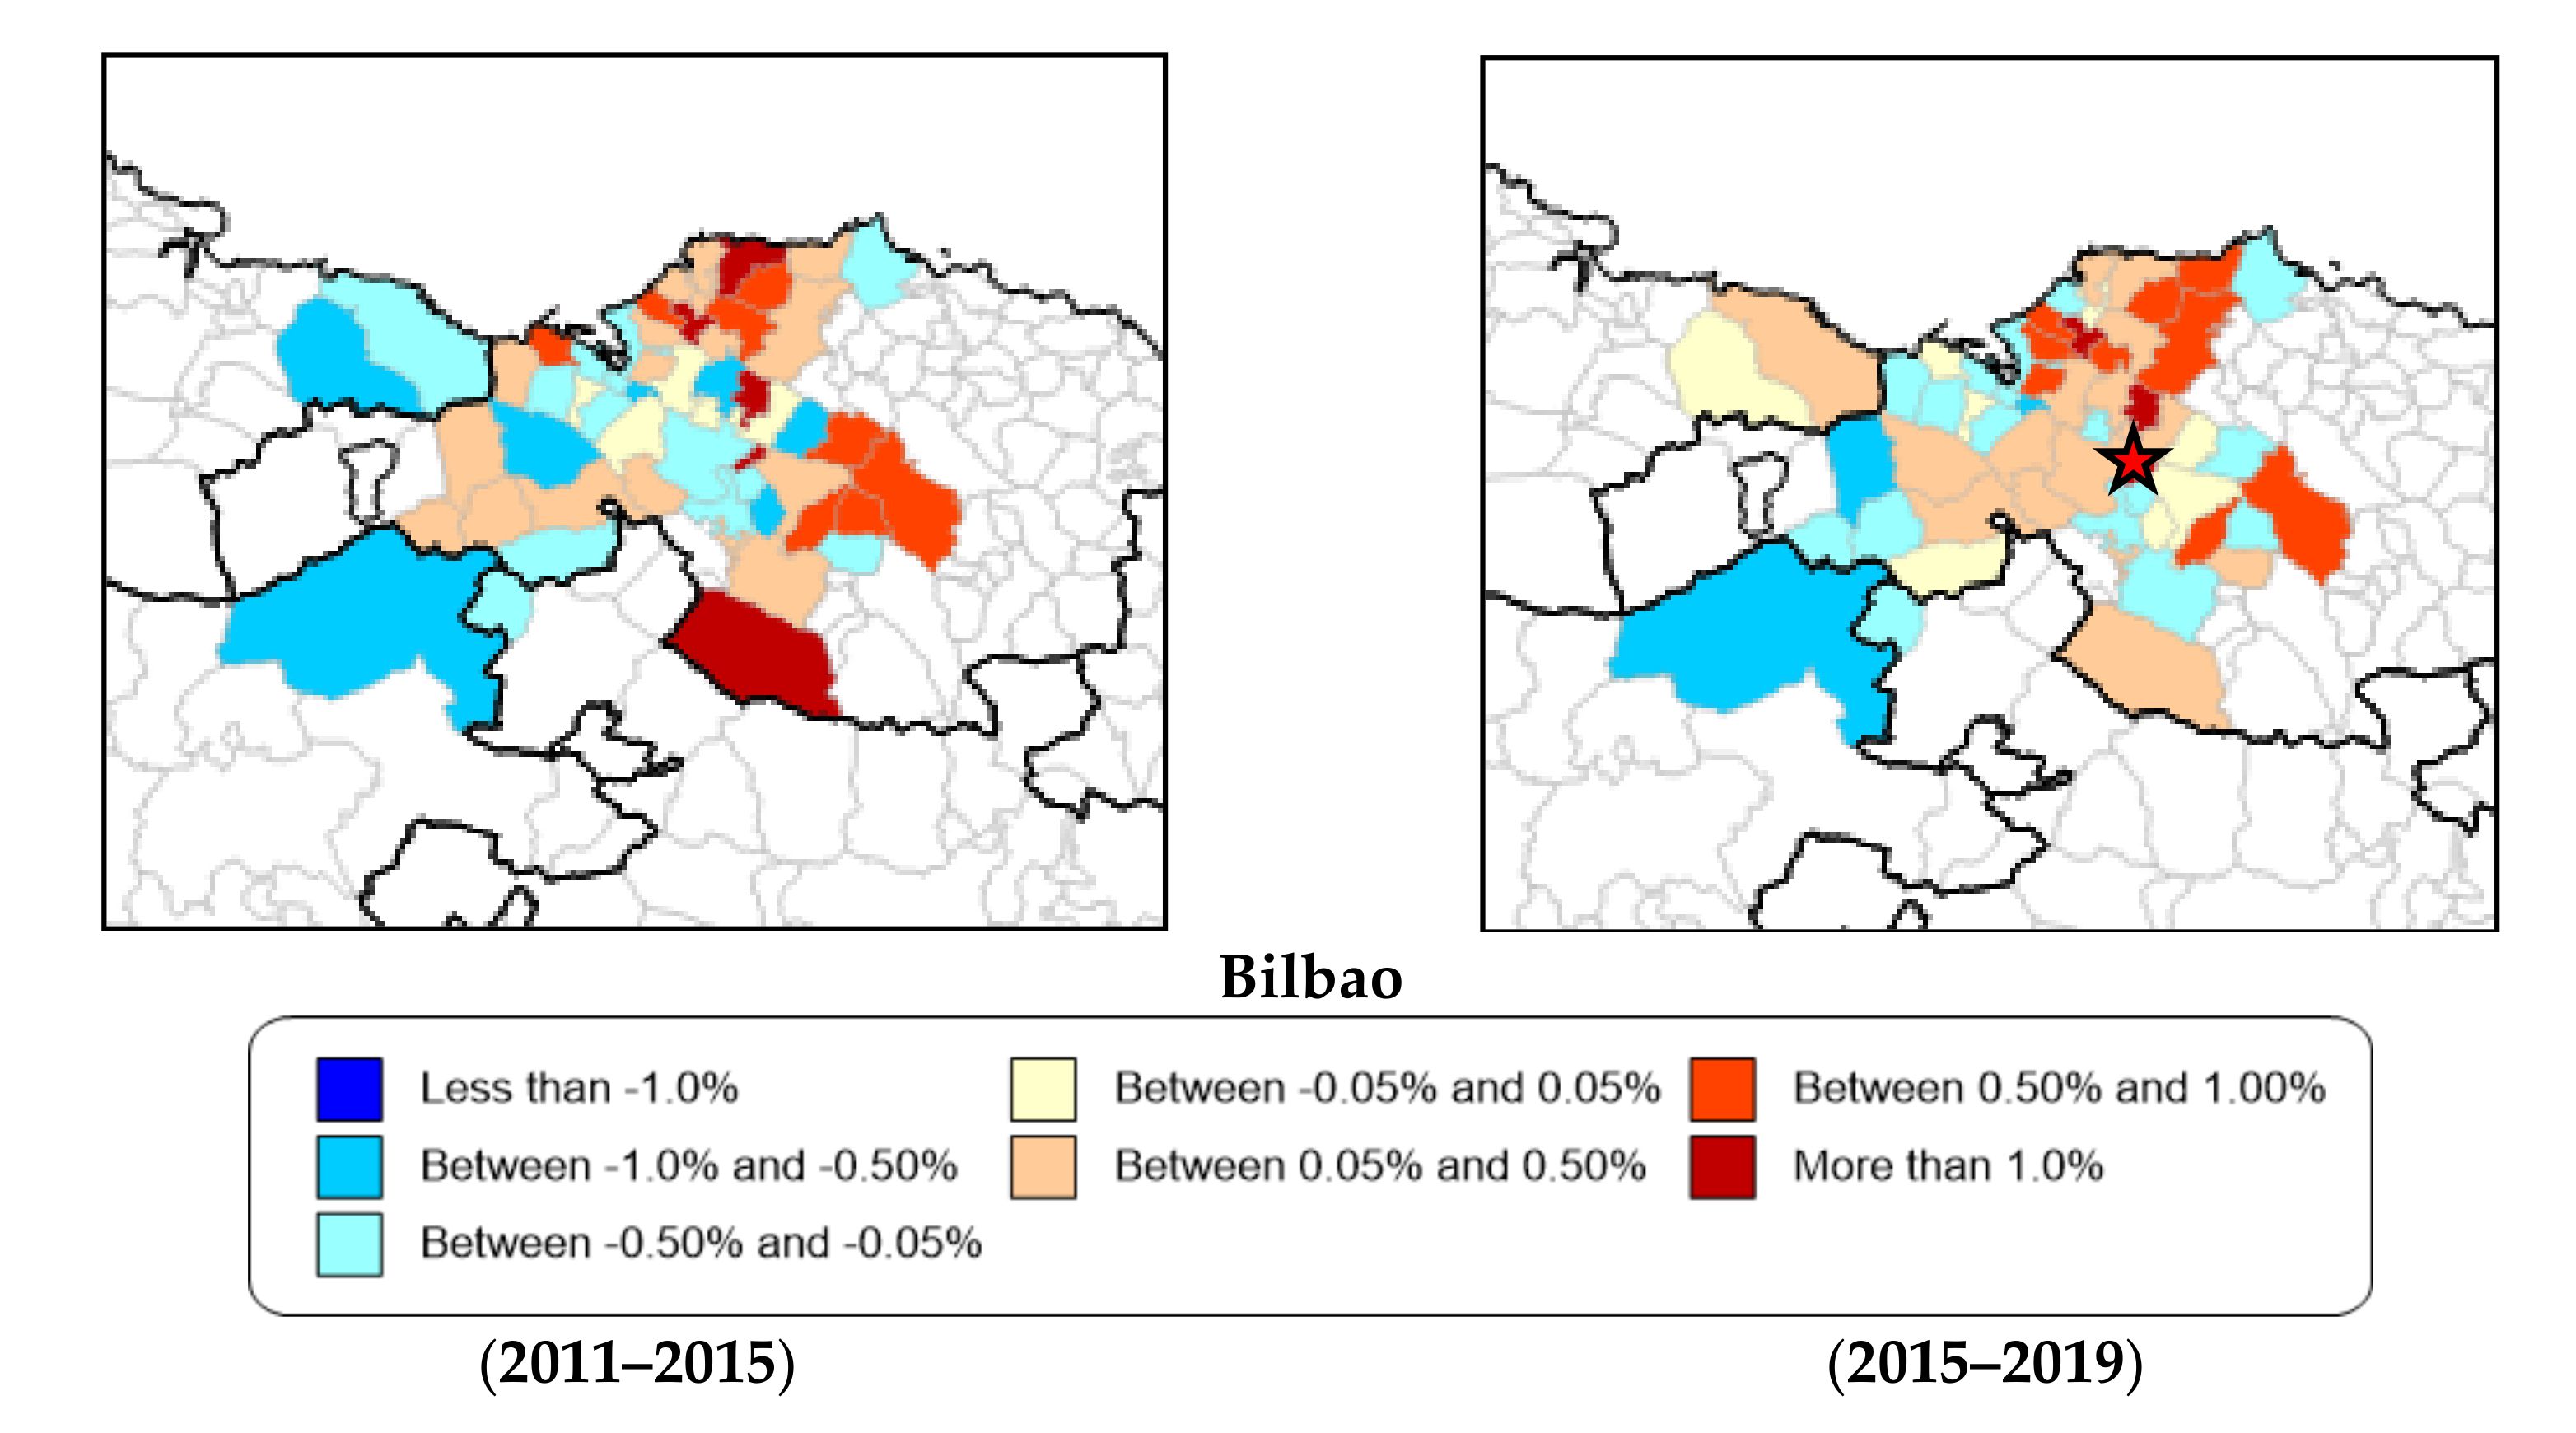
4.2. The Post-Crisis Effects on the Five Largest Spanish FUAs: Growing Variability within Urban Areas

In this section, the paper analyzes how metropolitan dynamics have diversified inside FUAs by focusing on the five most populated ones in Spain. According to INE data, these are, in deceasing order, Madrid, Barcelona, Valencia, Seville, and Bilbao (Appendix A, Table A2). Concentrating first on differences between cores and peripheries (Figure 3), the five urban cores lost inhabitants during the economic crisis phase, notably so in Madrid. However, in the post-crisis phase, they began to recover their population figures once again. Seville is the only exception, as its population continued to decrease in the second period, though at a slower pace. Presently, Madrid is by far the most dynamic core, followed by Barcelona, Valencia, and Bilbao. More specifically, the cities of Madrid and Bilbao grew faster than their peripheries during the post-crisis phase, possibly indicating that they could be experiencing relative recentralization.
The suburban municipalities of the five FUAs all grew in both periods, Bilbao being the only exception, as their numbers slightly dwindled between 2011 and 2015. In general, suburban growth was higher in the post-crisis phase than in the preceding period, with the exception of Seville, whose periphery grew more during the economic crisis period. Therefore, these reducing suburbanization trends could indicate that the Seville FUA was recentralizing (in relative, not absolute, terms).
Finally, as shown by the maps in Figure 4, the post-crisis economic recovery gave rise to a new metropolitan population growth phase, ending previous trends. During the economic crisis phase (2011–2015), the five FUAs analyzed were characterized by negative international migration and low suburbanization. Therefore, peripheries gained less population than in previous decades. Urban cores decreased due to both negative natural and migratory growth, though they stopped losing as much population to peripheries due to the growing attractiveness of cores.
Having shown a certain capacity to retain population during the economic crisis phase, cores became attractive to international migration once again between 2015 and 2019, compensating for the reactivation of suburbanization flows. In fact, some migratory flows, such as those to large cities, were never interrupted. Consequently, during the post-crisis phase, growth became positive in the four cores. As previously explained, Seville is the only exception because it attracted less international immigration. Changes in the city of Madrid are particularly outstanding, as after experiencing the highest population decrease of all five cores between 2011 and 2015, it had the strongest increase in the following period.
In Madrid, Barcelona, and Valencia FUAs, suburban peripheries grew once again. However, those of Bilbao did not undergo many changes, as some municipalities that lost inhabitants in the crisis period were now gaining it (and vice versa). In fact, the population figures of the Bilbao FUA as a whole (core plus rings) remained quite stable. By contrast, the suburban municipalities of the Seville FUA generally grew to a lesser extent or even decreased in the second period, with western peripheries being the only exception.
The peripheries of Madrid, Barcelona, and Valencia FUAs show novelties that demonstrate that post-crisis population growth was not just a replication of the economic expansion phase prior to the Great Recession. In addition to the economic crisis and its effects, the generations moving out of their parents’ home at this time were also smaller than those leaving them at the beginning of the 21st century: These were the Spanish baby boomers, the largest cohorts ever born in the country. Therefore, peripheries did not grow as much as they did then. Moreover, all three metropolitan areas contain locations, generally situated at metropolitan fringes, that continued to lose population during the post-crisis phase, as they did in the previous economic crisis era. These are typically small municipalities that incorporated late to suburbanization flows during the economic expansion phase and, being located far from urban cores, were not very attractive to residential movers. The housing market of these metropolitan fringes is far from being as attractive as it was during the housing bubble.
These results refer to the total population growth or decrease in cores, rings, and whole FUAs. However, there are significant differences in the spatial patterns of population growth and mobility according to age, nationality, marital status, and type of household, as explained in the theoretical framework. This has been investigated in other publications by the authors [22,49,74]. For example, although young families continue to suburbanize, some recentralization is observed among those around 50 years of age, and even more so among the youth (20–29 years). In contrast, those over 80 years of age continue to show a trend towards suburbanization: they leave the city to live with their descendants or in residential homes for the elderly in the periphery [95]. These dynamics are shown more clearly in Barcelona and Madrid and are less distinct in the other three cities [5].

5. Discussion

The research results confirm the article’s hypothesis: During the post-crisis economic recovery period, the spatial distribution of the population in Spanish urban areas was reshaped. Population growth patterns were more diverse than they were during the economic crisis years. Indeed, when calculating population growth rates for city cores and peripheries and for each of the urban areas as a whole, significant differences appear not only among them but also within them. Cores and peripheries show different behaviors in diverse urban areas, ring municipalities differ from one another, and metropolises vary among each other. Regarding this last point, the results show that from 2011 to 2015, most of the 69 examined FUAs lost population, whereas from 2015 to 2019, population growth was positive in most of them. Although both phases showed an enormous variety of situations in which urban cores and peripheries gained and lost population, it can be concluded that this heterogeneity increased in the second period under analysis. For example, some of the urban areas that always either gained or lost population experienced new realities, such as their cores growing more than their peripheries. Large cities such as Madrid and Bilbao, for instance, increased more than their rings. The post-crisis reactivation of foreign immigration (in 2018, there were 760,804 entries from abroad, very similar to the highest figures registered in first decade of the 21st century) could be behind this renewed attractiveness of core cities.
As previously mentioned, there seem to be no obvious geographical patterns. Perhaps the FUAs that have continuously lost population since 2011 show the clearest one. These are mostly either inland provincial capitals or cities located in declining industrial areas. Burgos, Cuenca, Jaén, León, Ourense, Palencia, Salamanca, Valladolid, and Zamora are the first type, and Alcoy, Avilés, Cádiz, Ferrol, Ponferrada, and Talavera are the second. Both groups of cities share a low capacity to attract international immigration. At the other end of the spectrum, FUAs that gained population throughout both analyzed phases seem to have a greater diversity of features: They are predominantly located on the coast or near a large Spanish metropolitan area and mainly have a diversified or an industrially based economy. This is the case for Almería, Ciudad Real, Donostia, Girona, Granada, Guadalajara, Huelva, Lleida, Málaga, Marbella, Murcia, Pamplona, Seville, and Toledo.
This increasing variety of situations (or heterogeneity of population dynamics) among urban areas is also verifiable within the five large metropolises analyzed, which addresses the second objective of the article. In other words, both city cores and ring municipalities show examples of population growth and decline. Although suburbanization was reactivated in the post-crisis period, urban core attractiveness increased during those years, as, except for Seville, their population grew. Many peripheral municipalities also experienced accelerated population growth during post-crisis years, although some of them (still) lost inhabitants. These uneven population dynamics act similarly to what, we suppose, occurs inside large cities among neighborhoods. Therefore, further analysis focusing on census tracts and additional research on migratory flows, as well as natural growth, will provide answers to new questions raised by the present study. Nevertheless, what this paper does show is that the stages defined by the urban development model are no longer useful for analyzing and interpreting present urban dynamics in Spanish FUAs.
In any case, urban core and periphery growth between 2015 and 2019 seems to have been intimately related to international migration and internal residential mobility increases in an improving economic context. Indeed, in Spain, the economic crisis was extremely intense, and residential insecurity rose more than in other European countries, as vulnerable groups were overrepresented [96]. The recession entailed an interruption of international immigration entries and a modification of internal flows, though these did not decrease as much as expected in metropolitan areas. Furthermore, after the real estate bubble burst, there was a reduction in the vast suburbanization flows that characterized previous decades [11,97,98] not only in large urban areas but also in intermediate-size ones [15]. This decrease in decentralization was even interpreted by some authors as evidence of an emerging urban population recentralization process [6,99]. However, as residential mobility patterns vary with economic cycles, these rates started to grow in 2015, reflecting diversification of socio-residential strategies and the transformation of interactions between intra-metropolitan spaces [20,100]. This recent enhancement in residential mobility and its increasingly complex patterns of origin, destination, age, socioeconomic category, and life stage, among others, has had pronounced demographic and socioeconomic impacts. Moreover, it has had spatial effects on urban areas, as many suburban municipalities grew again at the same time as their cores.
Though it is difficult to establish cause–effect relationships with this largely descriptive research, Spain’s rising residential mobility during the post-crisis period runs parallel to several socioeconomic processes mentioned in the theoretical framework chapter: housing and labor market modifications, family and household transformations, and spatial socio-residential pattern changes. In our view, all of these processes would lead to growing and more diverse residential mobility.
Housing market transformations, for instance, would have intensified multiple flows between (and within) cores and rings through diverse mechanisms, such as gentrification, touristification, and in general, problems faced by young people and immigrants in affording a dwelling. On the other hand, the labor market also recovered between 2014 and early 2020, creating thousands of jobs that, once again, attracted foreign immigrants and reactivated internal and intra-metropolitan flows. Population and household transformations, which are together known as the Second Demographic Transition, are apparently less related to economic circumstances. Single and divorced people seem to prefer living in central areas, whereas family households tend to live in peripheral regions during both expansive and recessive economic phases. However, the post-crisis era may have accelerated life cycle transitions: For example, having a child or divorcing is expensive, and in consequence, so is residential mobility. Therefore, during recent recovery years, all of these family transformations would have also had an impact on urban demographic and spatial structures.
Finally, was the suburbanization of poverty occurring in the post-crisis period? Maintaining that poverty was expelled to the peripheries of Spanish cities can be considered an oversimplification. However, a global review of recent theoretical and empirical contributions shows that residential mobility does play an essential but extremely complex role in the social reconfiguration of metropolitan spatial interactions [87]. In the absence of more detailed studies, we believe that rather than a simplistic dichotomy between affluent cores and poor rings, residential mobility generates new “fragmented” spaces in a similar sense to that applied by Borsdorf and Hidalgo for Latin American urban areas [101], although with significant differences. Indeed, Latin American cities had a historical urban structure characterized by affluent people living in city cores and poor residents inhabiting peripheries [102]. As gated condominiums for the middle and upper classes have been built in peripheries, these privileged social groups are partly suburbanizing in those countries [103]. However, the situation is different in Europe and the U.S., where, as previously noted, middle to high classes are moving downtown. Nevertheless, from a spatial socio-demographic point of view, the results obtained are similar: Both cores and peripheries are increasingly complex, with affluent, middle-class, and deprived groups, as well as aged and rejuvenated populations, living in adjacent neighborhoods (within the same city) or nearby residential developments (within the same suburban municipalities). As city cores and rings are progressively more mixed and diversified, we can maintain that urban areas are increasingly demographically complex, diversified, or “fragmented.” This paper’s results for Spanish urban areas during recovery years are in line with this urban tendency.
Of course, these research results reflect a post-crisis reality that was abruptly interrupted by the COVID-19 pandemic and the state of alarm in mid-March 2020 (Royal Decree 463/2020, issued on 14 March 2020). Mandatory confinement decreed by the government to stop the spread of the virus had a deep economic and social impact that will modify, at least in the short and medium term, the described urban population dynamics. The closure of Spain’s and other countries’ borders, breaking global circulation, has also had a great impact on the main component of metropolitan population growth: migration. This prevents new entries while fixing the population to the territory. Therefore, we are facing a new phase, and its uncertain future developments, depending on how the pandemic continues to unfold, will require new research.

Author Contributions

Conceptualization, F.G.-A., C.L.-V., J.B.-i.-C., and I.P.; data curation, J.B.-i.-C.; formal analysis, F.G.-A. and J.B.-i.-C.; funding acquisition, C.L.-V. and F.G.-A.; investigation, F.G.-A., C.L.-V., J.B.-i.-C., and I.P.; methodology, F.G.-A., J.B.-i.-C., and I.P.; project administration, C.L.-V.; supervision, F.G.-A. and I.P.; writing—original draft, F.G.-A. All authors have read and agreed to the published version of the manuscript.

Funding

Research for the present paper was conducted within the following I + D + i project: Nuevas movilidades y reconfiguración sociorresidencial en la poscrisis: consecuencias socioeconómicas y demográficas en las áreas urbanas españolas (New mobilities and socio-residential reconfiguration in the post-crisis: socio-economic and demographic consequences in Spanish urban areas, ref. RTI2018-095667-B-I00), directed by Cristina López Villanueva and Fernando Gil Alonso. It was funded by the Ministry of Science and Innovation, the Spanish Research Agency, and the European Regional Development Fund (AEI/ERDF, EU). Some of the authors are members of the Territori, Població i Ciutadania (Territory, Population, and Citizenship) consolidated research group, recognized by the Catalan government (ref. GRC_2017SGR1298) and coordinated by Fernando Gil Alonso.

Data Availability Statement

Publicly available datasets were analyzed in this study. This data can be found here: https://www.ine.es/.

Acknowledgments

A very preliminary version of this research was presented at the XV Coloquio de Geografía Urbana (2020). The authors are grateful for the comments received from the organizers and participants, but also from the Urban Science editorial team and the three reviewers, all of them contributing to improvements in the text.

Conflicts of Interest

The authors declare no conflict of interest.

Appendix A

Table A1. Core and ring CAGRs for the analyzed FUAs in Spain in 2011–2015 and 2015–2019.
2011–20152015–2019
CoreRingsTotalCoreRingsTotal
A Coruña−0.220.28−0.020.190.670.39
Albacete0.11−0.040.090.17−0.400.12
Alcoy−0.63−0.39−0.59−0.240.23−0.16
Algeciras0.230.340.250.630.510.61
Alicante−0.430.54−0.160.470.990.62
Almería0.501.060.580.551.120.63
Arrecife−0.180.12−0.042.561.041.85
Ávila−0.28−0.72−0.30−0.26−0.93−0.30
Avilés−0.83−0.22−0.62−0.84−0.59−0.76
Badajoz0.14−0.110.100.13−0.470.03
Barcelona−0.170.05−0.020.500.710.64
Benidorm−1.060.57−0.17−0.12−0.23−0.18
Bilbao−0.54−0.01−0.190.120.060.08
Burgos−0.300.80−0.17−0.180.69−0.08
Cáceres0.16−0.84−0.040.13−1.10−0.10
Cádiz−0.90−0.06−0.46−0.93−0.19−0.53
Cartagena0.160.980.23−0.170.82−0.09
Castellón de la Plana−1.19−0.53−1.020.010.310.09
Ciudad Real−0.120.720.110.110.410.19
Córdoba−0.10−0.02−0.09−0.13−0.23−0.14
Cuenca−0.57−0.38−0.55−0.33−0.11−0.32
Donostia−0.010.420.180.180.430.29
Elche−0.33−1.31−0.450.570.510.56
Ferrol−1.23−0.16−0.65−1.24−0.50−0.84
Gijón−0.30−0.52−0.31−0.23−0.61−0.26
Girona0.220.340.271.081.481.25
Granada−0.450.670.19−0.360.710.27
Guadalajara−0.322.030.300.742.411.20
Huelva−0.440.870.02−0.460.800.00
Irún0.190.670.300.37−0.170.25
Jaén−0.300.20−0.16−0.52−0.35−0.47
Jerez de la Frontera0.240.110.23−0.01−0.16−0.02
León−0.940.30−0.45−0.69−0.48−0.61
Linares−0.57−1.01−0.59−0.99−1.84−1.02
Lleida0.020.880.240.070.170.10
Logroño−0.210.77−0.01−0.031.110.21
Lorca−0.310.61−0.190.731.170.79
Lugo0.03−1.23−0.210.04−0.91−0.14
Madrid−0.960.58−0.160.970.810.89
Málaga0.050.580.230.240.870.45
Manresa−0.640.13−0.331.010.460.79
Marbella0.160.720.470.681.120.92
Mérida0.50−0.340.240.15−0.66−0.10
Murcia−0.130.440.030.750.650.72
Ourense−0.410.16−0.25−0.240.21−0.11
Oviedo−0.39−0.30−0.37−0.25−0.52−0.33
Palencia−0.610.83−0.35−0.370.60−0.19
Palma de Mallorca−0.29−0.30−0.290.951.081.00
Las Palmas de GC−0.23−0.13−0.190.010.070.04
Pamplona−0.261.170.410.730.980.85
Ponferrada−0.60−0.77−0.64−0.84−0.72−0.81
Pontevedra0.04−0.76−0.300.15−0.51−0.12
Reus−0.830.80−0.630.280.010.25
Sagunto−0.250.76−0.070.460.630.49
Salamanca−1.171.28−0.52−0.380.68−0.08
Santa Cruz de Tenerife−2.140.07−0.860.430.740.62
Santander−0.840.30−0.23−0.200.01−0.09
Santiago de Comp.0.110.070.090.430.180.30
Seville−0.330.710.24−0.190.310.08
Talavera−1.010.13−0.82−0.510.24−0.39
Tarragona−0.530.75−0.040.620.600.61
Toledo0.040.440.210.490.720.59
Torrevieja−3.53−1.36−3.43−1.480.24−1.38
Valencia−0.370.09−0.120.260.600.44
Valladolid−0.771.47−0.16−0.450.77−0.10
Vigo−0.27−0.09−0.190.11−0.020.05
Vitoria0.450.320.440.800.370.75
Zamora−0.650.60−0.53−0.96−0.22−0.89
Zaragoza−0.361.16−0.190.381.300.49
All FUAs−0.440.31−0.100.320.590.44
Source: 2011–2019 Padrón Continuo (Continuous Population Register), INE.
Table A2. Absolute population change and CAGRs for the 5 largest FUAs (cores and rings) in Spain in 2011–2015 and 2015–2019.
PopulationCAGR
2011201520192011–20152015–2019
CORES
Madrid3,265,0383,141,9913,266,126−0.960.97
Barcelona1,615,4481,604,5551,636,762−0.170.50
Valencia798,033786,189794,288−0.370.26
Seville703,021693,878688,592−0.33−0.19
Bilbao352,700345,141346,843−0.540.12
RINGS
Madrid3,422,5383,502,0033,616,3350.580.81
Barcelona3,302,0713,309,3103,403,8200.050.71
Valencia928,053931,284953,8540.090.60
Seville824,554848,284858,7090.710.31
Bilbao694,167693,857695,495−0.010.06
Source: 2011–2019 Padrón Continuo (Continuous Population Register), INE.

References

  1. Piketty, T. Capital in the 21st Century; Harvard University Press: Cambridge, MA, USA, 2014. [Google Scholar]
  2. Méndez, R. La Telaraña Financiera: Una Geografía de la Financiarización y su Crisis; RiL Editores: Barcelona, Spain, 2018. [Google Scholar]
  3. Domingo, A.; Blanes, A. Inmigración y emigración en España: Estado de la cuestión y perspectivas de futuro. In Anuario de la Inmigración en España 2014; Arango, J., Malapeira, D.M., Alonso, J.O., Eds.; CIDOB: Barcelona, Spain, 2015; pp. 94–122. [Google Scholar]
  4. Bayona, J.; Gil-Alonso, F.; Pujadas, I.; Rubiales, M. New Spatial Mobility Patterns in Large Spanish Cities: From the Economic Boom to the Great Recession. Appl. Spat. Anal. Policy 2018, 11, 287–312. [Google Scholar] [CrossRef] [Green Version]
  5. Bayona, J.; Pujadas, I. Las grandes áreas metropolitanas en España: Del crecimiento y la expansión residencial al estancamiento poblacional. Doc. d’Anàlisi Geogràfica 2020, 66, 27–55. [Google Scholar] [CrossRef] [Green Version]
  6. López-Gay, A. Population growth and re-urbanisation in Spanish inner cities: The role of internal migration and residential mobility. Rev. Quetelet 2014, 2, 67–92. [Google Scholar] [CrossRef] [Green Version]
  7. López-Gay, A. Hacia un patrón territorial complejo de la movilidad residencial: El caso de la Región Metropolitana de Barcelona. Pap. Rev. Sociol. 2017, 104, 793–823. [Google Scholar] [CrossRef]
  8. Feria-Toribio, J.M.; Andújar Llosa, A. Movilidad residencial metropolitana y crisis inmobiliaria. An. Geogr. 2015, 35, 13–40. [Google Scholar] [CrossRef] [Green Version]
  9. Gil-Alonso, F.; Bayona, J.; Pujadas, I. From boom to crash: Spanish urban areas in a decade of changes (2001–2011). Eur. Urban Reg. Stud. 2016, 23, 198–216. [Google Scholar] [CrossRef]
  10. Palomares-Lin, I.; Feria-Toribio, J.M.; Susino-Arbucias, J. Medida y evolución de la movilidad residencial en las áreas metropolitanas españolas. Pap. Rev. Sociol. 2017, 102, 545–574. [Google Scholar]
  11. Pujadas, I. Movilidad residencial y expansión urbana en la Región Metropolitana de Barcelona, 1982–2005. Scr. Nova Rev. Electrónica de Geogr. y Cienc. Soc. 2009, 13, 290. [Google Scholar]
  12. Pozo, E.; Rodríguez Moya, J.M. Impacto de la crisis en los movimientos migratorios en la comunidad de Madrid (2007–2013). Boletín Asoc. Geógrafos Españoles 2018, 77, 229–255. [Google Scholar] [CrossRef]
  13. Bayona, J.; Gil-Alonso, F. Suburbanisation and international immigration: The case of the Barcelona Metropolitan Region (1998–2009). Tijdschr. Econ. Soc. Geogr. 2012, 103, 312–329. [Google Scholar] [CrossRef] [Green Version]
  14. Bayona, J.; Pujadas, I. Movilidad residencial y redistribución de la población metropolitana: Los casos de Madrid y Barcelona. EURE 2014, 40, 261–287. [Google Scholar]
  15. Garcia-Coll, A.; López-Villanueva, C.; Pujadas, I. Movilidad residencial en tiempos de crisis. El caso de la Región Metropolitana de Barcelona. Scr. Nova Rev. Electrónica Geogr. Cienc. Soc. 2016, 20, 549. [Google Scholar]
  16. López-Villanueva, C.; García, A.; Bretones, M.T.; Crespi, M. Los efectos de la crisis económica en el urbanismo disperso de la Región Metropolitana de Barcelona. Clivatge 2017, 5, 291–331. [Google Scholar]
  17. Andújar-Llosa, A. Movilidad residencial y (re)composición social del espacio urbano en el municipio de Madrid. Pap. Sociol. 2017, 102, 761–792. [Google Scholar]
  18. Myro, R. Crecimiento económico con equilibrio exterior. Un Nuevo Escenario para la economía española. Eur. Policy Brief 2018, 13, 1–16. Available online: https://www.europeg.com/images/phocadownload/policybrief13/EuropeG_-_Policy_Brief_n13_ES.compressed.pdf (accessed on 7 May 2021).
  19. Alves, P.; Urtasun, A. Evolución reciente del mercado de la vivienda en España. Boletín Económico Banco España 2019, 2, 1–11. Available online: https://euroval.com/wp-content/uploads/2019/04/BdE-Evolucion-reciente-del-mercado-vivienda.pdf (accessed on 7 May 2021).
  20. Garcia-Coll, A.; López-Villanueva, C. The impact of economic crisis in areas of sprawl in Spanish cities. Urban Sci. 2018, 2, 113. [Google Scholar] [CrossRef] [Green Version]
  21. Otero, R.; García-Abad, J.; Domínguez, J.; Pérez-Caramés, A. Inmigración y dinámicas territoriales en España: Crisis y recuperación (2008–2017). In Anuario CIDOB de la Inmigración 2019; Arango, J., Moya, D., Sánchez-Montijano, E., Eds.; CIDOB: Barcelona, Spain, 2019; pp. 190–217. [Google Scholar]
  22. Gil-Alonso, F.; Thiers, J. Population and economic cycles in the main Spanish urban areas: The migratory component. Comp. Popul. Stud. 2019, 44, 317–350. [Google Scholar]
  23. Hall, P. Spatial structure of metropolitan England and Wales. In Spatial Policy Problems of the British Economy; Chisholm, M., Manners, G., Eds.; Cambridge University Press: Cambridge, UK, 1971; pp. 96–125. [Google Scholar]
  24. Klaasen, L.H.; Molle, W.; Paelink, J.H. Dynamics of urban development. In Proceedings of the International Conference Held on the Occasion of the 50th Anniversary, Rotterdam, The Netherlands, 4 September 1979; Gower: Aldesrshot, UK, 1981. [Google Scholar]
  25. Berg, L.V.D.; Drewett, R.; Klaassen, L.H.; Rossi, A.; Vijverberg, C.H. A Study of Growth and Decline; Pegasus: Oxford, UK, 1982. [Google Scholar]
  26. Champion, A.G. Urbanisation, urbanisationSuburbanisation, Counterurbanisation and Reurbanisation. In Handbook of Urban Studies; Paddison, R., Ed.; SAGE: London, UK, 2001; pp. 143–161. [Google Scholar]
  27. Fielding, A.J. Counterurbanisation in Western Europe. Prog. Plan. 1982, 17, 1–52. [Google Scholar] [CrossRef]
  28. Geyer, H.S.; Kontuly, T.M. A theoretical foundation for the concept of differential urbanisation. Int. Reg. Sci. Rev. 1993, 15, 157–177. [Google Scholar] [CrossRef]
  29. Wolff, M. Understanding the role of centralization processes for cities—Evidence from a spatial perspective of urban Europe 1990–2010. Cities 2018, 75, 20–29. [Google Scholar] [CrossRef]
  30. Rérat, P. The new demographic growth of cities: The case of reurbanisation in Switzerland. Urban Stud. 2012, 49, 1107–1125. [Google Scholar] [CrossRef]
  31. Kabisch, N.; Haase, D. Diversifying European Agglomerations: Evidence of Urban Population Trends for the 21st Century. Popul. Space Place 2011, 17, 236–253. [Google Scholar] [CrossRef]
  32. Wolff, M.; Wiechmann, T. Urban growth and decline: Europe’s shrinking cities in a comparative perspective 1990–2010. Eur. Urban Reg. Stud. 2018, 25, 122–139. [Google Scholar] [CrossRef]
  33. Bagchi-Sen, S.; Franklin, R.S.; Rogerson, P.; Seymour, E. Urban inequality and the demographic transformation of shrinking cities: The role of the foreign born. Appl. Geogr. 2020, 116, 1–13. [Google Scholar] [CrossRef]
  34. Gil-Alonso, F.; Bayona-i-Carrasco, J.; López-Villanueva, C.; Pujadas-Rúbies, I. Diferencias geográficas de la fecundidad en España: Una perspectiva provincial. Pap. Geogr. 2017, 63, 21–38. [Google Scholar] [CrossRef]
  35. Rodrigo-Comino, J.; Egidi, G.; Sateriano, A.; Poponi, S.; Mosconi, E.M.; Gimenez Morera, A. Suburban Fertility and Metropolitan Cycles: Insights from European Cities. Sustainability 2021, 13, 2181. [Google Scholar] [CrossRef]
  36. Clark, W.A.V. Residential mobility in context: Interpreting behavior in the housing market. Pap. Sociol. 2017, 102, 575–605. [Google Scholar] [CrossRef] [Green Version]
  37. Méndez Gutiérrez del Valle, R. De la hipoteca al desahucio: Ejecuciones hipotecarias y vulnerabilidad territorial en España. Rev. Geogr. Norte Gd. 2017, 67, 9–31. [Google Scholar] [CrossRef] [Green Version]
  38. Leal, J.; Martínez del Olmo, A. El progresivo abandono de la política de vivienda en España. Cuad. Relac. Labor. 2017, 35, 15–41. [Google Scholar] [CrossRef] [Green Version]
  39. Sorando, D.; Uceda, P. Fragmentos urbanos después de la burbuja inmobiliaria: El caso de Madrid. OBETS. Rev. Cienc. Soc. 2018, 13, 383–410. [Google Scholar] [CrossRef]
  40. Módenes, J.A.; Fernández, C.; López, J. La formación de hogares y la tenencia de viviendas de los jóvenes en la reconfiguración de los sistemas residenciales europeos. Scripta Nova Rev. Electrónica Geogr. Cienc. Soc. 2013, XVII, 460. [Google Scholar]
  41. Pareja-Eastaway, M.; Sánchez-Martínez, T. More social housing? A critical analysis of social housing provision in Spain. Crit. Hous. Anal. 2017, 4, 124–131. [Google Scholar] [CrossRef]
  42. Ozlem, A.; García-Montalvo, J.; García-Villar, J.; Peydró, J.L.; Raya, J.M. The real state and credit bubble: Evidence from Spain. J. Span. Econ. Assoc. 2014, 5, 223–243. [Google Scholar]
  43. López Rodríguez, D.; Matea-Rosa, M.L. Evolución reciente del mercado del alquiler de vivienda en España. Boletín Económico 2019, 3, 1–18. Available online: https://dialnet.unirioja.es/servlet/articulo?codigo=7128894 (accessed on 7 May 2021).
  44. Donat, C. La gentrificació i el problema de l’habitatge a Barcelona. Pap. Regió Metrop. Barc. 2018, 60, 114–129. [Google Scholar]
  45. Colomb, C.; Novy, J. Protest and Resistance in the Tourist City; Routledge: London, UK, 2016. [Google Scholar]
  46. Cócola-Gant, A. Holiday rentals: The new gentrification battlefront. Sociol. Res. Online 2016, 21, 112–120. [Google Scholar] [CrossRef]
  47. López-Gay, A.; Cócola-Gant, A. Transnational gentrification, tourism and the formation of ‘foreign only’ enclaves in Barcelona. Urban Stud. 2020, 57, 3025–3043. [Google Scholar]
  48. Domínguez Pérez, M.; Crespi-Vallbona, M. ¿Es posible la sostenibilidad de las ciudades turistificadas? Los casos de los centros históricos de Madrid y Barcelona. Rotur Rev. ocio Tur. 2021, 15, 22–38. [Google Scholar] [CrossRef]
  49. Thiers, J.; Gil-Alonso, F. Dinámicas residenciales de la inmigración latinoamericana en las metrópolis de Barcelona y Madrid: Cambios de tendencias durante la expansión, la crisis y la poscrisis. Doc. d’Anàlisi Geogràfica 2020, 66, 57–82. [Google Scholar] [CrossRef]
  50. Bőhning, W.R. The Migration of Workers in the United Kingdom and the European Community; Oxford University Press: London, UK, 1972. [Google Scholar]
  51. Bőhning, W.R.; Maillat, D. The Effects of the Employment of Foreign Workers; Organisation for Economic Co-operation and Development: Paris, France, 1974. [Google Scholar]
  52. Dobson, J.; Latham, A.; Salt, J. On the move? Labour migration in times of recession. Policy Network Paper 2009, 1–23. Available online: https://www.geog.ucl.ac.uk/research/research-centres/migration-research-unit/publications/mru-publications/pdfs/on_the_move.pdf (accessed on 7 May 2021).
  53. Fielding, T. Migration in a Time of Crisis: A Simple Conceptual Framework Applied to East Asian Migrations; Centre for Migration Research Working Paper 63; University of Sussex: Sussex, UK, 2010. [Google Scholar]
  54. King, R.; Fielding, A.; Black, R. The international migration turnaround in southern Europe. In Southern Europe and the New Immigrations; King, R., Black, R., Eds.; Sussex Academic Press: Brighton, UK, 1997; pp. 1–25. [Google Scholar]
  55. Piore, M. Birds of Passage: Migrant Labor and Industrial Societies; Century University Press: New York, NY, USA, 1979. [Google Scholar]
  56. Eldorado or Fortress? Migration in Southern Europe; King, R.; Lazaridis, G.; Tsardanidis, C. (Eds.) Palgrave Macmillan: New York, NY, USA, 2000. [Google Scholar]
  57. Domingo, A.; Gil-Alonso, F. Immigration and Changing Labour Force Structure in the Southern European Union. Population 2007, 62, 709–727. [Google Scholar] [CrossRef]
  58. Aysa-Lastra, M.; Cachón, L. Introduction: Vulnerability and Resilience of Latin American during the Great Recession. In Immigrant Vulnerability and Resilience. Comparative Perspectives on Latin American Immigrants during the Great Recession; Aysa-Lastra, M., Cachón, L., Eds.; Springer: New York, NY, USA, 2015; pp. 1–21. [Google Scholar]
  59. Gil-Alonso, F.; Vidal-Coso, E. Inmigrantes extranjeros en el mercado de trabajo español: ¿más resilientes o más vulnerables al impacto de la crisis? Migraciones 2015, 37, 97–123. [Google Scholar] [CrossRef] [Green Version]
  60. Bayona-i-Carrasco, J.; Thiers-Quintana, J.; Ávila-Tàpies, R. Economic recession and the reverse of internal migration flows of Latin American immigrants in Spain. J. Ethic Migr. Stud. 2017, 43, 2499–2518. [Google Scholar] [CrossRef]
  61. Prieto, V.; Recaño, J.; Quintero-Lesmes, D. Migration responses of immigrants in Spain during the Great Recession. Demogr. Res. 2018, 38, 1885–1932. [Google Scholar] [CrossRef] [Green Version]
  62. Gil-Alonso, F.; Bayona-i-Carrasco, J.; Pujadas, I. Las migraciones internas de los extranjeros en España. Dinámicas espaciales recientes bajo el impacto de la crisis. Boletín Asoc. Geógrafos Españoles 2015, 69, 233–261. [Google Scholar] [CrossRef] [Green Version]
  63. Clark, W. Life Events and Moves Under Duress: Disruption in the Life Course and Mobility Outcomes. Longitud. Life Course Stud. 2016, 7, 218–239. [Google Scholar] [CrossRef] [Green Version]
  64. Tyrrell, N.; Kraftl, P. Lifecourse and internal migration. In Internal Migration. Geographical Perspectives and Processes; Smith, D.P., Finney, N., Walford, N., Eds.; Routledge: London, UK, 2015; pp. 15–30. [Google Scholar]
  65. Lesthaeghe, R.; Van de Kaa, D.J. Two demographic transitions. Popul. Growth Decline 1986, 1, 9–24. [Google Scholar]
  66. Feijten, P.; van Ham, M. Residential mobility and migration of the divorced and separated. Demogr. Res. 2007, 17, 623–654. [Google Scholar] [CrossRef] [Green Version]
  67. Jamieson, L.; Simpson, R. Living Alone: Globalization, Identity and Belonging; Palgrave Macmillan: Basingstoke, UK, 2014; pp. 23–32. [Google Scholar]
  68. Frey, W.; Kobrin, F. Changing families and changing mobility: Their impact on the central city. Demography 1982, 19, 261–277. [Google Scholar] [CrossRef] [PubMed]
  69. Buzar, S.; Odgen, P.E.; Hall, R. Households matter: The quiet demography of urban transformation. Prog. Hum. Geogr. 2005, 29, 413–436. [Google Scholar] [CrossRef]
  70. Bonvalet, C.; Lelièvre, E. Du concept de ménage a celui ci d’entourage: Une redefinition de l’espace familial. In De la Famille à l’entourage: L’enquête Biographies et Entourage; INED: Paris, France, 2012; pp. 51–66. [Google Scholar]
  71. Champion, T.; Shuttleworth, I. Are people changing address less? An analysis of migration within England and Wales, 1971–2011, by distance of move. Popul. Space Place 2017, 23, 2026. [Google Scholar] [CrossRef] [Green Version]
  72. Bell, M.; Wilson, T.; Charles-Edwards, E.; Ueffing, P. The long-run decline in internal migration intensities. In Internal Migration in the Developed World: Are We Becoming Less Mobile? Champion, T., Cooke, T., Shuttleworth, I., Eds.; Routledge: London, UK, 2017; pp. 147–172. [Google Scholar]
  73. Porcel López, S.; Navarro-Varas, L.; Antón-Alonso, F.; Cruz, I. La suburbanització de la pobresa com a efecte metropolità de la gentrificació: El cas de Barcelona. Pap. Regió Metrop. Barc. Territ. Estratègies Planejament 2018, 60, 94–113. [Google Scholar]
  74. Gil-Alonso, F.; Thiers, J.; Bayona, J.; Pujadas, I. La population des villes est-elle ségréguée en fonction de l’âge? Géographie du vieillissement et du rajeunissement dans les grandes métropoles espagnoles. Espace Popul. Sociétés 2021, 2020/3–2021/1. Available online: https://journals.openedition.org/eps/11055 (accessed on 7 May 2021).
  75. Florida, R. The New Urban Crisis: How Our Cities are Increasing Inequality, Deepening Segregation, and Failing the Middle Class and what We Can Do about It; Basic Books: New York, NY, USA, 2017. [Google Scholar]
  76. Hochstenbach, C.; Musterd, S. Gentrification and the suburbanisation of poverty: Changing urban geographies through boom and bust periods. Urban Geogr. 2017, 39, 26–53. [Google Scholar] [CrossRef] [Green Version]
  77. Musterd, S.; Marcińczak, S.; van Ham, M.; Tammaru, T. Socioeconomic segregation in European capital cities. Increasing separation between poor and rich. Urban Geogr. 2017, 38, 1062–1083. [Google Scholar] [CrossRef] [Green Version]
  78. Rubiales-Pérez, M. Patrones socioterritoriales de las clases altas en las regiones metropolitanas de Barcelona y Madrid (2001–2015). Ph.D. Thesis, Universitat de Barcelona, Barcelona, Spain, 2017. [Google Scholar]
  79. Rubiales, M. Segregación en las metrópolis españolas 2001–2011: Un análisis con detalle territorial. Doc. d’Anàlisi Demogràfica 2020, 66, 83–105. [Google Scholar] [CrossRef]
  80. Sorando, D.; Leal, J. Distantes y desiguales: El declive de la mezcla social en Barcelona y Madrid. REIS Rev. Española Investig. Sociológicas 2019, 167, 125–148. [Google Scholar]
  81. Sarasa, S.; Porcel, S.; Navarro, L.; Thiers, J. Desindustrialización y crisis en la Barcelona posolímpica: ¿hacia una ciudad dual? EURE 2018, 44, 29–52. [Google Scholar] [CrossRef] [Green Version]
  82. Ruiz-Almar, E. Zones vermelles. Desigualtat social i espais en crisi a Barcelona i la seva àrea metropolitana. Scr. Nova Rev. electrónica Geogr. Cienc. Soc. 2018, 22, 1–33. Available online: https://revistes.ub.edu/index.php/ScriptaNova/article/view/18097/22806 (accessed on 7 May 2021). [CrossRef] [Green Version]
  83. Nel, O.; Gomà, A. Geographies of discontent: Urban segregation, political attitudes and electoral behaviour in Catalonia. City Territ. Archit. 2018, 5, 1–12. [Google Scholar]
  84. Sharkey, P. Residential mobility and the reproduction of unequal neighborhoods. Cityscape 2012, 4, 9–31. [Google Scholar]
  85. Musterd, S.; van Gent, W.P.; Das, M.; Latten, J. Adaptive behaviour in urban space: Residential mobility in response to social distance. Urban Stud. 2016, 53, 227–246. [Google Scholar] [CrossRef]
  86. López-Gay, A. Cambio en la composición social y gentrificación en Barcelona: Una mirada a través de los flujos migratorios y residenciales. Pap. Regió Metrop. Barc. Territ. Estratègies Planejament 2018, 60, 80–93. [Google Scholar]
  87. López-Gay, A.; Andújar-Llosa, A.; Salvati, L. Residential Mobility, Gentrification and Neighborhood Change in Spanish Cities: A Post-Crisis Perspective. Spat. Demogr. 2020, 8, 351–378. [Google Scholar] [CrossRef]
  88. Bonvalet, C.; Bringé, A.; Imbert, C. Urban dynamics and residential trajectories in Paris. Port. J. Soc. Sci. 2016, 15, 25–46. [Google Scholar] [CrossRef]
  89. Di Virgilio, M.M. Diferencias sociales en los procesos de movilidad residencial intraurbana en el Área Metropolitana de Buenos Aires (Argentina). Quivera. Rev. Estud. Territ. 2014, 16, 11–37. [Google Scholar]
  90. Maloutas, T. Contextual diversity in gentrification research. Crit. Sociol. 2012, 38, 33–48. [Google Scholar] [CrossRef]
  91. Kavanagh, L.; Lee, D.; Pryce, G. Is Poverty Decentralizing? Quantifying Uncertainty in the Decentralization of Urban Poverty. Ann. Am. Assoc. Geogr. 2016, 106, 1286–1298. [Google Scholar] [CrossRef] [Green Version]
  92. Bailey, N.; Minton, J. The suburbanisation of poverty in British cities, 2004–2016: Extent, processes and nature. Urban Geogr. 2018, 39, 892–915. [Google Scholar] [CrossRef] [Green Version]
  93. Randolph, B.; Tice, A. Suburbanizing Disadvantage in Australian Cities: Sociospatial Change in an Era of Neoliberalism. J. Urban Aff. 2014, 36, 384–399. [Google Scholar] [CrossRef]
  94. Dijkstra, L.; Poelman, H. Cities in Europe. The new OECD-EC definition. Reg. Focus 2020, 1, 1–13. [Google Scholar]
  95. Pujadas, I.; Bayona, J.; Rubiales, M. Movilidad residencial en edades avanzadas en España: Una perspectiva metropolitana. Finisterra Rev. Port. Geogr. 2016, LI, 121–142. [Google Scholar]
  96. Módenes-Cabrerizo, J.A. La inseguridad residencial por problemas económicos en España comparada con el entorno europeo. Pap. Rev. Sociol. 2017, 102, 673–703. [Google Scholar] [CrossRef] [Green Version]
  97. García-Docampo, M.; Otero-Enríquez, R. Transición territorial: Modelo teórico y contraste con el caso español. REIS. Rev. Española Investig. Sociológicas 2012, 139, 133–162. [Google Scholar] [CrossRef] [Green Version]
  98. Nel·lo, O. Spain: Changing century, changing cycle? Large Spanish cities on the threshold of the twenty-first century. In National Policy Responses to Urban Challenges in Europe; van den Berg, L., Braun, E., van der Meer, J., Eds.; Routledge: London, UK; New York, NY, USA, 2007; pp. 333–360. [Google Scholar]
  99. Wolff, M.; Haase, A.; Haase, D.; Kabisch, N. The impact of urban regrowth on the built environment. Urban Stud. 2017, 54, 2683–2700. [Google Scholar] [CrossRef]
  100. García-Coll, A.; López-Villanueva, C. Crisis y continuidad en el urbanismo disperso: La Región Metropolitana de Barcelona. Rev. Andal. Cienc. Soc. 2019, 17, 1–21. [Google Scholar]
  101. Borsdorf, A.; Hidalgo, R. The Fragmented City. Changing patterns in Latin American cities. Urban Reinventors Online J. 2009, 3, 1–18. [Google Scholar]
  102. Borsdorf, A. Cómo modelar el desarrollo y la dinámica de la ciudad latinoamericana. EURE 2003, 29, 37–49. [Google Scholar] [CrossRef]
  103. Haddad, M.A. Residential income segregation and commuting in a Latin American city. Appl. Geogr. 2020, 117, 102186. [Google Scholar] [CrossRef]
Figure 1. Core and ring cumulative annual growth rates (CAGRs) for the 69 Spanish FUAs. Comparison between 2011–2015 (left) and 2015–2019 (right). Source: Padrón Continuo (Continuous Population Register), INE. Note: Sphere size represents metropolitan growth in absolute figures, reaching a maximum of 238,000 people (Madrid), during the second period analyzed. Blue spheres show that the whole FUA grew, whereas white ones indicate population decline.
Urbansci 05 00041 g001
Figure 2. Cumulative annual growth rates (CAGRs) for the 69 Spanish FUAs in 2011–2015 and 2015–2019. Comparison between urban cores (left) and peripheral municipalities (right). Source: Padrón Continuo (Continuous Population Register), INE. Note: Sphere size represents metropolitan growth in absolute figures, reaching a maximum of 238,000 people (Madrid), during the second period analyzed. Blue spheres show that the whole FUA grew, whereas white ones indicate population decline.
Urbansci 05 00041 g002
Figure 3. Core, ring, and the total FUA growth (for each of the five FUAs) in 2011–2015 and 2015–2019. Absolute numbers (left graph) and relative figures (right graph). Source: 2011, 2015, and 2019 Padrón Continuo (Continuous Population Register) microdata, INE.
Urbansci 05 00041 g003
Figure 4. CAGRs by municipality (for each of the five FUAs) in 2011–2015 (left) compared to 2015–2019 (right). Source: 2011, 2015, and 2019 Padrón Continuo (Continuous Population Register) microdata, INE.
Urbansci 05 00041 g004aUrbansci 05 00041 g004b
Publisher’s Note: MDPI stays neutral with regard to jurisdictional claims in published maps and institutional affiliations.

