Article

An Integrated System for Urban Parks Touring and Management

by
Kostis Pristouris
1,
Harry Nakos
1,
Yannis Stavrakas
1,
Konstantinos I. Kotsopoulos
2,
Theofanis Alexandridis
2,
Myrto S. Barda
3 and
Konstantinos P. Ferentinos
3,*
1
“ATHENA” Research and Innovation Center, Information Management Systems Institute, 15125 Athens, Greece
2
R&D Lab Omega Technology, 17676 Athens, Greece
3
Hellenic Agricultural Organization “Dimitra”, Department of Agricultural Engineering Soil & Water, Resources Institute, 13561 Athens, Greece
*
Author to whom correspondence should be addressed.
Submission received: 1 November 2021 / Revised: 17 November 2021 / Accepted: 19 November 2021 / Published: 23 November 2021

Abstract

:
Urban parks are important recreational spaces of environmental interest for citizens and city visitors. Targeted and attractive promotion of these areas can help develop alternative forms of “green tourism” and increase environmental awareness among citizens, which is particularly important and vital for the future of the planet. New technologies are a key tool for improving the experience of touring urban parks, as they can make the tour much more attractive by highlighting interesting information about the flora and fauna of the park, as well as various other points of interest. This paper presents an integrated system based on augmented reality, artificial intelligence, and data analytics methodologies, comprising both mobile and web applications, focusing on urban parks touring and management, respectively. Through the mobile app for the park visitors, an attractive, interactive touring environment is created which highlights the environmental and historical interest of those areas. At the same time, the web applications for the park managers receive and analyze visitor data to help improve the visitor experience and the overall quality of the park. Finally, the developed integrated system is evaluated to ensure that it meets all user requirements and that its usability and functional components satisfy both groups of potential users, i.e., park visitors and park managers.

1. Introduction

Urban parks are a vital part of cities around the world, accepting millions of visitors daily. They improve the quality of life by offering recreational spaces to citizens while at the same time providing substantial environmental benefits to cities. In most cases, they also constitute attractions for tourists and city visitors. However, in the majority of urban parks there is not enough technological support that could enhance visitor experience and facilitate park management.
The use of modern technologies, such as augmented reality (AR) and artificial intelligence (AI), can make touring of urban parks more attractive, safer, and more rewarding to park visitors [1,2,3], who have different needs and expectations from their visit in a park, depending on their profile. For example, families may be interested in playgrounds, joggers in running routes, while infrequent visitors may be searching for a specific meeting place. A mobile application which uses new technologies could aid all visitor categories to discover parts and uses of the park that are of interest to them, and to easily find their way around the park. In addition, such an application could promote special attractions of the park and enhance the overall experience of the visitor. On the other hand, park managers can also benefit from the use of modern technology. One of the most pressing problems they face, especially in parks that cover a large area, is the detection of problems and damages to the park’s infrastructure. Crowdsourcing can be a very effective method for instantly identifying such problems, since park visitors can report them through the mobile application. What is more, the movement of visitors inside the park can be collected in an anonymized manner and analyzed, to provide patterns of usage of the park areas: spots where people gather, pathways that are used the most, entrances/exits that are the most popular, months of the year/time of day when visits have a peak, etc. Such information can be invaluable for territorial management of green urban areas [4] and, thus, for taking informed decisions about the management of the parks.
However, the penetration of modern technology and digital tools to territorial management in rural areas has only recently started to gain ground [5,6], especially in relation to green urban areas [7]. It is a fact that territorial management of green areas in urban environments is a complicated task that requires the interconnection of various disciplines, such as landscape architecture, botany, entomology, plant pathology, etc. [8]. Smart technologies can facilitate these processes; however, the majority of current research focuses primarily on computer vision and tracking, or investigates the needs of urban residents, who are already familiar with their environment [9].
In the field of urban park touring in particular, existing AR applications are primarily aimed at facilitating visitor’s touring inside the parks, promoting specific points of interest, and improving the experience of sightseeing in the park area. The vast majority of them (e.g., REI National Park Guide and Maps [10], Tuscany+ [11], Krka National Park [12], Chimani Viewport Tool [13], and others) focus their AR features towards simple touring facilitation and the provision of information for specific points of interest (POIs), while very few of them also provide information about plants and trees of the park (e.g., Central Park Entire [14]) or allow the users to report specific problems in the park (e.g., Park Path™-Local Park Finder [15]). More recently, agricultural parks have been explored as a way to develop tourism in the periurban areas [16], while technological innovation has been used to develop a mobile app for such a park via a virtual tour [17].
VR-Park [18] is a project that addresses the above issues and uses as a case study the “Pedion Areos” park [19], a prominent park in Athens, Greece. It comprises a mobile phone application used by the park visitor, and web-based applications used by the park managers. The mobile application includes object detection and AR capabilities for presenting context-specific information to the visitor. It also collects and transmits crowdsourcing information and visitor location data for use by the administrator applications. One administrator application presents and manages problems (issues) and damages to the park and its infrastructure, as reported by the visitors. Another administrator application displays collective information about the visitor’s movement inside the park as well as the comparative usage of the various park areas and pathway segments. Therefore, the overall focus of the web applications is on improving park management and maintenance operations related to the optimization of park activities organization, routes and spaces usage, resolution of reported problems of technical nature in park equipment or plant material, and generally improving the overall operation of the park and the relevant services provided to its visitors.
The aim of this paper is to present the design methodology and the main features and functionalities of the integrated system that combines the above-mentioned applications. Furthermore, through proper evaluation of the system, the final goal of this study is to ensure that the developed system meets the user requirements defined prior to its design and development, as well as those specified by the relevant standards for the usability and usefulness of AR-based and statistical data analysis systems, and also to assess its usability and functional components by both groups of potential users: park visitors and park managers. To this end, initially, the design and implementation methodologies of the integrated system are presented. Next, the subsequent two sections deal with the demonstration of the mobile application which focuses on enhancing the park visitor experience, and the web applications dedicated to supporting the park manager. Consequently, the assessment of the system after adequate testing on simulated data, as well as on the pilot park of the “VR-Park” project, is presented and analyzed. Finally, some relevant conclusions are drawn.

2. System Design and Methodology

2.1. System Design

The structure of the developed integrated system for urban parks touring and management was based on the user requirements that were initially identified and led to the definition of specific usage scenarios of the system. Potential users included both park visitors and park managers, and the basic usage scenarios were (i) urban park touring, (ii) input and management of entities of interest, (iii) two-way communication of the two main interest groups (visitors and park managers), and (iv) exploitation of park visitors touring data. Based on that, the integrated system was structured in the following four sub-systems (Figure 1):
  • Touring subsystem: This subsystem provides information and navigation services to park visitors through an AR environment supported by AI models for object detection in video and images.
  • Entities and information editor subsystem: This subsystem provides functions for input and management of the points of interest of the park to the administrator of the system and/or the park managers. These points of interest are incorporated into the visitor’s mobile app. The subsystem also provides editing capabilities for menus and specific functions of the app.
  • Notifications management subsystem: This subsystem coordinates the two-way communication between the two distinct groups of system users: park visitors and park managers. This communication concerns two types of messages: park issues reports submitted by the visitors and managed by the park managers and announcements/notifications created by the park managers and received by the visitors.
  • Visiting and touring data subsystem: This subsystems collects, analyzes, and exploits park visiting and touring data, by using anonymized information on the behavior of park visitors. It is used by the park managers through the corresponding web application of the system, to analyze visitors touring habits and patterns so that park operation can be improved.
Each of the above subsystems includes the necessary infrastructure and backend or frontend features, which are presented in Section 3 and Section 4 below. In addition, to complete their individual functions, the subsystems are required to exchange and share data structures between them. In order to communicate as independently and as asynchronously as possible, the architecture incorporates a Data Synchronization Interface, in which the individual communication functions between the subsystems is assembled (Figure 1) [20].

2.2. Augmented Reality Methods

The AR features of the visitor’s mobile app were implemented with AR Foundation package of Unity3D [21]. The implementation consisted of 3D objects with text at the location of an entity defined by its registered coordinates in the backend of the visitor’s app and lines shown the direction of the objects and their distance from the mobile device. AR Foundation can be used on iOS devices with ARKit support and on Android devices with ARCore support. Devices must also have functioning magnetic and GPS sensors and for better performance, a working gyroscope is also recommended.

2.3. Object Detection Methods

The required mobile application information concerning position and orientation of the park visitor is provided by the GPS and digital compass of the mobile device, respectively. However, the delivered accuracy is usually not sufficient for a seamless and well-aligned overlay of AR information on the screen. In cases where the distance between the device and some object of interest becomes smaller than the GPS accuracy, the localization and tracking of that object on the screen becomes very problematic. Another problem, which specifically concerns plants and trees in the park, is the fact that flora constitutes a dynamic setting, as plants are replanted at different spots throughout the year, seasonal plants or damaged plants are removed, etc. In addition, several plants can be too close to each other for a GPS-based device to be able to distinguish them.
These problems were resolved by making the user’s device “aware” of the actual position of each object of interest, in relation to the position and orientation of the user, through the use of object detection and identification models. For that purpose, specialized models for the identification of specific objects of interest (e.g., statuses, monuments, buildings, park equipment) and plants and trees usually found in urban parks were developed and integrated into the AR mobile application.
The automated identification of objects through visual recognition from the information provided by the camera of the mobile device was realized using deep learning algorithms [22] for object detection in image and video, based on Convolutional Neural Networks (CNNs) models [23]. For that purpose, the YOLOv3 model was used [24], mainly because of its speed and accuracy in complex object detection applications.

3. Enhancing the Park Visitor Experience

The visitors of the park can install on their mobile devices (smartphone or tablet) the visitor’s app. The app provides guiding features to the visitors and promotes, in an AR environment, the points of interest of the park and information about park events. The visitors can report specific problematic situations of the park (park issues). In addition, after users’ approval, the app sends their movement data to the “Park Visitor Activity” web application, in an anonymized way.
The visitor’s app is supported by a backend which includes functions for updating the visitor’s app to new data. Its role is to provide input, management, and selection functions of the park’s entities of interest that are included in the visitor’s app environment. In addition, it provides the ability to customize the menus and options of the app’s user interface, based on the specific characteristics of each park.

3.1. Backend of the Park Visitor App

The backend is the interface through which all content and user management tasks are performed and the database of the park visitor’s mobile app is created and maintained. These tasks include the following:
  • Category Management: Authorized users can introduce new entity categories into the park, modify existing ones, or delete them.
  • Entity Management: Authorized users can enter new entities into the park, modify existing ones, or delete them. For each field of documentation of each entity, it is possible to register the translation in multiple languages.
  • Augmented Reality Management: Authorized users can connect an augmented reality marker to a park entity so that, when identified, the elements of that entity can be displayed on the screen of the app.
  • Spatial Data Management: Through a map interface, but also with the ability to directly enter the coordinates, entities of the park are spatially referenced.
  • Route Management: Authorized users can enter suggested routes that are offered to the visitor. These can include thematic routes based on park monuments and places of interest, educational or sports purposes, etc.
  • Visitor Application Update: When authorized users have completed their desired changes, they can create a new updated version of the database of the app, which can be downloaded to visitor’s devices when they open the app. The update is carried out through a dedicated Application Programming Interface (API). Oauth2 for secure access via Client Id and Client Secret, Access and Refresh tokens are used for the communication.
  • Event Management: Authorized users can enter actions and events that take place in the park (by entering a description and coordinates, so that visitor routing to the designated place can be provided). When authorized users add a new action/event or modify an existing one, a new database update is created automatically.
  • User Management: The backend subsystem includes the user management application and the update management application. User management is common to both subsystems. The administrator is able to import users and assign them roles.

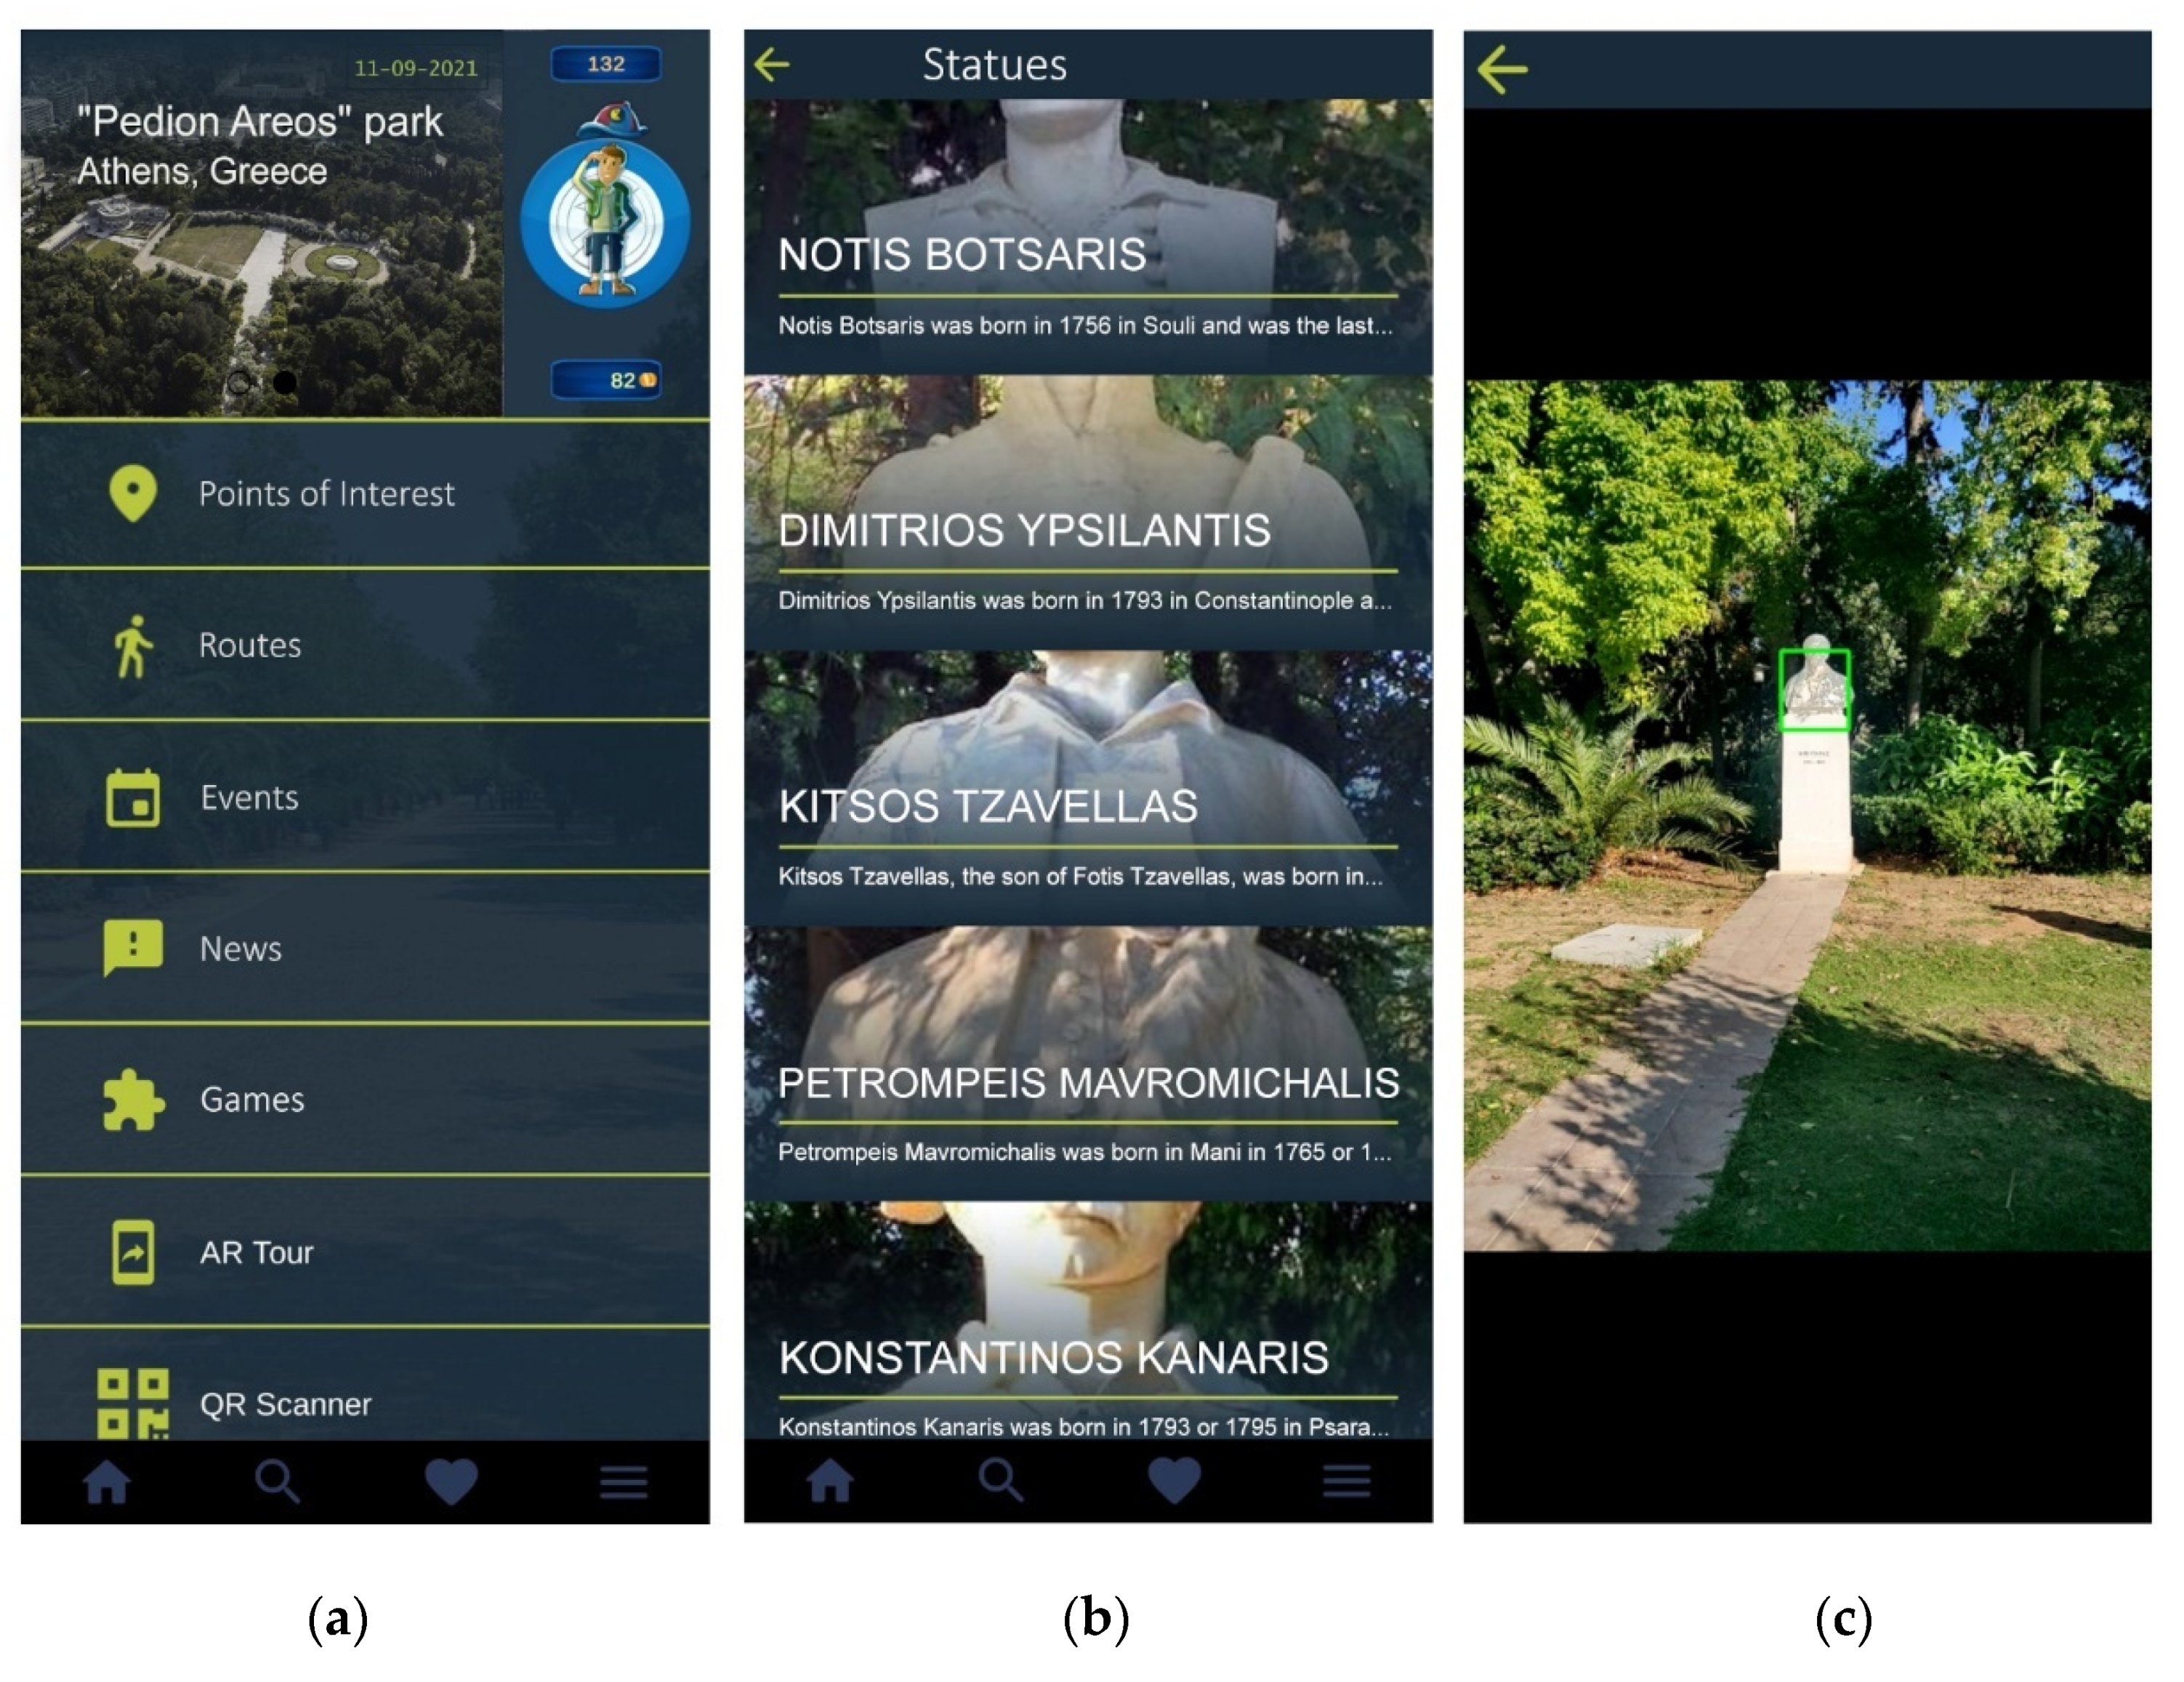
3.2. Park Visitor Mobile App

Park visitor’s mobile app is a complete augmented reality application for visitors of urban parks through which, an attractive, interactive browsing environment is created that highlights the elements of environmental and historical interest of each space (some basic screenshots of the app are shown in Figure 2).
The main features of the application are listed below:
  • Content categories: Refers to the categorization of the entities of the park.
  • Suggested routes: Routes of special interest in the park, proposed by the system administrator.
  • Entities: Points of interest of the park, with detailed description.
  • Favorites: List of selected points of interest of the visitor/user, for easy access.
  • Create a personal path: The visitors can create their own paths by entering a route name and selecting entities which will comprise the path.
  • Content search: The visitor can search for information contained in the titles or contents of the entities.
  • AR Tour: User-selected points of interest of the park are dynamically shown on the camera view of the mobile device, as described in the following sub-section.
  • Object detection: The visitor can use the object detection feature by pointing the camera to specific points of interest, which are automatically identified, and their registered information appears on the screen (Figure 2c).
  • QR Scanner: QR codes recognition of selected entities, if they have designated QR tags in their physical locations. This feature can be used in parks where no AI models have been developed for the “Object detection” feature of the app.
  • Gamification: The location is also used in a gamification framework based on the adaption of 3D guides gamification framework [25].
  • Park issue report: The visitor can report an issue that encounters in the park by providing the category of the problem, a description, and (optionally) a corresponding photograph, while the location is sent automatically. This information is sent to the “Park issues management” application described in Section 4.2.
  • News and events: This feature contains information about current and future happenings and events that take place in the park.
  • Navigation: With the navigation option, the visitors are guided to the points of interest they have selected or to the first point of a selected route. This option activates the device’s camera and displays directions to the selected point (Figure 3). The arrow that appears does not indicate where the entity’s position is but where the visitors should move to reach the next waypoint where the direction of the path changes.

AR Tour

The visitor’s app uses AR technologies and based on the user’s position and field of view provides, in real time, information about the entities (trees, thematic gardens, statues, monuments, etc.) which are in the user’s field of view. It uses both GPS data and AR tracking. It places 3D objects with text in the location of an entity defined by its registered coordinates in the backend of the visitor’s app. Lines towards the 3D objects show their direction and distance from the user (Figure 4). The visitors can select their desired points of interest to be included in the AR Tour. Clickable AR hotspots are activated when the user is near a point of interest.

4. Supporting the Park Manager

This section describes how the VR-Park system supports the park manager in analyzing park visitor’s activities, managing reported issues, and improving the park overall experience and operation.

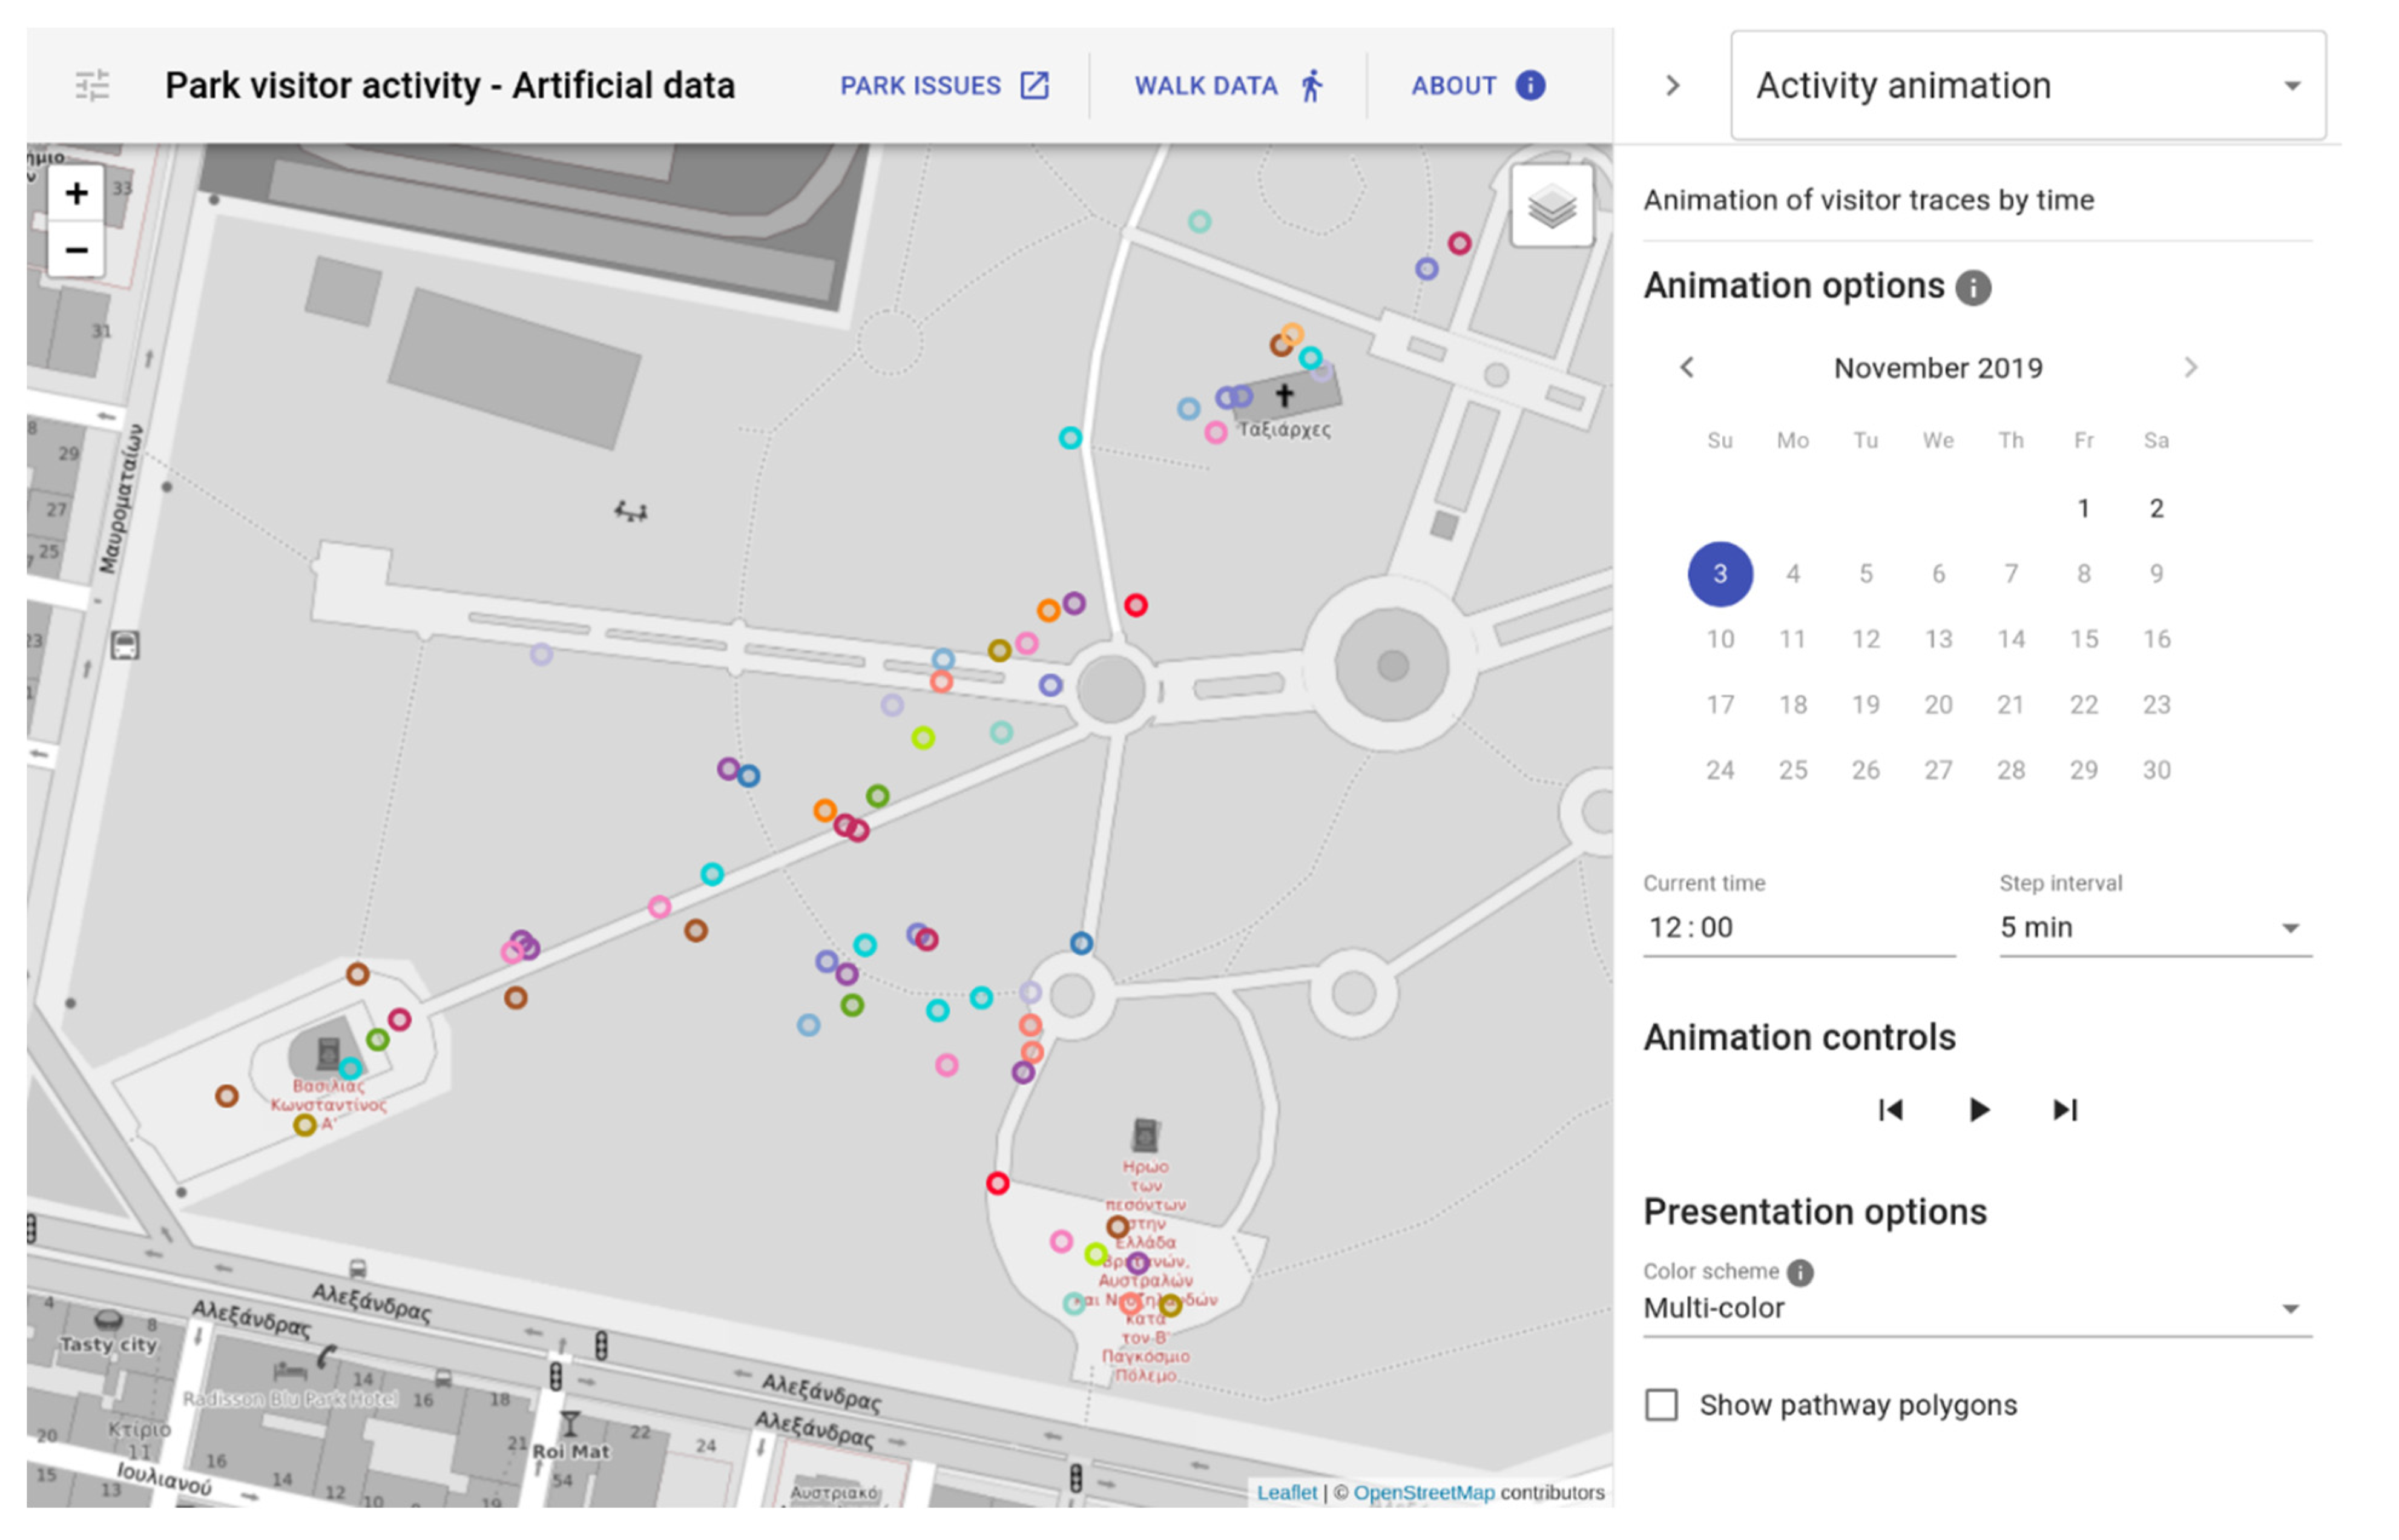
4.1. Assessing Park Visitor Activity

4.1.1. Activity Animation

The “Park Visitor Activity” application is available at [26]. In this section, the term user refers to the park manager(s).
The “Activity animation” screen consists of a central map and a right sidebar and is presented in Figure 5. In the central map, the user can examine visitor traces either as static images or as an animation. In the “Animation options” section of the right sidebar, the user can choose a date and a time of day. The Park visitor traces for the specified point in time are then displayed on the park map. The user may choose the temporal step between two consecutive frames for the animation of park visitor traces. The available values for the interval between consecutive frames are 1, 5, 10, and 15 min. In the “Animation controls” section of the right sidebar, the user may control the visitor trace animation, using buttons to commence the animation, halt the animation, move one frame ahead of the current point in time, and move one frame back from the current point in time. Visitor traces can be colored using discrete colors, so that each (anonymized) visitor may be examined separately, or using just one color, so that visitor presence may be examined as a cloud. The user may also choose whether or not to display the Park pathways on the map.

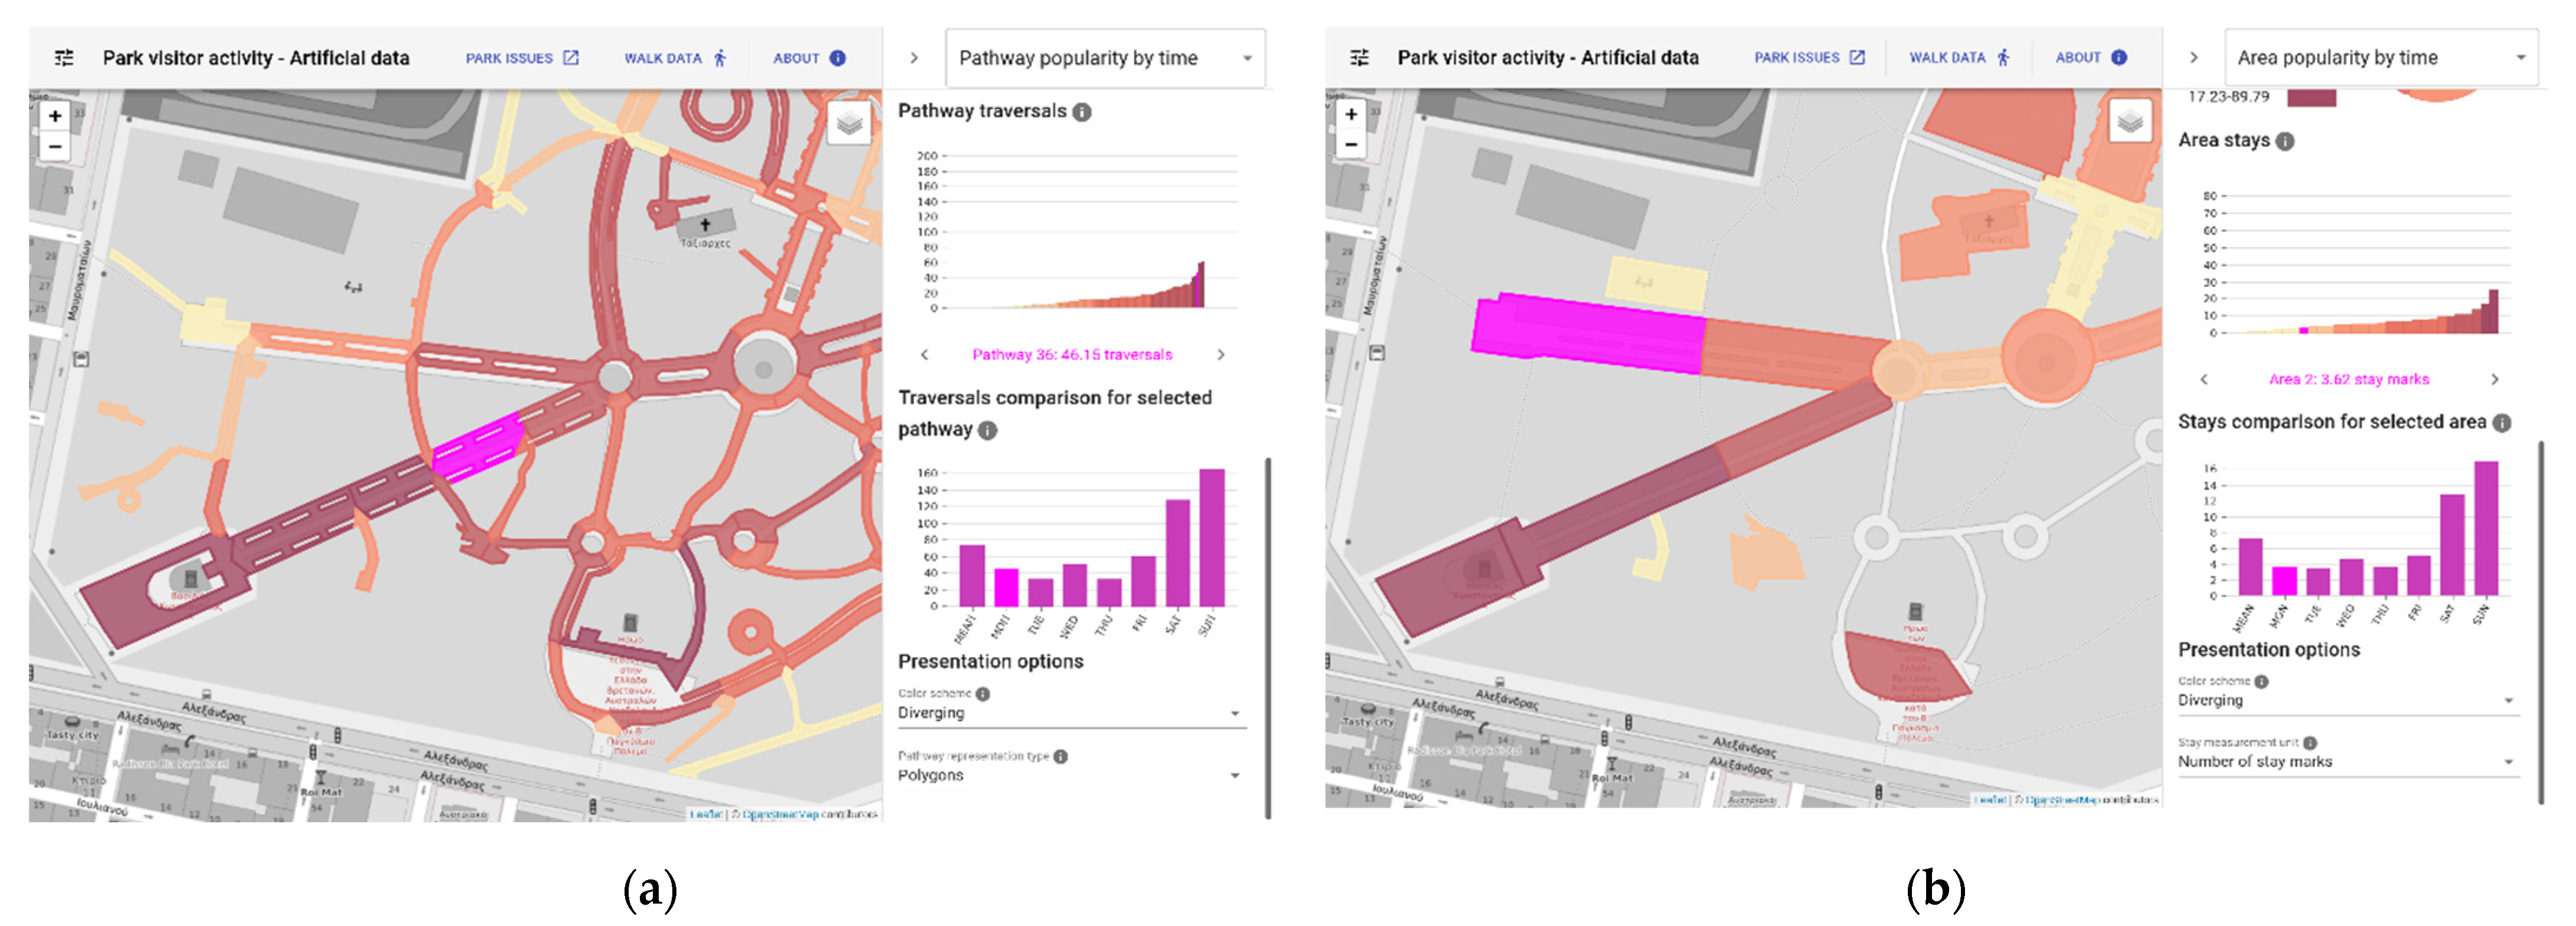
4.1.2. Pathway and Area Popularity

In the “Pathway popularity” and “Area popularity” screens (Figure 6 and Figure 7 respectively), the user can examine the popularity of park pathways and park areas, respectively. To estimate the popularity of pathways, the number of visitor traversals is used, while the number of stay marks and the stay durations are used to estimate the popularity of predefined areas of interest. Both screens consist of a central map, a left sidebar, and a right sidebar. The left sidebar (shown in Figure 7) accommodates filters for selecting the data to use according to temporal and demographic criteria. The right sidebar is described in what follows.
In the “Pathway classification” and “Area classification” sections of the right sidebar, displayed in Figure 6 and Figure 7 the user can choose the pathway/area classification method with respect to popularity. Pathways/areas are classified into six groups, each group being represented by a unique color on the map and charts. The equal-count classification method yields groups of equal number of Park features (and probably different range intervals), while the equal-interval classification method yields groups of equal range intervals (and probably different number of park features). Popularity value ranges and park feature group sizes are presented in a legend and a pie chart, respectively. Below this, the user may examine the park feature popularity ranking on a bar chart, with ascending popularity. Each bar is colored with the color of the group that the park feature has been classified into. The user can select a bar, so that the respective park feature is highlighted on the map and use buttons to navigate to the park features of directly lower or higher popularity. In the “Presentation options” section of the right sidebar, the user may specify the color combination used for coloring park feature groups on the map and charts, as well as the way in which pathways are represented on the map.

4.1.3. Popularity by Time

The “Pathway popularity by time” screen is presented in Figure 8a and the “Area popularity by time” screen is presented in Figure 8b. In these screens, the user can examine and compare how the popularity of pathways and areas evolve across time. The screens follow the layout of the “Pathway popularity” and “Area popularity” screens described before, with two additional sections which are described next.
In the “Comparison mode” section of the right sidebar, the user can specify the temporal facet (month, day of week, or hour interval) by which park feature popularity is examined. The user selects whether the popularity value displayed is the mean popularity across all values of the temporal facet specified. If the mean popularity is not selected, then a slider can be used to specify a month, day of week, or hour interval accordingly. In that case, the popularity value displayed is the mean popularity with the averaging restricted to the selected month, day of week, or hour interval (e.g., the mean value for all February months across all years, if the month facet is selected and the slider is set on February).
In the “Traversals comparison for selected pathway” section of the right sidebar (Figure 8a) and in the “Stays comparison for selected area” section of the right sidebar (Figure 8b), the user can examine the change on the popularity of a single park feature that has been selected, with respect to the specified temporal facet.

4.2. Crowdsourcing Park Issues

The “Park issues management” application is used by the park managers to review issues reported by Park visitors, and to manage and track the progress of works related to resolving those issues. It leverages the functionality included in the Visitor Mobile Application, described in Section 3, which allows visitors to send problematic issues about the park to the park managers. The “Park issues management” application includes reports filtering capabilities so that the park managers can focus on particular issues according to some set criteria.
One key feature of the application is the prioritization of the various problems according to the popularity of the park locations affected. The idea is that park managers would like to push forward with resolving those issues that are associated with the most popular park areas. To achieve this, the application communicates with the “Park visitor activity” application, described in the previous sections, to get the most popular park areas and pathways. Figure 9 presents the user interface of the Park issues application with the open issues located in the 10 most popular areas of the park.

4.3. Making Sense of Visitor Movement Data

A major step for assessing the park visitor activity is to make sense of the visitor raw movement data. The “Visitor Mobile application” collects anonymized raw location data from the mobile phones of park visitors and makes them available in a bulk fashion to the “Park visitor activity” application. Location data (position reports) are then processed and classified in two distinct categories, park pathways movement data and park area stays data.
The first processing step is to identify position reports that correspond to time periods during which the visitors remained more or less stationary inside or near designated areas of interest in the park. A position report is considered a stay-point if it is a part of, and in close enough proximity to, other sequential position reports collectively spanning a sufficiently large time range. More formally, a time-ordered sequence of position reports {tri, tri+1,…, trj} is a stay-points sequence, if the following hold [27]:
  • distance(tri, trx) ≤ maximum_distance x: I < x ≤ j
  • |trj.timestamptri.timestamp| ≥ minimum_time_interval
The maximum distance constant has been set to 30 m and the minimum time interval to 5 min. In order to associate each stay with a certain area of interest in the park, a maximum distance of 5 m is considered when determining the polygonal area closest to a stay point. All these parameters can adapt to different parks and sampling configurations for the movement data. With a position report sampling period of 30 s, a sequence of stay points should have at least 11 position reports. Figure 10b (in Section 5.2) depicts an example of visitor stays computation. The orange-colored polygons represent the park areas of interest. The walk as a whole is visualized using the nodes for each position report and directed edges showing the sequence of visitor positions. The nodes in gray are traversal points and the ones in red stay points. Each stay point is associated with the area that contains it, or with the nearest area with a maximum distance of 5 m.
The next step is to process the remaining position reports, i.e., those that are not classified as stays, and convert them to actual visitor traversal data. The Park pathways have been partitioned into separate sections, mostly corresponding to segments between path crossings in the park. A visitor is then considered to have traversed such a path segment if there are any position reports located inside it. The position reports collected may exhibit repetitions of a visitor’s presence in a segment, or may include movement indicating that the visitor shortly back-tracked to a previous path segment before moving along. We count multiple position reports that are all located inside the same path segment as one traversal. If a visitor is detected to move back and forth between two path segments (for example walking back and forth while talking to the phone), we only regard this back-tracking once. In computing the count of path segment traversals during a visitor’s walk, we first overlay the position reports with the polygons representing the surrounding area of a path segment. This way we produce a sequence of path segments for each walk. We then eliminate sequential repetitions of the same segment so that we only count a traversal of each segment just once. Finally sequential repetitions of the same sub-sequence of two path segments are also eliminated to produce the final traversal sequence.

5. System Evaluation

5.1. Evaluation Methodology

For the evaluation of the developed integrated system, the methodologies of formative evaluation and summative evaluation were used.
The overall objective of the formative evaluation was to ensure that the developed system meets the user requirements defined prior to its design and development, as well as those specified by the relevant standards for the usability and usefulness of AR-based and statistical data analysis systems. To this end, the main objectives of the formative evaluation were to:
  • identify problems related to functional and non-functional properties of the developed system and its individual functional subsystems;
  • Assess whether the system and its individual functional components meet the requirements and needs of their users (park visitors and park managers);
  • present information and suggestions for further development and improvement of the system.
The overall objective of the summative evaluation was to assess the use of the developed system and its functional components by both group of users: park visitors and park managers. To this end, the main objectives were to:
  • Verify whether the developed system is achieving its objectives:
  • Enable park visitors to better explore urban parks and park managers to use exploration data to improve the provided services and the park operation in general;
  • Verify how the integrated system and its functional components serve the needs of the users;
  • Identify the impact of the technologies involved, including potential advantages and weaknesses of use, as well as relevant usage properties.
The final goal of the summative evaluation was to demonstrate the added value of the developed system and its impact on making urban parks more attractive to citizens and on optimizing the management processes involved in their operation and maintenance.

5.2. Simulating Visitor Activity Data

The main evaluation of the park manager web applications of the system was based on simulated visitor activity data. This approach was adopted because the collection of a sufficient amount of data from actual park visitors in a very short period of time could not be feasible. “Walk Data Maker” is a tool that was developed to automatically generate artificial walk data. Although the main goal was to supply the generated data to the “Park Visitor Activity” application to test and evaluate the application, “Walk Data Maker” operates autonomously and can be used to generate arbitrary movement data towards any use. Data generation is regulated by several parameters described below. The key challenge in the development of “Walk Data Maker” was that the artificial data should be as realistic as possible, in order to be useful as an alternative to actual visitor data. The goal was that data generated by “Walk Data Maker” should neither seem too random, nor too “artificial”, while simulating a visitor that, within a time limit, starts from a park’s entrance, is set to reach a destination within the park, and is eventually directed to an exit. The “Park Visitor Activity” application, which is available at [28], was populated with walk data generated by “Walk Data Maker”.
The “Walk Data Maker” application receives the following parameters:
  • Number of walks to generate.
  • Date and time range for walk start times: Start times of generated walks will fall within the specified date and time range.
  • Month weights for walk start times: The probability that a walk starts on a specific month is proportional to the corresponding weight.
  • Day of week weights for walk start times: The probability that a walk starts on a specific day of week is proportional to the corresponding weight.
  • Hour interval weights for walk start times: The probability that a walk starts during a specific hour interval is proportional to the corresponding weight. Separate hour interval weights are supplied for business days and non-business days.
  • Walk area: The polygon area within which, movement is allowed.
  • Walk grid used by pathfinding: The raster grid used for movement in pathfinding operations. The raster for the case of Pedion Areos has 4 m × 4 m cells.
  • Walk start and final destination areas: Polygon areas where walks start and end. The walk start and final destination locations will be randomly selected from within the specified polygons. The polygons for the case of Pedion Areos correspond to the entrances/exits of the park and are presented in Figure 10a.
  • Walk intermediate destination areas: Polygon areas that walks go through. The walk intermediate destination location will be randomly selected from within the specified polygons. The polygons for the case of Pedion Areos represent selected areas of the park and are presented in Figure 10b.
  • Walk generation method: The supported methods for generating walks are described in the following part.
The methods for generating walks supported by “Walk Data Maker” are the following:
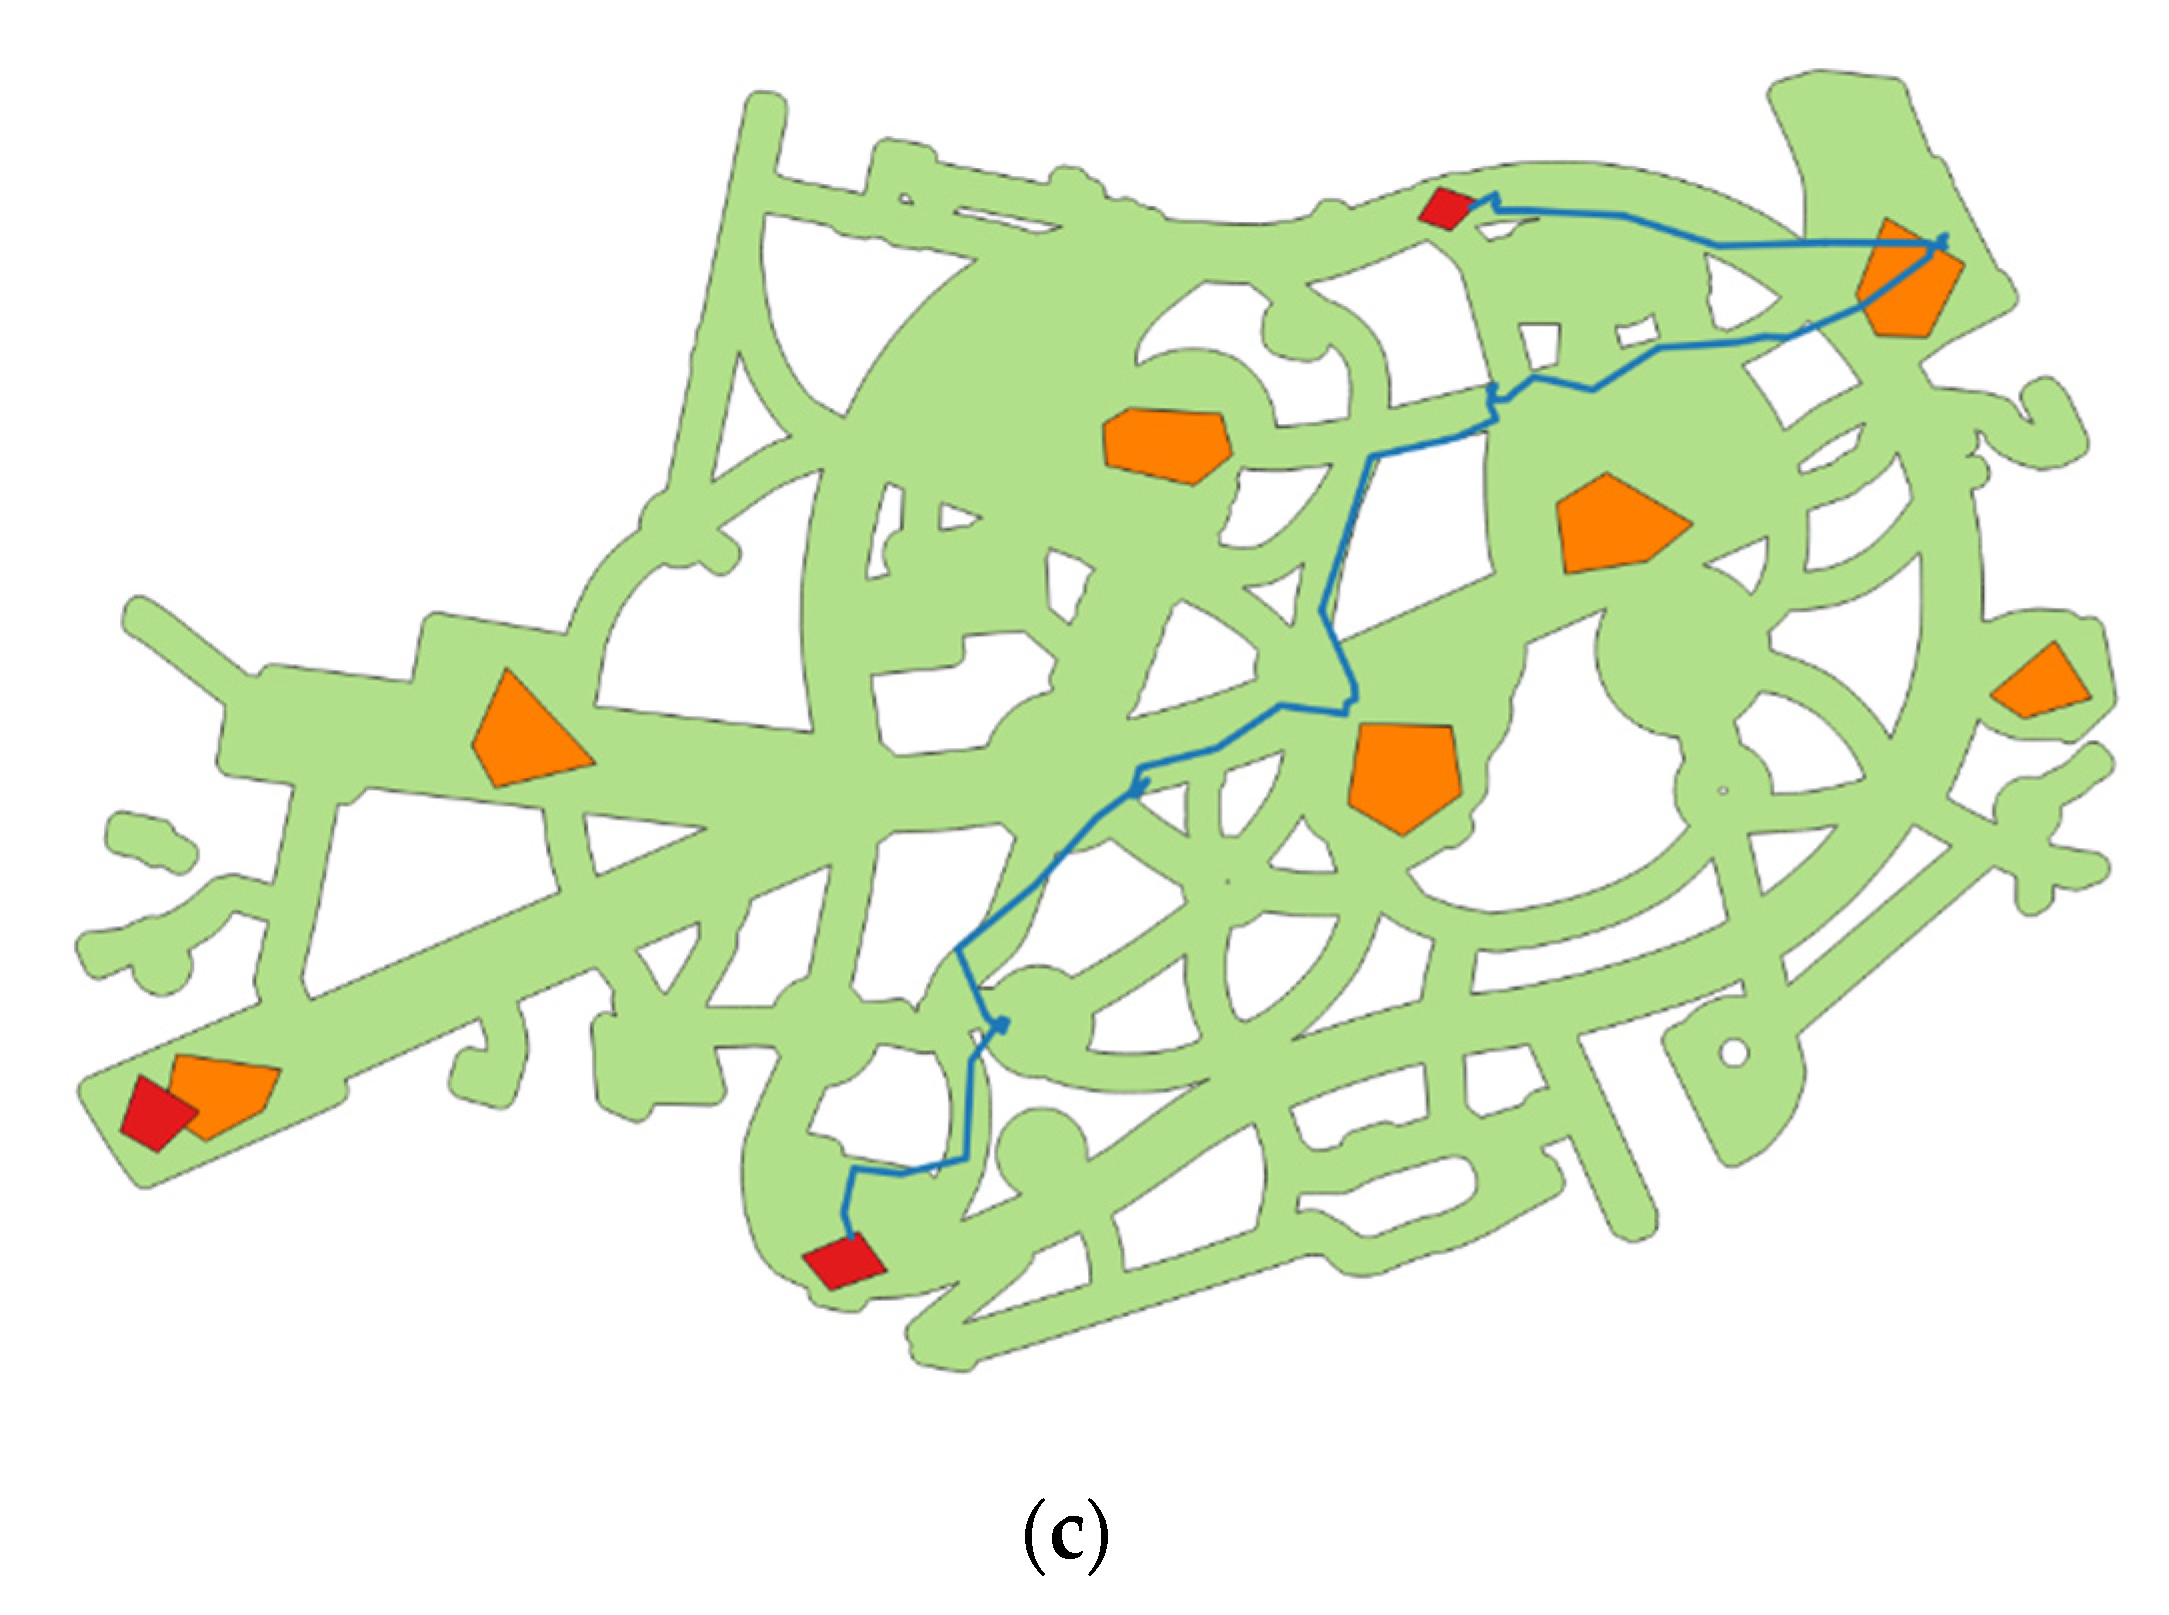
  • Random: The random generation method attempts to connect the walk start location initially to the walk intermediate destination location and subsequently to the walk final destination location using random movements. Higher probability is given to movements directed towards the destination at the time, rather than to movements not directed towards it, in order to increase the probability of the generation to succeed within a limited number of steps. A walk generated by the random generation method is presented in Figure 11a.
  • Pathfinding: The pathfinding generation method attempts to connect the walk start location initially to the walk intermediate destination location and subsequently to the walk final destination location using pathfinding. The pathfinding generation method employs the walk grid and uses the A* algorithm to find the shortest path to the destination at the time. A walk generated by the pathfinding generation method is presented in Figure 11b.
  • Hybrid: The hybrid generation method attempts to connect the walk start location initially to the walk intermediate destination location and subsequently to the walk final destination location using both random movements and pathfinding. The hybrid generation method alternates between the random generation mode and the pathfinding generation mode. When in the random generation mode, a random movement is performed. When in the pathfinding generation mode, the walk grid is employed and the A* algorithm is used to find the shortest path to the destination at the time. The path found is then followed for a limited distance. Each time the generation mode at the time completes a step in the generation process, the generation mode for the next step is randomly selected. A walk generated by the hybrid generation method is presented in Figure 11c.
As Figure 11a,b respectively demonstrate, walks generated using the random walk generation method exhibit too much jitter, while walks generated using the pathfinding generation method are too robotic. On the contrary, as is illustrated in Figure 11c, walks generated using the hybrid walk generation method appear natural enough. The hybrid walk generation method was successfully used in our case to create a humanized artificial dataset suitable for testing the “Park Visitor Activity” application.

5.3. The “Pedion Areos” Park Experience and Adaptation to Other Parks

For the basic features of “AR tour” and “Object detection” to work in the park, appropriate deep learning models need to be developed and geolocations of all objects of interest of the park need to be registered in the backend of the system. The following three object detection models were developed for the pilot park of the “VR-Park” project (“Pedion Areos” park), based on the methodology presented in Section 2.3:
  • A general object identification model;
  • A statues and monuments identification model;
  • A plants and trees identification model.
The first model included the identification of 13 different objects usually found in urban parks, such as benches, light poles, garbage bins, statuses, trees, plants, flowers, signs, etc. In that model, plants and trees were identified as general entities, not at the level of species recognition. The second model concerned the identification of statues and monuments and was specifically designed for that kind of objects in the pilot park of “Pedion Areos”, which included 22 different statue busts and 6 monuments. Finally, the third model was focused on the identification of 24 different plant and tree species commonly found in Mediterranean urban parks [29]. Training data for these models included photographs taken in the pilot park under various environmental conditions concerning seasonal, weather, and lighting variations. A total of 5700 photographs were used for training and testing the models (669 for the first model, 1570 for the second, and 3461 for the third, with the numbers also revealing the relative complexity of the tackled tasks), while testing was also performed in videos taken by smartphones in the park. Model’s performance assessment was measured by the usual metrics of precision, recall, F1 score and mAP (mean average precision). Representative output examples of the models are shown in Figure 12, where a specific video frame is shown together with the respective outputs of each model on that frame.
The second model (statues and monuments identification model) was initially implemented in the current version of the mobile application. The model was tested in the park using the “Object detection” function of the app, with very satisfactory results, under various weather and light conditions. Most of the other functionalities of the app were also tested in the park, with the exception of the “QR scanner” function, which was obsolete because of the existence of the object identification model. Focus was given to the evaluation of the “AR tour” feature. Testing was performed by a group of users who installed and used the mobile app in various areas of the park, while another group of park managers tested the web applications of the system. Final evaluation of the integrated system was based on the analysis of appropriate questionnaires answered by all test-users. The analysis showed satisfactory performance of both types of system applications and overall good adoption of the provided functions. It also revealed some minor functional issues that should be resolved in future updates of the applications.
It should be noted here that this feature of the visitor’s mobile app is general enough to be applied to any other urban park, while the same holds of course for all the subsystems. The basic requirements for the adaptation of the integrated system to other parks are the registration of the park’s map and points of interest (geolocation and relevant information) in the system’s backend, and the development of the relevant deep learning models for the automatic identification of specific park entities (objects, plants, or both). These models need to be integrated into the application by the system administrator.
In addition, the territorial factors that can enable the integrated system to function properly are the availability of digitized points of interest in the park, the existence of specific paths that are digitally mapped, the accessibility (via the paths) to specific parts of the park where these points of interest are located, and the availability of Internet access throughout the park area.
Finally, even though the presented system is focused on park touring and management, it could be easily modified to be used to relevant scenarios, such as environmental protection applications, green tourism applications with AR features, etc. In the case of environmental protection in particular, the issue reporting feature of the mobile application and the relevant park issue management web application can already be used to report and handle problems related to environmental issues, such as, e.g., water leakage, environmental pollution issues, etc.

6. Conclusions

An integrated system for urban parks touring and management, based on augmented reality, artificial intelligence, and data analytics methodologies, was presented. The system comprises a mobile application for the park visitors and web applications for park managers. The combination of both types of applications, mobile for the park visitor and web-based for the park manager, makes the developed system unique in its completeness in comparison to existing relevant systems for urban park touring and extends its usability to cover all potential types of users involved in both urban parks touring and management. The overall functionality of the system and its evaluation showed that the use of new technologies such as AR, deep learning, and data analytics can make urban parks more attractive and optimize their management, leading to a better use of green spaces in cities, as well as to a further increase in citizens’ awareness of environmental issues. In practice, this translates to more visitors in urban parks, better touring experience, and potential benefits for the environment that come from the eventual shift of citizens towards environmentally friendly recreational activities, and the optimization of park management processes and actions. In addition, the use of smart technologies, such as AI and AR, and the freedom left to the user to choose what information to see in the app based on his/her interests and/or the interaction with the park environment, ensure that the park experience itself will not become a replicable product.
There are of course some limitations in specific aspects of the operation of the presented system, which are planned to be improved in future versions, mainly of the mobile application, such as the rather limited number of plant species that are automatically identified and need to be expanded, the size of the application due to the inclusion of the models which are going to be reduced in future versions, and some other minor features that can be improved based on the suggestions of test-users during system evaluation.

Author Contributions

Conceptualization, K.P.F. and Y.S.; methodology, Y.S., K.I.K., M.S.B. and K.P.F.; software, K.P., H.N., K.I.K. and T.A.; validation, M.S.B. and K.P.F.; writing—original draft preparation, Y.S., K.I.K. and K.P.F.; writing—review and editing, K.P.F. and Y.S.; supervision, K.P.F. and Y.S.; funding acquisition, K.P.F., Y.S. and T.A. All authors have read and agreed to the published version of the manuscript.

Funding

This research has been co-financed by the European Union and Greek national funds through the Operational Program Competitiveness, Entrepreneurship, and Innovation, under the call RESEARCH-CREATE-INNOVATE (project code: T1EDK-02182).

Institutional Review Board Statement

Not applicable.

Informed Consent Statement

Not applicable.

Conflicts of Interest

The authors declare no conflict of interest.

References

  1. Pombo, L.; Marques, M.M.; Carlos, V.; Guerra, C.; Lucas, M.; Loureiro, M.J. Augmented Reality and Mobile Learning in a Smart Urban Park: Pupils’ Perceptions of the EduPARK Game. In Citizen, Territory and Technologies: Smart Learning Con-Texts and Practices. SLERD 2017. Smart Innovation, Systems and Technologies; Springer: Cham, Switzerland, 2017. [Google Scholar] [CrossRef]
  2. Dieck, M.C.T.; Jung, T. A theoretical model of mobile augmented reality acceptance in urban heritage tourism. Curr. Issues Tour. 2018, 21, 154–174. [Google Scholar] [CrossRef]
  3. Kounavis, C.D.; Kasimati, A.E.; Zamani, E. Enhancing the Tourism Experience through Mobile Augmented Reality: Challenges and Prospects. Int. J. Eng. Bus. Manag. 2012, 4, 10. [Google Scholar] [CrossRef]
  4. Oxoli, D.; Brovelli, M.A. Citizen-Generated geodata for natural parks use analysis: Insights from facebook in the Insubria region. ISPRS Int. Arch. Photogramm. Remote Sens. Spat. Inf. Sci. 2021, XLIII-B4-2, 195–199. [Google Scholar] [CrossRef]
  5. Foronda-Robles, C.; Galindo-Pérez-De-Azpillaga, L. Territorial intelligence in rural areas: The digitization of non-profit associations through social media. Technol. Soc. 2021, 64, 101459. [Google Scholar] [CrossRef]
  6. Buyanova, M.A.; Kalinina, A.A.; Shiro, M.S. Smart City Branding Massively Expands Smart Technologies. Lect. Notes Netw. Syst. 2021, 155, 1063–1069. [Google Scholar] [CrossRef]
  7. Bratuškins, U.; Zaleckis, K.; Treija, S.; Koroļova, A.; Kamičaitytė, J. Digital Information Tools for Urban Regeneration: Capital’s Approach in Theory and Practice. Sustainability 2020, 12, 8082. [Google Scholar] [CrossRef]
  8. Parrinello, S.; Bertocci, S.; Niccoli, A.; Tiberi, R. The management of green areas in the urban environment. J. Biodiv. Ecol. Sci. 2011, 1, 270–279. [Google Scholar]
  9. Yovcheva, Z.; Buhalis, D.; Gatzidis, C.; Van Elzakker, C.P. Empirical Evaluation of Smartphone Augmented Reality Browsers in an Urban Tourism Destination Context. Int. J. Mob. Hum. Comput. Interact. 2014, 6, 10–31. [Google Scholar] [CrossRef] [Green Version]
  10. REI Mobile Apps, Always Ready for Your Next Adventure. Available online: https://www.rei.com/mobile (accessed on 23 October 2021).
  11. Augment Your Journey, Tuscany. Available online: http://augmentyourjourney.altervista.org/en-tuscany (accessed on 4 March 2019).
  12. Augmented Reality of Krka National Park Available via a New Mobile Application. Available online: http://www.np-krka.hr/clanci/AR-Krka-National-Park-Tour-pro%C5%A1irena%20-stvarnost/262/en.html (accessed on 4 March 2019).
  13. Using Chimani’s Viewport Tool to Navigate Bryce Canyon National Park. Available online: https://blog.chimani.com/2016/06/28/using-chimanis-viewport-tool-to-navigate-bryce-canyon-national-park (accessed on 20 January 2019).
  14. Central Park Entire. Available online: http://www.centralparkentireapp.com/about.html (accessed on 20 January 2019).
  15. Park Path App. Available online: https://www.nrpa.org/our-work/park-path-app (accessed on 4 February 2019).
  16. Spagnoli, L.; Mundula, L. Between Urban and Rural: Is Agricultural Parks a Governance Tool for Developing Tourism in the Periurban Areas? Reflections on Two Italian Cases. Sustainability 2021, 13, 8108. [Google Scholar] [CrossRef]
  17. Scarica l’app del Parco. Available online: https://opencms10.cittametropolitana.mi.it/parco_agricolo_sud_milano/applicazione/index.html (accessed on 13 November 2021).
  18. VR—Park Project. Available online: https://vr-park.org (accessed on 23 October 2021).
  19. Pedion Areos—Athens, Greece. Available online: https://athensattica.com/things-to-do/parks/pedion-areos (accessed on 23 October 2021).
  20. Ferentinos, K.P.; Stavrakas, Y.; Nakos, H.; Pristouris, K.; Barda, M.S. Initial design and features of an augmented reality system for urban park touring and management. Int. J. Comput. Theory Eng. 2020, 12, 106–112. [Google Scholar] [CrossRef]
  21. Unity User Manual 2020.3 (LTS). Available online: https://docs.unity3d.com/Manual/index.html (accessed on 27 October 2021).
  22. LeCun, Y.; Bengio, Y.; Hinton, G. Deep learning. Nature 2015, 521, 436–444. [Google Scholar] [CrossRef] [PubMed]
  23. LeCun, Y.; Bottou, L.; Bengio, Y.; Haffner, P. Gradient-based learning applied to document recognition. Proc. IEEE 1998, 86, 2278–2324. [Google Scholar] [CrossRef] [Green Version]
  24. Redmon, J.; Farhadi, A. YOLOv3: An incremental improvement. arXiv 2018, arXiv:1804.02767. [Google Scholar]
  25. Kotsopoulos, K.I.; Chourdaki, P.; Tsolis, D.; Antoniadis, R.; Pavlidis, G.; Assimakopoulos, N. An authoring platform for developing smart apps which elevate cultural heritage experiences: A system dynamics approach in gamification. J. Ambient. Intell. Humaniz. Comput. 2019, 1–17. [Google Scholar] [CrossRef]
  26. Park Visitor Activity. Available online: https://vrpark.imsi.athenarc.gr/park-visitor-activity (accessed on 23 October 2021).
  27. Pérez-Torres, R.; Torres-Huitzil, C.; Galeana-Zapién, H. Full On-Device Stay Points Detection in Smartphones for Location-Based Mobile Applications. Sensors 2016, 16, 1693. [Google Scholar] [CrossRef] [PubMed] [Green Version]
  28. Park Visitor Activity Simulator. Available online: https://vrpark.imsi.athenarc.gr/park-visitor-activity-sim (accessed on 23 October 2021).
  29. Ferentinos, K.P.; Barda, M.S. A deep learning plants identification model for augmented reality touring in urban parks. In Proceedings of the CIGR 5th International Conference, Quebec City, QC, Canada, 11–14 May 2021. [Google Scholar]
Figure 1. Overall architecture of the integrated system.
Urbansci 05 00091 g001
Figure 2. Screenshot samples of the visitor’s mobile app: (a) Central interface; (b) List of Points of Interest of the “Statues” category; (c) Object detection function (on live video stream). When the object is identified, its information material shows on the screen.
Urbansci 05 00091 g002
Figure 3. Mobile application screenshots during the Navigation function.
Urbansci 05 00091 g003
Figure 4. Mobile application screenshots during the AR Tour function. In short distances from specific objects of interest, the blue boxes become clickable so that the object’s information can appear on the screen.
Urbansci 05 00091 g004
Figure 5. “Activity animation” screen.
Urbansci 05 00091 g005
Figure 6. “Pathway popularity” screen.
Urbansci 05 00091 g006
Figure 7. “Area popularity” screen.
Urbansci 05 00091 g007
Figure 8. (a) Pathway popularity by time. (b) Area popularity by time.
Urbansci 05 00091 g008
Figure 9. The “Park issues management” application using the 10 most popular park areas as issues filter.
Urbansci 05 00091 g009
Figure 10. Walk start, intermediate destination, and final destination areas for “Pedion Areos” park. (a) Walk start and final destination areas. (b) Walk intermediate destination areas.
Urbansci 05 00091 g010
Figure 11. Examples of supported walk generation methods: (a) Random walk; (b) Pathfinding walk; (c) Hybrid walk.
Urbansci 05 00091 g011aUrbansci 05 00091 g011b
Figure 12. Model outputs on a random video frame. Upper-left: Original video frame. Upper-right: General object identification model output. Bottom-left: Statues and monuments identification model output. Bottom-right: Plants and trees identification model output.
Urbansci 05 00091 g012
Publisher’s Note: MDPI stays neutral with regard to jurisdictional claims in published maps and institutional affiliations.

