
The Spatiality of COVID-19 in Kermanshah Metropolis, Iran

Abstract
:1. Introduction
2. Methodology
2.1. Case Study
2.2. Methods
- (A)
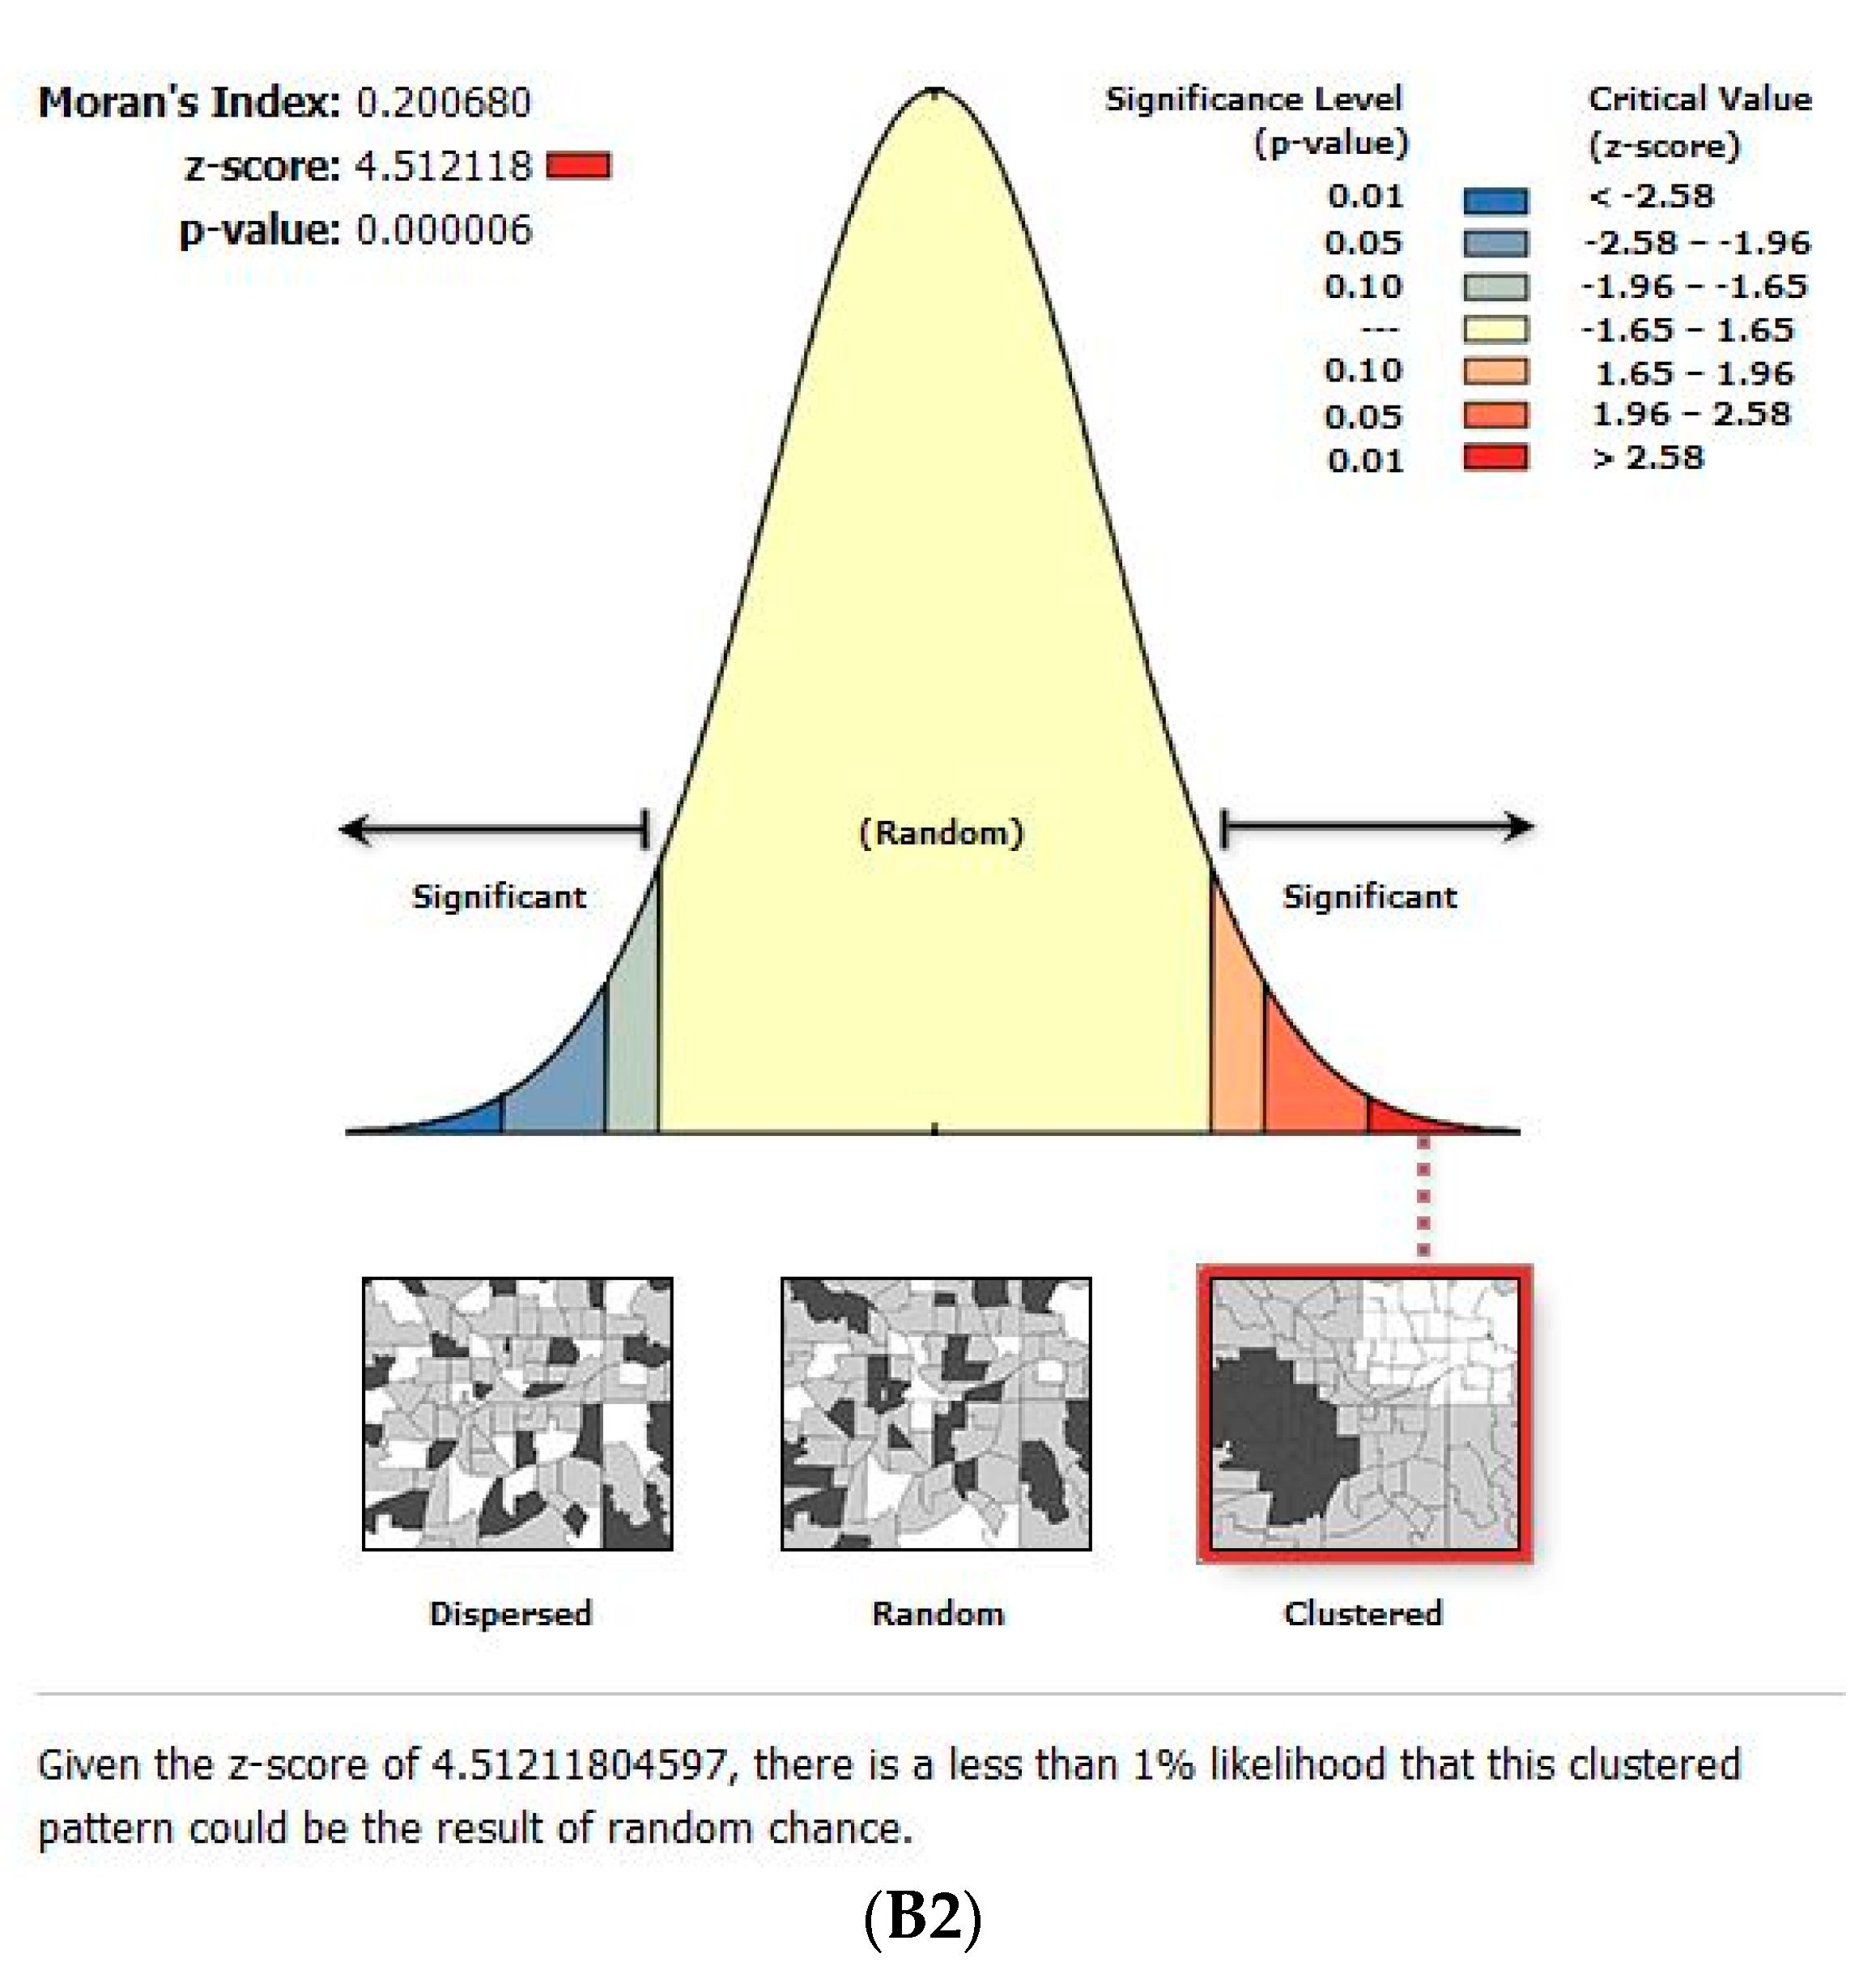
- MC:
- (B)
- SD:
- (C)
- SDE:
3. Results
4. Conclusions
Author Contributions
Funding
Institutional Review Board Statement
Informed Consent Statement
Data Availability Statement
Conflicts of Interest
References
- Worldometer. COVID-19 Coronavirus Pandemic. Available online: https://www.worldometers.info/coronavirus/ (accessed on 3 July 2020).
- Arab-Zozani, M.; Ghoddoosi-Nejad, D. COVID-19 in Iran: The Good, the Bad, and the Ugly Strategies for Preparedness—A Report from the Field. Disaster Med. Public Health Prep. 2020, 15, e43–e45. [Google Scholar] [CrossRef] [PubMed]
- Stojkoski, V.; Utkovski, Z.; Jolakoski, P.; Tevdovski, D.; Kocarev, L. The socio-economic determinants of the coronavirus disease (COVID-19) pandemic. arXiv 2020, arXiv:2004.07947. [Google Scholar] [CrossRef]
- McKibbin, W.; Fernando, R. The global macroeconomic impacts of COVID-19: Seven scenarios. Asian Econ. Pap. 2021, 20, 1–30. [Google Scholar] [CrossRef]
- Jagrič, T.; Fister, D.; Jagrič, V. Reshaping the Healthcare Sector with Economic Policy Measures Based on COVID-19 Epidemic Severity: A Global Study. Healthcare 2022, 10, 315. [Google Scholar] [CrossRef] [PubMed]
- Goel, R.K.; Saunoris, J.W.; Goel, S.S. Supply chain performance and economic growth: The impact of COVID-19 disruptions. J. Policy Modeling 2021, 43, 298–316. [Google Scholar] [CrossRef]
- Gupta, A.; Zhu, H.; Doan, M.K.; Michuda, A.; Majumder, B. Economic impacts of the COVID-19 lockdown in a remittance-dependent region. Am. J. Agric. Econ. 2021, 103, 466–485. [Google Scholar] [CrossRef]
- Islam, M.; Jannat, A.; Al Rafi, D.A.; Aruga, K. Potential economic impacts of the COVID-19 Pandemic on South Asian economies: A review. World 2020, 1, 283–299. [Google Scholar] [CrossRef]
- Açikgöz, Ö.; Günay, A. The early impact of the Covid-19 pandemic on the global and Turkish economy. Turk. J. Med. Sci. 2020, 50, 520–526. [Google Scholar] [CrossRef]
- Asna-ashary, M.; Farzanegan, M.R.; Feizi, M.; Sadati, S.M. COVID-19 Outbreak and Air Pollution in Iran: A Panel VAR Analysis; Joint Discussion Paper Series in Economics; Philipps-University Marburg, School of Business and Economics: Marburg, Germany, 2020. [Google Scholar]
- Holst, H.; Fessler, A.; Niehoff, S. Covid-19, social class and work experience in Germany: Inequalities in work-related health and economic risks. Eur. Soc. 2021, 23, S495–S512. [Google Scholar] [CrossRef]
- Sachedina, N.; Donaldson, L.J. Paediatric mortality related to pandemic influenza A H1N1 infection in England: An observational population-based study. Lancet 2010, 376, 1846–1852. [Google Scholar] [CrossRef] [Green Version]
- Oh, T.K.; Choi, J.-W.; Song, I.-A. Socioeconomic disparity and the risk of contracting COVID-19 in South Korea: An NHIS-COVID-19 database cohort study. BMC Public Health 2021, 21, 144. [Google Scholar] [CrossRef] [PubMed]
- Hu, Y. Intersecting ethnic and native–migrant inequalities in the economic impact of the COVID-19 pandemic in the UK. Res. Soc. Stratif. Mobil. 2020, 68, 100528. [Google Scholar] [CrossRef] [PubMed]
- Wu, X.; Li, X.; Lu, Y.; Hout, M. Two tales of one city: Unequal vulnerability and resilience to COVID-19 by socioeconomic status in Wuhan, China. Res. Soc. Stratif. Mobil. 2021, 72, 100584. [Google Scholar] [CrossRef]
- Sudo, N. The positive and negative effects of the COVID-19 pandemic on subjective well-being and changes in social inequality: Evidence from prefectures in Japan. SSM-Popul. Health 2022, 17, 101029. [Google Scholar] [CrossRef]
- King, M.M.; Frederickson, M.E. The Pandemic Penalty: The gendered effects of COVID-19 on scientific productivity. Socius 2021, 7, 23780231211006977. [Google Scholar] [CrossRef]
- Kristal, T.; Yaish, M. Does the coronavirus pandemic level the gender inequality curve? (It doesn’t). Res. Soc. Stratif. Mobil. 2020, 68, 100520. [Google Scholar] [CrossRef]
- Qian, Y.; Fan, W. Who loses income during the COVID-19 outbreak? Evidence from China. Res. Soc. Stratif. Mobil. 2020, 68, 100522. [Google Scholar] [CrossRef]
- Canale, N.; Marino, C.; Lenzi, M.; Vieno, A.; Griffiths, M.D.; Gaboardi, M.; Giraldo, M.; Cervone, C.; Massimo, S. How communication technology fosters individual and social wellbeing during the COVID-19 pandemic: Preliminary support for a digital interaction model. J. Happiness Stud. 2021, 23, 727–745. [Google Scholar] [CrossRef]
- Ahmadi, A.; Fadaei, Y.; Shirani, M.; Rahmani, F. Modeling and forecasting trend of COVID-19 epidemic in Iran until May 13, 2020. Med. J. Islamic Repub. Iran 2020, 34, 27. [Google Scholar] [CrossRef]
- Clayton, D.; Kaldor, J. Empirical Bayes estimates of age-standardized relative risks for use in disease mapping. Biometrics 1987, 43, 671–681. [Google Scholar] [CrossRef]
- Kazda, M.J.; Beel, E.R.; Villegas, D.; Martinez, J.G.; Patel, N.; Migala, W. Methodological complexities and the use of GIS in conducting a community needs assessment of a large US municipality. J. Community Health 2009, 34, 210–215. [Google Scholar] [CrossRef] [PubMed]
- Schempf, A.H.; Kaufman, J.S.; Messer, L.C.; Mendola, P. The neighborhood contribution to black-white perinatal disparities: An example from two north Carolina counties, 1999–2001. Am. J. Epidemiol. 2011, 174, 744–752. [Google Scholar] [CrossRef] [Green Version]
- Bazemore, A.; Diller, P.; Carrozza, M. The impact of a clinic move on vulnerable patients with chronic disease: A geographic information systems (GIS) analysis. J. Am. Board Fam. Med. 2010, 23, 128–130. [Google Scholar] [CrossRef] [PubMed] [Green Version]
- Morra, P.; Bagli, S.; Spadoni, G. The analysis of human health risk with a detailed procedure operating in a GIS environment. Environ. Int. 2006, 32, 444–454. [Google Scholar] [CrossRef] [PubMed]
- Musa, G.J.; Chiang, P.-H.; Sylk, T.; Bavley, R.; Keating, W.; Lakew, B.; Tsou, H.-C.; Hoven, C.W. Use of GIS mapping as a public health tool–-from cholera to cancer. Health Serv. Insights 2013, 6, 111–116. [Google Scholar] [CrossRef] [PubMed]
- Clarke, K.C.; McLafferty, S.L.; Tempalski, B.J. On epidemiology and geographic information systems: A review and discussion of future directions. Emerg. Infect. Dis. 1996, 2, 85–92. [Google Scholar] [CrossRef] [Green Version]
- Murugesan, B.; Karuppannan, S.; Mengistie, A.T.; Ranganathan, M.; Gopalakrishnan, G. Distribution and Trend Analysis of COVID-19 in India: Geospatial Approach. J. Geogr. Stud. 2020, 4, 1–9. [Google Scholar] [CrossRef]
- Reshadat, S.; Zangeneh, A.; Saeidi, S.; Khademi, N.; Izadi, N.; Ghasemi, S.R.; Rajabi-Gilan, N. The spatial clustering analysis of HIV and poverty through GIS in the Metropolis of Kermanshah, Western Iran. Acta Med. Mediterr. 2016, 32, 1995–1999. [Google Scholar]
- Khademi, N.; Reshadat, S.; Zanganeh, A.; Saeidi, S.; Ghasemi, S.; Zakiei, A. Identifying HIV distribution pattern based on clustering test using GIS software, Kermanshah, Iran. HIV AIDS Rev. 2016, 15, 147–152. [Google Scholar] [CrossRef]
- Khademi, N.; Reshadat, S.; Zangeneh, A.; Saeidi, S.; Ghasemi, S.; Rajabi-Gilan, N.; Zakiei, A. A comparative study of the spatial distribution of HIV prevalence in the metropolis of Kermanshah, Iran, in 1996−2014 using geographical information systems. HIV Med. 2017, 18, 220–224. [Google Scholar] [CrossRef]
- Ghasemi, S.R.; Zangeneh, A.; Rajabi-Gilan, N.; Reshadat, S.; Saeidi, S.; Ziapour, A. Health-related quality of life in informal settlements in Kermanshah, Islamic Republic of Iran: Role of poverty and perception of family socioeconomic status. East. Mediterr. Health J. 2019, 25, 775–783. [Google Scholar] [CrossRef] [PubMed]
- Reshadat, S.; Saedi, S.; Zangeneh, A.; Ghasemi, S.; Gilan, N.; Karbasi, A.; Bavandpoor, E. Spatial accessibility of the population to urban health centres in Kermanshah, Islamic Republic of Iran: A geographic information systems analysis. EMHJ-East. Mediterr. Health J. 2015, 21, 389–395. [Google Scholar] [CrossRef] [PubMed]
- Reshadat, S.; Zangeneh, A.; Saeidi, S.; Izadi, N.; Ghasemi, S.R.; Rajabi-Gilan, N. A feasibility study of implementing the policies on increasing birth rate with an emphasis on socio-economic status: A case study of Kermanshah Metropolis, western Iran. Soc. Indic. Res. 2018, 140, 619–636. [Google Scholar] [CrossRef]
- Fortaleza, C.M.C.B.; Guimarães, R.B.; de Castro Catão, R.; Ferreira, C.P.; de Almeida, G.B.; Nogueira Vilches, T.; Pugliesi, E. The use of health geography modeling to understand early dispersion of COVID-19 in São Paulo, Brazil. PLoS ONE 2021, 16, e0245051. [Google Scholar] [CrossRef] [PubMed]
- Xu, H.; Zhang, C. Development and applications of GIS-based spatial analysis in environmental geochemistry in the big data era. Environ. Geochem. Health 2022, 1–12. [Google Scholar] [CrossRef]
- Yang, X.; Grigorescu, A. Measuring economic spatial evolutional trend of Central and Eastern Europe by SDE method. Contemp. Econ. 2017, 11, 253–267. [Google Scholar]
- Ahemaitihali, A.; Dong, Z. Spatiotemporal Characteristics Analysis and Driving Forces Assessment of Flash Floods in Altay. Water 2022, 14, 331. [Google Scholar] [CrossRef]
- Lee, J.; Wong, D.W. Statistical Analysis with ArcView GIS; John Wiley & Sons: New York, NY, USA, 2001. [Google Scholar]
- Cromley, E.K.; McLafferty, S.L. GIS and Public Health; Guilford Press: New York, NY, USA, 2011. [Google Scholar]
- Grekousis, G. Spatial Analysis Theory and Practice: Describe–Explore–Explain through GIS; Cambridge University Press: Cornwall, UK, 2020. [Google Scholar]
- Reshadat, S.; Zangeneh, A.; Saeidi, S.; Teimouri, R.; Yigitcanlar, T. Measures of spatial accessibility to health centers: Investigating urban and rural disparities in Kermanshah, Iran. J. Public Health 2019, 27, 519–529. [Google Scholar] [CrossRef]
- Yahya, M.S.S.; Safian, E.E.M.; Burhan, B. The Trend Distribution and Temporal Pattern Analysis of COVID-19 Pandemic using GIS framework in Malaysia. AIJR Prepr. 2020, 1–14. [Google Scholar] [CrossRef]
- Marmot, M. Social justice, epidemiology and health inequalities. Eur. J. Epidemiol. 2017, 32, 537–546. [Google Scholar] [CrossRef]
- Acharya, S.S. Population-Poverty Linkages and Health Consequences. CASTE/A Glob. J. Soc. Exclusion 2020, 1, 29–50. [Google Scholar] [CrossRef]
- Shaikh, M.; Miraldo, M.; Renner, A.-T. Waiting time at health facilities and social class: Evidence from the Indian caste system. PLoS ONE 2018, 13, e0205641. [Google Scholar] [CrossRef] [PubMed]
- Sugano, N.; Ando, W.; Fukushima, W. A Cluster Investigation of COVID-19 Occurring at Music Clubs in Osaka, Japan: Asymptomatic Carriers Can Transmit the Virus from Two Days after Exposure; World Health Organization: Geneva, Switzerland, 2020. [Google Scholar]
- Razeghi Nasrabad, H.B.; Alimondegari, M.; Miri, R.; Kargar Shoraki, M.R. Sociological Understanding of the Causes of Youth Unemployment in Kermanshah Citybased on grounded theory. J. Sociol. Soc. Inst. 2021, 8, 47–82. [Google Scholar]
- Sarwar, S.; Waheed, R.; Sarwar, S.; Khan, A. COVID-19 challenges to Pakistan: Is GIS analysis useful to draw solutions? Sci. Total Environ. 2020, 730, 139089. [Google Scholar] [CrossRef] [PubMed]


| Age Group | Working Class | Middle Class | Upper Class | Total | ||
|---|---|---|---|---|---|---|
| Male | 0–14 | N | 8 | 27 | 10 | 45 |
| % | 17.8 | 60.0 | 22.2 | 100.0 | ||
| 15–64 | N | 193 | 508 | 225 | 926 | |
| % | 20.8 | 54.9 | 24.3 | 100.0 | ||
| 65+ | N | 45 | 108 | 40 | 193 | |
| % | 23.3 | 56.0 | 20.7 | 100.0 | ||
| Total | N | 246 | 643 | 275 | 1164 | |
| % | 21.1 | 55.2 | 23.7 | 100.0 | ||
| Mean (SD) | 44.33 ± 19.84 | 44.43 ± 18.48 | 44.85 ± 17.80 | 44.51 ± 18.62 | ||
| Female | 0–14 | N | 8 | 17 | 5 | 30 |
| % | 26.6 | 56.7 | 16.7 | 100.0 | ||
| 15–64 | N | 130 | 348 | 181 | 659 | |
| % | 19.7 | 52.8 | 27.5 | 100.0 | ||
| 65+ | N | 61 | 73 | 26 | 160 | |
| % | 38.1 | 45.6 | 16.3 | 100.0 | ||
| Total | N | 199 | 438 | 212 | 849 | |
| % | 23.4 | 51.6 | 25.0 | 100.0 | ||
| Mean (SD) | 50.10 ± 21.46 | 44.64 ± 17.89 | 43.71 ± 17.08 | 45.69 ± 18.76 | ||
| Total | 0–14 | N | 16 | 44 | 15 | 75 |
| % | 21.3 | 58.7 | 20.0 | 100.0 | ||
| 15–64 | N | 323 | 856 | 406 | 1585 | |
| % | 20.4 | 54.0 | 25.6 | 100.0 | ||
| 65+ | N | 106 | 181 | 66 | 353 | |
| % | 30.0 | 51.3 | 18.7 | 100.0 | ||
| Total | N | 445 | 1081 | 487 | 2013 | |
| % | 22.1 | 53.7 | 24.2 | 100.0 | ||
| Mean (SD) | 46.91 ± 20.78 | 44.51 ± 18.24 | 45 ± 18.69 | 45 ± 18.69 | ||
Publisher’s Note: MDPI stays neutral with regard to jurisdictional claims in published maps and institutional affiliations. |
© 2022 by the authors. Licensee MDPI, Basel, Switzerland. This article is an open access article distributed under the terms and conditions of the Creative Commons Attribution (CC BY) license (https://creativecommons.org/licenses/by/4.0/).
Share and Cite
Zanganeh, A.; Yenneti, K.; Teimouri, R.; Saeidi, S.; Najafi, F.; Shakiba, E.; Moghadam, S.; Shadmani, F.K. The Spatiality of COVID-19 in Kermanshah Metropolis, Iran. Urban Sci. 2022, 6, 30. https://0-doi-org.brum.beds.ac.uk/10.3390/urbansci6020030
Zanganeh A, Yenneti K, Teimouri R, Saeidi S, Najafi F, Shakiba E, Moghadam S, Shadmani FK. The Spatiality of COVID-19 in Kermanshah Metropolis, Iran. Urban Science. 2022; 6(2):30. https://0-doi-org.brum.beds.ac.uk/10.3390/urbansci6020030
Chicago/Turabian StyleZanganeh, Alireza, Komali Yenneti, Raziyeh Teimouri, Shahram Saeidi, Farid Najafi, Ebrahim Shakiba, Shahrzad Moghadam, and Fatemeh Khosravi Shadmani. 2022. "The Spatiality of COVID-19 in Kermanshah Metropolis, Iran" Urban Science 6, no. 2: 30. https://0-doi-org.brum.beds.ac.uk/10.3390/urbansci6020030