
Monitoring Net Land Take in a Metropolitan Region—Portugal

1
Direção-Geral do Território (DGT), 1099-052 Lisboa, Portugal
2
Centre for Innovation in Territory, Urbanism and Architecture (CiTUA), Instituto Superior Técnico, Universidade de Lisboa, 1049-001 Lisboa, Portugal
*
Author to whom correspondence should be addressed.
Urban Sci. 2024, 8(1), 8; https://0-doi-org.brum.beds.ac.uk/10.3390/urbansci8010008
Submission received: 13 November 2023
/
Revised: 9 January 2024
/
Accepted: 16 January 2024
/
Published: 18 January 2024
(This article belongs to the Special Issue Innovations in Land Resource and Environmental Governance for Future Cities)
Abstract
:This study seeks to contribute to the definition of a “no net land take” policy by 2050 for Portugal’s second-largest metropolitan region (AMP, Porto Metropolitan Area) while sensitising those involved in regional and local planning to the European target. Based on an assessment of land use changes in AMP and its municipalities during 2007–2018, soil sealing levels in 2018 and population evolution, the study quantifies the processes that may impart achievement of the 2050 objective and identifies the regional drivers of net land take, to support the definition of both interventions to decrease land take and soil sealing and related targets. The main contribution of the research is the exploration of new indicators in terms of soil sealing and population data to identify the potential for implementing interventions proposed by the EU Soil Strategy that do not jeopardise the maintenance of biodiversity in urban areas. The land take rate in the AMP was the highest among mainland Portugal regions. Its main drivers were the development of transport networks, industrial and commercial units and dispersed housing. The reuse and re-naturalisation of artificial land have seen little use in the region. Accordingly, the daily net land taken in the AMP (0.59 ha/day) still needs to decrease until 2050. While artificial land increased across the AMP, most of its municipalities lost population. To reverse this trend, the AMP should implement tighter control mechanisms that ensure that infrastructure and housing needs are fully met through the reuse of urban areas that are already sealed. However, given that the share of impermeable soil in most urban areas is already significantly high, there will have to be a careful choice of locations where intensifying land use will cause less environmental damage. It is concluded that the degree of soil sealing within urban areas is fundamental for deciding on the interventions to be carried out to reduce net land take and for defining a policy towards meeting the 2050 target.
1. Introduction
In recent decades, reducing land take and containing urban sprawl have become major spatial planning goals in developed countries due to a growing awareness that the soil is a non-renewable resource providing ecosystem services that are being jeopardised by urban development or unsustainable land exploitation. Spatial planning is, therefore, currently guided by sustainable land use.
Although the term land take is a recent one [1] and is not always consensual [2,3,4,5], it usually refers to the surface of agricultural, forest, semi-natural and natural areas, wetlands and water bodies artificialized in a given period. It thus includes the development of impermeable surfaces, such as for housing and urban infrastructure and non-impermeable areas, like urban green parks and some sports and leisure facilities [6,7]. Land take has also been defined as “the loss of undeveloped land to human-developed land” [8] (p. 4) and is often defined as land consumption for urban development [2,3]. Soil sealing is considered the most intense form of land take as it causes an irreversible loss of functions and ecosystem services provided by the soil [7,9]. Leading to landscape fragmentation and loss of natural capital [10,11], soil sealing compromises the soil’s ability to provide essential services such as biomass supply, water and nutrient cycling and organic carbon storage [11,12,13]. The loss of soil ecological functions in urban environments can generate heat island effects, increased risk of flooding and increased pollutant loads in soil, water and air [6,14]. Thus, land take, and particularly soil sealing, are considered drivers of land degradation [7].
In 2011, the Roadmap to a Resource Efficient Europe established the goal of “no net land take” by 2050 [1]. To protect the soil and safeguard the services it supplies, the target has been set to curb land take [8] by reusing artificial land or increasing its re-naturalisation. Where the consumption of non-artificial land cannot be avoided, measures should be taken to compensate for the loss of ecosystem services (e.g., demolition and land re-naturalisation). Achieving this objective requires changes in the national, regional and municipal land use policies of the Member States.
Net land take quantifies the difference between land take and land re-naturalisation over an equal period of time. Land re-naturalisation is the reverse process of land take, evaluating the surface of artificial land that has been transformed into non-artificial land in a given period [6,7]. This process is also known as land restoration or, less commonly, as land re-cultivation [6,7]. Carrying it out can increase the soil’s vegetation cover, which helps to increase soil carbon stocks [15,16].
Processes aimed at reusing developed land are also known as inner urban development [17] or land recycling [18,19]. They include increasing the volume of buildings, reorganising the existing urban structure and infilling unoccupied urban areas (land densification), building on abandoned or underused artificial land and recovering problematic developed sites, such as brownfield sites (grey recycling), and converting developed land into green urban areas (green recycling). This latter type of land recycling allows for the recovery of some of the services and functions provided by soil (e.g., the storage of organic carbon and the regularisation of the water cycle) while also helping to improve environmental conditions in cities and mitigating some of the impacts of climate change. Densification and grey recycling are potential solutions for evading land take, as they make it possible to accommodate more people and promote economic diversity in cities, taking advantage of existing infrastructures.
With the aim of providing guidance for decision makers and policymakers in promoting the sustainable urbanisation of their territories, the ESPON SUPER project (Sustainable Urbanization and Land Use Practices in European Regions) distinguishes five types of interventions that can help prevent, decrease or offset the impact of land take: densification, regeneration (or grey recycling), urban containment, governance and sectoral policies [20].
Urban growth containment initiatives, such as green belts or urban growth boundaries, are designed to limit and manage the expansion of cities beyond established boundaries. A crucial factor for the success of these initiatives is the adoption of legally binding instruments [20].
The goal of governance interventions is to enhance how governmental stakeholders make decisions regarding the management of urban areas. This can be achieved through policies that promote cross-sectoral integration and the implementation of urban and regional plans [20]. In this respect, policy targets grounded in environmental assessments that address land take [21] and financial incentives can be successful factors.
These interventions, identified by assessing more than 200 case studies from different European territorial contexts, may involve one or more of the following instruments: strategies, legal devices (binding laws and regulations), land use regulations, programmes and projects [20].
As strategies are non-binding instruments, their success depends on factors like strong political will, efficient multi-level cooperation, effective horizontal coordination, technical expertise, binding measures and economic incentives to achieve their goals [20].
The primary causes of land take are population growth and economic development [9,22]. Population growth frequently causes a higher demand for housing, public facilities and public transport. Conversely, economic development increases the search for new commercial and industrial sites, fosters competition between municipalities to attract more investment, and often prioritises economic growth over environmental sustainability [22].
1.1. Legal Framework and Interventions to Contain Land Take in Europe
In the absence of a binding European legal framework to achieve the “no net land take” target by 2050, the EU has sought to build awareness among Member States of this objective through dissemination of various studies and guidelines [6,7,8,13,23] and reinforcement thereof in the EU Soil Strategy for 2030 [24]. This strategy recommends that Member States set by 2023 their own (national, regional and local) targets for net land take reductions by 2030 and report on their progress in making measurable contributions to the EU 2050 target. It also proposes implementing hierarchical land planning principles to increase the reuse of land already developed and promote a reduction in land take and soil sealing.
Moreover, the 2050 target is closely linked to two sustainable development goals established by the United Nations Agenda for 2030 [25], namely goal 11, which sets out to make cities and human settlements inclusive, safe, resilient and sustainable, and goal 15, which aims to protect, restore and promote sustainable use of terrestrial ecosystems, sustainably manage forests, combat desertification, halt and reverse land degradation, and halt biodiversity loss.
The EU Soil Strategy for 2030 announced that the EU was preparing a legislative act on soil, the proposal for which was published in July 2023 under the designation Soil Monitoring Law (SML) [26]. Towards achieving healthy soils throughout the EU by 2050, the SML proposal seeks to create an appropriate regulatory framework for the sustainable management of this natural resource. For this purpose, it establishes obligations to monitor and assess soil health and to analyse the effectiveness of actions taken to remediate (regenerate) soil in rural and urban areas. Since soil sealing and land take impair the soil’s ability to provide ecosystem services, this proposal obliges Member States to monitor both. It also requires the implementation of sustainable management principles to mitigate the impacts of land take. This process is defined in SML as the conversion of natural and semi-natural land into artificial land. The indicators required for regular assessment of soil sealing and land take are the surface area of artificial land, land take, re-naturalised artificial land, net land take and sealed soil. Optional indicators, such as the rate of land recycling and quantification of the loss of ecosystem services caused by land take, are also proposed. Although the SML recognises that soil sealing should be assessed in addition to land take, the proposal does not state that soil sealing should be differentiated between urban and rural areas, as suggested by Decoville and Feltgen [5], who propose using a soil sealing rate within artificial land (urban areas) to support the definition of land take reduction strategies. Increasing the density of soil sealing within artificial land, i.e., increasing densification and grey recycling in urban centres, are potential solutions for meeting the European target because they do not increase the surface area of artificial land. However, given that the intensification of soil sealing has detrimental effects that compromise the environmental sustainability of urban zones, said intensification will have to be made up for by increases in green recycling, re-naturalisation of artificial areas and adoption of nature-based solutions [5,23]. Based on research regarding the loss of biodiversity caused by soil sealing in a Chinese city that has undergone a rapid urbanisation process [27], Decoville and Feltgen [5] also advocate keeping soil sealing levels within urban centres below 40%.
Several countries and regions are already monitoring the European target or their respective national targets, which reflect their vision as to how to lower net land take to zero by 2050 [4,8,9]. These include Germany [28], Austria [29], Switzerland [30], Luxembourg [31] and Belgium, notably the Wallonia [32] and Flanders [33] regions, which have set quantitative targets and are implementing interventions to contain land take and soil sealing. Also worthy of note is the monitoring of land take and soil sealing undertaken by Italy [34] and also initiated by France [35] and the financial support for brownfield redevelopment in the UK [36].
National targets are essentially strategic measures used for monitoring purposes [9], as they have little impact on local planning practices without the support of binding instruments [23]. Accordingly, translation to targets and actions adjusted to the different regional or local contexts (environmental, economic, social and political) is desirable [2]. Regardless of their effectiveness, such targets can raise awareness among stakeholders in land use planning about the urgency of preserving soil as a natural resource.
Regional and local interventions aimed at curbing land take also include banning, imposing limits on or establishing economic disincentives or compensations for specific land use transformations. A wide range of these interventions in the EU have been systematised in the guide produced by the ESPON SUPER project [20]. Among these types of interventions is the case of the Emilia Romagna region in Italy, which since 2018 has doubled urbanisation fees for projects that convert agricultural land into built-up areas and decreased fees for projects that recover abandoned sites [20]. Also noteworthy are the creation of incentives to increase the green cover of buildings and reduce air pollution in Linz (a city in Austria) [20], the urban regeneration of Paris (France) under the “Réinventer Paris” programme launched in 2017 [20] and the promotion of residential demolition and reconstruction projects with tax incentives in Belgium [37] to stimulate urban renewal. To reduce soil consumption, speed up land regeneration and preserve rural areas, another type of intervention has been implemented in the city of Reggio Emilia (also in Italy) that is considered exemplary in terms of sustainability. The definition of homogeneous territorial zones, provided for by Decree 1444 of 2 April 1968, was implemented by the General Urban Plan (Piano Urbanistico Generale) to reduce the areas zoned for urban uses, which had not yet been built upon. Cooperation with landowners, who have benefited financially from the withdrawal of development rights, has made it possible for more than 135 hectares of urban land to be returned to rural functions since 2015 [20].
These examples show that even in countries without a national legal framework explicitly aimed at reducing land take (such as Portugal and Italy), regional and municipal plans and regulations can establish quantitative limits and mandatory measures to curb land take and avoid further soil sealing [23].
1.2. Study Goals
This study starts from a prior net land take assessment developed by the authors for mainland Portugal and its NUTS III regions [4]. This assessment revealed that the Porto Metropolitan Area (Área Metropolitana do Porto, AMP) had the highest rate of land take of the mainland regions, which justified a more in-depth analysis of the regional drivers and a municipal appraisal of the processes of interest, with the inclusion of indicators on soil sealing.
Accordingly, based on an assessment of land use changes in the AMP and its city council areas in the 2007–2018 period and of soil sealing levels in 2018, this study identifies the regional driving forces of net land take and analyzes the region’s performance in meeting the EU 2050 target, in support of the definition of both customised interventions to decrease net land take and soil sealing and targets (non-existent, so far) recommended by the EU Soil Strategy for 2030. Consequently, it aims to support the development of a “no net land take” policy for the AMP by 2050, whilst raising awareness of the processes addressed among decision makers and public authorities involved in spatial planning. The study also intends to show that compliance with the EU’s 2050 target may not safeguard the objectives of the SML, as its implementation could deteriorate soil health and lead to unsustainable urban development.
The assessment combines indicators defined by the SML proposal [26] and population data to aid decision-making. In addition to providing more clarity on the European target, the study shows regional and municipal authorities how to assess the processes of interest for achievement thereof. The contents presented, particularly the novel indicators explored, can serve as an example for European regions that have not yet begun to monitor this target.
In addition to the Introduction, this article is structured into the following sections. Section 2 presents the methods and data used. It also identifies the study area and describes the spatial planning guidelines and instruments in force. Section 3 quantifies the processes of interest (land take, land re-naturalisation, net land take and reuse of artificial land) between 2007 and 2018. This section also compares the growth of artificial land with that of the population and assesses soil sealing levels within artificial areas in 2018. Section 4 describes the study’s limitations and findings, which are discussed in light of the current land use policy and the 2050 target and proposes pathways that can help achieve more sustainable urban development. Section 5 provides the main conclusions.
2. Materials and Methods
2.1. Methods and Data
This study was based on a land use change assessment between 2007 and 2018 using Portuguese land use/land cover reference maps, known as COS maps (Cartas de Uso e Ocupação do Solo). These are vector maps produced by the Directorate-General of Territory (DGT) through photo interpretation and manual delimitation of polygons with a minimum mapping unit of one hectare.
To link land use changes and their causes (driving forces), the Land and Ecosystem Accounting (LEAC) system and the classification into Land Cover Flows (LCFs) proposed by the European Environment Agency (EEA) were used [38,39,40]. An LCF represents a set of land use/land cover changes grouped by one and the same driving force. To describe the source and target classes of these changes, the original COS classes were aggregated into eight types of land use, which are part of the LEAC nomenclature [38,40]. This nomenclature groups classes with similar land use or environmental characteristics and simplifies the interpretation of LCFs. Identifying the driving forces of land take and the types of land use it consumes is essential to defining concrete actions aimed at reducing it.
The methodology adopted to assess land take is similar to that used by the EEA for calculating this indicator [6]. Land re-naturalisation was estimated by taking into account the area of artificial land transformed into agricultural, forestry, semi-natural and natural areas, wetlands and waterbodies.
As described in the previous section, net land take assesses the difference between land take and land re-naturalisation, and the monitoring thereof contributes to defining the progress made in achieving the European target [1].
It should be noted that this study assumes that artificial land is representative of urban or developed areas, which consist of the land use classes for artificial areas (described as artificial surfaces by some land cover maps). Non-artificial, non-urban or undeveloped land is representative of the remaining land use classes. Artificial land usually includes both sealed and non-sealed soil.
In assessing the reuse of artificial land, changes between classes of artificial areas were considered. The assessment excluded the conversion of construction sites to other land uses, as it was assumed that such sites have a transitory land use that will evolve in the short term into a definitive one [18]. Thus, the reuse of artificial land assessed in this study is similar to that estimated by the EEA [19].
In order to estimate the degree of soil sealing or level of soil sealing in the study area, the Imperviousness Density (IMD) 2018 data by Copernicus Monitoring Service [41] was used. This dataset provides imperviousness estimates that reflect the soil sealing rate (ranging from 0% to 100%) of each 100 m2 pixel. The following steps were used to assess the proportion of imperviousness of a spatial unit and its artificial land. Firstly, the pixels covering the spatial unit and its artificial land were identified. Then, the product of the IMD value by the surface area of each pixel was totalled for all the pixels of interest. Lastly, the percentage of the surface area of concern that was sealed was calculated.
Annual population estimates produced by Statistics Portugal were used to analyse population dynamics.
Figure 1 outlines the methodological approach used by this study.
Most processes addressed by this study are described in terms of surface areas per spatial unit for a given period. Because spatial units are unequal in terms of size, annual rates are reported in m2/year·km2 (the area of interest, in square metres, was divided by the number of years in the respective period multiplied by the spatial unit surface, in square kilometres) to enable comparison of the same process among different spatial units. In order to ensure that the obtained results can be compared with those of similar studies or with the European objective, estimates are also provided in km2/year or ha/day. However, these units only allow for comparisons of the same spatial unit in different time periods.
2.2. Study Area
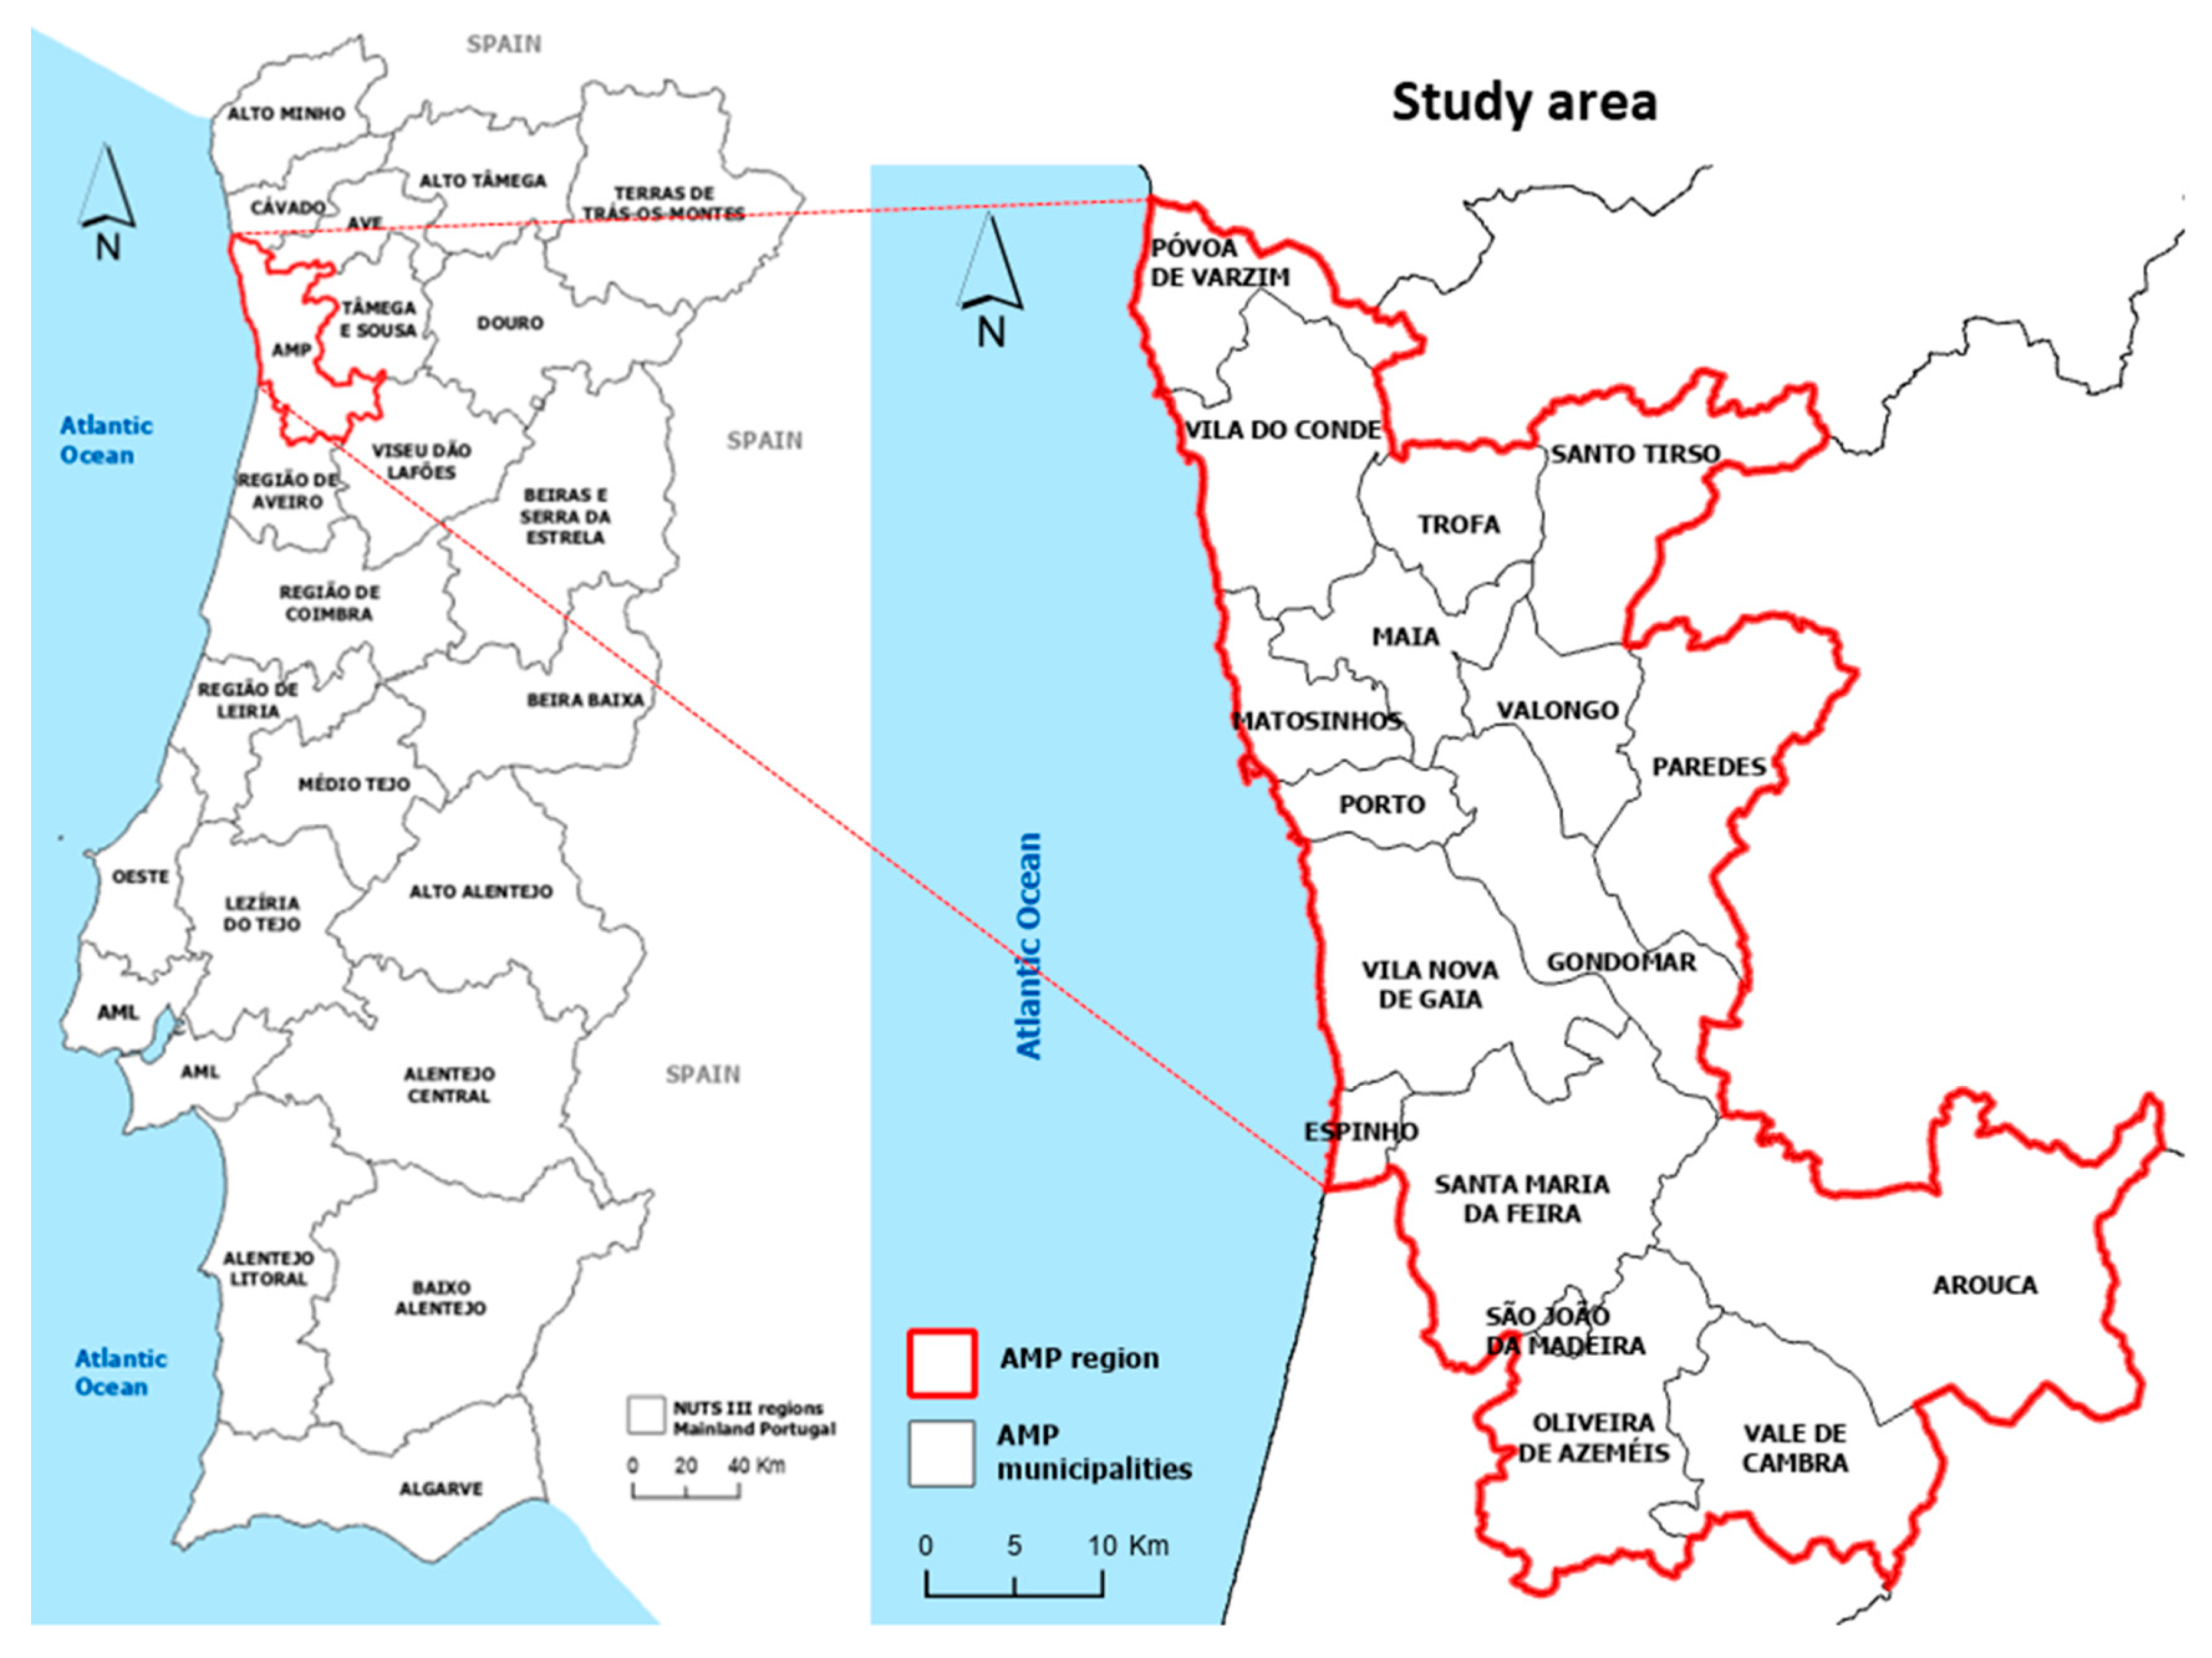
The study examines the Metropolitan Area of Porto (AMP), which is located on mainland Portugal’s northern coast (Figure 2). With an area of 2041 km2, the AMP is subdivided into 17 municipalities and is the second most populous region in the country (1,736,228 inhabitants in 2021).
2.2.1. Land Use Guidelines and Instruments in Force
The Portuguese government is responsible for the following functions relating to land use policies [42]. It establishes the legal framework governing national, regional and local planning and defines the national and sectoral strategic policies aimed at the sustainable territorial development of the country. These functions are reflected in the National Programme of Spatial Planning Policies (Programa Nacional da Política de Ordenamento do Território—PNPOT) and the Special and Sectoral Programmes. It also supervises the Regional Coordination and Development Commissions, which coordinate local environmental and spatial planning policies and draw up the Regional Spatial Development Programmes. Portuguese town and city councils have the main responsibilities in terms of spatial planning, which include drawing up Municipal Master Plans, Urban Development Plans and Local Detailed Plans, and their execution and monitoring. Thus, municipalities have an impact on land use by authorising and issuing building permits and developing public services and infrastructures [42].
Even though the goal of “no net land take” is not explicitly stated in the Portuguese spatial planning legislation, the content thereof is aligned with European guidelines for sustainable development outlined in various documents, namely the European Spatial Development Perspective [43], the Territorial Agendas of the European Union [44,45,46] and the New Urban Agenda [47]. These guidelines are reflected in the Law on Public Policy on Soil, Land-use Planning and Urban Planning (Law 31/2014, 30 May 2014), the National Strategy for Sustainable Urban Development 2014–2020 (Council of Ministers Resolution 61/2015, 16 July 2015), and the strategy and territorial model of the National Programme of Spatial Planning Policies (the first version of which dates from 2007 and the second version, currently in force, is from 2019), which recognises soil as a natural capital asset and promotes maintaining or reducing the speed of urbanisation.
Portugal has implemented various planning tools since the 1970s and 1980s to safeguard agricultural and natural lands and encourage biodiversity. These include the National Agricultural Reserve (Reserva Agrícola Nacional, RAN), the National Ecological Reserve (Reserva Ecológica Nacional, REN), and the National System of Classified Areas (Sistema Nacional de Áreas Classificadas, SNAC). While the RAN aims to safeguard areas that, due to their morphological, climatic and social characteristics, have the greatest potential for the production of agricultural goods, the REN is a biophysical structure that integrates a set of areas (coastal, riparian and sloping), which, on account of their ecological sensitivity, function and value, or exposure and susceptibility to natural risks, are subject to special protection. The SNAC consists of the National Network of Protected Areas and other classified areas, such as the Natura 2000 Network. RAN, REN and SNAC are currently represented as administrative easements and public utility restrictions in Municipal Master Plans. Between 2007 and 2018, the Portuguese central government revised several guidelines and instruments on land use regulation, which impacted the planning decisions at regional and local levels.
In 2009 (Decree-Law 307/2009, 23 October 2009) and later in 2012 (Law 32/2012, 14 August 2012), the legal regime for urban redevelopment was revised, which enables municipalities to delimit and approve areas for urban regeneration within their territory. Approval of these areas gives the owners of buildings located in them a right to tax benefits associated with municipal property taxes, as well as access to support and financial incentives for urban regeneration.
The new law on Public Policy on Soil, Land-use Planning and Urban Planning, introduced in 2014, reinforces the pre-existing concern about soil management as a scarce resource, as expressed in the previous law of 1998 (Law 48/98, 11 August 1998). Furthermore, the new framework emphasises the spatial planning objectives set out in 1998 to limit urban expansion and dispersed construction. Instead, promoting urban redevelopment and regeneration, rather than new construction, is prioritised.
The year 2015 saw changes to the legal framework for spatial planning instruments (Decree-Law 80/2015, 14 May 1998) that included abolishing the operative land-use category of urban developable land. Additionally, that same year, a regulatory decree (Decreto Regulamentar 15/2015, 19 August 2015) was introduced that specified the criteria for the classification of land, highlighting the exceptional circumstances required to reclassify rural land as urban. In order to prevent the expansion of urban perimeters, this reclassification now demands a demonstration of the economic and financial sustainability of each transformation using demographic indicators and the levels of supply and demand of urban land.
It is worth mentioning that certain municipal masterplans, like that for Porto, contain regulations that permit the transfer of development rights. This option has been tested or operationalised in other countries [37,48] and can potentially stimulate the densification and redevelopment of urban areas. However, it has been used sparingly so far.
The European Structural and Investment Funds have been crucial in boosting sustainable urban development initiatives in Portugal. In particular, the European Regional Development Fund has been a source of support for urban issues in the country. Over the period from 2007 to 2018, Portugal implemented two significant urban policy programmes: Polis XXI and Portugal 2020 [49].
2.2.2. Brief View of AMP Municipalities
The municipalities in the AMP differ substantially in terms of their surface area covered by artificial land and also in populational terms, which, along with the infrastructures and services they provide, give them more urban or more rural characteristics. In 2018, the municipalities with the highest share of artificial land (>50%) were Porto, São João da Madeira and Matosinhos, while Arouca and Vale de Cambra had less than 10%. The latter two municipalities also had the smallest populations (<21,400 each), while the most populous were Vila Nova de Gaia, Porto and Matosinhos (>174,000 inhabitants each).
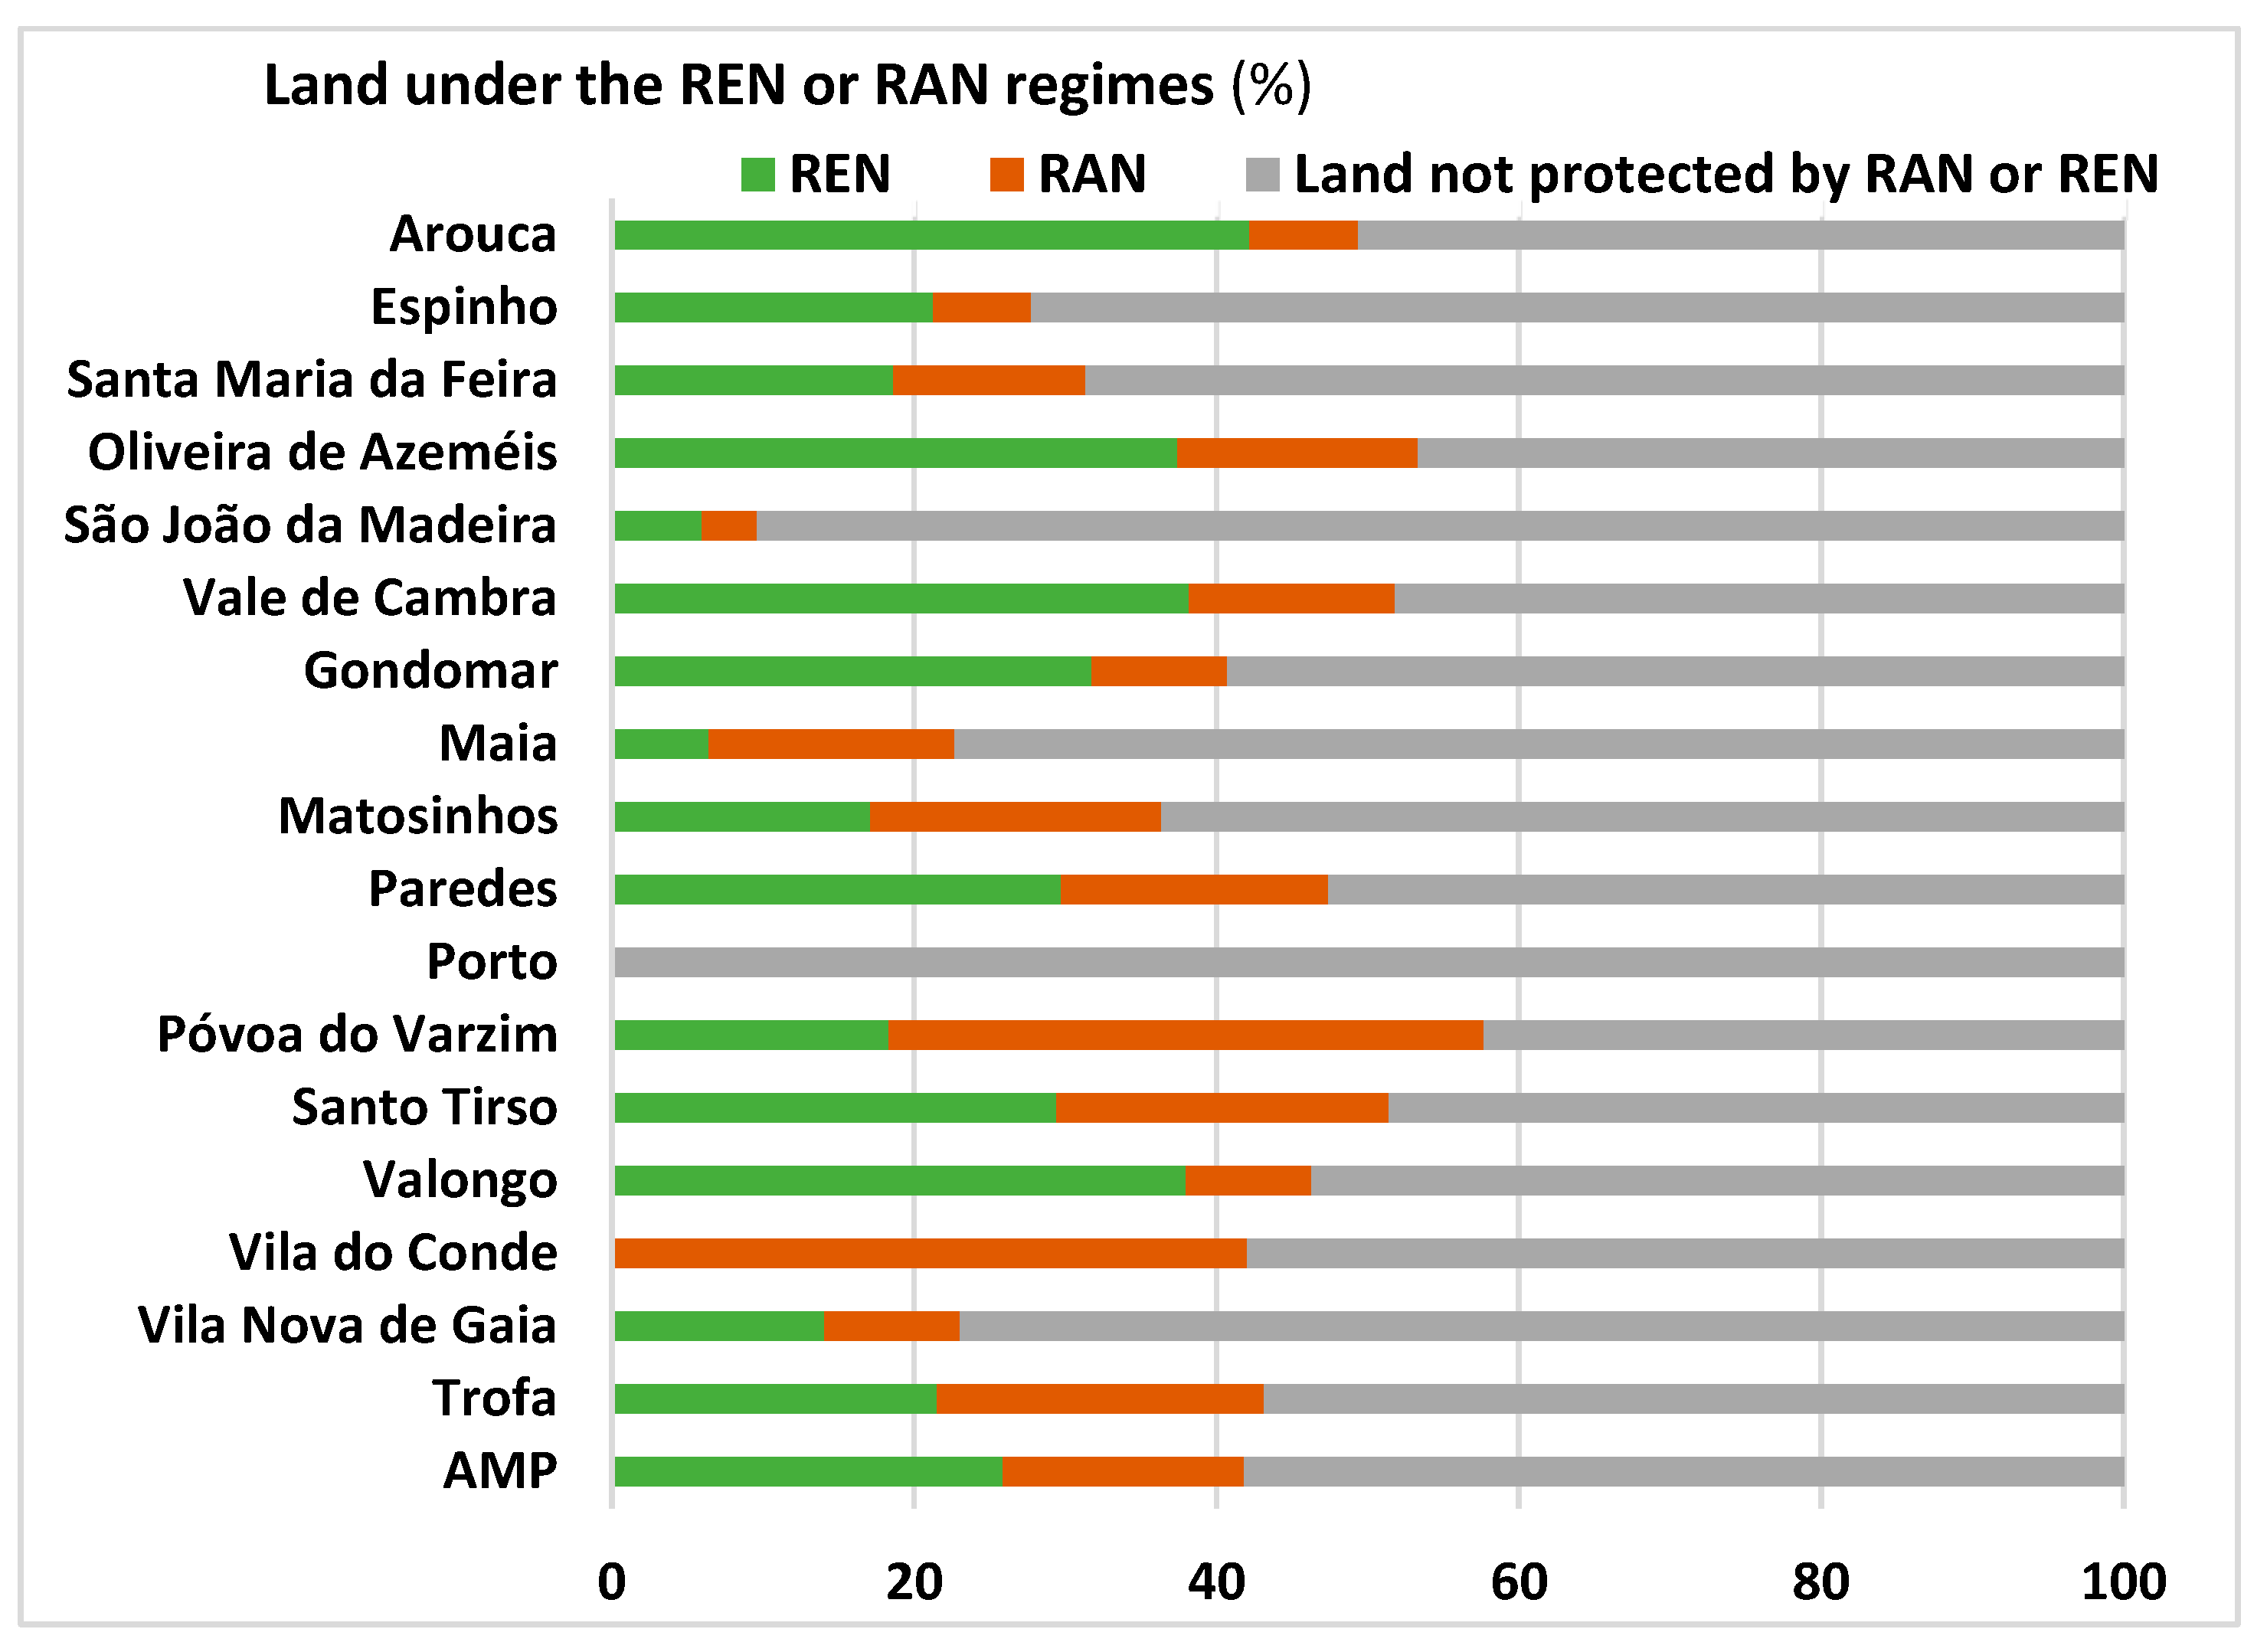
Figure 3 identifies the proportion of land protected by the National Agricultural Reserve (RAN) and the National Ecological Reserve (REN) in each municipality and the AMP in 2022. It shows that almost half of the AMP territory is protected by both legal regimes. While Porto and São João da Madeira have the lowest shares of land in the RAN or REN, the highest proportions (>50%) occur in municipalities bordering the AMP (Póvoa do Varzim and Santo Tirso, further north, and Oliveira de Azeméis and Vale de Cambra, to the south). In this context, it should also be noted that the entire municipality of Arouca is a geopark and that half of its area is classified as Natura 2000 Network.
An analysis of the commuting between municipalities by residents of the AMP in 2017 highlights the centrality of Porto municipality [50], i.e., its role as a hub city of the metropolitan area. Porto was one of the three main destinations for trips beginning in ten AMP municipalities and was the first destination for trips originating in Matosinhos, Vila Nova de Gaia, Gondomar, Maia, Paredes, Santo Tirso and Valongo. Private cars were the principal mode of transport used by the residents of the AMP (67.6% of trips), which stems from a low-density urbanisation pattern. Indeed, this is the predominant type of development in the AMP, where scattered linear settlements, mainly consisting of detached houses intermingled with economic activities, are responsible for major land consumption [51].
3. Results
This section begins by quantifying the processes of land take, land re-naturalisation, and net land take between 2007 and 2018 and identifying the driving forces. It then assesses the recycling of urban land and compares the growth in artificial land with that of the population over the same period. Lastly, the level of sealing of artificial land in 2018 is assessed, and the per capita availability of unsealed land within urban areas is quantified.
3.1. Land Take, Land Re-Naturalisation and Net Land Take
As already highlighted, during 2007–2018, the rate of land take in the AMP (1153 m2/year·km2 or 0.64 ha/day) was the highest among the NUTS III regions of mainland Portugal [4]. In the AMP (Figure 4 and Table 1), this rate was highest (>2300 m2/year·km2) in two municipalities bordering Porto, namely in Vila Nova de Gaia and Matosinhos, and in São João da Madeira, and lowest in the south-eastern part of the AMP, notably in Arouca and Vale de Cambra (144 and 349 m2/year·km2, respectively).
Table 1 presents the rates of the processes assessed in this study by AMP municipality and for the whole of the AMP between 2007 and 2018.
Figure 5 illustrates that the main drivers of land take in the AMP in this period were the creation or expansion of transport networks (31%), industrial and commercial units (27%), construction sites (21%) and dispersed residential areas (10%). These processes accounted for 89% of the consumption of non-artificial land.
The area of artificial land that was re-naturalised in the AMP was tiny (2.1 km2) compared to that consumed for urban development (25.9 km2). Accordingly, the re-naturalisation rate in the AMP was only 93.1 m2/year·km2 (0.05 ha/day). The highest rates of re-naturalisation at the municipal level (Figure 6 and Table 1) were in the north of the AMP, in Paredes (230 m2/year·km2), Maia, Porto, and Vila do Conde (>188 m2/year·km2). In contrast, the lowest rates were registered in the south and south-east of the AMP, namely in São João da Madeira, which did not implement re-naturalisation in the period studied, and in Arouca and Vale de Cambra (<14 m2/year·km2).
Over the same period, the net land take rate in the AMP amounted to 1060 m2/year·km2 (0.59 ha/day). The highest and lowest net land take rates within the AMP (Figure 7 and Table 1) were registered in the same municipalities that presented homologous land take rates. Thus, Vila Nova de Gaia, São João da Madeira, and Matosinhos stood out for the highest rates (>2318 m2/year·km2), and Arouca and Vale de Cambra for the lowest (132 and 335 m2/year·km2, respectively).
Figure 8 gives the land surface area transformed by land take and land re-naturalisation in the AMP by land use type during the 2007–2018 period. It follows that:
- The main land use types transformed into artificial land were forests and transitional woodland shrub areas (66%), arable land and permanent crops (16%) and natural grassland, heathland and sclerophyllous vegetation (13%).
- The main new land use classes produced through re-naturalisation were semi-natural areas (44%), forests and woodlands (39%) and agricultural areas (16%).
3.2. Reuse of Artificial Land
Between 2007 and 2018, the average recycling of artificial land in the AMP was 0.02 ha/day (28 m2/year·km2). Figure 9 and Table 1 show the equivalent recycling rate by municipality. The lowest artificial land reuse rates were registered in Arouca, Vale de Cambra (which did not reuse artificial land in the period under assessment), Santo Tirso and Espinho (<6 m2/year·km2). In contrast, the highest rates were given in Matosinhos (144.3 m2/year·km2), Vila Nova de Gaia (96 m2/year·km2), and São João da Madeira (90.6 m2/year·km2).
3.3. Artificial Land, Soil Sealing and Population Dynamics
The increase in artificial land in the AMP was 4.9% between 2007 and 2018, slightly lower than that in mainland Portugal (5.7%) but higher than the figure for the Lisbon Metropolitan area (4.6%) [4]. Figure 10 shows the variation in population and artificial land surface area in the period under review, revealing that artificial land expanded in all AMP municipalities. In the majority of them and the AMP as a whole, this expansion was coupled with a population decrease.
In Porto, Espinho, Arouca, Vale de Cambra and Santo Tirso, the reduction in the number of inhabitants even exceeded, in relative terms, the expansion in artificial land. But there were also population increases in five municipalities (Valongo, Maia, Vila do Conde, Matosinhos and São João da Madeira). It should be noted, however, that the growth in artificial land has only been slower than that of the population in Maia, contributing to a more efficient use of artificial land. The evolution of the artificial land per capita between 2007 and 2018 indicates that the AMP and most of its municipalities have increased the values of this indicator. Maia was the only municipality to record a decrease, thus demonstrating a trajectory of densification of its territory that is desirable if the European target is to be achieved. As this target aims to maximise the ecological functions provided by soil, particularly in urban areas, future urban development should avoid reducing the unsealed artificial land that still provides some of these services.
Figure 11 shows the degree of imperviousness of spatial units and the artificial land within them in the AMP in 2018. It reveals that the degree or level of soil sealing in the AMP does not reach 16%, while in some municipalities, it varies between 26% and 57%. In descending order in terms of their respective degree of imperviousness, these municipalities are Porto, São João da Madeira, Matosinhos, Maia, Vila Nova de Gaia and Espinho. These six municipalities also have the highest share of artificial land (≥16%). Assessing the degree of imperviousness of artificial land (urban areas) provides insight into the ability of these areas to still provide ecosystem services, which are indispensable for their sustainability in environmental terms. In this context, it was found that in 2018, the vast majority of artificial land in the AMP had soil sealing levels above 50%.
Figure 12 presents the unsealed artificial surface area per capita in the AMP and its municipalities in 2018. It shows that the urban areas with the highest figures (>360 m2/inhabitant) are in the southeast of the AMP (Arouca and Vale de Cambra), and those with the lowest (<82 m2/inhabitant) in the centre-north of the AMP (Porto, Matosinhos, Valongo and Gondomar). Due to the lower availability of unsealed soil per inhabitant, the urban areas of the latter municipalities have less favourable environmental conditions.
4. Discussion
At the beginning of this paper, it was mentioned that the term “land take” is not consensual. Beyond the semantic issue [2,3,4,20], the land use transformations that the term covers were not clearly described when defining the 2050 target. This has contributed to differing interpretations by Member States of what the term represents and translates to a lack of consistency in what is monitored [2,3,4]. From a perspective based only on environmental criteria, land take could include all land use changes that deteriorate the ecosystem services provided by the soil, whereas, from an urban planning perspective, it may exclude some of these changes (such as the development of intensive agriculture or greenhouses on agricultural land). This study used the land take definition considered by the European Environmental Agency [6,7,14].
The main objective of this research is to contribute to developing a “no net land take” policy for the AMP by 2050. To this end, the study assessed land take, re-naturalisation and reuse of artificial land, soil sealing and population dynamics by AMP municipality and identified the driving forces behind net land take. It also proposes new indicators to support the definition of strategies to curb land take and counteract soil sealing in the region and assesses its performance against the European target. Of the indicators presented, that which assesses the availability of unsealed artificial surface area per capita is innovative compared to those proposed by similar assessments [5]. Moreover, the joint evaluation of land take and soil sealing, based on national data, had not yet been undertaken for the AMP. Whilst the performed analysis focuses on the AMP, the indicators that support it can be applied to other regions.
An assessment on a regional scale, such as that presented herein, offers the opportunity to reconcile policies aimed at natural resources protection that usually differ between municipalities and those related to infrastructures and transport. Indeed, “regional planning is the most appropriate level to coordinate the resources and efforts needed to face significant and sustainable problems in the mid and long term” [52] (p. 2). Nevertheless, given that for administrative purposes, the AMP includes municipalities with very different levels of urbanisation and cultural and social dimensions, giving rise to a lack of territorial cohesion [51], policies for the AMP should at least differentiate between the Greater Porto area (which includes only 11 municipalities), the other urban areas, and particularly the pronouncedly rural areas in the south-east of the AMP.
Although some specific spatial planning guidelines exist for the AMP, they are not part of a general metropolitan plan. The spatial development programme for Northern Portugal, which covers other NUTS III regions besides the AMP, is currently undergoing revision. In 2014, the AMP’s Territorial Strategic Plan for 2020 [51] was developed. It contained a diagnosis aimed at providing the AMP with a strategic framework for action to maximise the territorial impacts resulting from structural funds used during the 2014–2020 period. The equivalent strategy for 2030 was launched in 2022 [53]. Nonetheless, these documents only seek to remedy the lack of a plan for the metropolitan area.
The 2007 and 2018 national land use/land cover maps (COS) were used to assess land use changes in the AMP. These maps were chosen because they are regularly updated and provide spatial coverage (mainland Portugal), and also because cadastral data, which is usually adopted as a source in land take assessments in countries such as Germany, Austria and Belgium [28,29,32], is unavailable or outdated for several areas of Portuguese territory. Soil sealing in the AMP was only assessed in 2018, using the Imperviousness Density layer with a spatial resolution of 10 m. Given that the results presented are based on national data, their comparability with results published by the EEA [6,7,14,18,19] for the AMP is very limited due to differing assessment periods and data sources.
There follows a summary of the main findings of this study, which are compared, whenever possible, with the trends for Functional Urban Areas (FUAs) of the EU-27 and the UK [7] and discussed in light of the policies in force in the AMP.
The non-artificial land given over to urban development between 2007 and 2018 in the AMP is equivalent to 1.3% of its surface area and was the highest (0.64 ha/day) of the NUTS III regions in Portugal [4]. Although the period available for comparison at the European level (2012–2018) is shorter than that considered in this study, the land take rate in the AMP (1153 m2/year·km2) was almost double that for the FUAs mentioned above (596 m2/year·km2, based on estimates from contents available in [6,7]). The large consumption of non-artificial land in the AMP can be explained by the dispersed urban development that covers about 70% of its territory [51]. This kind of development is, indeed, more land and resource intensive than compact urban development [54].
The main drivers of land take in the AMP in this period were the creation or expansion of transport networks, industrial and commercial units, construction sites and dispersed residential areas. Despite their unequal relative importance, land take pressures in the 661 FUAs in the EU-27 and the UK [6,7] were similar to those observed in the AMP. The expansion of mining and quarrying areas was of greater significance in the FUAs than the extension of transport networks. The diffuse linear development in a large part of the AMP [51] and the predominance of commuting by private car [50] explain the importance of expanding transport networks in this region. In fact, in the period under review, one of the principal investments made in the AMP to reduce dependence on individual transport was the extension of the Porto metro network [55].
Even though the amount of land lost to human development is generally much higher than that re-naturalised, the artificial area converted to non-artificial in the AMP during 2007–2018 (2.1 km2) was about 12 times less than that of land taken. The re-naturalisation rate in the AMP (93.1 m2/year·km2) was slightly lower than that of European FUAs (94.5 m2/year·km2, based on estimates from contents available in [6,7]).
The major land-use types produced by re-naturalisation in the AMP were semi-natural areas, forests and woodlands and agricultural areas. Conversions of mineral extraction sites and construction sites to bushland were the most common (40%). It should be noted that this is the least desirable type of re-naturalisation for the AMP, as such changes result from land abandonment and increase the risk of forest fires.
Between 2007 and 2018, the net land take rate in the AMP (1060 m2/year·km2) was about twice that of European FUAs (501.2 m2/year·km2, based on estimates from contents available in [6,7]). Accordingly, the net consumption of non-artificial land in the AMP (0.59 ha/day) still needs to decrease to meet the European target by 2050.
In order to reduce net land take in the AMP, it is crucial to promote the reuse of artificial land, which was extremely low (0.02 ha/day) during 2007–2018. Although most AMP municipalities began urban regeneration operations during this period, many of these were launched between 2017 and 2018 [56], so their impact is expected to be more noticeable in a later assessment. The reuse of artificial land accounted for only 2.6% of the total consumption of artificial land in the AMP, which is negligible compared to the equivalent degree in European cities in the 2006–2012 period (13.5%) [19].
In the period under review, despite the AMP and most of its municipalities experiencing population losses, an expansion of artificial land occurred in the whole territory. Only one of the five municipalities where the population grew (Maia) reduced the artificial area per capita, thus showing a trend towards densification of its urban area, which is desirable if the European target is to be met [57].
Although official statistics disclose population declines in the AMP, local planning actors claim that such figures are misleading, as they ignore the foreign population without legal resident status, which grew substantially in this period and was responsible for an increased demand for affordable housing. The 2018 national immigration report [58] confirms that there has indeed been a large influx of immigrants, particularly citizens of Bangladesh, Brazil, Nepal and India, who doubled their presence from 2017 to 2018, especially in metropolitan areas and some rural regions of the mainland. However, this report does not break down migrants by NUTS III regions, making it impossible to know their exact number inside the AMP.
In consideration of the fact that there may have been a population increase that the study could not disclose and, given that the non-artificial land taken in the AMP between 2007 and 2018 was mainly used to develop transport networks and industrial, commercial and construction sites, it is not acceptable that the artificial surface areas should continue to grow in the future at the rate seen in this period, even if some municipalities still need to invest in infrastructure to attract people.
Concerning soil sealing levels within urban areas, it was found that in 2018, most AMP municipalities and the whole region had shares of imperviousness of artificial land above 50%. According to some authors [5,27], these high levels of soil sealing are already contributing to biodiversity loss. Accordingly, only one municipality (Arouca) showed some potential for intensifying densification or grey recycling in its urban areas without compromising biodiversity. Given the fact that the lowest unsealed artificial surface per capita rates were observed in the centre-north of the AMP, namely in the municipalities of Porto, Matosinhos, Valongo and Gondomar, it is considered essential that local authorities adopt measures to counteract additional soil sealing within their urban areas. As the availability of unsealed soil in artificial land areas is indirectly linked to the availability of open urban spaces, which are fundamental in improving the living and environmental conditions of cities, the German strategic guidelines for achieving the European target seek to reduce the land taken by increasing the density of settlements without decreasing urban open space per capita [28].
The results obtained indicate that the legislation in force in the AMP in the 2007–2018 period was not sufficiently effective in controlling the consumption of non-artificial land and, above all, in fostering the reuse of artificial land, which is essential for reducing land take. Moreover, it was found that regional and local soil policies do not adequately value the functions and services provided by this natural resource. To this end, local authorities must implement operational frameworks to limit non-artificial land consumption and additional soil sealing on artificial land, which may include setting indicative targets. By ensuring that housing and infrastructure needs are met through the reuse of artificial areas that have already been sealed, it is possible to preserve artificial land that has not yet been made impermeable and where the soil still provides some ecosystem services that can play a fundamental role in urban sustainability. However, given that the share of impermeable soil in most urban areas is already significantly high, a careful choice in terms of the locations where intensification of land use causes less environmental damage will have to be made.
The lack of official campaigns in Portugal aimed at disseminating the European target for 2050, the European Soil Strategy for 2030, and the current proposal Directive on Soil Monitoring and Resilience (SML) have contributed to the unawareness of these issues among most national decision makers and spatial planners. However, sensitising those involved in land management, including citizens in general, about these matters and their connection to the 2030 sustainable development goals (SDGs) is paramount to facilitating acceptance of any control mechanisms.
As most Portuguese municipalities are already familiar with the SDGs, in line with other studies [52,59], the authors support that the definition of sustainability targets for the AMP and indicators (including some of those addressed by this study) to assess local planning performance according to such targets, could facilitate the interaction of the regional level with municipalities and contribute to improving land use, particularly with regard to increasing the provision of ecosystem services. Furthermore, it is thought that a regular assessment of the ecosystem services provided by the soil, aimed at informing local land use change decisions, would allow for a fairer valuation of this resource and a better understanding of the European target. In addition, taking into account the proper economic value of soil can help define land take fees and determine building rights [9]. This would also enable the implementation of financial compensation mechanisms for urban landowners who lose development rights because their land is located in areas protected by specific legal regimes (such as REN, RAN and SNAC) or for those who may lose such rights due to possible land policy changes. As recognised by the AMP’s strategy for 2030 [53], integrating ecosystem services into metropolitan management will be beneficial for reducing emissions and developing preventative measures for the impacts of climate change.
It should also be emphasised that the AMP’s strategic objectives for 2030 [53] reveal an awareness of the need to protect and value natural resources despite the indicators assessed in this study not reflecting this. Between 2018 and 2019, the area protected for nature conservation in the AMP grew substantially, covering 3% of the region. Over the last decade, improvements have been made to the main river corridors. By 2030, the aim is to ensure their connection with protected areas for nature conservation and other areas of high ecological sensitivity to provide environmental connectivity. Various projects have also been implemented to conserve and regenerate habitats and natural spaces in the region.
The main limitations of the study concern the following aspects. The research did not make it possible to identify target values for the unsealed (or sealed) artificial land per capita, which could be used as a benchmark by cities to maintain biodiversity. An in-depth investigation into these target values is therefore considered essential, although this is beyond the scope of this study. Also, concerning the unsealed artificial surface per capita, this study assumed that the artificial areas are used by every inhabitant of the municipality that encompasses them. It is, therefore, recognised that this indicator could still be improved by applying a method (e.g., asymmetric mapping) to link population data to the spatial extent of artificial areas, which could not be developed due to time constraints.
Given that the IMD 2018 dataset is not comparable with previous equivalent products due to changes in its resolution and production method [7,60], it was also not feasible to estimate the soil sealing rate within artificial land between 2007 and 2018, which would be desirable for comparison with the homologous land take rate.
This research focused on analysing the processes associated with net land take, reuse of artificial land, soil sealing and population evolution. However, it is recognised that choosing an urban development path based on the objective of no net land take requires the additional consideration of environmental and economic aspects, political priorities and social preferences, which could not be addressed. Nonetheless, the study highlights some of the challenges that will be faced by decision-makers and other stakeholders in land use planning to implement the European objective.
5. Conclusions
By assessing the processes that may impart achievement of the 2050 target [1] and identifying the regional drivers of net land take, this study aims to help develop a “no net land take” policy for the second-largest metropolitan region of Portugal (AMP). The main contribution of the research is the exploration of new indicators in terms of soil sealing and population data to identify the potential for implementing interventions proposed by the EU Soil Strategy [24] that do not jeopardise the maintenance of biodiversity in urban areas.
During 2007–2018, the land taken in the AMP was mainly driven by the development of transport networks, industrial and commercial units and dispersed housing. The reuse and re-naturalisation of artificial land were little used in the region. Thus, daily net land take still amounted to 0.59 ha/day. While artificial land increased across the AMP, most of its municipalities lost population. To combat this trend, the AMP should implement stricter control mechanisms to ensure infrastructure and housing needs are met by reusing urban areas that are already sealed. However, given that the share of impermeable soil in most urban areas is already significantly high, there will have to be a careful choice of locations where intensifying land use will cause less environmental damage. These results prove that assessing the degree of soil sealing within urban areas is paramount for deciding on the interventions to be carried out to decrease net land take.
In addition, the study revealed that regional and local land use policies do not adequately value the functions and services provided by soil in urban areas, and the legislation in force in the region does not effectively encourage the reuse of artificial land that has already been sealed, which is crucial for reducing land take. To bridge these gaps and support the definition of strategies to reduce land take and soil sealing, it is proposed to define sustainability targets for the AMP and indicators to assess the performance of local planning according to those targets. The set of indicators should include some of those discussed in this document.
According to Build Europe [37] (p. 17), the EU target for 2050 “does not take into account the specific reality of each region and the economic, social and land context of each territory”. Therefore, to help define contextualised “no net land take” policies, this organisation advocates the creation of regional land observatories to monitor population dynamics, land consumption, housing and infrastructure needs.
This study also highlighted the complexity of identifying strategies towards a no-net land take policy. It showed that increasing the reuse of artificial land, required by the 2050 target, cannot be dissociated from the proportion of this land that is already sealed because intensifying land use in urban areas will reduce the capacity of the soil to provide ecosystem services. Accordingly, it is proposed that the 2011 target be updated to a more contextualised objective aligned with biodiversity goals for cities, which should consider the level of soil sealing and demographic pressure in urban areas. Furthermore, the SML [26] should be more specific in the mandatory monitoring indicators, demanding differentiation between soil sealing levels inside and outside urban areas.
The increase in the density of urban areas requested by the 2050 target requires rethinking how cities are structured without ignoring the characteristics that differentiate them (e.g., economic, environmental and social). As such, there is no standardised path that can be replicated in all cities to meet the target. For this reason, a widespread dissemination of successful interventions [9,20,37] that can be adapted to other contexts is of utmost value.
This study interests spatial planning actors unaware of the European goal and the interventions that can be undertaken to meet it by 2050. The content presented, particularly the soil sealing indicators adopted, can be applied to any European region and serve as an example for those that have not commenced monitoring processes linked to net land take. Moreover, the study is also relevant for anyone operating in the field of sustainable urban development.
Author Contributions
Conceptualisation, R.N. and B.C.; methodology, R.N.; software, R.N.; validation, R.N. and B.C.; formal analysis, R.N.; investigation, R.N. and B.C.; resources, R.N. and B.C.; data curation, R.N.; writing—original draft preparation, R.N. and B.C.; writing—review and editing, R.N. and B.C.; visualisation, R.N. and B.C.; supervision, R.N. and B.C.; project administration, R.N.; funding acquisition, B.C. All authors have read and agreed to the published version of the manuscript.
Funding
This research was funded by the Foundation for Science and Technology (FCT) through grant 10.54499/UIDB/05703/2020 awarded to the CiTUA research unit.
Data Availability Statement
The principal datasets supporting the presented results are the Portuguese land use/land cover maps for 2007 and 2018 (known as COS), which are freely available from the Portuguese National Spatial Data Infrastructure “https://snig.dgterritorio.gov.pt (accessed on 15 January 2024)”, the Imperviousness Density (IMD 2018) provided by the Copernicus Monitoring Service “https://land.copernicus.eu/pan-european/high-resolution-layers/imperviousness/status-maps/imperviousness-density-2018 (accessed on 15 January 2024)” and the annual population estimates produced by Statistics Portugal.
Acknowledgments
The authors would like to thank Filipe Marcelino, from DGT, for his technical support on land use/cover issues.
Conflicts of Interest
The authors declare no conflicts of interest.
References
- European Commission. Roadmap to a Resource Efficient Europe. COM/2011/571 Final; Brussels. 20 September 2011. Available online: https://eur-lex.europa.eu/legal-content/EN/TXT/PDF/?uri=CELEX:52011DC0571&from=EN (accessed on 28 June 2023).
- Decoville, A.; Schneider, M. Can the 2050 zero land take objective of the EU be reliably monitored? A comparative study. J. Land Use Sci. 2015, 11, 331–349. [Google Scholar] [CrossRef]
- Marquard, E.; Bartke, S.; Gifreu i Font, J.; Humer, A.; Jonkman, A.; Jürgenson, E.; Marot, N.; Poelmans, L.; Repe, B.; Rybski, R.; et al. Land consumption and land take: Enhancing conceptual clarity for evaluating spatial governance in the EU context. Sustainability 2020, 12, 8269. [Google Scholar] [CrossRef]
- Nicolau, R.; Condessa, B. Monitoring Net Land Take: Is Mainland Portugal on Track to Meet the 2050 Target? Land 2022, 11, 1005. [Google Scholar] [CrossRef]
- Decoville, A.; Feltgen, V. Clarifying the EU objective of no net land take: A necessity to avoid the cure being worse than the disease. Land Use Policy 2023, 131, 106722. [Google Scholar] [CrossRef]
- European Environment Agency. Net Land Take in Cities and Commuting Zones in Europe. 23 March 2023. Available online: https://www.eea.europa.eu/en/analysis/indicators/net-land-take-in-cities (accessed on 12 November 2023).
- European Environment Agency. Land Take and Land Degradation in Functional Urban Areas; EEA Report No 17/2021; Publications Office of the European Union: Luxembourg, 2022; p. 73. Available online: https://www.eea.europa.eu/publications/land-take-and-land-degradation/at_download/file (accessed on 28 June 2023).
- European Commission; European Commission, DG Environment. Science for Environment Policy. No Net Land Take by 2050? Future Brief 14; Science Communication Unit, UWE, Bristol. April 2016. Available online: http://ec.europa.eu/science-environment-policy (accessed on 28 June 2023).
- Naumann, S.; Frelih-Larsen, A.; Prokopp, G. RECARE-Preventing and Remediating Degradation of Soils in Europe through Land Care. Policy Brief on Soil Sealing and Land Take. September 2018. Available online: https://www.ecologic.eu/sites/default/files/publication/2018/2730_recare_soil-sealing_web.pdf (accessed on 28 June 2023).
- Scalenghe, R.; Marsan, F.A. The anthropogenic sealing of soils in urban areas. Landsc. Urban Plan. 2009, 90, 1–10. [Google Scholar] [CrossRef]
- Tobias, S.; Conen, F.; Duss, A.; Wenzel, L.M.; Buser, C.; Alewell, C. Soil sealing and unsealing: State of the art and examples. Land Degrad. Dev. 2018, 29, 2015–2024. [Google Scholar] [CrossRef]
- Tóth, G.; Ivits, E.; Prokop, G.; Gregor, M.; Fons-Esteve, J.; Milego Agràs, R.; Mancosu, E. Impact of Soil Sealing on Soil Carbon Sequestration, Water Storage Potentials and Biomass Productivity in Functional Urban Areas of the European Union and the United Kingdom. Land 2022, 11, 840. [Google Scholar] [CrossRef]
- European Commission, DG Environment. Soil Sealing. Science for Environment Policy-In-Depth Reports; Science Communication Unit, University of the West of England (UWE): Bristol, UK, March 2012; p. 41. Available online: https://ec.europa.eu/environment/archives/soil/pdf/sealing/Soil%20Sealing%20In-depth%20Report%20March%20version_final.pdf (accessed on 28 June 2023).
- European Environment Agency. Land Take and Net Land Take. 10 September 2019. Available online: https://www.eea.europa.eu/data-and-maps/dashboards/land-take-statistics (accessed on 28 June 2023).
- Intergovernmental Panel on Climate Changes. Climate Change and Land. Summary for Policymakers. IPCC Special Report on Climate Change, Desertification, Land Degradation, Sustainable Land Management, Food Security, and Greenhouse Gas Fluxes in Terrestrial Ecosystems. Approved Draft. 7 August 2019, p. 41. Available online: https://www.ipcc.ch/site/assets/uploads/2019/08/4.-SPM_Approved_Microsite_FINAL.pdf (accessed on 28 June 2023).
- Gebrehiwot, G.; Teka, K.; Welday, Y. Can landscape restoration improve soil carbon stock? A study from Sero Watershed, Northern Ethiopia. Glob. Ecol. Conserv. 2022, 39, e02274. [Google Scholar] [CrossRef]
- Umwelt Bundesamt. Brownfield Redevelopment and Inner Urban Development. 2014. Available online: https://www.umweltbundesamt.de/en/topics/soil-agriculture/land-use-reduction/brownfield-redevelopment-inner-urban-development#brownfield-reuse-greenfield-protection (accessed on 28 June 2023).
- European Environment Agency. Land Recycling in Europe-Approaches to Measuring Extent and Impacts; EEA Report No. 31/2016; Publications Office of the European Union: Luxembourg, 2016; p. 56. Available online: https://catalogue.unccd.int/806_Land%20recycling%20in%20Europe.pdf (accessed on 28 June 2023).
- European Environment Agency. Land Recycling and Densification—Indicator Assessment. 2021. Available online: https://www.eea.europa.eu/data-and-maps/indicators/land-recycling-and-densification/assessment-1 (accessed on 28 June 2023).
- ESPON. SUPER Project—Sustainable Urbanisation and Land-Use Practices in European Regions. In A Guide to Sustainable Urbanisation and Land-Use; Cotella, G., Evers, D., Rivolin, U.J., Solly, A., Berisha, E., Eds.; ESPON EGTC: Luxembourg, November 2020; p. 116. Available online: https://www.espon.eu/sites/default/files/attachments/2020_ESPON_SUPER_Guide_final_A4_screenview.pdf (accessed on 28 June 2023).
- Schatz, E.; Bovet, J.; Lieder, S.; Schroeter-Schlaack, C.; Strunz, S.; Marquard, E. Land take in environmental assessments: Recent advances and persisting challenges in selected EU countries. Land Use Policy 2021, 111, 105730. [Google Scholar] [CrossRef]
- Colsaet, A.; Laurans, Y.; Levrel, H. What drives land take and urban land expansion? A systematic review. Land Use Policy 2018, 79, 339–349. [Google Scholar] [CrossRef]
- European Commission. Guidelines on Best Practice to Limit, Mitigate or Compensate Soil Sealing; Publications Office of the European Union: Luxembourg, 2012; p. 68. [Google Scholar] [CrossRef]
- European Commission. EU Soil Strategy for 2030. Reaping the Benefits of Healthy Soils for People, Food, Nature and Climate. COM/2021699 Final; DG Environment, Brussels. 17 November 2021. Available online: https://ec.europa.eu/environment/document/download/ae853f10-c9a2-4665-a9f2-c29d11c49374_en (accessed on 28 June 2023).
- United Nations. Transforming Our World: The 2030 Agenda for Sustainable Development. 2015. Available online: https://sdgs.un.org/2030agenda (accessed on 28 June 2023).
- European Commission. Proposal for a Directive on Soil Monitoring and Resilience. Directorate-General for Environment. 5 July 2023. Available online: https://environment.ec.europa.eu/publications/proposal-directive-soil-monitoring-and-resilience_en (accessed on 1 December 2023).
- Yan, Z.; Teng, M.; He, W.; Liu, A.; Li, Y.; Wang, P. Impervious surface area is a key predictor for urban plant diversity in a city undergone rapid urbanization. Sci. Total Environ. 2019, 650, 335–342. [Google Scholar] [CrossRef]
- Fina, S. Land Take Data in a European Context–Comparing Apples and Oranges. SURFACE Virtual Symposium, Germany. 4 February 2022. Available online: https://www.ufz.de/export/data/464/262036_Land%20take%20data%20in%20a%20European%20context%20%E2%80%93%20Comparing%20apples%20and%20oranges.pdf (accessed on 28 June 2023).
- Umweltbundesamt. Flächeninanspruchnahme [Land Take]. 2022. Available online: https://www.umweltbundesamt.at/umweltthemen/boden/flaecheninanspruchnahme (accessed on 28 June 2023).
- Federal Office for the Environment. Swiss National Soil Strategy for Sustainable Soil Management; Swiss Federal Council: Bern, Switzerland, 2020; p. 68. Available online: https://www.bafu.admin.ch/dam/bafu/en/dokumente/boden/ud-umwelt-diverses/bodenstrategie-schweiz.pdf.download.pdf/en_BAFU_UI_2018_Bodenstrategie_bf.pdf (accessed on 28 June 2023).
- Wealer, R. Comment Integrér le Principe de “Zero Artificialisation Nette” dans le PDAT en Cours de Refonte? [How to Integrate the Principle of “Net Zero Artificialization” in the PDAT revision?]. ESPON Peer Learning Workshop: How to Reach No Net Land Take by 2050? Belgium. 9 February 2022. Available online: https://youtu.be/rIjSVy3QTl0 (accessed on 28 June 2023).
- Ruelle, C. No Net Land Take by 2050 in Wallonia? International Conference on Soils, Sediments and Water-Intersoil 2020, Brussels, Belgium. 23 March 2020. Available online: https://orbi.uliege.be/bitstream/2268/246065/1/Ruelle-Intersoil-3Mars2020.pdf (accessed on 28 June 2023).
- Lacoere, P.; Leinfelder, H. No net land take for Flanders. Towards a roadmap for the implementation of Europe’s land target. Raumforsch. Raumordn. Spat. Res. Plan. 2023, 81, 620–635. [Google Scholar] [CrossRef]
- Sistema Nazionale per la Protezione dell’Ambiente. Munafò, M., Ed.; Consumo di Suolo, Dinamiche Territoriali e Servizi Ecosistemici. Edizione 2022 [Land Use, Spatial Dynamics, and Ecosystem Services, 2022 Edition], Report SNPA 32/2022. Italy. 2022. Available online: https://www.snpambiente.it/wp-content/uploads/2022/07/Rapporto_consumo_di_suolo_2022.pdf (accessed on 28 June 2023).
- Gouvernement Francais. Portail de L’artificialisation des sols [Land Artificialisation Portal]. 2021. Available online: https://artificialisation.developpement-durable.gouv.fr/suivi-consommation-espaces-naf#paragraph--2164 (accessed on 28 June 2023).
- Wong, C.; Bäing, A.S. Brownfield Residential Redevelopment in England. What Happens to the Most Deprived Neighbourhoods? Joseph Rowntree Foundation. June 2010, p. 28. Available online: https://www.jrf.org.uk/sites/default/files/jrf/migrated/files/brownfield-residential-redevelopment-full.pdf (accessed on 28 June 2023).
- Build Europe. No Net Land Take by 2050 Solving the Unsolvable–10 Solutions for an Improved Management of European Land. 13 January 2022, p. 32. Available online: https://buildeurope.net/wp-content/uploads/2022/01/No-net-land-take-by-2050-Solving-the-unsolvable.pdf (accessed on 28 June 2023).
- Haines-Young, R.; Weber, J.-L.; European Environment Agency. Land Accounts for Europe 1990–2000-Towards Integrated Land and Ecosystem Accounting; EEA Report No. 11/2006; Office for Official Publications of the European Communities: Luxembourg, 2006; p. 107. [Google Scholar]
- European Environment Agency. Land Cover Accounts—An Approach to Geospatial Environmental Accounting. 2020. Available online: https://www.eea.europa.eu/themes/landuse/land-accounting (accessed on 28 June 2023).
- Ivits, E.; Milego, R.; Mancosu, E.; Gregor, M.; Petersen, J.; Büttner, G.; Löhnertz, M.; Maucha, G.; Petrik, O.; Bastrup-Birk, A.; et al. European Environment Agency & European Topic Centre on Urban, Land and Soil Systems (ETC-ULS). In Land and Ecosystem Accounts for Europe towards Geospatial Environmental Accounting; ETC/ULS Report 02/2020; ETC-ULS: Vienna, Austria, 2020; p. 78. [Google Scholar]
- Copernicus. Imperviousness Density. 2018. Available online: https://land.copernicus.eu/pan-european/high-resolution-layers/imperviousness/status-maps/imperviousness-density-2018 (accessed on 28 June 2023).
- OECD. Land-Use Planning Systems in the OECD: Country Fact Sheets; OECD Regional Development Studies; OECD Publishing: Paris, France, 2017; p. 230. [Google Scholar] [CrossRef]
- European Union. European Spatial Development Perspective-Towards Balanced and Sustainable Development of the Territory of the European Union; Official Publications of the European Communities: Luxembourg, 1999. [Google Scholar]
- European Union; Territorial Agenda of the European Union. Towards a more Competitive and Sustainable Europe of Diverse Regions. 2007. Available online: https://ec.europa.eu/regional_policy/sources/policy/what/territorial-cohesion/territorial_agenda_leipzig2007.pdf (accessed on 28 June 2023).
- European Union. Territorial Agenda of the European Union 2020. Towards an Inclusive, Smart and Sustainable Europe of Diverse Regions. 2011. Available online: https://ec.europa.eu/regional_policy/sources/policy/what/territorial-cohesion/territorial_agenda_2020.pdf (accessed on 28 June 2023).
- European Union. Territorial Agenda—A Future for All Places. 2020. Available online: https://territorialagenda.eu/wp-content/uploads/TA2030_jun2021_en.pdf (accessed on 28 June 2023).
- United Nations. New Urban Agenda–Habitat III. 2017. Available online: https://habitat3.org/wp-content/uploads/NUA-English.pdf (accessed on 28 June 2023).
- Nelson, A.; Pruetz, R.; Juergensmeyer, J. The TDR Handbook: Designing and Implementing Transfer of Development Rights Programs; Island Press: Washington, DC, USA; Covela, Portugal; London, UK, 2013; p. 344. [Google Scholar]
- Cavaco, C.; Florentino, R.; Pagliuso, A. Urban Policies in Portugal. In Foregrounding Urban Agendas. The New Urban Issue in European Experiences of Policy-Making; Armondi, S., De Gregorio Hurtado, S., Eds.; Springer: Cham, Switzerland, 2020; pp. 49–73. [Google Scholar] [CrossRef]
- Instituto Nacional de Estatística. Mobilidade e Funcionalidade do Território nas Áreas Metropolitanas do Porto e de Lisboa 2017 [Results of the Mobility Survey in the Metropolitan Areas of Porto and Lisbon, 2017]; INE: Lisboa, Portugal, 2018; p. 205. [Google Scholar]
- Área Metropolitana do Porto. AMP 2020—Estratégia de Base Territorial [AMP’s Territorial Strategic Plan for 2020]; AMP: Porto, Portugal, 2014; p. 46. [Google Scholar]
- Pogliani, L.; Ronchi, S.; Arcidiacono, A.; Martino, V.; Mazza, F. Regeneration in an ecological perspective. Urban and territorial equalisation for the provision of ecosystem services in the Metropolitan City of Milan. Land Use Policy 2023, 129, 106606. [Google Scholar] [CrossRef]
- Área Metropolitana do Porto. AMP 2030—Estratégia e Prioridades de Ação [AMP’s Strategic Plan for 2030]; AMP: Porto, Portugal, 2022; p. 186. [Google Scholar]
- Smiraglia, D.; Salvati, L.; Egidi, G.; Salvia, R.; Giménez-Morera, A.; Halbac-Cotoara-Zamfir, R. Toward a New Urban Cycle? A Closer Look to Sprawl, Demographic Transitions and the Environment in Europe. Land 2021, 10, 127. [Google Scholar] [CrossRef]
- Portugal 2020. Lista de Operações Aprovadas [Portugal 2020 Portal: List of Approved Operations]. 2022. Available online: https://portugal2020.pt/projetos-aprovados/lista-de-operacoes-aprovadas/ (accessed on 31 August 2023).
- Instituto da Habitação e da Reabilitação Urbana. Áreas de Reabilitação Urbana. Portal da Habitação [Housing Portal: Urban Rehabilitation Areas]. 2019. Available online: https://www.portaldahabitacao.pt/web/guest/consulte-as-aru#/arusInfo (accessed on 16 August 2023).
- Teller, J. Regulating urban densification: What factors should be used? Build. Cities 2021, 2, 302–317. [Google Scholar] [CrossRef]
- Serviço de Estrangeiros e Fronteiras. Relatório de Imigração, Fronteiras e Asilo 2018 [Immigration, Borders and Asylum Report 2018]; SEF: Lisboa, Portugal, 2019; p. 89. Available online: https://sefstat.sef.pt/Docs/Rifa2018.pdf (accessed on 16 August 2023).
- Ramos, T. Development of regional sustainability indicators and the role of academia in this process: The Portuguese practice. J. Clean. Prod. 2009, 17, 1101–1115. [Google Scholar] [CrossRef]
- Kleinewillinghöfer, L.; Olofsson, P.; Pebesma, E.; Meyer, H.; Buck, O.; Haub, C.; Eiselt, B. Unbiased Area Estimation Using Copernicus High Resolution Layers and Reference Data. Remote Sens. 2022, 14, 4903. [Google Scholar] [CrossRef]
Figure 1.
Methodological approach flowchart.

Figure 2.
Study area.

Figure 3.
Land under the REN or RAN regimes by AMP municipality and for the AMP as a whole, 2022 (% of the spatial unit area). Sources: Land protected by National Ecological Reserve (REN) and National Agricultural Reserve (RAN) extracted from Municipal Master Plans in force in 2022. Percentages estimated by the authors.

Figure 4.
Land take rate by AMP municipality, 2007–2018 (m2/year·km2). Sources: COS maps for 2007 and 2018, produced by DGT.
Figure 4.
Land take rate by AMP municipality, 2007–2018 (m2/year·km2). Sources: COS maps for 2007 and 2018, produced by DGT.

Figure 5.
Drivers of land take in the AMP, 2007–2018 (%). Sources: COS maps for 2007 and 2018, produced by DGT.
Figure 5.
Drivers of land take in the AMP, 2007–2018 (%). Sources: COS maps for 2007 and 2018, produced by DGT.

Figure 6.
Land re-naturalisation rate by AMP municipality, 2007–2018 (m2/year·km2). Sources: COS maps for 2007 and 2018, produced by DGT.
Figure 6.
Land re-naturalisation rate by AMP municipality, 2007–2018 (m2/year·km2). Sources: COS maps for 2007 and 2018, produced by DGT.

Figure 7.
Net land take rate by AMP municipality, 2007–2018 (m2/year·km2). Sources: COS maps for 2007 and 2018, produced by DGT.
Figure 7.
Net land take rate by AMP municipality, 2007–2018 (m2/year·km2). Sources: COS maps for 2007 and 2018, produced by DGT.

Figure 8.
Land surface area transformed by land take and land re-naturalisation and land use types consumed by each, AMP 2007–2018 (km2). Sources: COS maps for 2007 and 2018, produced by DGT.
Figure 8.
Land surface area transformed by land take and land re-naturalisation and land use types consumed by each, AMP 2007–2018 (km2). Sources: COS maps for 2007 and 2018, produced by DGT.

Figure 9.
Artificial land reuse rate by AMP municipality, 2007–2018 (m2/year·km2). Sources: COS maps for 2007 and 2018, produced by DGT.
Figure 9.
Artificial land reuse rate by AMP municipality, 2007–2018 (m2/year·km2). Sources: COS maps for 2007 and 2018, produced by DGT.

Figure 10.
Growth in resident population and artificial land by AMP municipality and for the AMP as a whole, 2007–2018 (%). Sources: Annual population estimates produced by Statistics Portugal; COS maps for 2007 and 2018 produced by DGT.
Figure 10.
Growth in resident population and artificial land by AMP municipality and for the AMP as a whole, 2007–2018 (%). Sources: Annual population estimates produced by Statistics Portugal; COS maps for 2007 and 2018 produced by DGT.

Figure 11.
Soil sealing levels in 2018 in the AMP, its municipalities and within their artificial land (%). Sources: Imperviousness Density (IMD) 2018 produced by Copernicus Monitoring Service—EEA; artificial land area extracted from COS 2018 map produced by DGT.
Figure 11.
Soil sealing levels in 2018 in the AMP, its municipalities and within their artificial land (%). Sources: Imperviousness Density (IMD) 2018 produced by Copernicus Monitoring Service—EEA; artificial land area extracted from COS 2018 map produced by DGT.

Figure 12.
Unsealed artificial surface area per capita in the AMP and its municipalities, 2018 (m2/inhabitant). Sources: Imperviousness Density (IMD) 2018 produced by Copernicus Monitoring Service—EEA; artificial land area extracted from COS 2018 map produced by DGT; 2018 population estimates produced by Statistics Portugal.


Table 1.
Rates of land take, re-naturalisation, net land take and reuse of artificial land by AMP municipality and for the AMP, 2007–2018. Sources: COS maps for 2007 and 2018, produced by DGT.
Table 1.
Rates of land take, re-naturalisation, net land take and reuse of artificial land by AMP municipality and for the AMP, 2007–2018. Sources: COS maps for 2007 and 2018, produced by DGT.
| AMP Municipalities | Land Take Rate (m2/year·km2) | Land Re-Naturalisation Rate (m2/year·km2) | Net Land Take Rate (m2/year·km2) | Artificial Land Reuse Rate (m2/year·km2) |
|---|---|---|---|---|
| Arouca | 143.6 | 11.2 | 132.4 | 0.0 |
| Espinho | 802.3 | 43.3 | 758.9 | 5.7 |
| Santa Maria da Feira | 2127.6 | 59.4 | 2068.2 | 31.4 |
| Oliveira de Azeméis | 1209.5 | 86.8 | 1122.7 | 23.3 |
| São João da Madeira | 2326.7 | 0.0 | 2326.7 | 90.6 |
| Vale de Cambra | 348.7 | 13.3 | 335.4 | 0.0 |
| Gondomar | 1225.0 | 147.4 | 1077.6 | 40.9 |
| Maia | 1010.7 | 214.8 | 795.9 | 22.3 |
| Matosinhos | 2356.2 | 37.9 | 2318.4 | 144.3 |
| Paredes | 1384.9 | 229.6 | 1155.3 | 20.6 |
| Porto | 877.3 | 202.7 | 674.6 | 49.2 |
| Póvoa do Varzim | 988.2 | 90.4 | 897.8 | 16.6 |
| Santo Tirso | 775.1 | 61.0 | 714.2 | 5.4 |
| Valongo | 2011.3 | 76.4 | 1934.9 | 19.9 |
| Vila do Conde | 711.4 | 188.9 | 522.5 | 22.4 |
| Vila Nova de Gaia | 2423.5 | 86.5 | 2337.0 | 96.0 |
| Trofa | 1277.1 | 118.1 | 1159.0 | 14.7 |
| AMP region | 1153.0 | 93.1 | 1059.9 | 28.0 |
Disclaimer/Publisher’s Note: The statements, opinions and data contained in all publications are solely those of the individual author(s) and contributor(s) and not of MDPI and/or the editor(s). MDPI and/or the editor(s) disclaim responsibility for any injury to people or property resulting from any ideas, methods, instructions or products referred to in the content. |
© 2024 by the authors. Licensee MDPI, Basel, Switzerland. This article is an open access article distributed under the terms and conditions of the Creative Commons Attribution (CC BY) license (https://creativecommons.org/licenses/by/4.0/).
Share and Cite
MDPI and ACS Style
Nicolau, R.; Condessa, B. Monitoring Net Land Take in a Metropolitan Region—Portugal. Urban Sci. 2024, 8, 8. https://0-doi-org.brum.beds.ac.uk/10.3390/urbansci8010008
AMA Style
Nicolau R, Condessa B. Monitoring Net Land Take in a Metropolitan Region—Portugal. Urban Science. 2024; 8(1):8. https://0-doi-org.brum.beds.ac.uk/10.3390/urbansci8010008
Chicago/Turabian StyleNicolau, Rita, and Beatriz Condessa. 2024. "Monitoring Net Land Take in a Metropolitan Region—Portugal" Urban Science 8, no. 1: 8. https://0-doi-org.brum.beds.ac.uk/10.3390/urbansci8010008