1. Introduction
Remote operation is increasingly studied in many fields, and its benefits are expected to increase, as combinations of sensor technology, artificial intelligence, and network connectivity enable new solutions and applications in new fields. Its immediate benefits are applicable in the remote operation of heavy-work machinery, as it can improve aspects thereof such as work safety and working conditions, including ergonomics and the efficient use of human labor.
Existing remote operation solutions are mostly based on setups which duplicate traditional controls and utilize displays showing camera feeds from the machine and some numerical and symbolic information. The operators may have to monitor several camera feeds simultaneously and, most importantly, they do not receive as much feedback from the machine they are operating as when operating inside the vehicle. In normal use scenarios, the operator would be presented only with the relevant information in a way that has minimal impact on their cognitive function and attention. However, such systems should be designed with respect to situational awareness, so that they are able to grab the operator’s attention immediately in scenarios where immediate action is needed, for example, to avoid an accident. These warnings are often closely related to safety and there has been little research on how this information should be conveyed to positively affect the operator’s situational awareness when they are using the machinery from a remote location.
In our study, we examined the possibilities of multimodal feedback in communicating warnings to the remote operator. This work was done in close collaboration between stakeholders from academia and industrial companies from the field of heavy-work machinery. The overall goal of the project was to build a software platform for remote operation that allows companies to tailor remote operations solutions to their specific needs and achieve working conditions where heavy-work machines can be operated more efficiently, safely, and in good working conditions.
Our work investigated how multimodal feedback can be utilized to increase situational awareness when driving remotely and communicate warnings to a remote operator. We aimed to find the optimal feedback combination of visual, auditory, and haptic modalities to communicate warnings and focused on warnings which can have multiple levels. To do so, we implemented a driving simulator environment and studied how the slipperiness of the road can be communicated through visual, auditory, and haptic feedback, and through combinations of these. The research questions investigated were as follows:
RQ1: What is the optimal multimodal combination of audio, visuals, and haptics to communicate road-condition warnings to a remote operator?
RQ2: What are the benefits and drawbacks of the different combinations of modalities?
Our goal was to look at communicating warnings in general, but we chose indications of slippery road conditions as the scenario for this study. This specific aspect of remote driving was chosen because it is easy to define and understand: there is a commonly used and documented way for detecting road slipperiness, using the rotation speeds of vehicle wheels (SAE International, 2008), and it is continuous by nature, i.e., the wheels can slip only slightly or very much. Furthermore, wheel slipping can start and end suddenly, or continue for some time, and it is also something that the driver can often feel when inside the vehicle. However, this feeling can be lost in remote operation. Similar warnings can be given for other phenomena as well: For example, when lifting, whether by cables or with a boom, the system can provide warnings when the lifted weight is close to the maximum capacity of the machine.
We conducted a controlled within-subjects experiment with the simulator, in eight conditions to understand how people receive the multimodal feedback. In addition to studying the effects of multimodal feedback, we validated the simulated driving system with a user experience questionnaire and collected the participants’ opinions and ideas on remote driving and its requirements. In summary, we had altogether 24 participants, of whom 9 were employees of representative industrial companies and 17 had a truck-driving license—characteristics that highlight the potential benefits of understanding heavier machinery in general. The participants were given an imaginary evacuation scenario and task, with all eight feedback conditions, in a counterbalanced order. For each condition, we collected participants’ subjective task load assessments with the NASA Task Load Index and user experiences with eight custom statements. After performing these tasks, we also asked the participants to fill in the overall user experience questionnaire and did a semi-structured interview.
Based on our condition-specific results, the multimodal feedback combinations were helpful: It was easier to determine when it was slippery, and they helped in performing the task. In terms of task load and user experiences, added haptics and added visuals, together, were considered the best feedback combination. Both added haptics and added visuals also worked quite well by themselves. Added audio feedback alone, on the other hand, was not considered pleasant and it increased frustration assessments as compared to added visual feedback alone, as well as compared to added haptics and visuals together. However, added audio feedback was considered to be more effective in communicating the slipperiness of the road as compared to natural audio. Based on the interviews, there was a clear distinction between experienced drivers and inexperienced drivers regarding the feeling of presence (i.e., the feeling of actual presence at the worksite). Experienced drivers brought up this issue much more than the inexperienced ones, and they emphasized the importance of feeling the movements, vibrations, and accelerations of the machine they are operating.
2. Related Work
Remote operation (sometimes also referred as teleoperation) has been a target of extensive development and research for over a century. This chapter provides an overview of the challenges of remote operation, remote driving, and related aspects, such as presence and situational awareness, followed by related work on multimodal warnings in remote operations or similar contexts.
2.1. Remote Operation
Remote operation (sometimes also referred as teleoperation) refers to an operation of a machine from a distance. The term is most commonly associated with controlling robots from a distant location, e.g., NASA’s Mars exploration rovers. Remote operation can be divided into two distinct categories: remote assistance, where the operator only provides routing instructions that are then executed by the vehicle’s automated control system, and remote driving, where the operator controls the vehicle’s steering, throttle, breaking, signaling, etc. [
1]. The requirements for hardware, bandwidth, and networking for implementing remote driving are more demanding than for remote assistance. The focus of this study is on remote driving.
The first experiment with remotely controlling an automobile, via radio, by an operator dates to 1925 [
2]. Since then (and especially during the 21st century) remote operation technologies have advanced greatly. Off-site remote operation has been experimented with, for example, in mining [
3], agriculture and farming, and with unmanned aerial vehicles (UAV), more commonly known as drones [
4]. A more urban example of remote driving are the electric scooters, where their repositioning, with the help of remote operators was examined by Hawkins [
5]. Traditionally remote operation have been used in environments that are hazardous or hard to reach for humans, and already cover the full spectrum of environments, including land, sea, air, and space. As a noteworthy addition, remote operations have also been used in in-vitro applications for robot-assisted surgery since the early 2000s.
Garcia et al. [
6] emphasized the role of human factors in remote operation, and categorized the causes of remote operation related human errors to three types:
Lack of knowledge on how to act in the presence of given information. Users require specialized training to operate the machinery.
The time needed to interpret the received information. If mentally fatigued, the operator may be unable to interpret the received information or perceive the stimuli in time.
Not receiving the information at all. If the focus of operator is on a specific task or detail, they may miss incoming information.
In addition, one should also consider misinterpretation of the given information as one of the causes of human error in remote operations. If the given stimuli or feedback from the system is unclear, the operator may act in a suboptimal or erroneous way.
The main challenge for remotely operating vehicles is latency. Remote driving (which is examined in this study) requires low latency two-way communication between the operator and the vehicle controlled, and the vehicles need to able to transmit video, audio, coordinates, sensor data, and many other forms of data to work efficiently. In addition, the operator needs control inputs such as steering wheels and pedals to perform the actual driving. The effect of latency has been found to significantly affect the operator’s performance; small delays below 170 ms have minimal effect on the operators [
7] but delays over 300 ms [
8] and 700 ms [
9] greatly worsen the driving experience.
A second challenge with the remote operation of vehicles is the question of legality. Each country has their own legislation for allowing vehicles to be controlled remotely. In general, many countries have set up laws that would allow remotely operated vehicles on public roads, and for example in most states in the United States, remote operations are viable option for driving as long as the operator has a valid driver’s license [
1]. Similar legislature has been set on the EU level [
10].
The primary safety goal of driving is maintaining the driver’s situational awareness of the vehicle and the remote environment. One challenge of driving in remote environments is limited situation awareness and attention, which are linked to presence (sometimes also referred as telepresence). In the context of remote operations, Akin et al. [
11] stated that (tele)presence occurs when “at the control station, the operator receives sufficient quantity and quality of sensory feedback to provide a feeling of actual presence at the worksite.” In this context, worksite refers to the site where the vehicle is operated in. A comprehensive analysis and background on (tele)presence in driving simulators can be found in Will [
12].
In our work, we aim to improve the operator’s situational awareness by providing multimodal feedback. Our hypothesis is that by using multimodal channels (in this study, haptic, visual and auditory feedback), we can increase both situation awareness and telepresence by providing feedback in the most appropriate manner.
2.2. Multimodal Feedback
Several multimodal interfaces have been proposed to enhance the human operator’s situational awareness while remotely operating [
13,
14,
15,
16,
17,
18]. The effectiveness of individual modalities conveying information to the remote operator has been studied on several occasions. For example, Chucholowski [
18] evaluated various types of predictive displays and concluded that they can effectively assist the operator with their task. The use of haptic feedback on the steering wheel for supporting the operator in challenging situations was proposed by Hosseini, Richthammer and Lienkamp [
15]. In a study by Hosseini and Lienkamp [
14], the operator’s situational awareness was improved by using a VR head-mounted display. In this solution, the incoming sensor data from the vehicle was used to create a representation of the vehicle’s location. Visual indicators augmented over the driving view may beneficially affect the safety and performance of driving, since the driver can see extra information without moving their gaze off the road [
16]. A study by Park et al. [
17] proposes a system that overlays collision-warning information on the windshield during night driving. In contrast to the AR Left-Turn Assist App proposed by Lutz [
19], which augments the view of pedestrians with a computer-mediated red outline around them,; this system uses color-coding to communicate danger levels.
The use of multimodal feedback was also explored in the context of automotive vehicles (AV) since the phenomena of situational awareness is similarly important in this context. The previous studies explored the use of added visual, haptic and auditory feedback [
16,
20,
21] to communicate take-over requests from the vehicle to a driver or influence situational awareness with a semi-automated vehicle. The work by Lindemann et al. [
16] discussed that added visual cues (such as overlayed visual threats, warnings and indications) provide significantly increased situational awareness and enough information to drive in bad weather conditions. Thy also pointed out that the visual modality can communicate more complex information, whereas additional haptic or audio cues may be used to draw drivers’ attention to the visually conveyed information. Further, the works by P. Bazilinskyy [
20] based on crowdsourcing surveys showed preference to multimodal feedback and demonstrated that short auditory messages were the most preferred feedback for take-over requests, despite being the most annoying and urgent types of warnings. The results also showed that single vibrotactile feedback, or vibrotactile feedback in combination with visual, are less preferred warning types for take-over request. These findings argue with the work by Adell et al. [
22], who investigated the use of multimodal feedback to support safe driving in a simulated study and demonstrated that vibrotactile feedback is preferred over auditory warnings in high urgency scenario.
The previous work also demonstrated the benefits of combining various multimodal cues for a single warning type. However, increasing the number of modalities and combining them does not always result in increased situational awareness. The study by Benz and Nitsch [
23] addressed the lack of applicable and accurate research for navigational tasks by designing 12 combinations of multimodal feedback for directional information, and further discussed the multimodal human–machine design implications for remote operated systems. The results of the study showed that combining modalities does not necessarily increase performance, but, on the contrary, may reduce the accuracy of the conveyed information. However, the aural and visual modalities, in combination with other modalities, were found to be beneficial in comparison with single-modality use.
Our research focuses on studying multimodal feedback in the context of delivering warnings to the remote operator. Whereas Benz and Nitsch [
23] used simplified bird’s-eye view and did not even attempt to simulate a realistic remote operation system in their experiment, we tested our hypothesis in a realistic simulator. We theorize that, in order to test out multimodal feedback effectively, the simulator should be sufficiently similar to a real-life scenarios, i.e., the feeling of presence should be high enough for the results to be applicable.
3. Materials and Methods
To study, how the slipperiness of the road may be communicated with audio, visuals, and haptics, and combinations of these, we built a driving simulator and conducted a controlled within-subjects experiment with eight conditions. This section details the designed simulator together with the driving set-up (
Section 3.1) and the design of the experimental user study (
Section 3.2).
3.1. Multimodal Driving Simulator
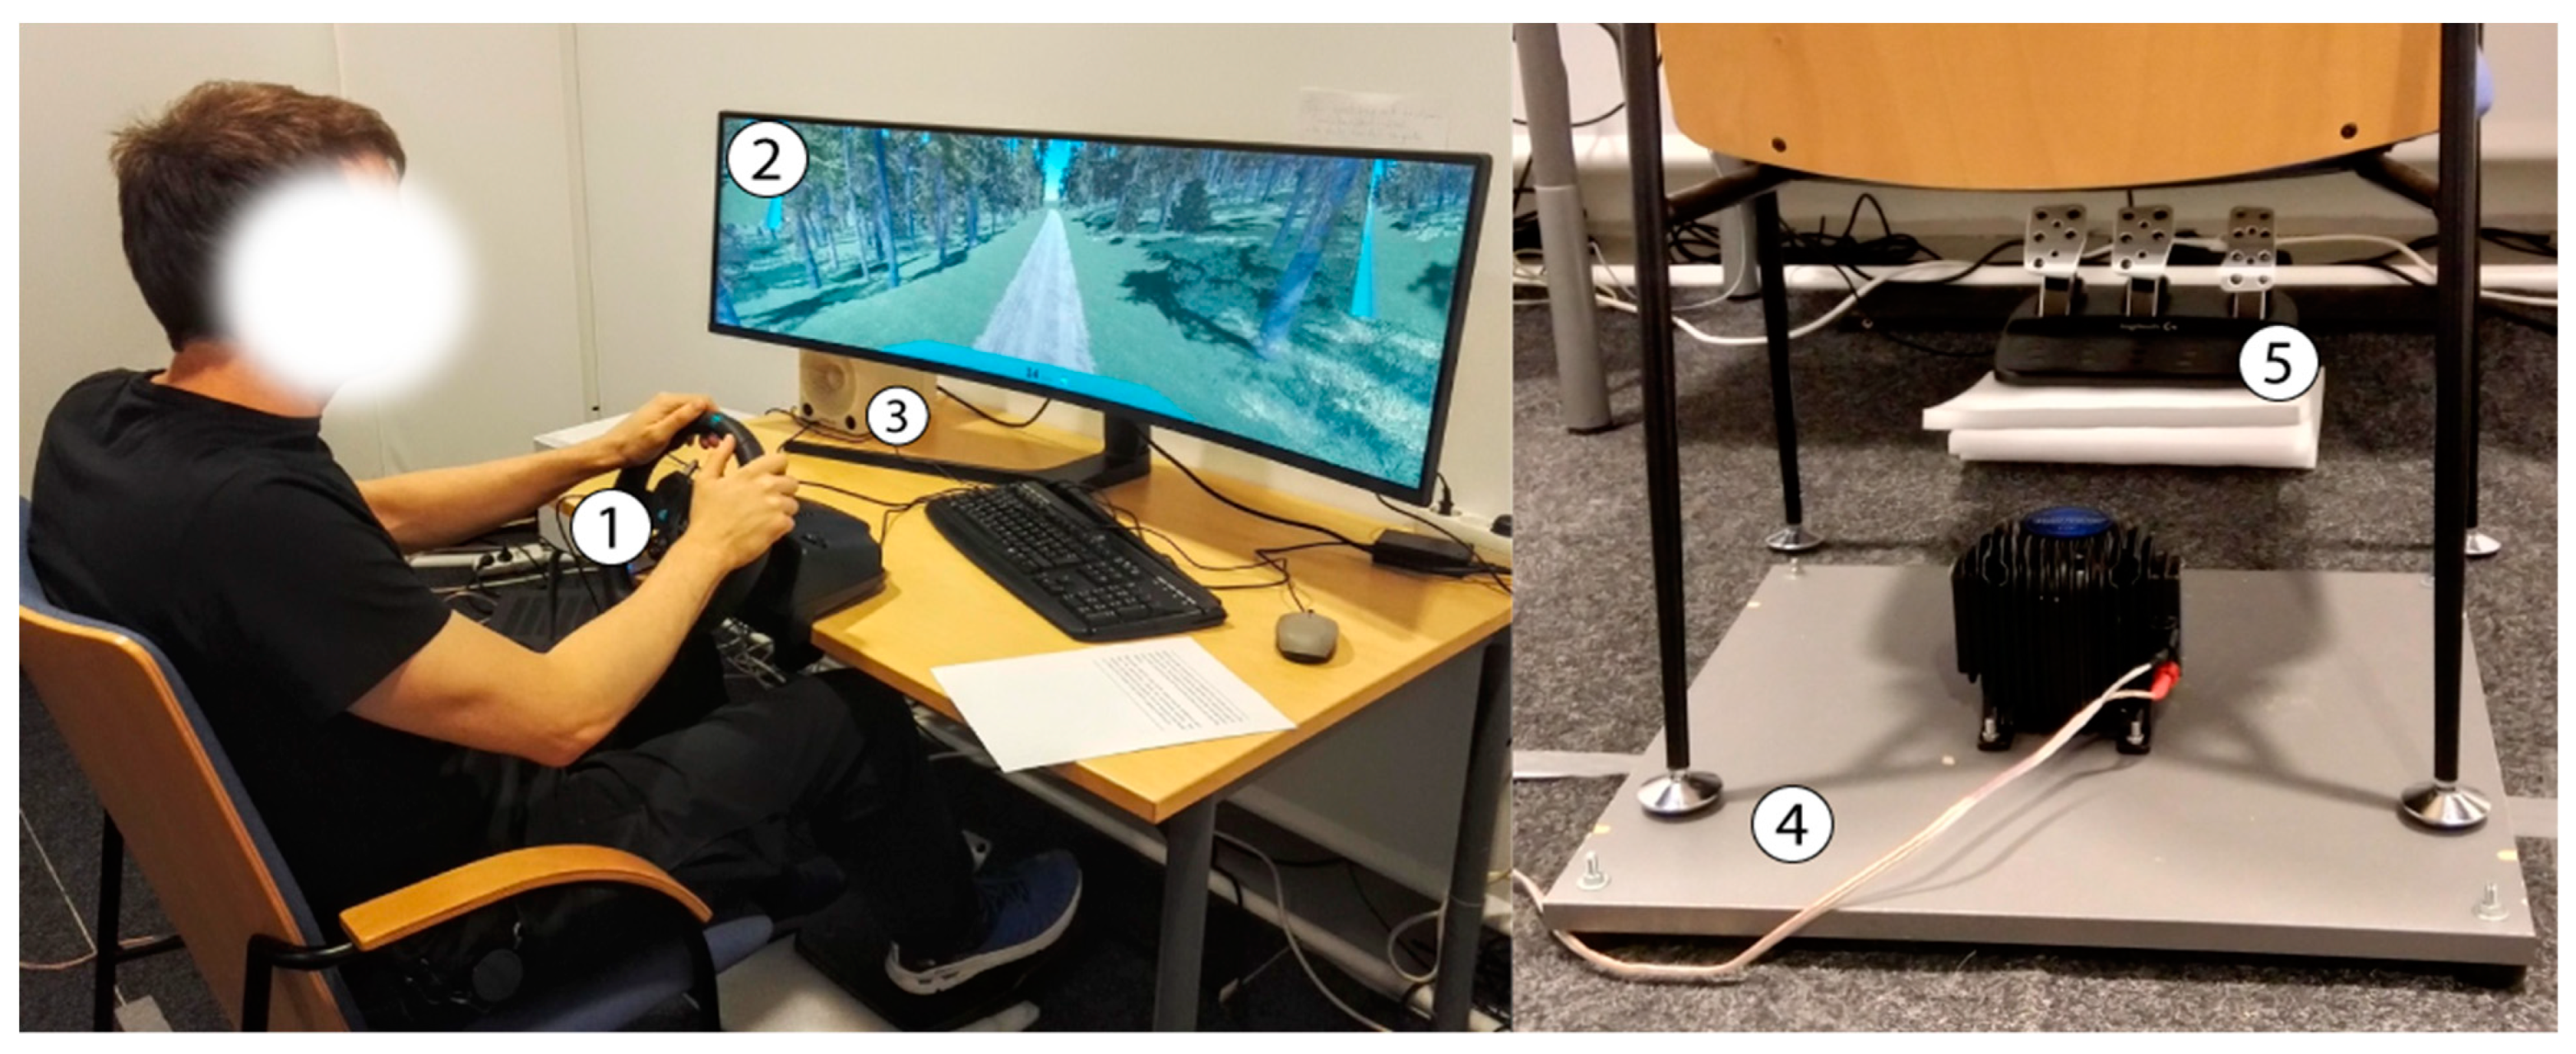
To simulate remotely operated driving safely in a laboratory environment, we built a driving simulator using the Unity game engine. The complete system design is shown in
Figure 1. The simulator provides a simplified 8-wheel-drive physics model, which is controlled using a steering wheel and pedals (Logitech G29 Driving Force). The visuals are shown on a 49” curved Samsung display with a resolution of 3840 × 1080 pixels. A single mono speaker, placed behind the screen, is used for audio feedback. The haptic feedback is provided by a tactile transducer, Buttkicker LFE, attached to a platform under the participant’s chair. Rubber feet are placed under the platform to reduce audible noise. Additionally, only the back feet of the chair are placed on the platform, due to size restrictions and safety concerns. These factors have a damping effect on the haptic feedback, which may be greater at higher frequencies. However, given that the chair’s center of mass is heavily on the side of the platform and our transducer has a low frequency range (5–200 Hz), the transmission of vibration was still adequate under these practical constraints.
The set-up was designed to investigate the use of multimodal feedback when operating a heavy vehicle remotely on forest roads. Hence, the simulated vehicle is an armored personnel carrier with maximum speed of 60 km/h.
The virtual environment was constructed based on a 2 m resolution elevation model from the National Land Survey of Finland [
24]. Texture and foliage (Terrain Toolkit 2017
https://assetstore.unity.com/packages/tools/terrain/terrain-toolkit-2017-83490, accessed on 12 June 2020) addonx for Unity and L3DT (
http://www.bundysoft.com/L3DT/, accessed on 12 June 2020) distribution maps were generated based on the elevation data, using a guided, semiautomatic process. Further, a single looping forest road (approx. 11.5 km in length) was placed manually over the map and was further split into six roughly equally sized segments for the experiment. One segment was selected for use in the training condition, which left five segments available for the feedback conditions. Since there are more feedback conditions than road segments, the last three feedback conditions were driven in the reverse direction of the first three road segments. The road segments were driven in the same sequence each session, such that the feedback conditions are counterbalanced over them (see
Section 3.2.1 for details).
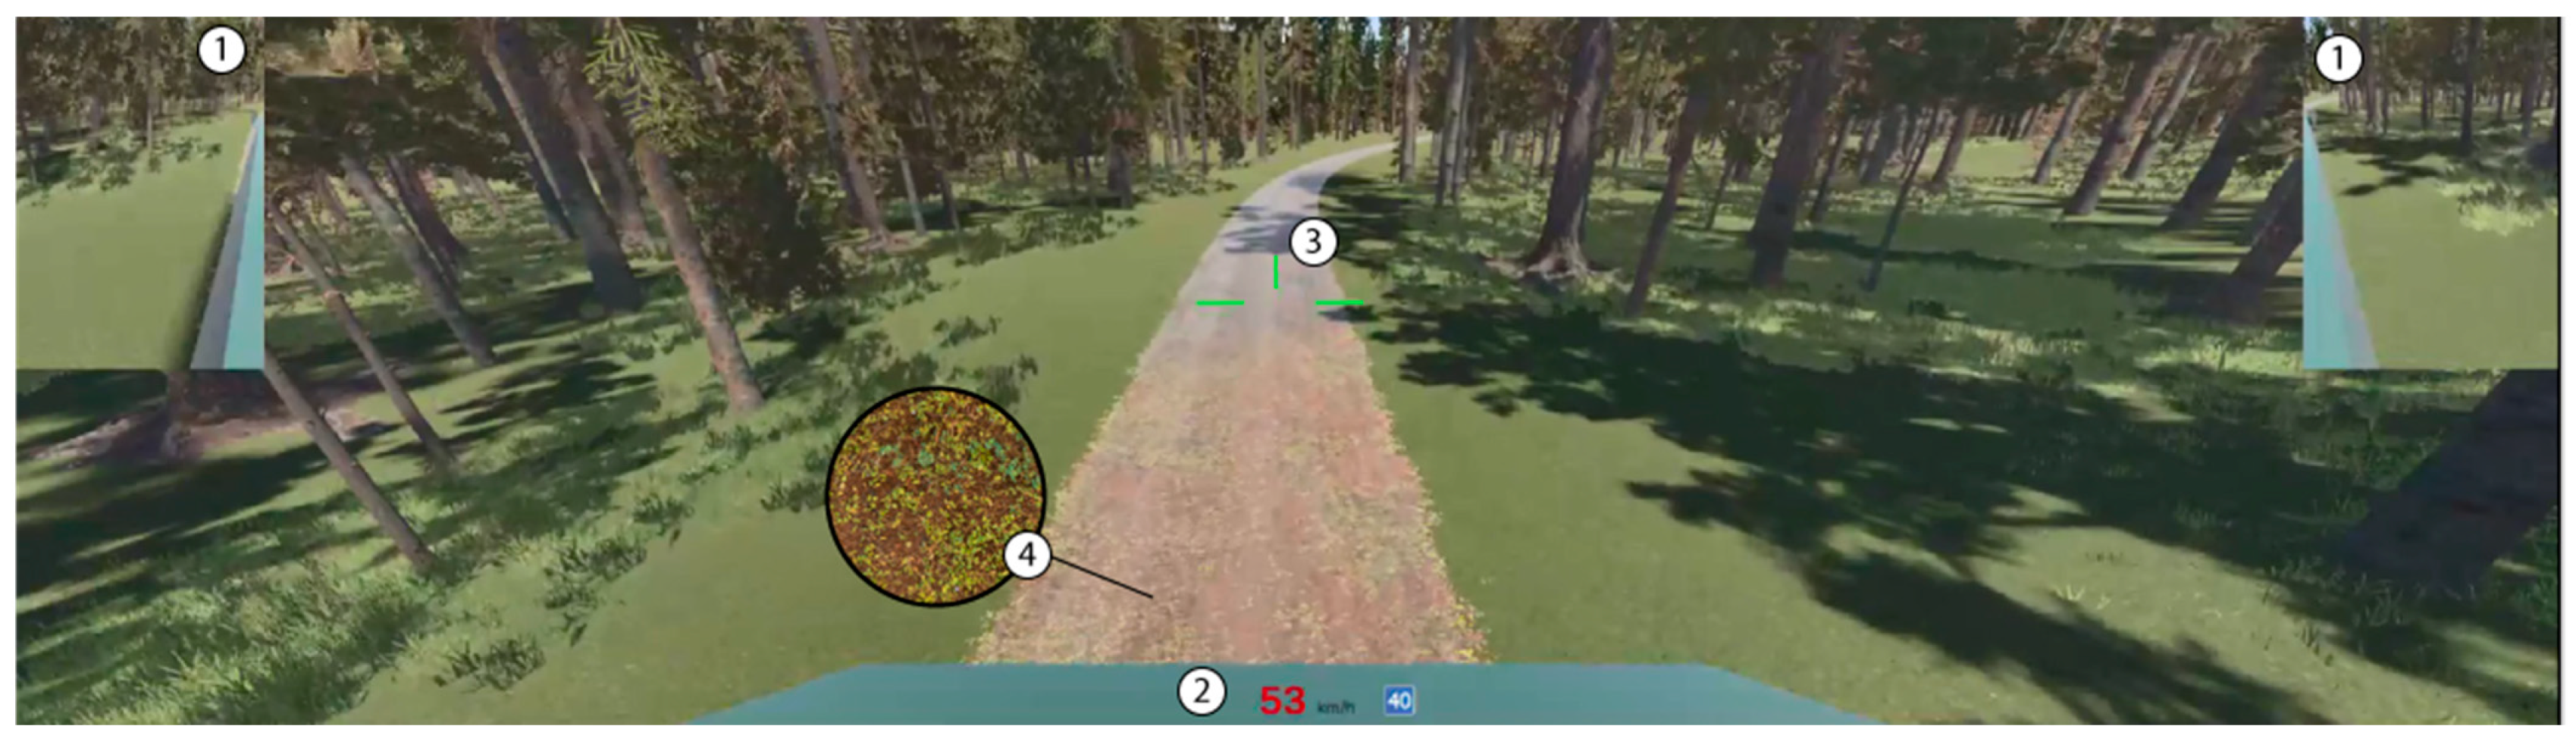
Slippery locations were placed on the route such that each segment had eight such spots. Four out of eight spots were visibly indicated in the simulated video feed using a mud texture (
Figure 2), Two out of eight did not have visual indications, and the remaining two were “fake-slippery”, i.e., they had visual indication but were not slippery. The six slippery spots also varied in length and position on the road: in each segment, there were variations of long and short slippery spots, covering the whole road, right side or left side of the road.
In the slippery spots, the grip between wheels and the road is reduced so that the vehicle turns or stops much slower that in regular road segments.
Figure 2 demonstrates also the other supportive information, that was visualized to simulate the driving experience: two side cameras, a dashboard with the speed of the vehicle, (in red if above the recommended speed of 40 km/h), and a horizon line (green cross in the middle).
3.2. Design of the Experimental User Study
To address our research goals, we conducted the experiment in controlled laboratory environments. In our study, we tested different kinds of feedback to inform the driver about slippery road conditions utilizing three modalities: audio, visual, and haptic. We recruited 24 participants to perform a simple driving task several times. After this, they provided us with their assessments on the system’s multimodal feedback and its design.
Each modality—audio, visual, and haptic—was assigned a natural and added form of feedback. The natural feedbacks simulated real information as it would exist from within the remote vehicle, e.g., a camera feed, engine sounds (based on rpm), and vibrations, as could be detected through cameras and different sensors. The condition with only natural feedback, i.e., natural audio–natural haptics–natural visuals (1_na-nh-nv), was considered the baseline in the experiment. Additional multimodal feedback, designed to inform the users about a slippery spot, we defined as “added feedback”. The added feedback further consisted of two warning levels. The first-level warning was communicated when the slippery spot was detected on the road, whereas the second was communicated when the vehicle was actually slipping, based on the relative rotation speeds of the wheels. This way we ensured that all the participants would experience at least some (level of) added feedback in every condition they encountered.
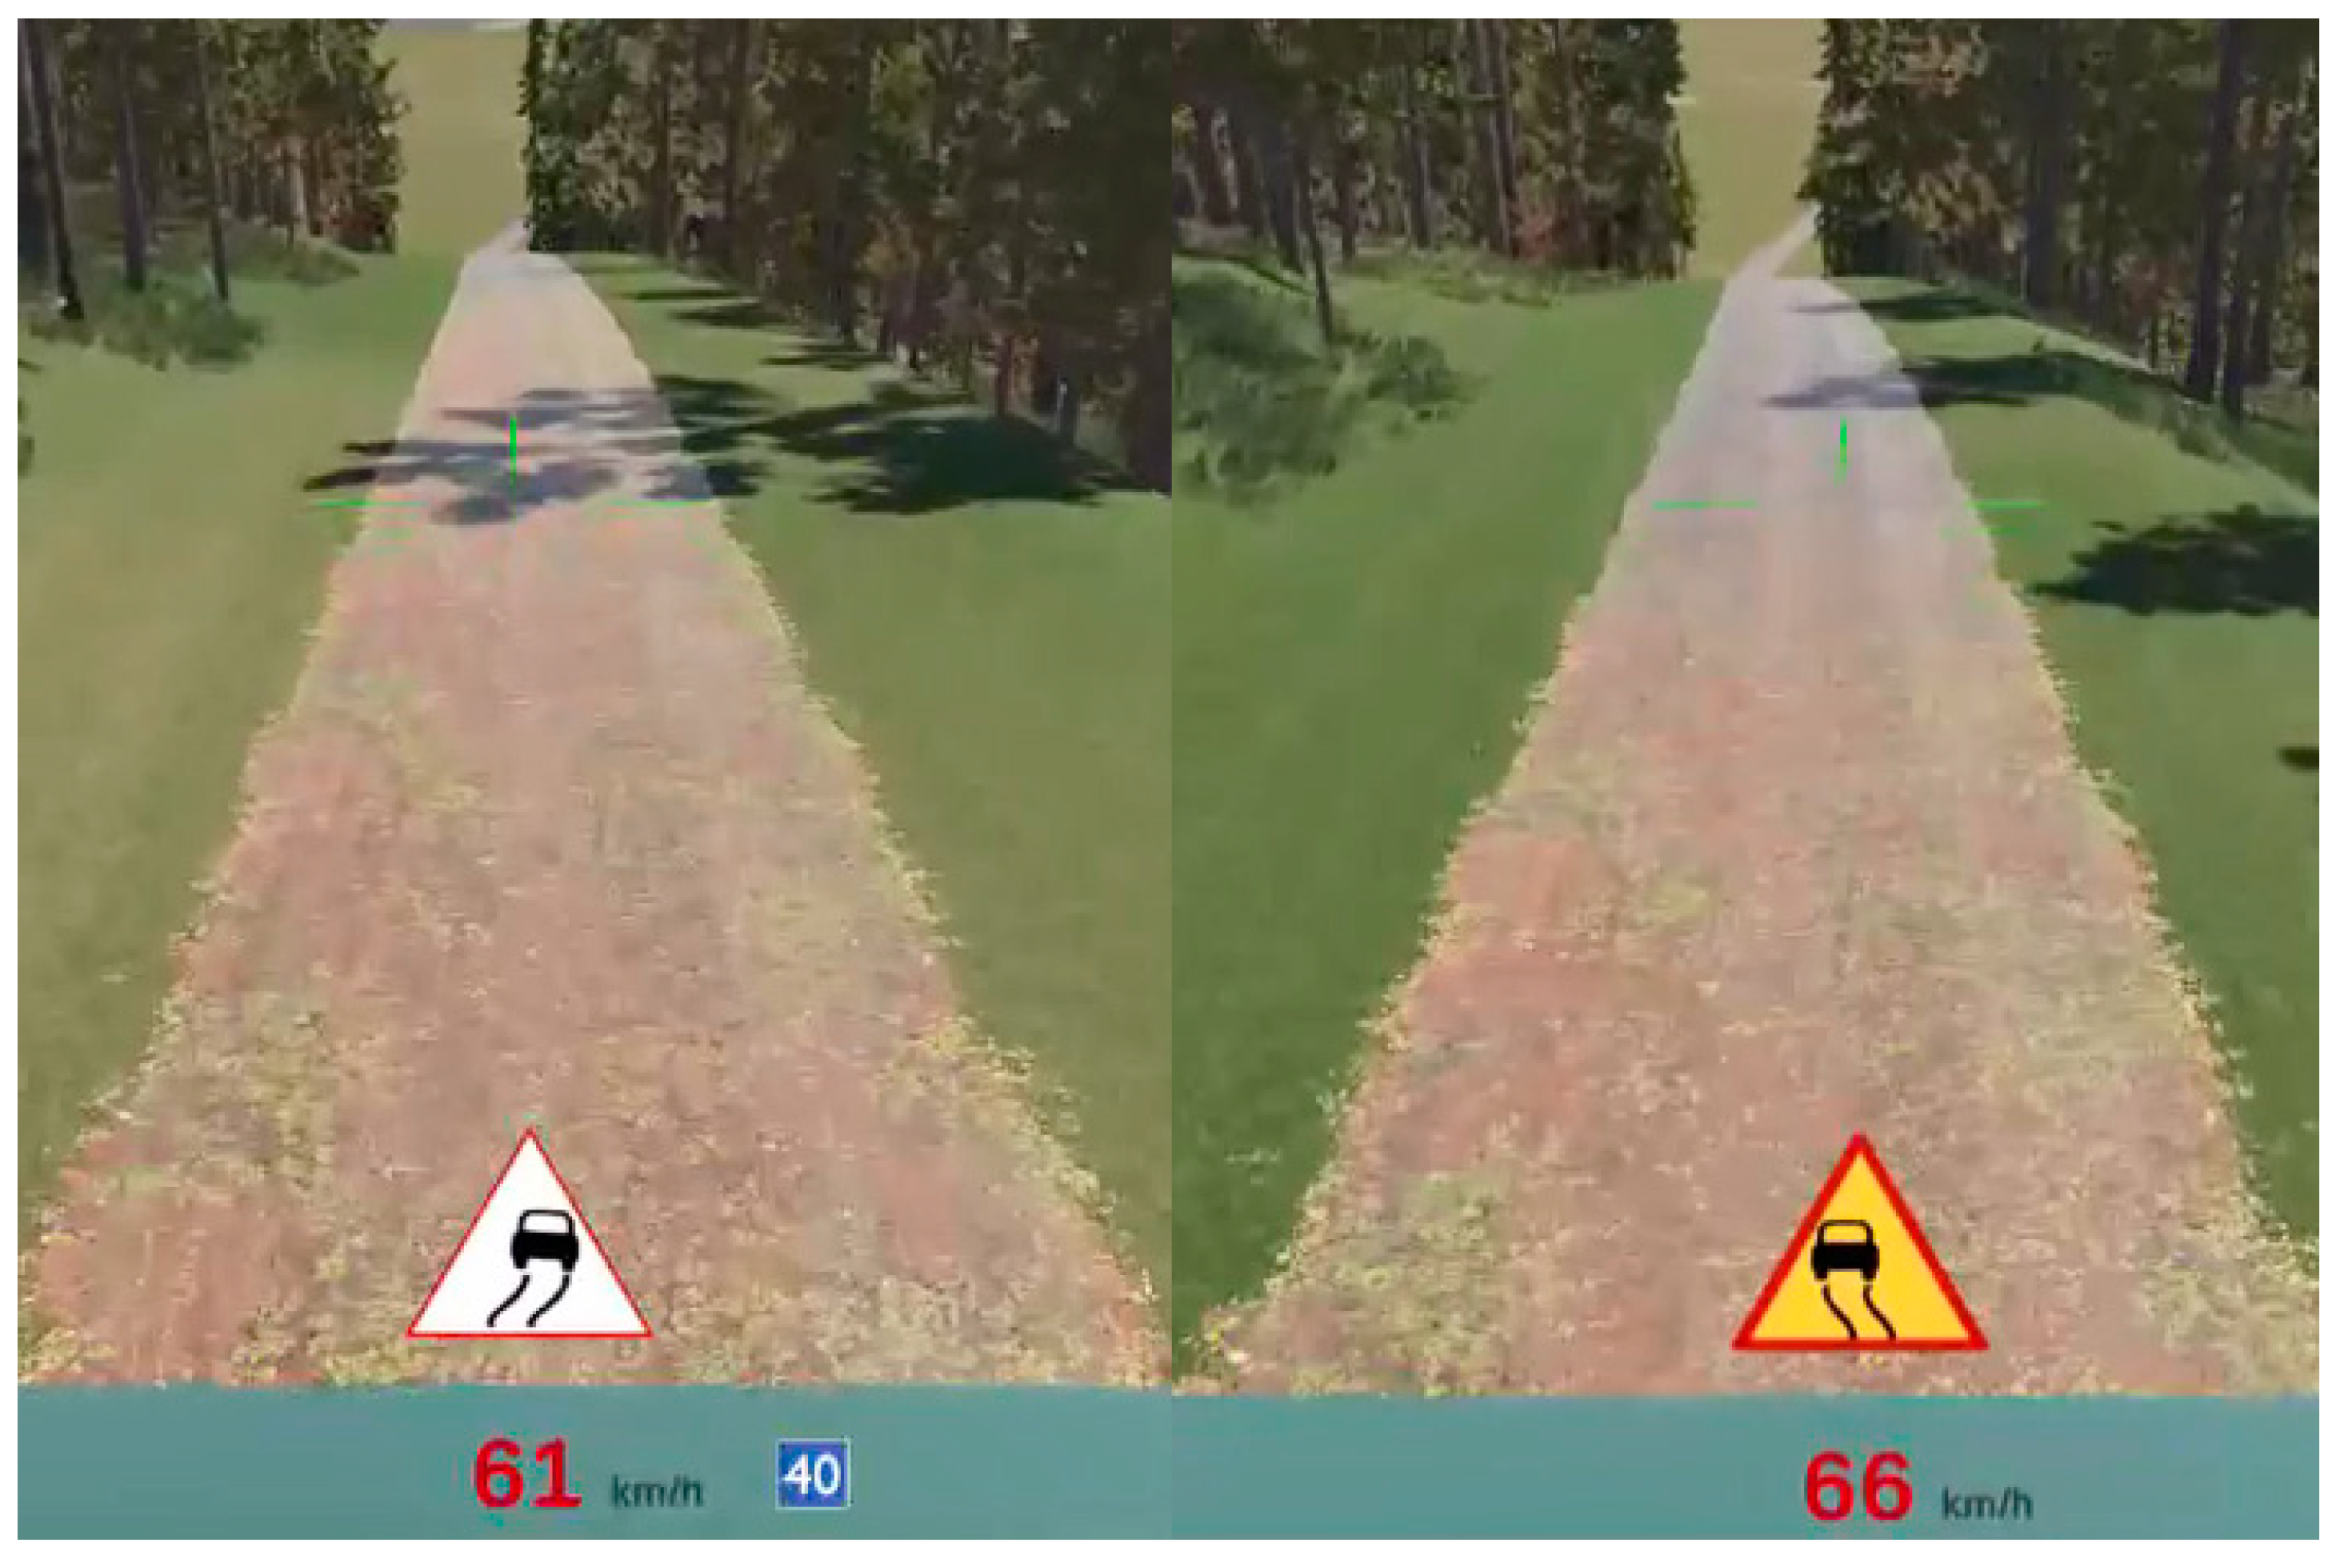
For audio, the two levels of added feedback were a warm sound and a bright sound, the second level having a higher low-pass filter cutoff frequency and higher amplitude than the first level, resulting in a harsher tone. For visuals, the first level had a normal animated icon and the second, a red-and-yellow animated icon with a car sliding inside a triangle.
Figure 3 demonstrates the two levels of added visual feedback. For haptic feedback, the second level had a higher amplitude and added low-frequency amplitude modulation, resulting in feedback that was more erratic.
3.2.1. Multimodal Feedback Conditions
In total, we tested eight driving conditions including the baseline (all natural) and all combinations of added feedback. We utilized within-subjects design, i.e., each participant experienced all eight conditions of multimodal feedback. Latin square-based counterbalancing for condition order between participants was used to minimize learning effects and previous conditions’ effects for subsequent trials in general. The conditions are presented in
Table 1.
3.2.2. Procedure of the Experiment
Participants’ background information was collected beforehand through an online questionnaire, the link for which was shared in a confirmation email. The procedure for actual experiment sessions began with the signing of a written consent form and a brief introduction to the study and the driving setup. Next, the participants were allowed a practice driving session, to get used to the setup and the simulated environment. After that, the participants began the experimental scenario and performed the eight driving conditions in a counterbalanced order. The scenario instructed them to “remotely drive the vehicles (in the middle of the road at 40 km/h) to evacuate people who are trapped in unsafe zones in the woods”. With these three scenario goals—target speed, staying in the middle of the road, and the evacuation of people from unsafe zones—we aimed to keep the participants focused on the task, rather than only driving around for fun.
Prior to each condition, the moderator informed the participants about the current combination of multimodal feedback. After each condition, the participants filled in a condition-related questionnaire in an electronic format. When all eight driving tasks had been performed, the participants watched a short recap video to remind them of the multimodal feedback and to clarify the meaning of terms, such as natural and added feedback, whereafter they filled in the final questionnaire. Finally, the participants answered interview questions.
3.2.3. Participants
In total, 24 participants (18 males, 6 females) aged from 21 to 52 (M = 36.5, SD = 10.47) participated in the study. Nine of the participants were employees of industrial companies from the field of heavy work machinery. The rest of the participants were working on a wide range of fields or were students from the field of ICT, mainly.
A truck-driving license was originally a requirement for participation to ensure participants had an understanding of heavy machinery. However, this requirement was dropped due to issues with participant recruitment. Therefore, 17 participants had a “truck”-driving license (category C under the European driving license system) and had had it for 19.1 years on average (SD = 8.79). Seven very seldom drove a vehicle requiring a truck-driving license (never or almost never), four drive one less then monthly, one drove one monthly, four drove such vehicles weekly and, one, daily.
The rest of the participants had at least a “regular” driving license (category B under the European driving license system). One of the participants without a truck driving license had experience driving heavy machinery that did not require a truck driving license (e.g., forklifts or excavators).
Since the experiment was conducted on simulated driving software, we also collected the participants’ experience with gaming that include ddriving some kind of a vehicle: Only five participants reported to play such games monthly and the rest played these even less frequently or never.
3.2.4. Data Collection Methods
In the study, we used a mixed-methods approach and collected both quantitative and qualitative data in the form of electronic questionnaires (background information, condition-related, and final questionnaires) and a semi-structured interview. The background information questionnaire collected the participants’ age, gender, information about theirdriving license, and their driving experience. The link to it was shared with the participants before the experiment in a confirmation email. The condition-related questionnaire consisted of two parts: subjective workload assessment via the NASA Task Load Index (TLX) [
25] and eight self-designed statements on user experience and driving-related topics (e.g., helpfulness and pleasures of the feedback and the feel of presence, control and safety).
The final questionnaire consisted of two parts and collected information about the participants’ user experience, preferences and opinions on the utilized modalities in the form of six single-choice questions and eight statements using a 7-point Likert scale. The concrete statements of condition-related and overall questionnaire data are presented in the Results section.
The interview consisted of 19 questions divided into three topics: general user experience, the feel of driving and how to improve it, and system design related questions. These interviews were conducted by two researchers, and the language used was either English or Finnish. All interviews were recorded and later analysed by two researchers independently. For content analysis, methodology by Krippendorf [
26] was utilized. For example, keywords were counted and further analysis on the context was conducted when necessary. Both researchers analysed the content independently, and they were later compared for discrepancies.
In addition, objective data was collected by the system during the study procedure. The system logged all user actions during the slipping events, and the location of the vehicle in relation to the road, to evaluate the driving style of the participants.
4. Results
This section describes the results of the experiment, firstly presenting overall user experience and the participants’ preferences for the modalities based on final questionnaire results. Next, statistical analysis of condition-related questionnaire is presented, followed by the interview results. The section concludes with the results of the objective metrics.
4.1. Overall User Experiences and Subjective Preferences
The final survey results are visualized on
Figure 4 and
Figure 5. The section on overall user experience (
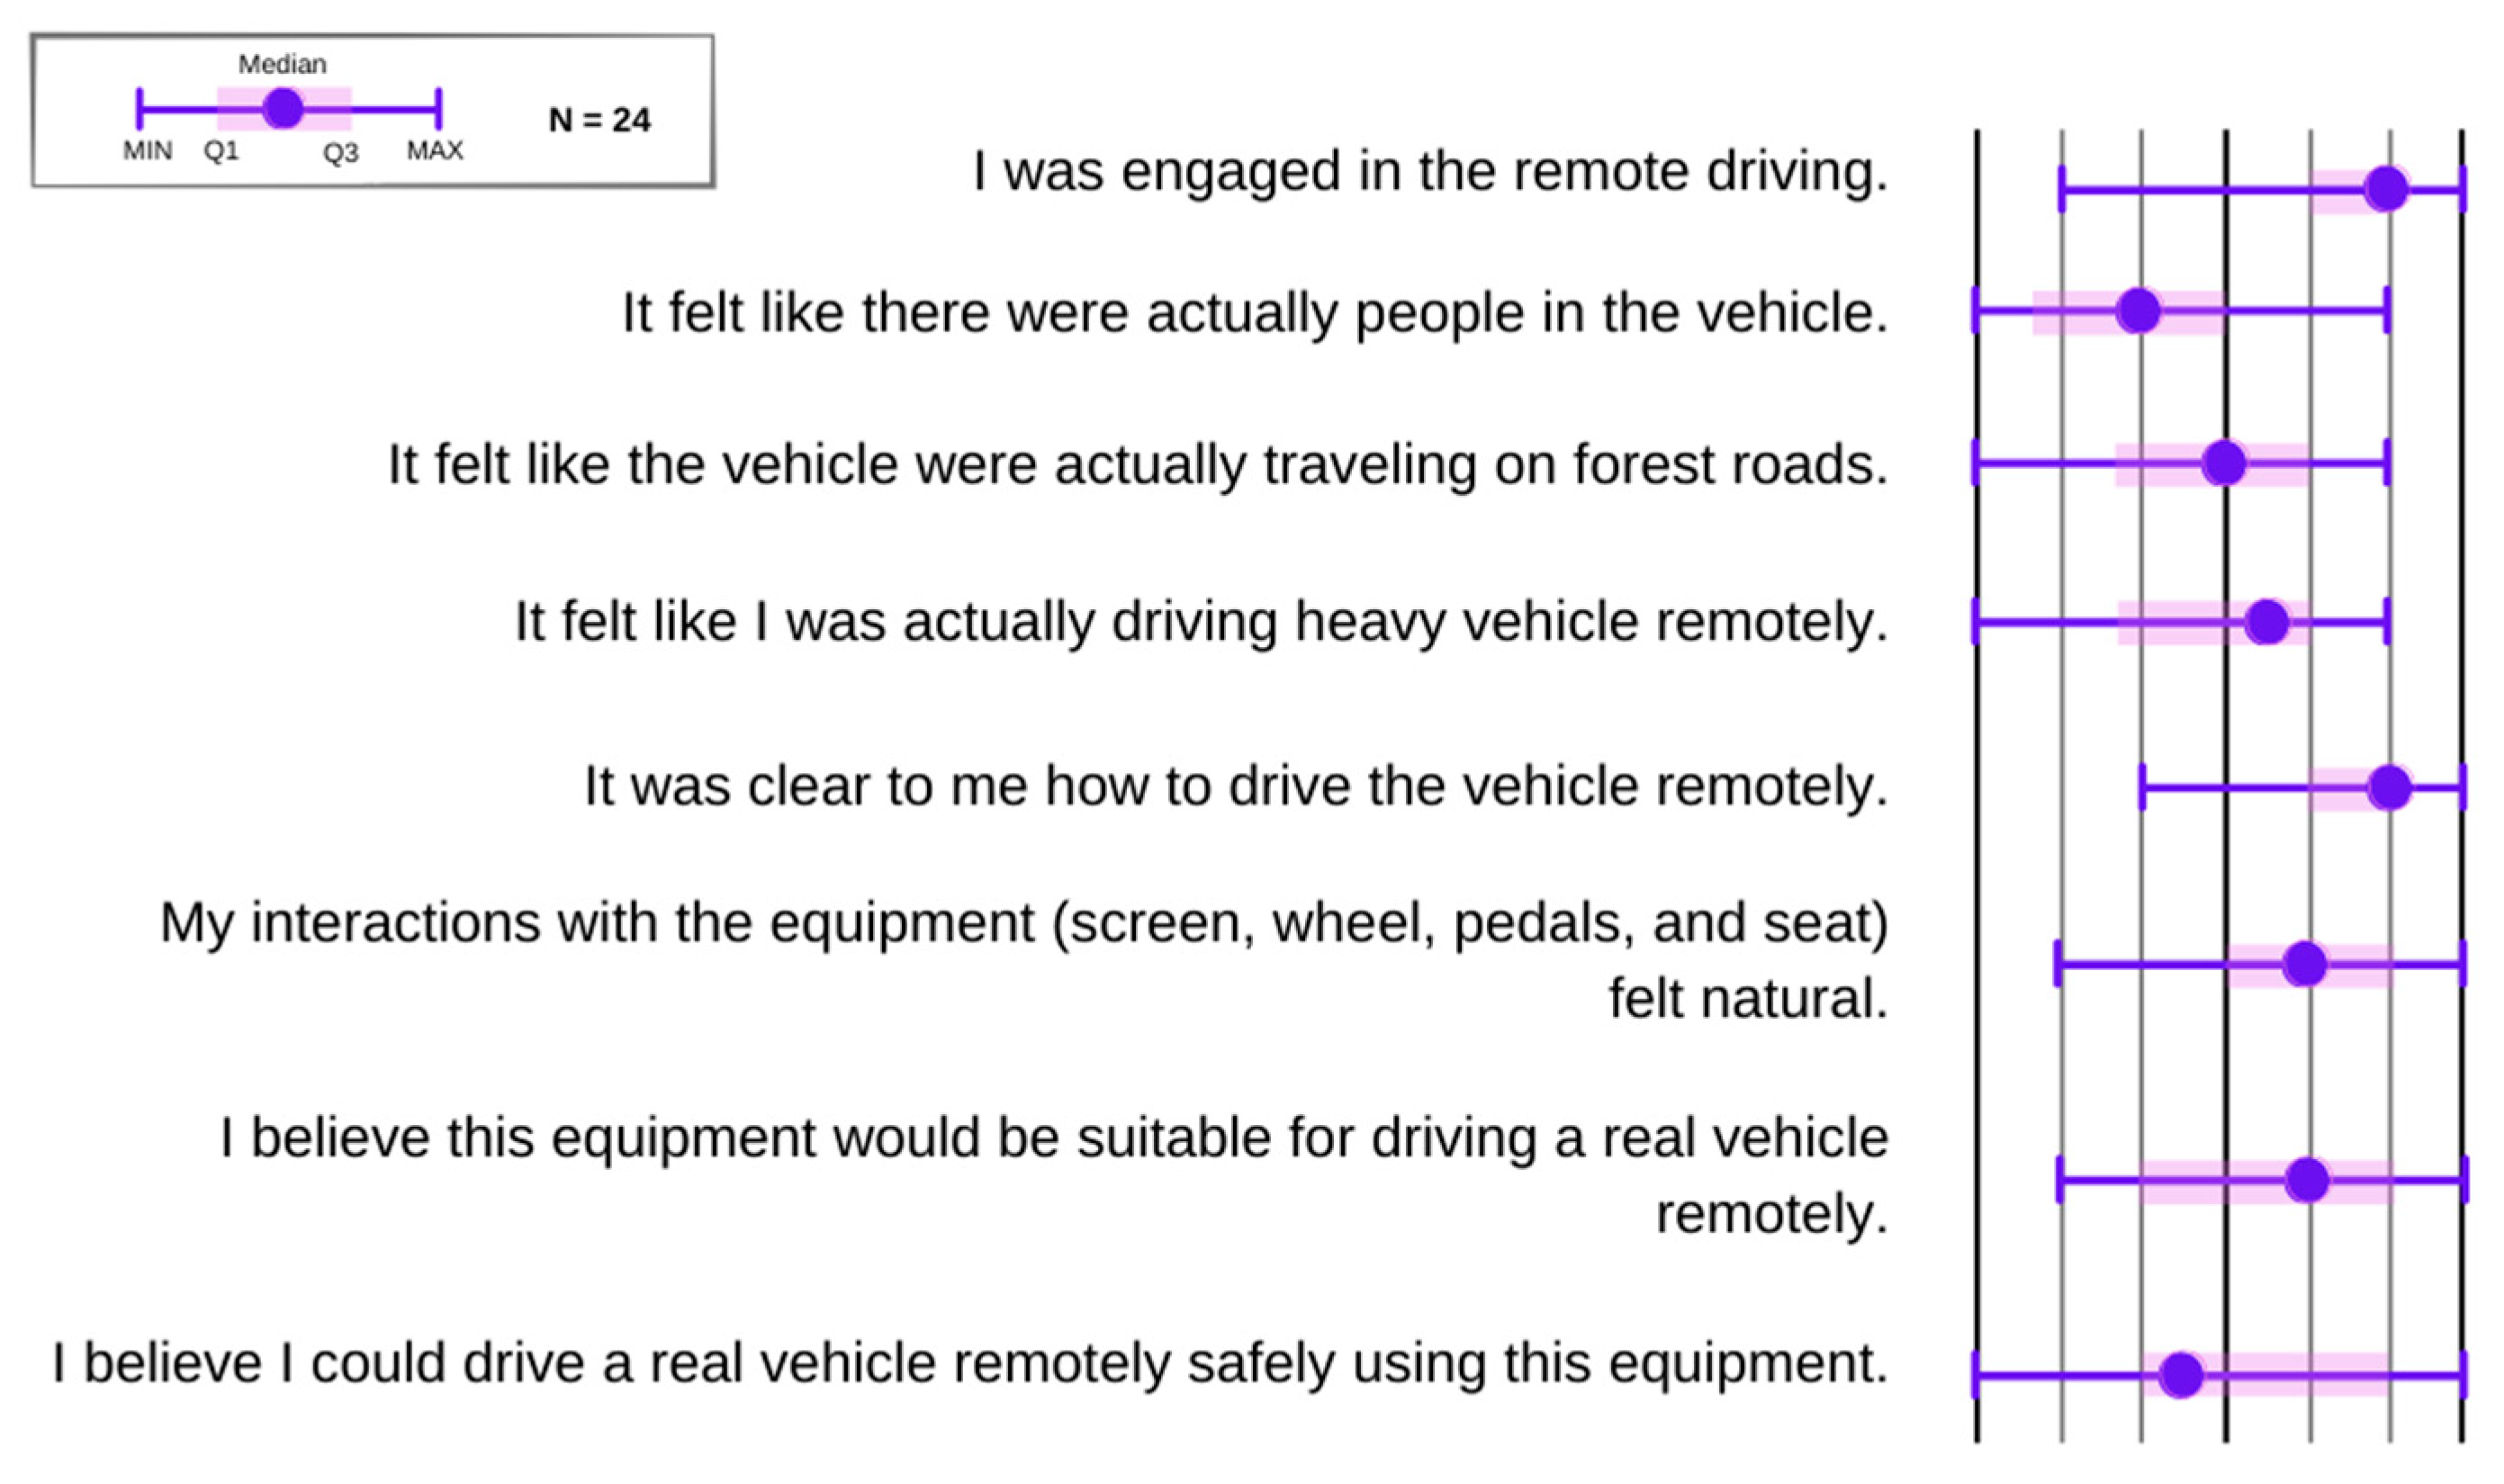
Figure 4) showed that the system design was sufficient to simulate the driving task. The majority of the participants (
n = 23) felt engaged in the remote driving task (Mdn = 6) and found it clear (
n = 22) how to drive the vehicles remotely (Mdn = 6). More than half of the participants (15) agreed that interaction with the system’s equipment felt natural, five disagreed (Mdn = 5). Nevertheless, the participants could not fully engage in the simulated scenario of the driving task: twelve participants agreed and eleven disagreed that they felt like actually driving a heavy vehicle remotely (Mdn = 4.5) Further, nine agreed and eleven disagreed that they felt like actually driving over the forest road (Mdn = 4); whereas, only two people felt like they were evacuating people; the rest were neutral or disagreed to the statement (Mdn = 3).
Further, the results demonstrated that although the deployed equipment was perceived as somewhat suitable for driving a real vehicle remotely (Mdn = 5), half of the participants found this set-up not to be a safe option for real-life case (Mdn = 3.5). They shared, in the interview, their concerns and suggestions on how to increase the feel of driving and consequentially increase safety.
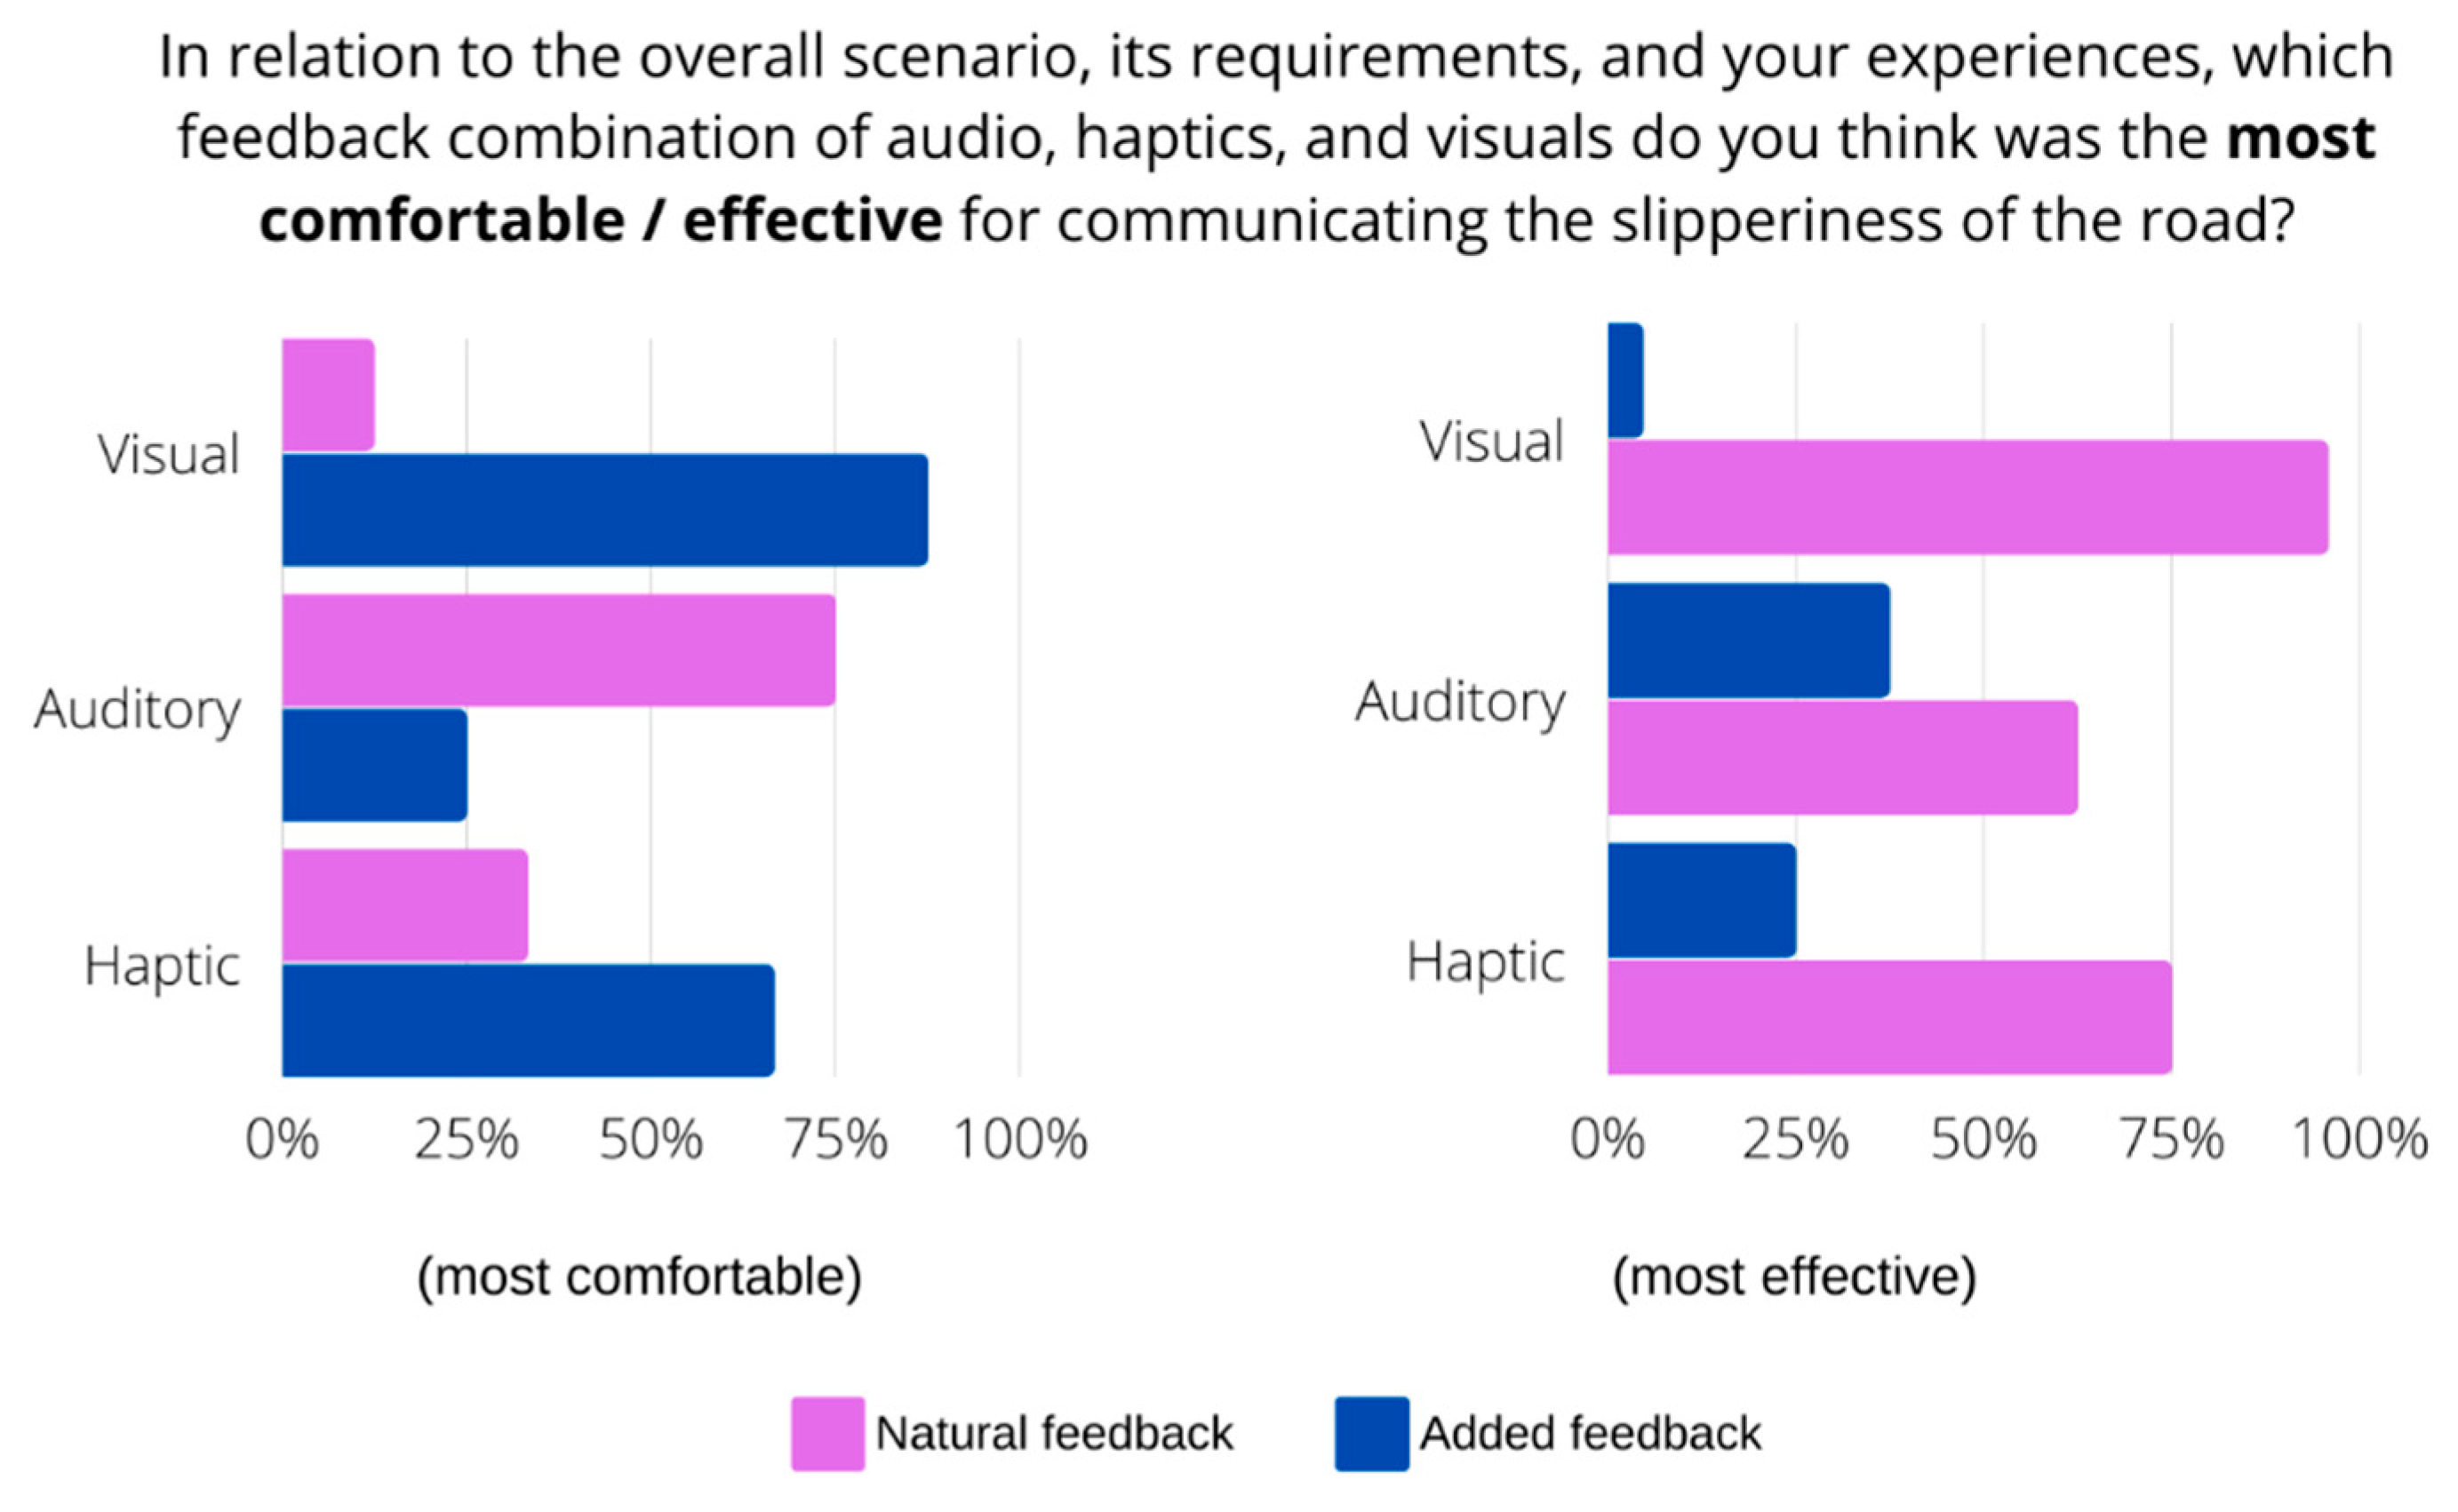
As for subjective preferences (
Figure 5) when comparing natural and added feedback per modality, added visual feedback was found to be the most comfortable (87.5%) and effective (95.83%) for communicating the slipperiness of the road. Added haptic feedback was also preferred by the majority: 66.67% found it to be the most comfortable and 75% found it the most effective. Further, 75% of the participants found natural audio feedback to be the most comfortable for communicating slipperiness, whereas added audio feedback was found to be the most effective (62.5%).
4.2. Condition Experiences
To find out whether various combinations of natural and added feedback influenced workload and awareness of slippery roads while driving, we investigated if there were statistically significant differences in subjective ratings on condition-related questions. Since the data was based on several repeated measures and was collected on ordinal scale, thus, not being normally distributed, a non-parametric Friedman’s test was used to compare the condition results.
Figure 6 shows how the participants evaluated the dimensions of subjective workload and the NASA Task Load Index ratings per condition. The figure indicates that added audio feedback alone (condition 5 AA-nh-nv) was in general evaluated more negatively then the rest of the conditions, causing higher levels of mental, physical, and temporal demand for the driving task. Moreover, added audio feedback was found to be less efficient, even in comparison with the baseline condition (1 na-nh-nv). This may be partly explained with the choice of tone, which was found to be unpleasant. Nevertheless, statistically significant (
p < 0.05) differences between the conditions were found only on the frustration subscale: added audio feedback alone (5_AA-nh-nv; Mdn = 8) raised frustration levels compared to conditions with added visual feedback alone (2_na-nh-AV; Mdn = 4) and with added haptic and visual feedback (4_na-AH-AV; Mdn = 4).
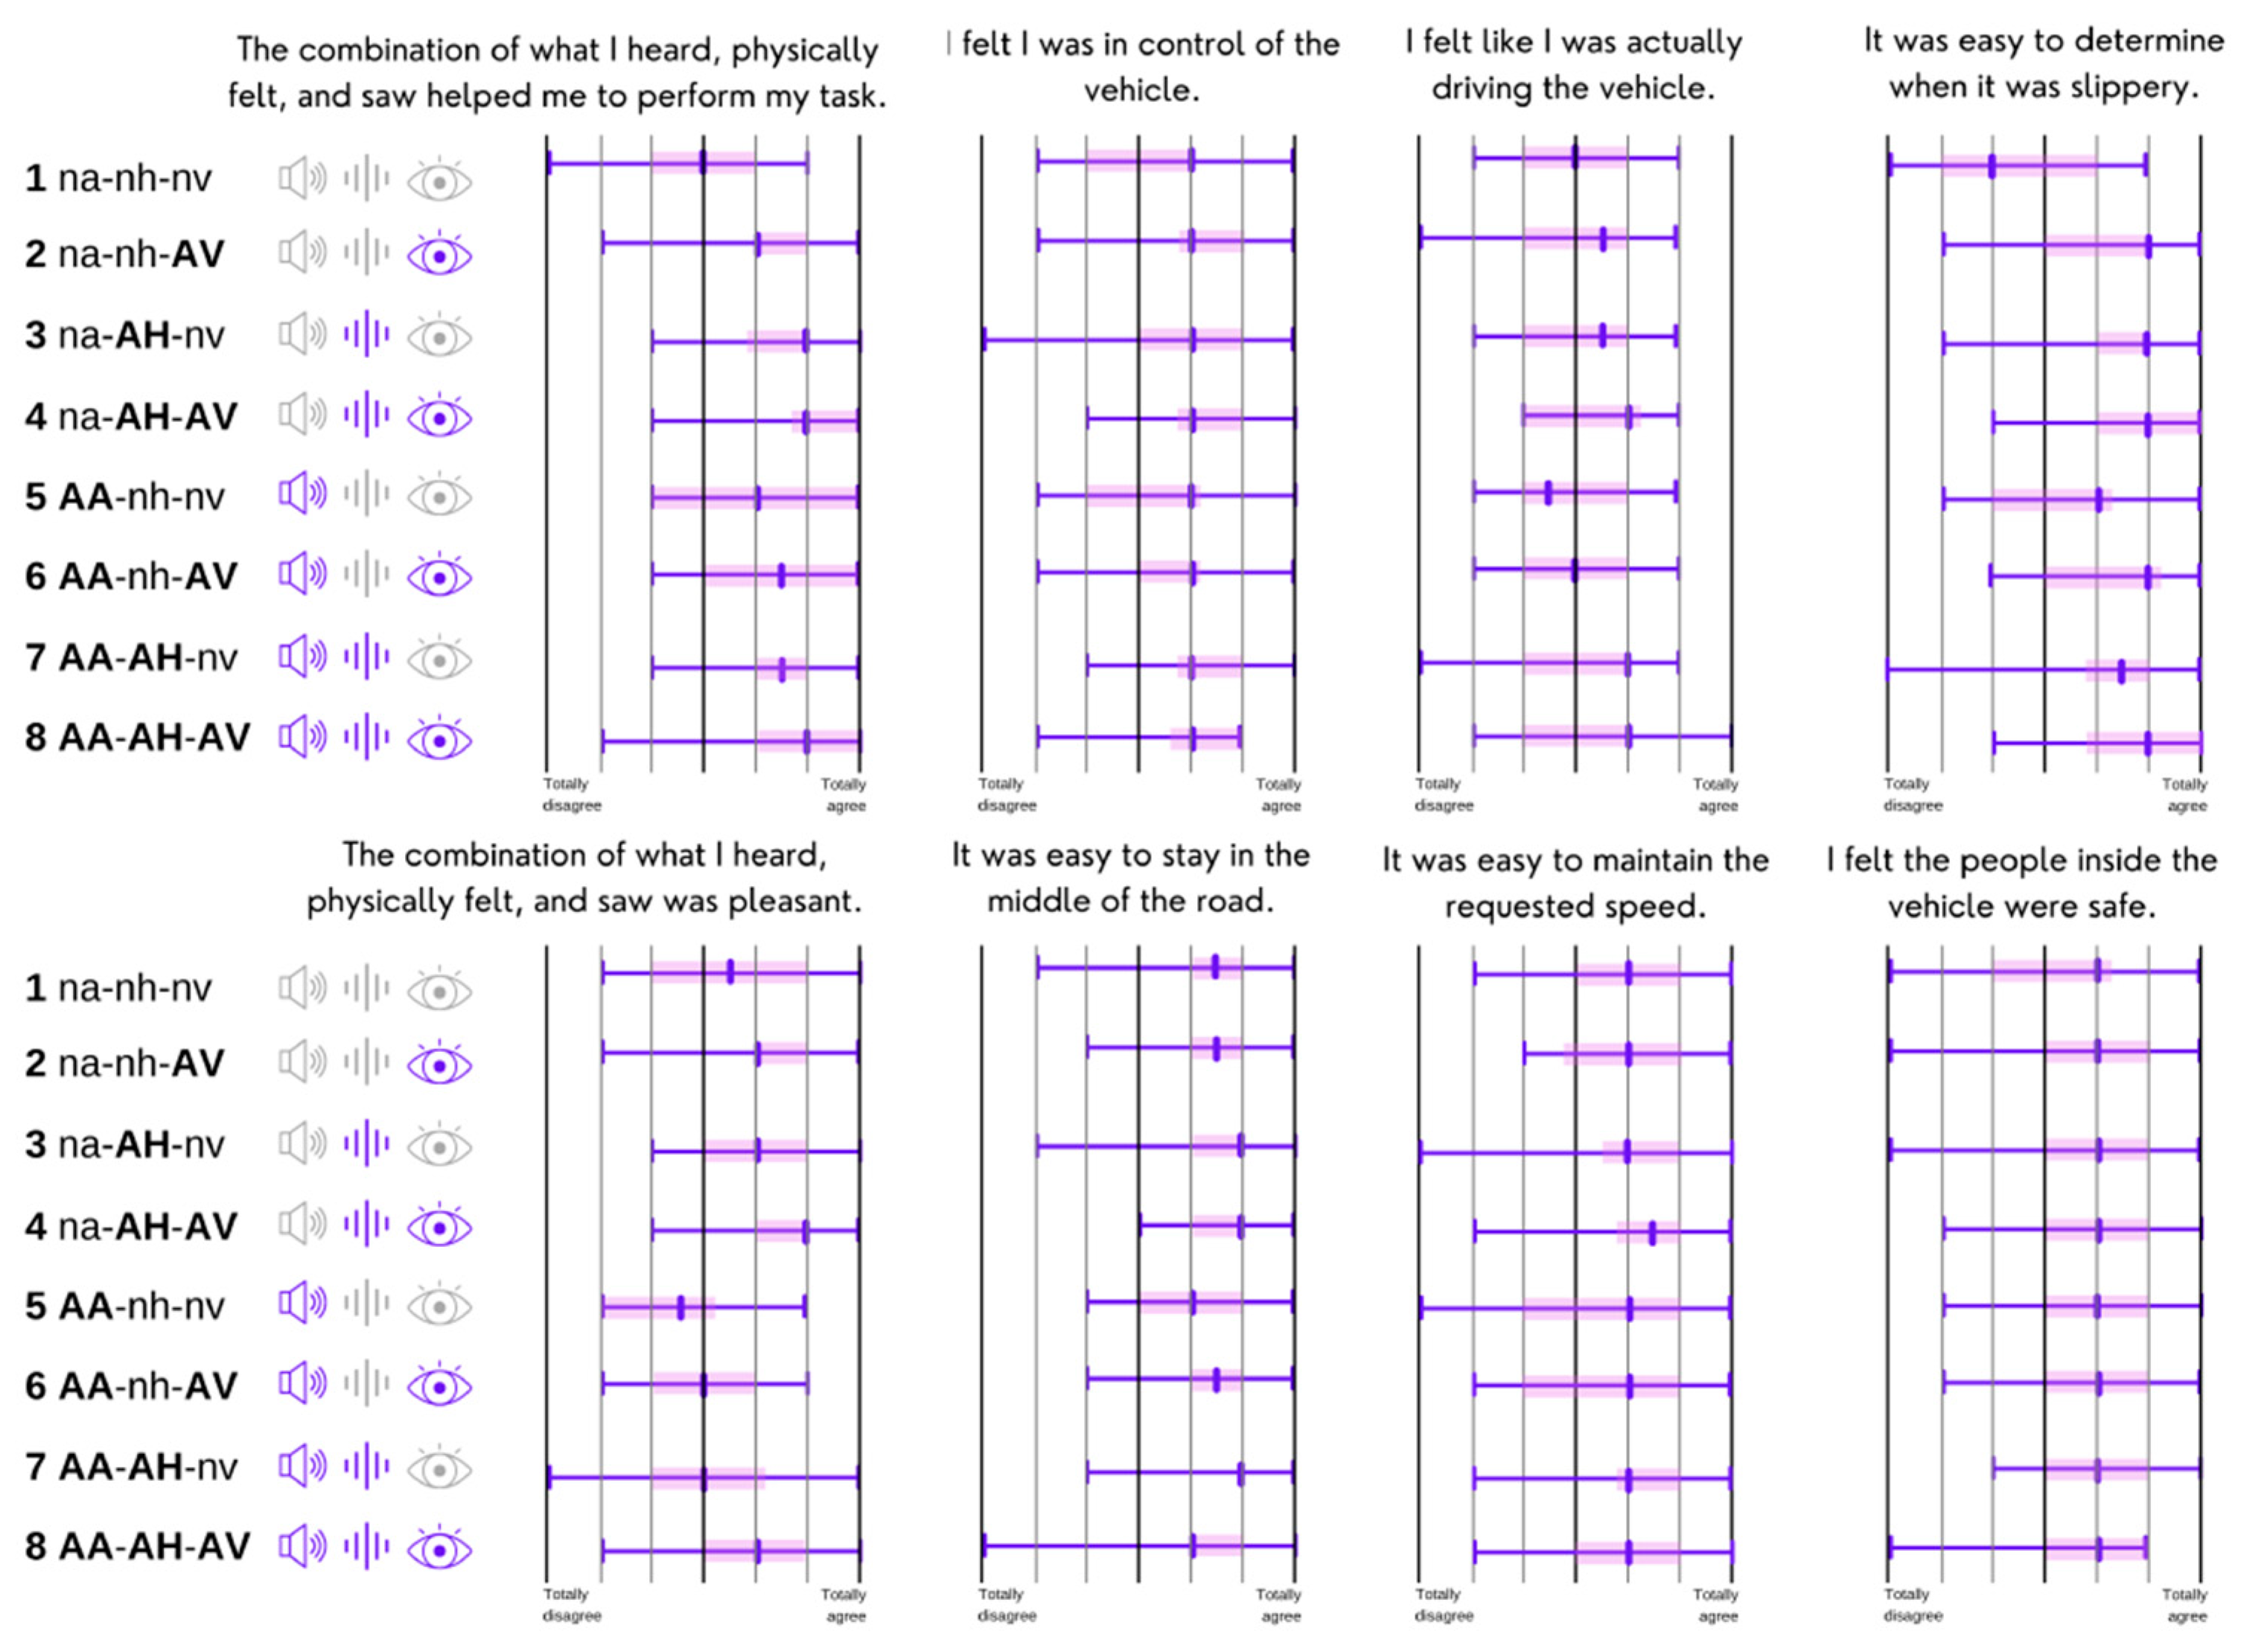
Additionally, the custom user-experience statements, defined specifically to address the research goals, revealed more statistically significant (
p < 0.05) differences between the conditions (
Figure 7).
Hence, the statement “It was easy to determine when it was slippery” revealed three statistically significant pairs. In comparison to the baseline condition with only natural feedback, the combinations of added haptic and visual feedback (condition 4—na-AH-AV), added audio and visual (condition 6—AA-nh-AV) and all three added modalities (condition 8—AA-AH-AV) were statistically significant to determine slippery places when driving.
Further, the statement “The combination of what I heard, physically felt, and saw helped me to perform my task” revealed seven statistically significant pairs. When comparing to the baseline condition, the use of added haptic feedback alone (condition 3—na-AH-nv) or in combination with added visual feedback (condition 4—na-AH-AV) or added audio feedback (condition 7—AA-AH-nv) positively affected the participants’ performance in a driving task. In addition, the combination of added audio and visual feedback (condition 6—AA-nh-AV), as well as the combination of all added modalities (condition 8—AA-AH-AV), were statistically significant over baseline (condition 1). Further, pairwise comparison revealed significant differences in performance between added audio feedback (condition 5—AA-nh-nv) and the combination of added haptic and visual feedback (condition 4—na-AH-AV), as well as the combination of all added feedback modalities (condition 8—AA-AH-AV).
Finally, the statement “The combination of what I heard, physically felt, and saw was pleasant” revealed six statistically significant pairs. As follows, the combination of added haptic and visual feedback (condition 4—na-AH-AV) was considered to be significantly pleasant over condition 1, as well as over added audio feedback (condition 5—AA-nh-nv), added visual feedback (condition 2—na-nh-AV), the combination of added audio and visual feedback (condition 6—AA-nh-AV) and the combination of added audio and haptic feedback (condition 7—AA-AH-nv). Further, added visual feedback (condition 2—na-nh-AV) and added haptic feedback (condition 3—na-AH-nv) were found to be significantly more pleasant than added audio feedback alone (condition 5—AA-nh-nv).
4.3. Interviews
To get more detailed feedback on the conditions, we also conducted a more in-depth interview with each participant. In this interview, we asked the questions of three different topics: general user experience, the feel of driving and how to improve it, and system design-related questions. We conducted an inductive content analysis [
27] with two researchers, where applicable, in order to detect common themes and trends among the participants.
Regarding the multimodal warning feedback, 63% of the participants liked the added haptic feedback, and only 4% disliked it. Regarding added visual feedback, 42% liked it and 8% disliked it. Finally, 21% of the participants liked the added audio feedback, and 58% disliked it. Only 13% of participants did not like any of the added feedback modalities. More specifically, one participant stated that, “The sound was very annoying. But I guess they’re supposed to be annoying,” (male, +30 years of experience operating heavy machinery).
Regarding added haptic feedback, one participant declared that, “I liked the vibration... but in a real situation it would be very difficult to distinguish it from the vibrations you feel inside a car,” (male, several years of experience in operating heavy machinery).
When asked how the experience differs from real driving, the participants mostly spoke about the lack of the feeling you have when you are actually operating a vehicle. One participant stated that, “It doesn’t feel like I’m driving a real vehicle. I don’t feel the force when I’m driving uphill or downhill, and it doesn’t feel like there is any weight on the vehicle.” (male, several years of experience operating heavy machinery).
Another participant declared that:
“It’s really important to feel the speed and movement. It doesn’t really tell me how fast I’m really going or how fast I could be going. And all the turns too. It’s so different from a real car. […] I should have more information on what is going on. At least if there’s people involved. It doesn’t feel like I’m there myself.”.
(male, +30 years of experience operating heavy machinery).
Also, one participant, who was one of the more experienced operators, emphasized the importance of the soundscape from the real environment (both vehicle and the surroundings), “Sound [from the vehicle] tells you a lot about what’s going on. Especially if there’s a problem, the sound tells you a lot. […] When you are making a forest machine or an excavator simulator, the soundscape needs to be authentic.” (male, several years of experience in operating farming machinery).
When asked what type of information could be delivered to the operator by using multimodal feedback, 80% of the participants stated that they could be used to convey information about the surrounding environment, including people/pedestrians, animals, bumps on the road, etc. Further, 21% of the participants said that they would increase the field of view of the screen, and one participant even said that the view should consist of 360 degrees of the surroundings. Of the participants, 33% would operate a real vehicle with the tested system, and 46% would operate it conditionally (e.g., with improved ergonomics, without real load and/or people on board, on a quiet forest road), and 21% of the participants would not operate a real vehicle with the system provided. It is worth noting, that all participants who claimed that they would not operate a real machine with this interface were relatively inexperienced drivers of heavy machinery.
4.4. Objective Data
Changes in the position of the wheel and pedals were logged by the system throughout the duration of the session, and events were logged when the vehicle entered, and exited a slippery area and when feedback was activated and deactivated. Using this data, it is possible to examine the effect of the three feedback modalities on driving behavior; we hypothesized that participants would react more often by braking or easing the gas pedal when the feedback was active. Because our participants rarely used the brake pedal and the gas pedal is typically eased when braking as well, we focused on events of significant gas pedal-easing only.
A Savitzky–Golay filter [
28], of polynomial order two, was applied to the gas pedal signal, ranging between zero and one, to estimate the speed of gas pedal movement. A peak-finding function [
29] was applied to the estimated derivative to detect peaks with a minimum height and prominence of 0.1. Only peaks during the first 2 s of a slipping event, where the slipping event lasted at least 0.5 s, were considered. The value of 0.1 was decided on before any further analysis was done, as a compromise between detection sensitivity and reducing spurious detections. If a peak was found while the vehicle was inside a slippery area, the participant was considered to have reacted by easing the gas pedal.
Mixed effects logistic regression was used to model the binary outcome variable of whether (or not) the participant reacted while in a slippery area. This type of model is indicated, because our dependent variable is non-normally distributed and has a dependency structure where observations within-participant are related [
30]. A total of three binary predictor variables were used, representing whether each of the three feedback modalities were enabled or disabled during a condition. The level of feedback (1st or 2nd level) was not considered. A participant-level random intercept was added, in accordance with our within-subjects design.
Table 2 shows the estimated log-odds ratios for added audio, haptic, and visual feedback, including their interactions. The estimates display an increase in the odds of a gas pedal reaction over the baseline condition (no added feedback of any type). These results indicate that audio or visual feedback increased the probability of gas pedal-easing with similar effect, and added haptic feedback showed a lesser, but still significant degree of influence. The parameter estimates for interactions (indicated with a colon) are not statistically significant at the 0.05 level but are included for completeness. The participant-level random intercept had a standard deviation of 0.387.
As seen in
Table 3, the probability of a gas pedal reaction during a slip event when no added feedback is active is approximately 0.29. The probability increases to 0.45 when audio feedback is added, to 0.41 when haptic feedback is added, and to 0.45 when visual feedback is added. Probabilities for conditions with multiple modalities active are included in
Table 3, although there is considerable uncertainty in the parameter estimates for interactions between different feedback modalities.
5. Discussion
In this study, we investigated the use of multimodal feedback combinations to communicate road condition (slipperiness) when driving a vehicle remotely. Since maintaining situational awareness about a driving environment and a vehicle’s state is a critical factor affecting the safety and success of remote operation, the selection of feedback channels should be done with care. Previous work from Benz and Nitsch [
6] suggested that utilizing all modalities together may not only confer no positive effect on driver’s performance, but, on the contrary, may decrease the quality of communicated information. To explore what combinations of multimodal feedback would beneficially affect situational awareness and behavior when driving remotely, we simulated the process of driving a heavy vehicle over a forest road and tested “natural” and “added” feedback in within-subject study with 24 participants.
5.1. Multimodal Feedback Combinations
The subjective results demonstrate that the simulated remote driving system was suitable to evaluate the use of multimodal feedback, since most of the participants felt engaged in a driving task and found no issues in controlling a virtual vehicle. Therefore, our findings can be generalized to real-life remote driving situations.
In correlation with the previous work of Benz and Nitsch [
23], subjective responses from our study revealed no significant positive effects on task performance when utilizing added visual, haptic, and audio modalities together when compared with other modality combinations. The combination of all three modalities significantly helped to perform in the driving task when compared with added audio feedback alone. However, our findings from subjective data also demonstrate that the combination of added visual and haptic modalities significantly influenced performance in the driving task, compared with added audio feedback alone, which means that, subjectively, the use of audio feedback alone is insufficient to positively affect situational awareness. This further indicates that the use of audio feedback on top of haptics and visuals brings no added value for remote operator, whereas auditory feedback can be significantly enhanced or even replaced with the combination of visual and haptic modalities to generate positive effects.
Furthermore, our results demonstrate significant difference in utilizing all three modalities as compared with the combinations of (1) visual and haptic modalities and (2) visual and audio modalities, over baseline conditions, when determining the slipperiness of the road. Moreover, objective data analysis supported subjective findings and showed the increased probability of gas pedal reaction when utilizing three modalities together (0.58) and the same multimodal combinations: visual and haptic (0.49) and visual and audio (0.47). Garcia et al. [
6] discussed the role of human factors, and pointed that warning interpretation time is a critical factor in remote operation. Therefore, based on our findings it can be assumed that use of the visual modality, supported by another modality (or combination of these,) would constitute a successful warning to communicate the slipperiness of roads. It obtains because a visual identification communicates the nature of a warning, whereas haptic or audio affects the users’ reaction time. Nevertheless, although these combinations (visual and haptic and/or audio) showed lower mental demand in subjective workload ratings, they did not reach statistical difference when compared with baseline conditions. Sigrist et al. [
31] conducted an extensive review on multimodal feedback in motor training, and their results on the subject were inconclusive, mostly due to the complexity of the learning process. One should also take into account the novelty of multimodal feedback—it might take some time for the user to get accustomed to the new type of stimuli they are experiencing.
Further, participants reported that using the added haptic modality alone, or in combination with audio or visual modalities, significantly helped in driving task when compared with a baseline condition (all natural feedback), that correlates with previous findings [
14,
22]. Nevertheless, objective data revealed that added haptic feedback alone has the least probability of producing a gas pedal reaction, when compared with other added single-modality feedback. This can be explained by the fact that haptic feedback may be hard to distinguish from natural forces that affect the vehicle, although these forces were only simulated in our study. Objective data also indicated that the combination of haptic and visual added feedback had the highest probability of producing a gas pedal reaction compared with the other two-modality conditions. Furthermore, subjective results showed that this combination was significantly more pleasant when compared with baseline conditions or with added audio feedback alone.
As for RQ1 (on optimal multimodal warning), this finding indicates that the visual presentation of a warning, supported with haptic feedback, seems to be the most suitable multimodal warning for communicating the slipperiness of a road. This finding correlates with the work by Lindemann et al. [
15], which demonstrated that the visual modality alone is sufficient to communicate warning information, whereas the haptic modality is used to draw attention to visually communicated information.
Further, our findings reveal that selected added audio warnings significantly increase the level of frustration when driving remotely compared with visual feedback and to the combination of visual and haptic feedback (partly answering RQ2). Based on subjective qualitative and quantitative data, the selected audio warning was found to be unpleasant, which may partly explain the raised frustration levels. This finding is in line with previous work from the automotive vehicle context [
20,
22], where auditory messages were found to be the most annoying and urgent types of warning [
20] and a less appreciated warning type [
22]. Furthermore, subjective feedback showed that the participants prefer to use natural audio rather than added audio for warnings. Nevertheless, the fact that no significance difference in frustration was found in conditions where audio feedback was used in combination with other modalities demonstrated that, when supported with other cues, unpleasant audio feedback did not significantly affect frustration levels. Therefore, the increased frustration from audio feedback alone may explain the lack of clarity in communicated information, e.g., it affects the remote driver’s reaction time, but not their situational awareness per se. This indication harmonizes with the work by Lindemann et al. [
15], who propose to use auditory feedback to support visual cues.
In summary, based on our findings and previous work we suggest utilizing the combination of visual and haptic modalities to deliver warning messages to the driver, whereas auditory feedback can be added on top of other modalities in critical and most urgent situations.
5.2. Presence in Remote Operations
When evaluating driving simulators, a sufficient level of realistic experience is necessary in order for the operators to take the given task seriously and show compliant behavior during [
12], and, in experimental scenarios, this is a requirement for the results to be generalizable [
32]. This is closely related to the sense of presence discussed in the related work. Based on our interviews, there was a clear distinction between experienced drivers and inexperienced drivers regarding the feeling of presence. Experienced drivers brought up this issue much more than the inexperienced ones, and they emphasized, especially, the importance of feeling the machinery they control.
More experienced drivers can gather a lot of insights from the sounds of the vehicle and from the surroundings, and from the forces created by activities thereof, such as throttling and braking. This brings up an interesting problem of how important it is to communicate these effects to remote operation stations of the near future. Does a high feeling of presence and realistic depiction of the forces related to the machinery affect the operation in some way? Are these features required when training new operators, who might not have any experience in operating the real vehicles? This is an issue that should be observed in future work. For this, a combination of UX measures and a measurement model of presence for driving simulators, suggested by Will [
12], could be utilized.
5.3. Limitations and Future Work
Despite our experimental findings showing significant difference between the conditions of utilizing visual, haptic, and audio modalities, these finding are relevant for specific warnings design only, which is the major limitation of the study. Despite having examined the combinations of multimodal warnings in eight conditions, we may only claim that the results are generalizable to certain attributes of multimodal warnings, e.g., the frequency of vibrotactile feedback, or overlayed animated visual warnings. Therefore, based on our findings, future studies may look into what variations of visual warning (e.g., overlay picture, flashing lights) and haptic warnings (pitch, tone, location) would best support remote driving tasks. Further, the suggested combinations of multimodal feedback may be examined in various cases (e.g., communicating slipperiness of the road vs. communicating latency issues) to identify how the context of warning affect the preferred modalities. The total number of participants in this study was also rather small, even though the procedure and data collection were quite extensive (questionnaires, interviews, log data, etc.). A larger experiment would provide better results regarding effects of age and driving experience, differences between genders, etc.
Another interesting research direction would be to study the characteristics of audio feedback for remote operations. Although most of the participants found our audio design to be frustrating, that does not mean it affected situational awareness negatively. In real-life cases, the most annoying sounds are used specifically to communicate high risk or danger. Therefore, it would be a valuable to study how various sound parameters (tone, pitch, levels) would affect reaction of remote driver, and what is the relationship between frustration and reaction speed.
6. Conclusions
We studied how multimodal feedback (visual, auditory, and haptic) can be utilized to communicate warning messages in remote operation. To examine this, we conducted a controlled, within-subjects experiment with a simulator to understand how people perceive and react to various combinations of multimodal feedback when driving remotely. During the experiment, we collected both subjective (questionnaires and semi-structured interviews) and objective metrics about multimodal warnings and participants reactions to them, and, as well, we evaluated the resulting user experience.
The deployed driving simulator was found to be suitable for evaluating multimodal feedback, since the majority of the participants were engaged in driving task and faced no issues with operating the simulated vehicle. Regarding multimodal feedback, our results show that combined multimodal feedback was helpful in performing the task, and the combination of visual and haptic cues was considered most pleasant feedback combination to support situational awareness when driving remotely. Our findings also demonstrate that added audio feedback alone raised frustration levels during the task, whereas in combination with other modalities, frustration was not significant. These results may be generalizable in other contexts where situational awareness is critical factor affecting the safety and success of operations.
The feeling of presence was also found out to be a very important aspect of remote operations. The main finding from our interviews demonstrated that more experienced heavy-machinery drivers emphasized the importance of the feeling of presence while remotely operating a vehicle and would like to receive all the natural feedback from the remote vehicle.
Author Contributions
Conceptualization, A.B, K.R., J.M., J.H., P.K. and V.M.; methodology, T.K., J.M. and A.B.; software, J.M., K.R.; validation, P.K., T.K. and J.M.; formal analysis, T.K., P.K.; investigation, P.K. and V.M.; resources, M.T.; data curation, T.K., J.M. and P.K.; writing—original draft preparation, T.K.; writing—review and editing, A.B, T.K., P.K., J.M., J.H., M.T.; visualization, A.B.; supervision, T.K., P.K.; project administration, M.T.; funding acquisition, M.T. All authors have read and agreed to the published version of the manuscript.
Funding
This research was funded by Business Finland (grant number 251/31/2018), FIMA ry (Forum for Intelligent Machines), and the research parties University of Tampere (UTA, now TUNI) and Tampere University of Technology (TUT, now TUNI).
Institutional Review Board Statement
The study was conducted according to the guidelines of the Declaration of Helsinki, and approved by the Institutional Review Board (or Ethics Committee) of Tampere University (Approved in February 2018).
Informed Consent Statement
Informed consent was obtained from all subjects involved in the study.
Data Availability Statement
All data reported in this study can be retrieved by contacting any of the corresponding authors.
Acknowledgments
We would like to extend our gratitude to everyone participating in this research.
Conflicts of Interest
The authors declare no conflict of interest. The funders had no role in the design of the study; in the collection, analyses, or interpretation of data; in the writing of the manuscript, or in the decision to publish the results.
References
- Goodall, N. Non-technological challenges for the remote operation of automated vehicles. Transp. Res. Part A Policy Pract. 2020, 142, 14–26. [Google Scholar] [CrossRef]
- Radio-Driven Auto Runs Down Escort; Wireless Directs Test Car in Wobbly Course Through Heavy Broadway. The New York Times. 1925. Available online: https://www.nytimes.com/1925/07/28/archives/radiodriven-auto-runs-down-escort-wireless-directs-test-car-in.html (accessed on 7 August 2021).
- Hainsworth, D.W. Teleoperation User Interfaces for Mining Robotics. Auton. Robot. 2001, 11, 19–28. [Google Scholar] [CrossRef]
- Gusterson, H. Drone: Remote Control Warfare; MIT Press: Cambridge, MA, USA, 2016. [Google Scholar]
- Hawkins, A.J. The First Remote-Controlled Electric Scooters Arrive at an Office Park in Georgia. 2020. Available online: https://mobility21.cmu.edu/the-first-remote-controlled-electric-scooters-arrive-at-an-office-park-in-georgia/ (accessed on 7 August 2021).
- García, J.C.; Patrão, B.; Almeida, L.; Pérez, J.; Menezes, P.; Dias, J.; Sanz, P.J. A Natural Interface for Remote Operation of Underwater Robots. IEEE Comput. Graph. Appl. 2015, 37, 34–43. [Google Scholar] [CrossRef] [PubMed] [Green Version]
- Chen, J.Y.C.; Haas, E.C.; Barnes, M.J. Human Performance Issues and User Interface Design for Teleoperated Robots. IEEE Trans. Syst. Man Cybern. Part C Appl. Rev. 2007, 37, 1231–1245. [Google Scholar] [CrossRef]
- Neumeier, S.; Wintersberger, P.; Frison, A.-K.; Becher, A.; Facchi, C.; Riener, A. Teleoperation: The holy grail to solve problems of automated driving? Sure, but latency matters. In Proceedings of the 11th International Conference on Automotive User Interfaces and Interactive Vehicular Applications, Utrecht, The Netherlands, 22–25 September 2019; pp. 186–197. [Google Scholar] [CrossRef]
- Vozar, S.; Tilbury, D.M. Driver Modeling for Teleoperation with Time Delay. IFAC Proc. Vol. 2014, 47, 3551–3556. [Google Scholar] [CrossRef]
- Ardiyok, S.; Canbeyli, A.; Skardiuze, J. European Union: Is Self-Driving Cars Still A Science Fiction? Autonomous Vehicles Legal Framework in the European Union. 2020. Available online: https://www.mondaq.com/turkey/rail-road-cycling/892782/is-self-driving-cars-still-a-science-fiction-autonomous-vehicles-legal-framework-in-the-european-union (accessed on 7 August 2021).
- Akin, D.L.; Howard, R.D.; Oliveria, J.S. Human Factors in Space Telepresence. 1983. Available online: https://ntrs.nasa.gov/citations/19840015051 (accessed on 7 August 2021).
- Will, S. Development of a Presence Model for Driving Simulators Based on Speed Perception in a Motorcycle Riding Simulator. Ph.D. Thesis, Universität Würzburg, Würzburg, Germany, 2017. [Google Scholar]
- Fong, T.W.; Conti, F.; Grange, S.; Baur, C. Novel interfaces for remote driving: Gesture, haptic, and PDA. In Mobile Robots XV and Telemanipulator and Telepresence Technologies VII; Society of Photo Optical: Bellingham, WA, USA, 2001; pp. 300–311. [Google Scholar] [CrossRef] [Green Version]
- Hosseini, A.; Lienkamp, M. Enhancing telepresence during the teleoperation of road vehicles using HMD-based mixed reality. In Proceedings of the 2016 IEEE Intelligent Vehicles Symposium (IV), Gothenburg, Sweden, 19–22 June 2016; pp. 1366–1373. [Google Scholar] [CrossRef]
- Hosseini, A.; Richthammer, F.; Lienkamp, M. Predictive Haptic Feedback for Safe Lateral Control of Teleoperated Road Vehicles in Urban Areas. In Proceedings of the 2016 IEEE 83rd Vehicular Technology Conference (VTC Spring), Nanjing, China, 15–18 May 2016; pp. 1–7. [Google Scholar] [CrossRef]
- Lindemann, P.; Lee, T.-Y.; Rigoll, G. Catch My Drift: Elevating Situation Awareness for Highly Automated Driving with an Explanatory Windshield Display User Interface. Multimodal Technol. Interact. 2018, 2, 71. [Google Scholar] [CrossRef] [Green Version]
- Park, B.-J.; Lee, J.-W.; Yoon, C.; Kim, K.-H. Augmented reality and representation in vehicle for safe driving at night. In Proceedings of the 2015 International Conference on Information and Communication Technology Convergence (ICTC), Jeju, Korea, 28–30 October 2015; pp. 1261–1263. [Google Scholar] [CrossRef]
- Chucholowski, F.E. Evaluation of Display Methods for Teleoperation of Road Vehicles. J. Unmanned Syst. Technol. 2016, 3, 80–85. [Google Scholar] [CrossRef]
- Lutz, R.R. Safe-AR: Reducing Risk while Augmenting Reality. In Proceedings of the In2018 IEEE 29th International Symposium on Software Reliability Engineering (ISSRE), Memphis, TN, USA, 15–18 October 2018; pp. 70–75. [Google Scholar] [CrossRef]
- Bazilinskyy, P.; Petermeijer, S.M.; Petrovych, V.; Dodou, D.; de Winter, J.C.F. Take-over requests in highly automated driving: A crowdsourcing survey on auditory, vibrotactile, and visual displays. Transp. Res. Part F Traffic Psychol. Behav. 2018, 56, 82–98. [Google Scholar] [CrossRef]
- Bazilinskyy, P.; de Winter, J. Auditory interfaces in automated driving: An international survey. PeerJ Comput. Sci. 2015, 1, e13. [Google Scholar] [CrossRef] [Green Version]
- Adell, E.; Varhelyi, A.; Fontana, M.D.; Bruel, L. Test of HMI Alternatives for Driver Support to Keep Safe Speed and Safe Distance—A Simulator Study. Open Transp. J. 2008, 2, 53–64. [Google Scholar] [CrossRef]
- Benz, T.M.; Nitsch, V. Using multisensory cues for direction information in teleoperation: More is not always better. In Proceedings of the 2017 IEEE International Conference on Robotics and Automation (ICRA), Singapore, 29 May–3 June 2017; pp. 6541–6546. [Google Scholar] [CrossRef]
- National Land Survey of Finland. Elevation Model 2 m 03/2019. Available online: https://www.maanmittauslaitos.fi/en/maps-and-spatial-data/expert-users/product-descriptions/elevation-model-2-m (accessed on 28 April 2021).
- Hart, S.G.; Staveland, L.E. Development of NASA-TLX (Task Load Index): Results of Empirical and Theoretical Research. In Advances in Psychology; Elsevier: Amsterdam, The Netherlands, 1988; pp. 139–183. [Google Scholar]
- Krippendorf, K. Content Analysis: An Introduction to Its Methodology, 4th ed.; Sage Publications: Thousand Oaks, CA, USA, 2019. [Google Scholar]
- Zhang, Y.; Wildemuth, B. Qualitative Analysis of Content. Available online: https://www.ischool.utexas.edu/~yanz/Content_analysis.pdf (accessed on 10 December 2020).
- Savitzky, A.; Golay, M.J.E. Smoothing and Differentiation of Data by Simplified Least Squares Procedures. Anal. Chem. 1964, 36, 1627–1639. [Google Scholar] [CrossRef]
- Virtanen, P.; Gommers, R.; Oliphant, T.E.; Haberland, M.; Reddy, T.; Cournapeau, D.; Burovski, E.; Peterson, P.; Weckesser, W.; Bright, J.; et al. SciPy 1.0: Fundamental algorithms for scientific computing in Python. Nat. Methods 2020, 17, 261–272. [Google Scholar] [CrossRef] [PubMed] [Green Version]
- Kaptein, M. Using Generalized Linear (Mixed) Models in HCI. In Modern Statistical Methods for HCI; Springer: Cham, Switzerland, 2016; pp. 251–274. [Google Scholar]
- Sigrist, R.; Rauter, G.; Riener, R.; Wolf, P. Augmented visual, auditory, haptic, and multimodal feedback in motor learning: A review. Psychon. Bull. Rev. 2013, 20, 21–53. [Google Scholar] [CrossRef] [PubMed] [Green Version]
- Cossalter, V.; Lot, R.; Massaro, M.; Sartori, R. Development and validation of an advanced motorcycle riding simulator. Proc. Inst. Mech. Eng. Part D J. Automob. Eng. 2011, 225, 705–720. [Google Scholar] [CrossRef]
| Publisher’s Note: MDPI stays neutral with regard to jurisdictional claims in published maps and institutional affiliations. |
© 2021 by the authors. Licensee MDPI, Basel, Switzerland. This article is an open access article distributed under the terms and conditions of the Creative Commons Attribution (CC BY) license (https://creativecommons.org/licenses/by/4.0/).


 ,
, 


