
Narrative Visualization with Augmented Reality


Department of Communication and Art, Research Institute for Design, Media and Culture [ID+] University Campus of Santiago, Aveiro University, 3810-193 Aveiro, Portugal
*
Author to whom correspondence should be addressed.
Multimodal Technol. Interact. 2022, 6(12), 105; https://0-doi-org.brum.beds.ac.uk/10.3390/mti6120105
Submission received: 24 October 2022
/
Revised: 22 November 2022
/
Accepted: 24 November 2022
/
Published: 26 November 2022
(This article belongs to the Special Issue Virtual Reality and Augmented Reality)
Abstract
:The following study addresses, from a design perspective, narrative visualization using augmented reality (AR) in real physical spaces, and specifically in spaces with no semantic relation with the represented data. We intend to identify the aspects augmented reality adds, as narrative possibilities, to data visualization. Particularly, we seek to identify the aspects augmented reality introduces regarding the three dimensions of narrative visualization—view, focus and sequence. For this purpose, we adopted a comparative analysis of a set of fifty case studies, specifically, narrative visualizations using augmented reality from a journalistic scope, where narrative is a key feature. Despite the strong explanatory character that characterizes the set of analyzed cases, which sometimes limits the user’s agency, there is a strong interactive factor. It was found that augmented reality can expand the narrative possibilities in the three dimensions mentioned—view, focus and sequence—but especially regarding visual strategies where simulation plays an essential role. As a visual strategy, simulation can provide the context for communication or be the object of communication itself, as a replica.
1. Introduction
This study stands at the intersection of three fields—data visualization, narrative and augmented reality. In this context, the term ‘narrative’ is employed as defined by Bach et al., distinguishing between story and narrative: “the story is the facts—the data—including characters, places, times, and actions important to the specific plot. A narrative can be described as the ‘telling’ of a sequence of those events […] [which] shape the events, characters, arrangement of time, etc. in very particular ways to invite particular positions towards the story on the part of the audience.” [1] (pp. 108–109). Although narrative visualization has been a popular topic in data visualization since the contributions of Segel and Heer [2] and Kosara and MacKinlay [3], specific research on narrative visualization using AR is still insufficiently documented. In the AR field, Azuma [4] sees storytelling as one of the most important ways of using mixed realities. Nevertheless, there is still a severe scarcity of theoretical references on narrative visualization with AR [5]. Some adjacent areas address relevant information, without, however, intersecting the three identified areas. Immersive Analytics [6], for instance, involves the study of data visualization with augmented reality where there is no semantic connection to space, but does not delve into the issues linked to the narrative purpose. In the journalism field, since 2016, the set of ‘experiments’ around narrative visualization with augmented reality has been gradually increasing and studied in areas such as immersive journalism [5] and spatial journalism [7]. However, despite both areas dealing with the representation of data in a hybrid environment (a hybrid environment results from the combination of the real and virtual environments), they approach the topic from a journalistic point of view and not so much from a design perspective, this being our main purpose.
When addressing the narrative component, it was initially considered that it could be brought to this study from any area traditionally linked to the narrative purpose; for example, cinema, theatre or illustration. However, augmented reality directed the chosen area according to its own characteristics as a medium, namely, inherent interactivity—one of its most important features. Journalism was chosen as a field of observation since it simultaneously incorporates narrative and interaction, offering vast case studies that can be analyzed through the lens of design.
Within the context of design, there is a lack of critical reflection on the aspects that AR adds as narrative possibilities to data visualization. In fact, design has not yet sufficiently addressed AR in data representation, recognizing all its advantages and limitations when communicating a story. Therefore, our research question is: “What specific qualities can AR introduce into each of the dimensions of narrative visualization defined by Thudt et al. [8]—view, focus and sequence?”. The selection of this classification model also comes from the fact that it integrates interactivity and narrative, rather than opposing them, which is fundamental when dealing with narrative visualization using AR. This topic is further developed in the literature review in Section 2.
For AR to be used as an expressive medium, such as typography or illustration (among others), there must be an appropriation of this medium by design. From that standpoint, it is essential to recognize the new semantic possibilities that AR introduces into the way of telling a story, to fully leverage the medium and make communication as effective as possible. By intersecting data visualization, narrative and AR, this study seeks the necessary fit between the medium (AR) and the narrative content, aiming to contribute to providing designers with a greater knowledge on the impact of AR in shaping a data-driven narrative. Through the identification and description of the possibilities brought by AR to narrative visualization, we also intend to contribute to address some of the current scarcity of critical reflection around this topic. The relevance and actuality of this theme is evident in the incorporation of AR in the applications of prominent newspapers such as the New York Times, Washington Post, USA Today and Quartz, among others, but also in the creation of research and development departments dedicated to the study of narrative with mixed realities, for example, the New York Times Research and Development (https://rd.nytimes.com/ (accessed on 23 November 2022)); the Emerging Tech Team, from USA Today (https://marketing.usatoday.com/innovation/ (accessed on 23 November 2022); and the LEDE Lab, from Washington Post (https://www.washingtonpost.com/graphics/lede-lab/ (accessed on 23 November 2022).
2. Literature Review
Interactivity is an essential characteristic of digital media [9], and specifically of AR, both from a technological point of view [10] and from a media studies point of view [11]. In mobile AR, MacIntyre et al. [12] note that since the user is in the physical space being augmented, personal augmented reality systems are inherently interactive; even when the content is non-interactive, the user implicitly interacts with the physical space. The topic of narrative in interactive systems leads to a discussion known as the narrative paradox or interaction dilemma that deals with the conflict between the interactor’s freedom of choice (interactivity) and the author’s control over the story (narrative). This theoretical discussion occurs in any area requiring the integration of narrative and interaction, but is traditionally linked to game studies, narratology and interactive digital narratives. Liestøl addresses this paradox regarding storytelling with AR, stating, “One wants to leave considerable control to the user, but at the same time, the author/director/designer loses command of the storyline and how it is read or acquired by the user” [13].
In data visualization, the integration between interactivity and narrative is addressed by Segel and Heer [2] who propose a continuum opposing the author-driven approach to a reader-driven approach. The author-driven approach follows a linear path, conveys a strong message and does not include interactivity, while the reader-driven approach does not assume a predefined sequential order, does not convey a message and includes interactivity. The contrast between the reader-driven approach and the author-driven approach sets up the narrative paradox in the field of information design. Most authors tend to position more closely to one of the approaches rather than the other. Kosara and MacKinlay [3] define a story as an ordered sequence of steps connected through a clearly defined path, where each step may contain text, images, visualizations, video or their combination. The authors emphasize the importance of the order in which events are told and the need to convey it consistently, ensuring the narrative is understandable. For Lee et al. [14], a narrative visualization includes a set of facts supported by data; it intends to convey a message and includes annotations or narration to guarantee the communication of the message and avoid ambiguity. The story pieces are presented in a specific order that supports the communication purpose [14] (p. 85). The authors exclude interactive visualizations that support free exploration without further guidance provided by the author. On the contrary, authors such as Bach et al. [1], Figueiras [15] and Ma et al. [16] consider narrative visualization as the whole spectrum of reader-driven approaches, including, for example, simulation and gaming. In this context, the term ‘simulation’ is used to refer to the simulation of a function in which the user can modulate variables and observe differences in the outcomes.
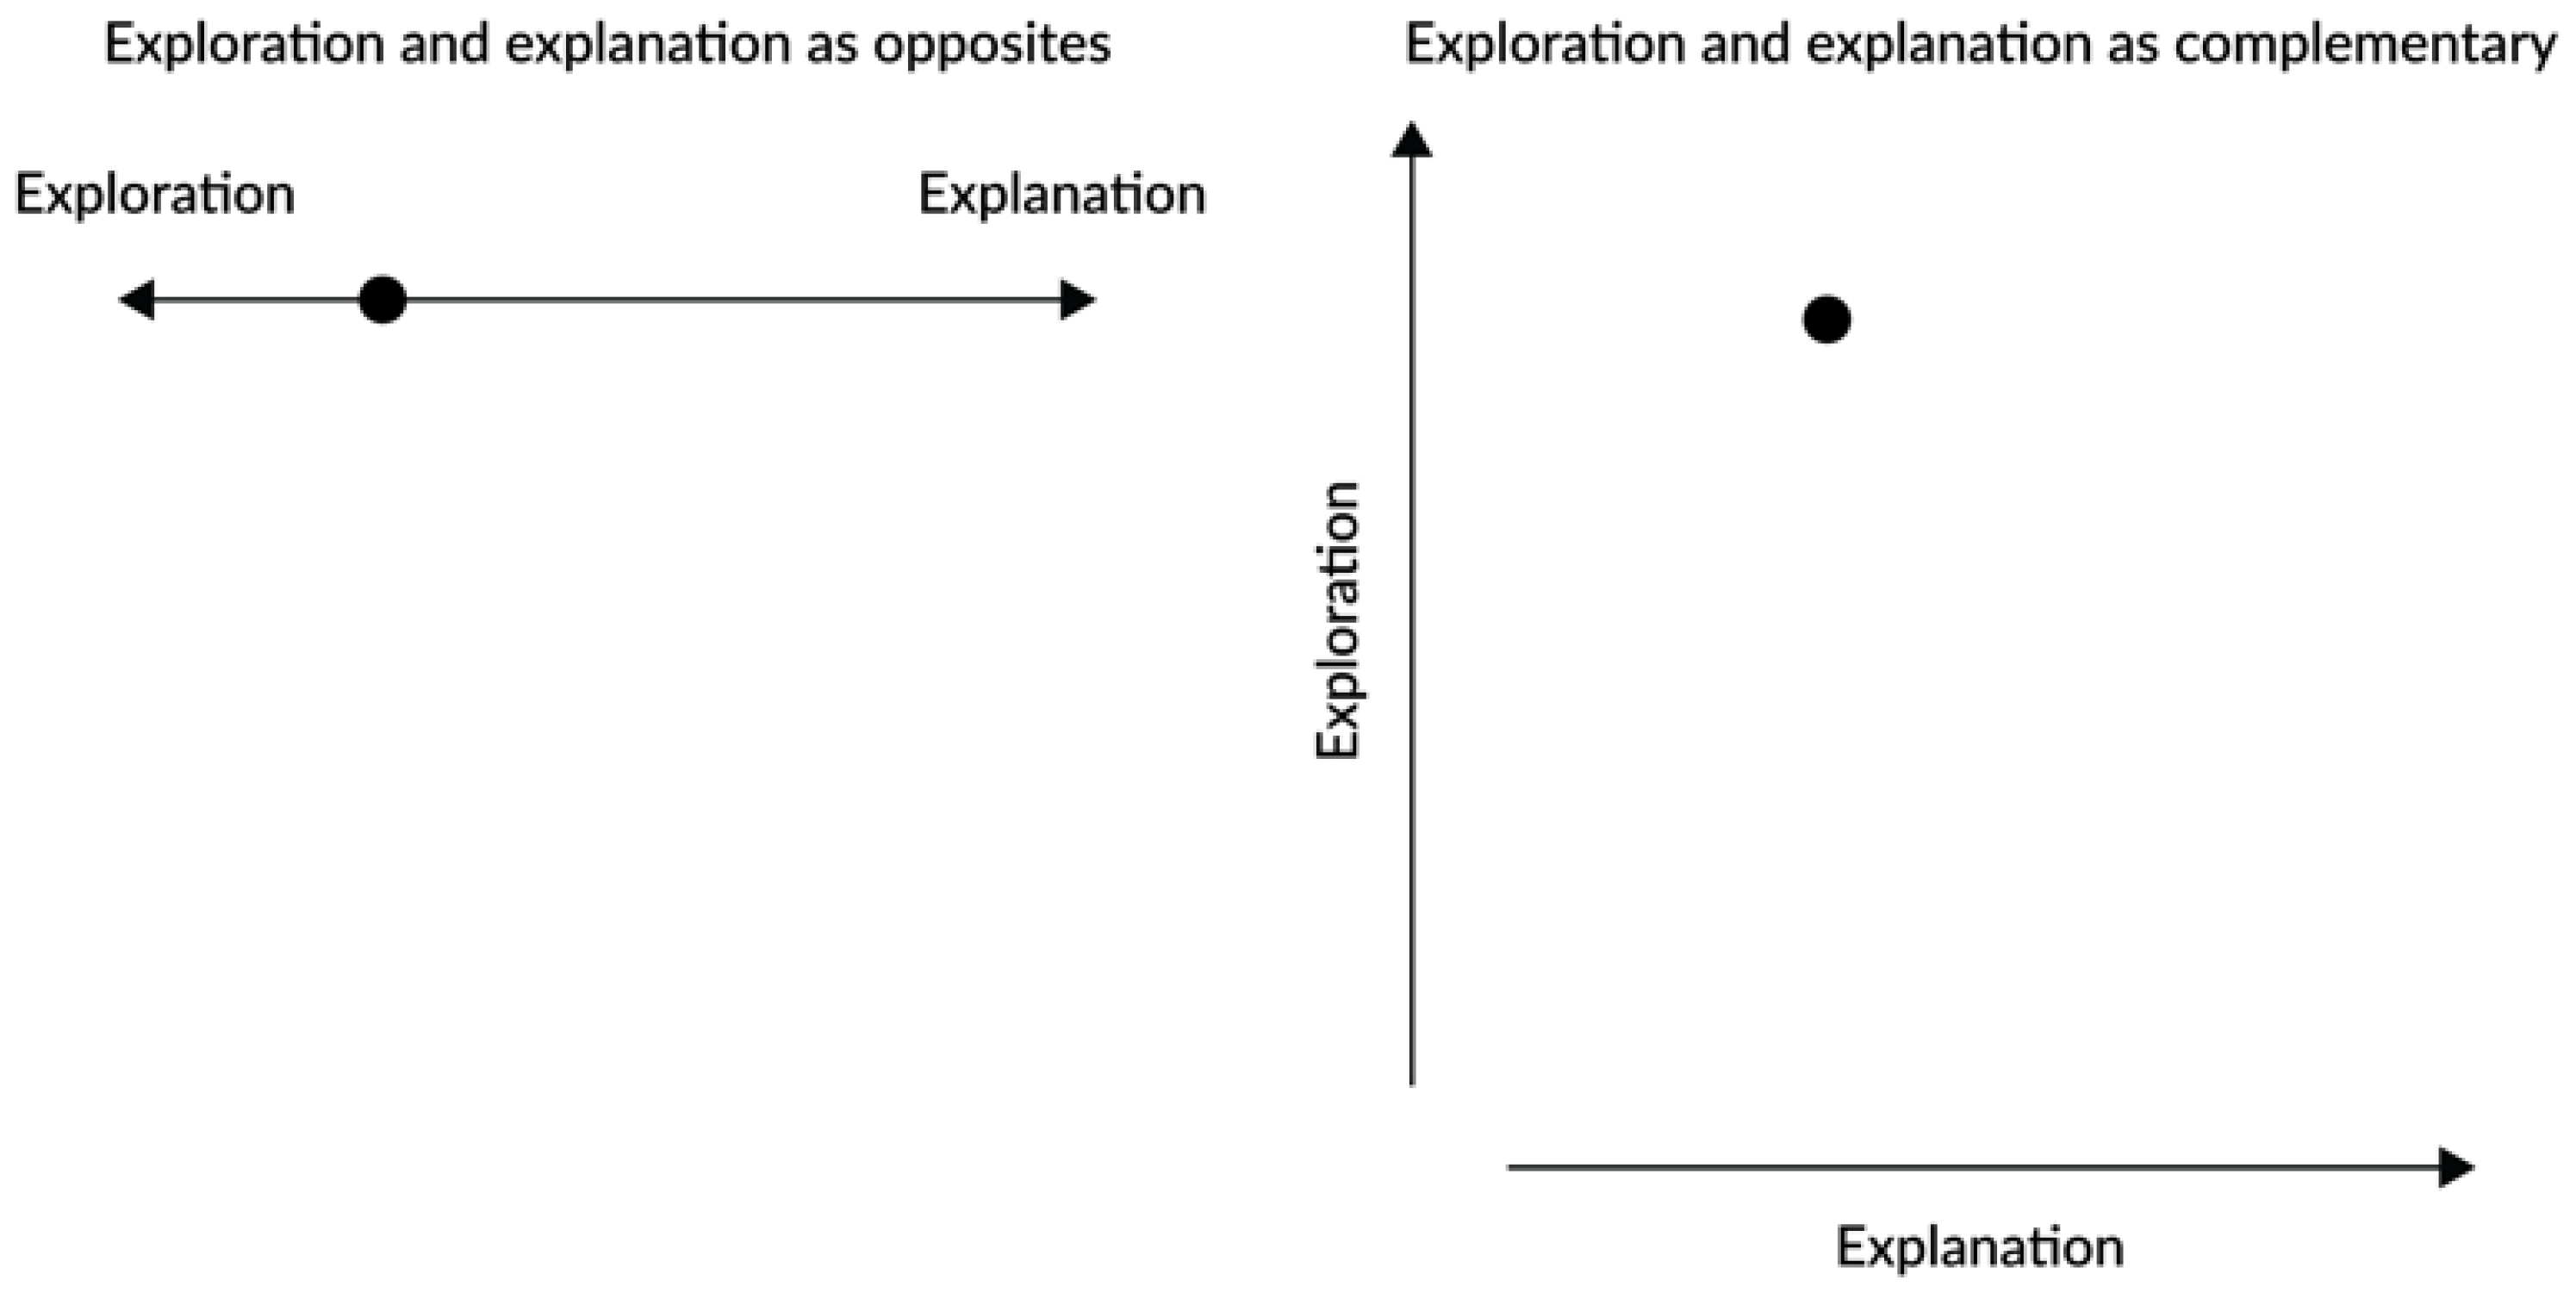
In narrative visualization, Thudt et al. [8] address narrative and interaction using the terms ‘exploration’ and ‘explanation’ and do not consider the two instances as opposites of a continuum, but rather as complimentary instances (see Figure 1). While exploration empowers readers to discover their own narrative within the data set, explanation communicates the author’s narrative about the data [8] (p. 60). Thudt et al. identify three dimensions in a narrative visualization—view, focus and sequence—along which exploration and explanation can be analyzed.
View deals with the ways in which the data are shown to the reader, including the available encodings and any transformations made on the data; focus deals with the subject of the story, a particular set or subset of the data shown and the aspects of the data that are shown; and sequence deals with the order in which the information in the story can be viewed. How flexibility and interpretation are provided on these three levels determines the degree to which a visualization supports exploration and explanation [8] (pp. 68–69).
In the scope of narrative visualization with mixed realities, Bastiras and Thomas [17] address narrative visualization with virtual reality and describe the design process involved. Isenberg et al. [18] explore the concept of immersiveness in interactive narrative visualizations, drawing parallels with game studies. Marques et al. [19] address the use of augmented reality in data visualization and analyze the hybrid space based on the distinction between emotional space and strategic space proposed by Ryan [20]. Emotional space is characterized by an experience of space associated with reactions of affective nature and its representation is based on a horizontal perspective that captures the perception of the human body, while strategic space is related to the possibilities of action to achieve certain goals and is represented through the map view (vertical view) that favors strategic planning. The horizontal perspective characterizes the way of perceiving space in AR and is responsible for the immersiveness that this medium supports.
The intersection of data visualization, storytelling and AR is also studied in journalism, specifically in areas such as immersive journalism and spatial journalism. Within immersive journalism, Ikonen and Uskali traced the evolution of AR in journalism from 1998, when it was first used by a sports channel, to 2021. Since 2016, AR applications in journalism have mostly used 3D models, augmented studios and ‘location-based’ stories. From a literature review and consultation of news websites, the authors identified 11 types of augmented reality storytelling in journalism, supported by different devices and bearing different relations with the physical environment. The types of experiences that do not depend on a specific location are printed paper QR code link; printed paper AR extensions, providing images, video and links; virtual objects superimposed on the user’s environment; a story with virtual objects superimposed on the user’s environment; and news videos inside augmented reality [5]. The added value of knowing the work that is being produced in journalism and bringing it into visualization is that while data visualization may sometimes use the term ‘narrative’ very broadly ([2,14,21]) including in this category cases that are mostly exploratory, for journalism, narrative takes on a greater importance, and this term is used more narrowly. By bringing journalism into the visualization realm, we hope to approach narrative in a more targeted way.
3. Materials and Methods
To tackle the research question, “What specific qualities can AR introduce into each of the dimensions of narrative visualization defined by Thudt et al. [8]—view, focus and sequence?”, a comparative analysis, supported by Esser and Vliegenthart [22], was adopted, in which it is intended to describe how focus, sequence and view are integrated into narrative visualization with AR, from a comparison of a set of case studies. The collection of case studies observed fulfilled the following three criteria: (1) representation of the data with AR—cases of augmented virtuality were excluded; (2) inclusion of narrative, excluding examples that support free exploration without any guidance from the author; and (3) absence of a semantic relationship between the represented data and the physical space where the experience occurs. The selection of cases from journalism aimed to ensure the centrality of the narrative aspect that is essential in that area. For this purpose, the case studies were collected from news sources cited or considered relevant by references on immersive journalism ([5,23,24,25]), particularly the New York Times, the USA Today (to which Florida Today belongs) and the Washington Post. National Geographic and Deutsche Welle, from which five cases were collected, despite not being identified by the abovementioned sources, are widely disseminated newspapers, for which narrative is also a factor of great relevance, and which have invested in immersive ways of communicating. From a total of 50 cases collected (see Table A1) and analyzed, 44% are from the New York Times, 40% are from USA Today (including Florida Today), 8% are from National Geographic, 6% are from the Washington Post and 2% from Deutsche Welle. Cases classified as virtual objects superimposed on the user’s environment and stories with virtual objects superimposed on the user’s environment [5] were collected, since these meet the three criteria mentioned above. Although virtual objects superimposed on the user’s environment alone do not fulfill the narrative criterion, in practice they are always integrated into a journalistic piece, being part of a larger narrative. The time interval of the cases under analysis comprises 5 years—from 2018 until the present time (2022). The start in 2018 is because earlier augmented reality visualizations dating back to 2016 and 2017 are no longer available online; for example, Washington Post’s (2017) app about the story of Freddie Gray’s death; the case of “Berlin Wall” and “Cassini-Huygens” by Quartz (2017); or the Wall Street Journal’s “Stock Market Experience” (2017).
The comparative analysis followed five steps [22]: (1) Contextual description of the factors that will be relevant to explain the similarities and differences between the cases (or units of comparison), namely, the concepts that integrate the view, focus and sequence. (2) Recognition of the functional equivalents, i.e., objects that perform the same function. (3) Establishing classifications and typologies to reduce the complexity of the observed universe by grouping cases into distinct categories with identifiable and shared characteristics. (4) Explaining or describing the results considering the previous descriptions and classifications (Results). (5) ‘Predictions’, consisting of answering the research question—"What specific qualities can augmented reality introduce in each of the dimensions of narrative visualization defined by Thudt et al. [8]—view, focus and sequence?” (Discussion). The following table (Table 1) presents the contextual description of the factors that will be relevant in explaining the similarities and differences between the cases to be compared. When analyzing the collected case studies, it is predictable to not find the same strategies towards flexibility and interpretation regarding the three dimensions under study. Thus, the column ‘Functional equivalents’ (Table 1) presents the functional equivalents to be sought in the case studies.
In the table dedicated to the analysis of the study cases (see ‘Study Case Analysis’ sheet of the ‘AR Data Storytelling’ database) [26], the categories Case Study Number, Source, Date and Media identify the case studies. The categories View and Simulation Type classify aspects of the View—in the first category, a survey of strategies for visual encoding is gathered, and in the second category, the type of simulation present in the identified strategies is classified. In the Focus category, the interaction techniques that allow the user to change focus are surveyed. Sequence is analyzed in four parts: (1) narrative order, which classifies the case as linear or non-linear; (2) narrative sequence, which concerns the type of structure that underlies the narrative; (3) user intervention; and (4) interaction that enables non-linearity. The collected strategies in each category are described in the Results and summarized in Table 2.
4. Results
4.1. View
4.1.1. Visual Strategies
The visual encoding strategies found in the case studies were all implemented through virtual simulation (in this analysis, the term simulation is used in the context of AR, in which a virtual object is registered in the real environment, through the combination of real and virtual images, and real-time interaction; it is the simulation of a hypothetical reality in which the object occurred in that place, coming close to Cubitt’s (2001) definition for whom “simulation is like a copy without a source, an imitation that has lost its original” [27] (p. 532)), and include a 3D model; 3D animation; animation of supporting graphics; photography; two-dimensional animation; video; two-dimensional geographic map; illustration; AR filter; bar chart; two-dimensional shape; line chart; and scientific illustration and three-dimensional map. The visual strategies simulated through AR are not exclusive to augmented reality, except for the AR filter—an image filter that alters the properties of the real image to represent the data. Most cases use a 3D model combined with 3D animation (13 cases), followed by visualizations that use a 3D model individually (11 cases) and cases that use a 3D model combined with photography (4 cases). The next are cases that bring together the 3D model, 3D animation and the animation of supporting graphics—animation of arrows, text and other graphic elements that are not the main object of the animation, but that support the narrative. The most used strategies are three-dimensional, while the least used are two-dimensional; e.g., a two-dimensional map (2 cases), bar chart (1 case) or line graph (1 case).
4.1.2. Types of Simulation
Every analyzed case use virtual simulation over real space as a visual strategy, but the forms of simulation found are quite variable, which revealed the need to create aggregating categories, namely, (1) Diorama or Mockup; (2) Microscopic or atomic representation; (3) 3D Astronomic representation; (4) Traditional narrative forms; (5) Real person; (6) Human activity or performance; (7) Full scale real object; (8) Full scale animal; (9) Natural phenomenon; (10) Quantitative data representation; and (11) Two-dimensional area, size or configuration.
The Diorama or Mockup consists of using a mockup of a building or object, or a diorama of a certain geographical area and is the most observed category (26% of the cases). In this type of visual strategy, the narrative events are narrated in the points of the virtual object where they happened, allowing the user to get a vertical perspective over the presented space and a strategic view of the data. The virtual diorama and mockup use a form of representation from the physical world and remediate it (Bolter and Grusin designate the representation of one medium within another medium remediation and argue that remediation is a defining characteristic of new digital media [28] (p. 45)); i.e., they reinterpret a physical representational technique through the lens of AR. A representative example of the mockup is, “Step inside the crime scene at the heart of ‘Accused’” [29], and an example of the use of the diorama is, “Kent State shootings: A day of tragedy” [30].
Microscopic or atomic representation aims to render visible objects that are invisible because they are too small or do not have a defined outer boundary. This type of representation may have an educational character when it plays the role of scientific illustration, organizing and explaining visual information concerning a certain phenomenon. This is the case, for instance, of “Journey into the body to see COVID vaccine at work” [31], in which it is possible to see the microscopic structure of the COVID-19 virus. On the other hand, this strategy can be ludic when it does not have a strictly informative purpose and intends to ‘play’ with the scale and the point of view of the user—this is the case of “Monsters that live on you” [32]. In the first case, the main purpose of the simulation is to present scientific information in a way that is detached from the user, who plays the role of an observer. In the second case, a certain proximity regarding the represented object is explored, immersiveness is sought above all, and the user is placed in the center of the information—this is the case of “See How the World’s Most Polluted Air Compares With Your City’s” [33].
3D Astronomic representation—illustrated by “The World in 2070” [34]—uses the representation of a planet or set of planets, from a spatial view. In representing a planet, this strategy is comparable to the diorama as it appropriates a form of non-digital world mapping—the globe—reinterpreting it with an AR layer. This type of simulation promotes a view of the whole and places the user outside the object, as an observer. The simulation of a representational object of the physical world is still a simulation in the sense that it simulates the real presence of that object, but this simulation does not try to be itself the focus of attention but rather the space where the information is conveyed.
Traditional narrative forms are revivals of narrative forms from non-digital media and the only case found is “Woman’s suffrage: Famous speeches come to life” [35], where paper theaters depicting important scenes from the political life of three suffragist women are used. This typology of visual strategy differs from the diorama in the sense that it does not attempt to offer a strategic view of the data, but rather a dramatic or theatrical one, not aiming to map the physical space based on reality.
The full-scale simulation of a real person, used in “Augmented Reality: Four of the Best Olympians, as You’ve Never Seen Them” [36], reproduces the physical presence of a particular person in the user’s space and produces the sensation of physical proximity. In this case, there is no mapping of information in the same sense as the mock-up. The simulation is not the context where the information communication occurs, but rather the communication itself, there is a virtual replica of reality. This visual strategy acts in the opposite direction of mapping, since instead of employing the exercise of synthesis that seeks to communicate the maximum information with the minimum number of visual resources, it does the opposite—it seeks to recreate the object under study in detail.
The Human activity or performance category simulates people performing activities, in this study mainly athletes practicing sports activities. This strategy can use (1) full-scale models, replicas of certain athletes; or (2) generic models of the human body. In the first case, illustrated by “Scale a 50-foot speed climbing wall in augmented reality” [37], the goal is to simulate a live performance—creating proximity with the represented athlete. In the second case, the visualization allows to analyze the performance in detail—one case being “Gymnastics in Tokyo” [38], allowing the visualization of the gymnast’s performance in slow motion and from all possible angles. In the latter approach, the simulation of a human activity comes close to the scientific visualization, whose goal is to visualize physically based data [39].
Full-scale real object aggregates the visualizations that simulate full-scale artifacts, evoking their physical presence in the user’s space and physical proximity. This view does not employ a synthesis of reality through mapping as in the case of the diorama. The mapping here is a direct simulation of reality. It is a virtual replica, and as such, it maximizes the potential of the horizontal perspective of space—the perspective that captures the perception of the human body [20]. A representative example of the replica of an artifact is “Take a Tour of Lady Liberty’s Torch” [40].
Full-scale animal comes close to the real person and the real artifact by evoking physical presence, proximity and immerses the user in the middle of the information. On the other hand, the full-scale animal simulation does not depict a particular individual but rather a generic representation of a particular species, as in “Deinonychus” [41]. By allowing the user to stand in front of a virtual replica of a potentially rare or endangered animal, one of the added values of AR is that it enables to fabricate an experience that would be unlikely or impossible to witness in the wild. There is a certain sense of reminiscence in this strategy, since it attempts to recover or reconstruct an experience that is not likely to be witnessed in person.
The recreation of a natural phenomenon in the user’s space, exemplified by “What will the megastorm’s rain look like?” [42], allowing the user to simulate that he/she is witnessing an extreme natural phenomenon live in his/her own environment. On the one hand, this experience is intended to be as immersive as possible; on the other hand, it makes relatively abstract information more concrete. For example, knowing that the California megastorm could reach a maximum rainfall rate of 1.9 in/ h and that sudden gusts of severe precipitation could cause deadly flooding is not the same as experiencing the storm that this numerical value reflects, even virtually.
Quantitative Data Representation, used mostly by the New York Times and demonstrated in “Inflation Shrinking Ray” [43], uses the simulation of objects in real space to represent quantitative data, turning abstract numerical concepts into concrete ‘things’. In this case, the visualization represents the percentage of dollar inflation through everyday objects that are shrunk according to inflation. The abstract characteristics of the data are represented based on the physical configurations of the virtual objects. In a sense, this strategy of concretization [1] follows the same logic of Otto Neurath’s Isotype, transporting it to real space and originating other interpretations. Although the concretization strategy is identifiable in the print medium, this type of simulation does not reproduce non-digital representational strategies, but instead seeks a discourse of its own, in the sense that it uses the horizontal perspective, typical of AR, to convey strategic/quantitative information. Taken to the user’s space, this strategy moves away from the logic of the Isotype, to approach the action of explaining/understanding mathematical concepts using physical objects, leading the user to relate more easily with the presented concepts.
Two-dimensional area, size or configuration simulates the shape of a given two-dimensional area in the user space. In “Step Inside the Thai Cave in Augmented Reality” [44], for instance, the visualization simulates the openings in the Thai cave through which a group of people were rescued. This type of simulation resembles the representation of quantitative data in the sense that it contributes to the concretization of an abstract value (in this case the dimension of a passage) and differs from it in the sense that the simulation is not based on a visual metaphor (as is the case with the representation of quantitative data); instead, it is a direct representation.
4.2. Focus
In the Focus category, 51% of the cases use selecting interaction technique (selecting interaction technique stands for “mark or track items in which I am interested” [13] (p. 70)); 45% do not choose the set of data presented, 2% use a filter (filter stands for “only show me the data in which I am interested” [13] (p. 70)) and 2% use a searching tool. The ‘selecting’ technique is present in most cases and may include the discovery of information points, known as hotspots (20 cases), or the selection of a chapter or narrative event (6 cases). The searching tool acts as a filtering tool, while the filter is present in two cases and the searching tool is present in only one case.
Although the user does not have much control over the selection of the displayed data, there is an adaptation of the details-on-demand interaction technique to the AR medium—the ‘hotspots’. Hotspots are part of the interaction technique mentioned as details-on-demand in Data Visualization and consist of information points that are attached to or next to virtual objects, which might be visible or invisible and can be discovered and triggered by the user (by selecting them or through the user’s position). For example, in “Augmented Reality: Four of the Best Olympians, as You’ve Never Seen Them” [36], hotspots are activated according to the proximity of the user—the closest point to the user is activated and the information from that point is rendered visible, while all other points are deactivated. Since the points are not marked, the user must move around and look at the virtual model from various angles while looking for information. This form of interaction, where it is necessary to search for points that are distributed in space, enables a form of spatial narrative since the narrative events unfold in time according to the position of the user in space. The virtual model becomes the center of the narrative. In the case of “EV Battery Breakdown” [45], hotspots are activated by a fixed target on the user’s screen, and when the target overlays a location containing information, the text is made visible. In none of the cases containing hotspots is there a predetermined reading order; instead, the user discovers information as he/she explores and wanders through the space.
4.3. Sequence
4.3.1. Narrative Order
The narrative order refers to the arrangement of paths that the user can take during the visualization, along the narrative structure. In this analysis, the order is considered linear when it is prescribed by the author, and non-linear when there is no suggested path to follow or when the user is supposed to select one of several path options. From the analyzed cases, 52% are non-linear and 48% linear.
4.3.2. Narrative Sequence
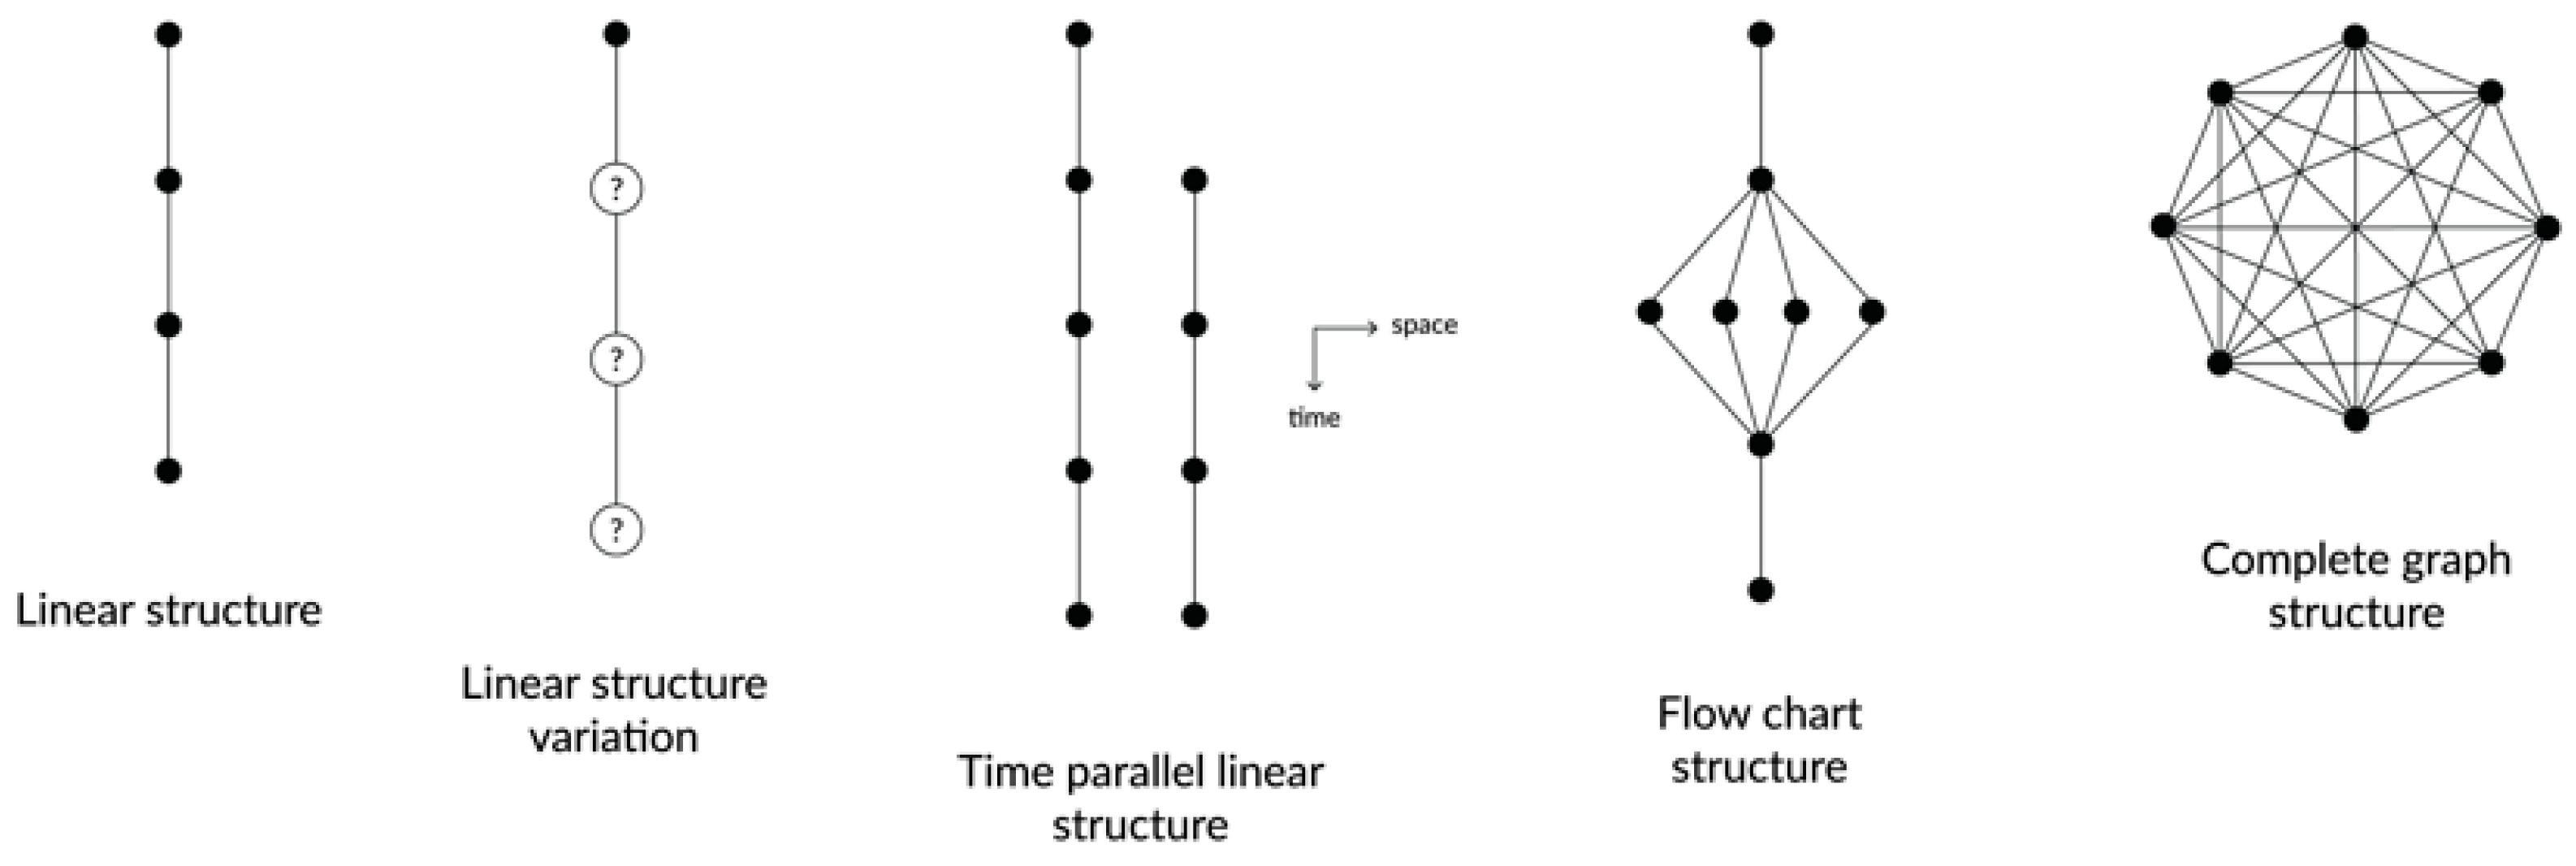
The narrative structure is the structure formed by the narrative events. Individually, a narrative event functions as an episode in a story, as several events correspond to several microstructures that form a narrative sequence [46]. In order to map the narrative structures present in the cases studies, the underlying structure of each visualization was sketched by splitting it into events. This resulted in five types of narrative structures (see Figure 2), which are often combined with each other: (1) a linear structure; (2) linear structure variation; (3) a time parallel linear structure; (4) a flow chart; and (5) a complete graph.
The first structure consists of a linear sequence of events where the user only progresses through the narrative—the case of “What will the megastorm’s rain look like?” [42]—but where the narrative can also progress independently of the user’s action, as in the case of video or animation—illustrated by “Deinonychus” [41]. The linear structure variation is present in “Inflation Shrinking Ray” [43], in which, despite being based on a linear sequence where the user can only progress through the sequence, there are moments when the user can choose to either view a particular event or progress by skipping it.
The time parallel linear structure presents two simultaneous linear narrative sequences about the same event, but in different locations. The user’s action consists of progressing in the story and switching between two available spaces, which present different narratives and different perspectives of the same event. This structure was observed in “Step inside the crime scene at the heart of ‘Accused’, Season 4” [29].
The flowchart starts with a linear sequence, which, at a given event, branches into several paths and the user is asked to choose a single path. Regardless of his choice, the various paths then converge into a single event. Thus, regardless of the user’s choice, the outcome is invariable. The only example of a flowchart found in the reviewed cases was “See How the World’s Most Polluted Air Compares With Your City’s” [33], in which the user is asked to choose his city to compare it with the world’s most polluted cities.
The complete graph was originally proposed by Ryan [47] to classify a type of narrative structure present in digital interactive narratives and envisions a structure in which all events are accessible from all events, with no chronological order determined by the author. In the analyzed cases, this type of structure underlies events where the user is called upon to find hotspots in the virtual object. “Notre Dame: After the Fire” [48], for instance, uses this structure combined with a linear sequence.
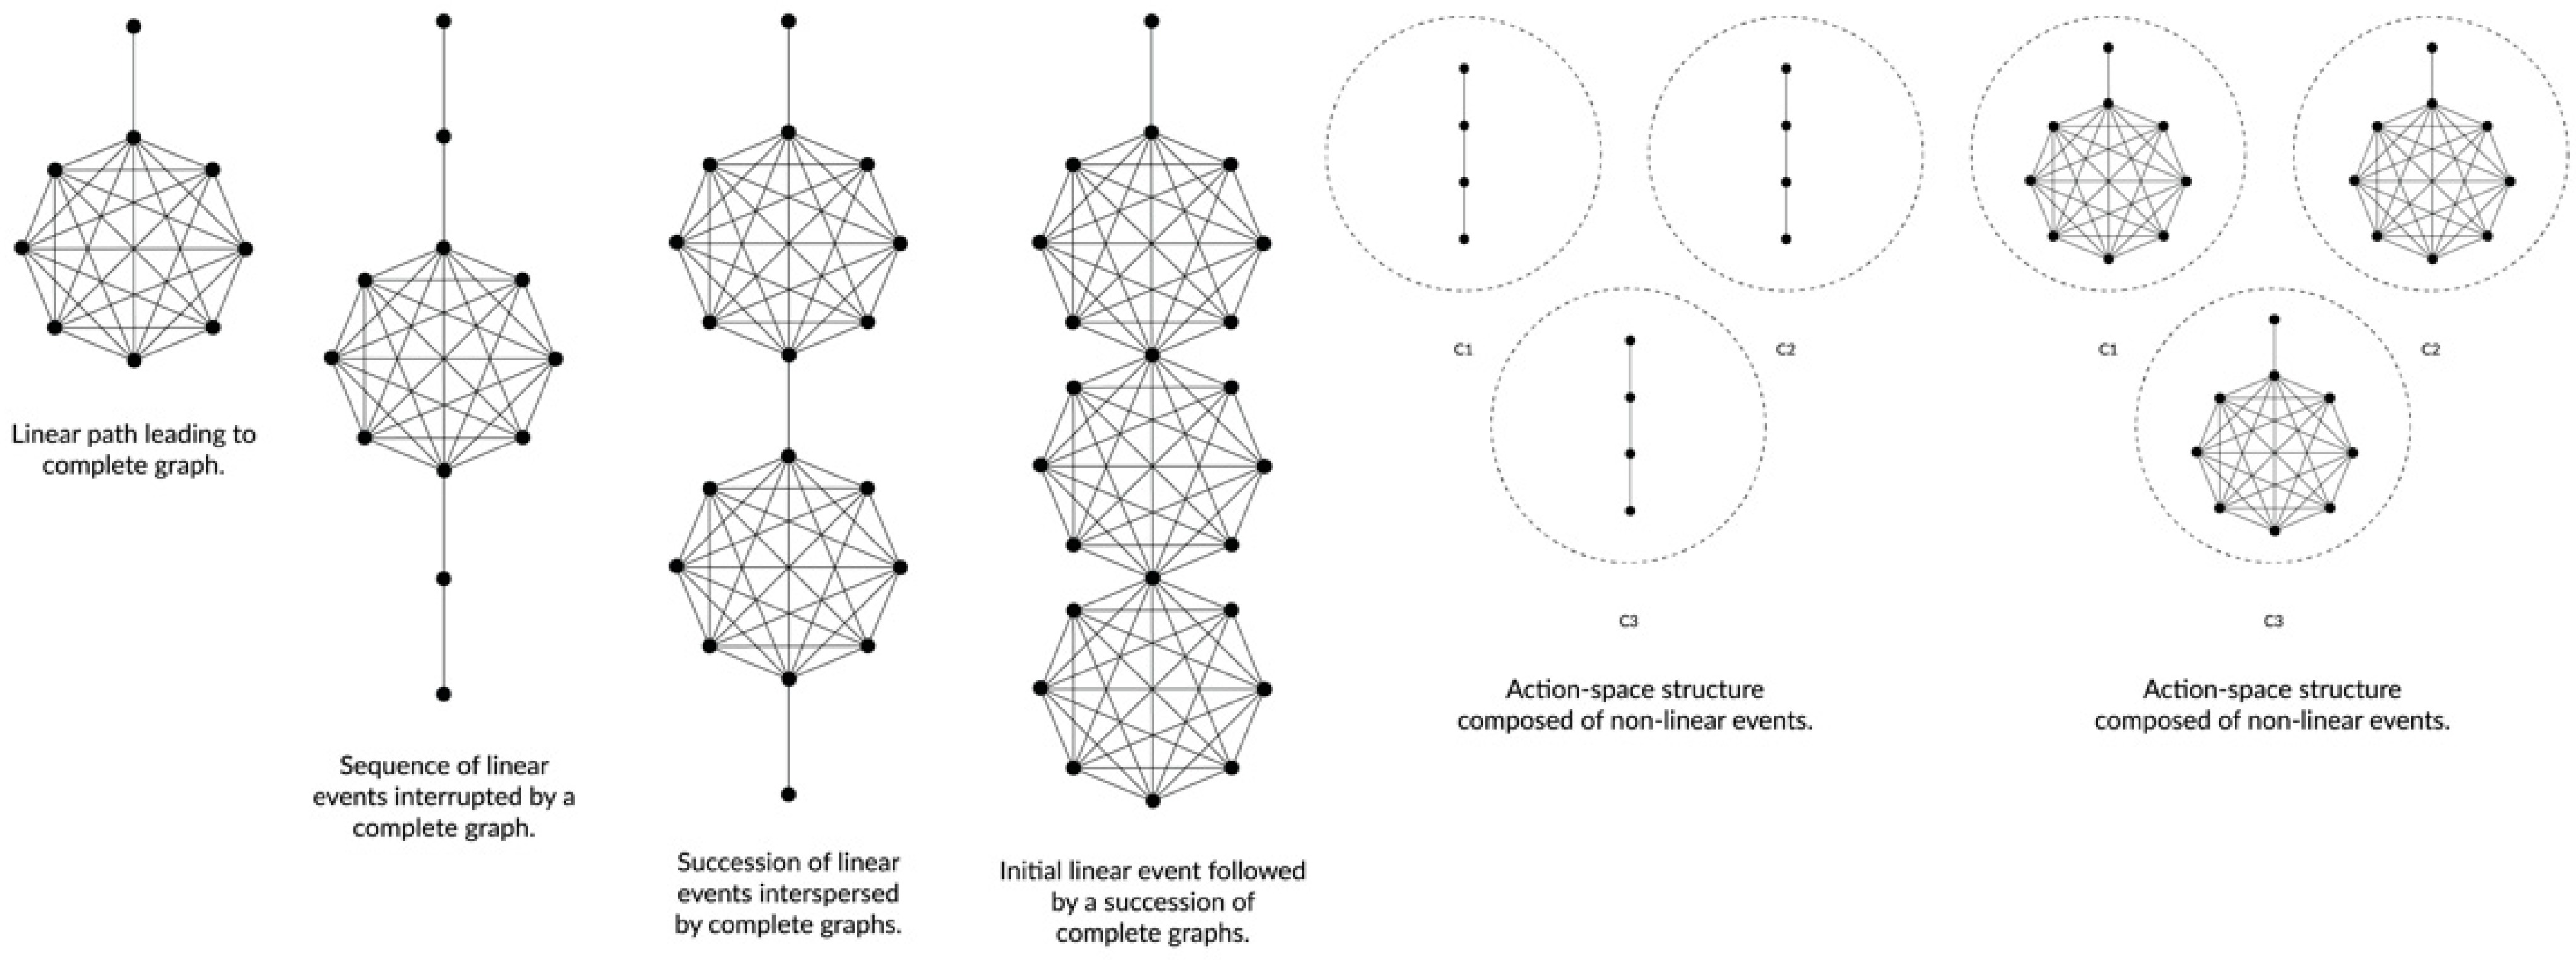
Five different combinations between structures were identified (see Figure 3): (1) linear path leading to complete graph—as in “The World in 2070” [34]; (2) sequence of linear events interrupted by a complete graph—present in “Explore Mars Perseverance rover in augmented reality” [49]; (3) succession of linear events interspersed by complete graphs—the case of “Sport Climbing with Kyra Condie” [50]; (4) initial linear event followed by a succession of complete graphs—as in “Capitals’ John Carlson discusses the All-Star game” [51]; and (5) action-space. The term ‘action-space’ was borrowed from Ryan’s narrative structures [47]; in this study, it identifies a type of architecture in which the narrative is composed of a set of self-contained narratives. These narratives can be linear—the case of “Woman’s suffrage: Famous speeches come to life” [35]—or non-linear—the case of “Statues bring suffrage history to you in augmented reality” [52].
Excluding the linear sequence that dominates 48% of the cases, the type of combination most frequent is the succession of linear events interspersed by complete graphs (16%), followed by a linear path leading to a complete graph (12%) and the action-space structure (12%). There is a clear preference for linear structures, with which it is easier to communicate a narrative controlled by the author.
4.3.3. User Intervention
From the analysis of the narrative structures, the user’s intervention in the narrative course was analyzed and mapped. Five forms of intervention were identified, which are not mutually exclusive:
- (A)
- The user controls the point of view; i.e., the way of seeing.
- (B)
- The user progresses throughout the narrative and/or activates an animation.
- (C)
- Although the user only progresses through the narrative and/or activates an animation, there is a simulation of an increased control of the narrative.
- (D)
- The materials that comprise the narrative are totally predetermined, but their order is variable and chosen by the user.
- (E)
- The user chooses a certain narrative path, but the ending is always the same, regardless of his or her choice.
(A) In narrative visualization using AR, at the very least the user has full control over the point of view. This form of intervention is always guaranteed in AR, since the user uses the device and controls the point of view of the experience while moving. In fact, inherent interactivity is one of the criteria for an experience to be considered AR. On the one hand, this form of intervention gives the user freedom of interpretation, as even when the content itself is not interactive, the user plays the role of director by selecting his own setting of the virtual event. On the other hand, if the display does not have sufficient navigation instructions, the user may miss relevant information by not knowing exactly what to look for in the space. As such, the control of the viewpoint is provided by all the analyzed cases, but only “Deinonychus” [41] uses only this form of intervention.
(B) Observed in 46 cases, the second form of user intervention consists of progressing in the storyline through scrolling, tapping, swiping or arrows. (C) Sometimes, the action of progressing in the storyline simulates other forms of action, seeking to imitate a greater narrative control by the user. This is the case for “Inflation Shrinking Ray” [43], “Explore Mars Perseverance rover in augmented reality” [49] and “321 LAUNCH—Falcon 9” [53]. In “321 LAUNCH”, to advance the narrative, the user is asked to perform various tasks; for example “Drag to place assembly building”; “Drag the strongback”; “Swipe to fuel the rocket”. Accomplishing the tasks through dragging and swiping is the only way to progress in the narrative, triggering the continuation of the animation. Drag is used to drag objects to the real environment, while swipe is used to play the animation of the object being handled. Although there is never more than one narrative path, the user is placed at the center of the action through a role-playing strategy, as if he himself controlled the mission. At the end of the visualization, a message congratulates the user: “Congratulations on a successful first stage landing at Cape Canaveral Air Force Station”. This form of storytelling makes the rocket assembly stages more memorable because the user has virtually performed them virtually in a ‘make-believe game’. While this case is not considered gaming, it uses gaming strategies—by narrating the assembly of the rocket in an immersive way and by putting the user at the center of the action. This type of strategy at no point enables the user to change the course of the narrative, and yet still manages to simulate agency.
(D) In the fourth mode of intervention, the materials that compose the narrative are totally predetermined, but their order of reading is variable and decided by the user. The implementation of this form of intervention is done mainly through the discovery of hotspots—present in 20 cases—or through the selection of chapters—6 cases.
(E) In the fifth form of intervention, the user chooses a particular narrative path, but the ending is always the same, regardless of his choice. This form of intervention is characteristic of the narrative structure previously termed ‘Flowchart’.
No cases were found where the user could decide or change the end of the narrative and, in general, although the visualizations are quite dynamic and even simulate narrative control by the user, they are mostly controlled by the author, exhibiting a strong narrative component. The tight narrative control somehow balances the author’s inability to control the way of seeing due to the use of AR. Most of the analyzed structures classify as a linear sequence (48%), followed by the succession of linear events interspersed by complete graphs (16%) and a linear path leading to a complete graph (12%). Regarding user intervention, most of the cases under analysis registered one of two situations: (1) combines control of viewpoint with the ability to move forward (AB) (44%); or (2) combines control of viewpoint, the ability to move forward and the choice of the reading order (ABD) (40%).
5. Discussion
This comparative analysis showed that although the user has no control over the visual encoding strategies used, he/she has full control over the way of seeing. On the other hand, simulation as a visual strategy presents several new semantic possibilities to the author. The visual strategies introduced by AR include the following possibilities, which can coexist in the same visualization:
The reinterpretation or remediation of the representational objects of the physical world, such as the globe, diorama, mockup, and models (molecular, atomic, etc.), by adding virtual content to them. This reinterpretation of ways of mapping from the physical world recovers a way of communicating strategic information from a vertical perspective in a space that is characterized by favoring a horizontal and immersive perspective.
The reinterpretation or remediation of narrative forms from the physical, non-digital, world such as a paper theater, which does not intend to realistically map but to tell a story by anchoring it to a traditional narrative form.
The simulation of someone’s or something’s physical presence—person, animal or object—that is not present, full-scale in the user’s space, fostering a sense of physical proximity and immersiveness. This virtual replica constitutes an opposite strategy to mapping, in the sense that it does not seek synthesis but detail, in an exercise that resembles the full-scale Map of the Empire in Jorge Luis Borges’ short story “Del rigor en la ciencia”, where the map is so detailed that it replaces the Empire itself. The virtual replica evokes a certain reminiscence, because although one is not in the presence of the original object, the experience simulates that object. This character is enhanced by the replication of people, animals or artifacts that cannot be contacted directly and where AR can reproduce their presence in reality.
The visual and audio simulation of the effects of a given phenomenon in the user’s environment as a way of visualizing hypothetical scenarios. In this case, the real environment becomes the stage where a certain phenomenon takes place, allowing the user to witness it as if it were a live event.
Abstract quantitative data can be materialized in the form of visual metaphors, as in “Inflation Shrinking Ray” [40], or through its direct representation, as in “Water Footprint” [52], where the amount of water required to produce a steak is simulated (in stacked 1-L bottles) in the user’s environment. This possibility reflects ways of representing strategic information in the emotional space.
The visual encoding strategies (View) introduced by AR in narrative visualization can be distributed in a continuum—at one end are the cases where simulation is the context of communication, and at the other end are the cases where simulation is the communication itself. Simulation is the context of communication when it provides the space or context for the narrative to unfold and does not primarily aim to realistically simulate the original object, but rather to map data. In this case, although the visualization continues to be immersive, since that is an inherent condition of the medium, there is an exercise of mapping and synthesizing, and a certain distancing of the user regarding the content. Simulation is communication when there is an attempt to recreate the original object and not to synthesize it. In this type of experience, the goal is to provide the most detailed replica possible, and the experience of standing in front of the virtual replica is central to the communication itself. Here, the proximity perceived by the user is an important aspect, and immersiveness is improved by placing the user in the center of the information.
In general, the strategies for focus are quite restrained and do not allow the user much control over the presented data. The author’s control over focus ensures the effective communication of the narrative, while the discovery of hotspots in space fosters a form of free exploration of the data, even if this exploration is of no consequence to the unfolding of the story. The hotspots are a form of details-on-demand that do not need to follow a chronological order, being used to promote the exploration of information in the hybrid space without compromising the narrative communication. Likewise, the filters used are few and restrained, in the sense that they do not allow crossing several different dimensions, thus limiting the possible outcomes.
Sequence primarily seeks to ensure linearity, and even when using non-linear structures such as the complete chart or action-space, the narrative and communicational purpose is ensured through combination with linear sequences. The use of strategies intended to mimic agency in situations where the user can only move along events dilutes the lack of control by the user in the course of the narrative. This type of strategy does not create more narrative possibilities and does not give the user more control over the sequence; however, it adds dynamism and engagement without compromising the author’s control over the narrative.
6. Conclusions
In the most frequent combination of ‘focus’ and ‘sequence’ (12 cases), the user does not choose the set of data presented and the visualization is based on a linear sequence in which the user’s intervention is to control the point of view and to progress through the narrative sequence (AB). This characterization mainly attests to the importance and assurance of the explanatory character of the visualizations. The full control of the viewing mode by the user is counterbalanced with a tight author-control over focus and sequence. Despite the strong explanatory character, which sometimes limits the user’s agency, there is a strong interactive factor, and it was found that augmented reality can expand the narrative possibilities in the three categories analyzed—view, focus and sequence.
The use of AR in narrative visualization adds possibilities, especially to the ‘view’ domain, where simulation as a strategy plays a central role and allows for two main directions: the representation of a given phenomenon by mapping it out—which we called ‘simulation as context for communication’—or simulating the phenomenon itself—‘simulation as communication’. As means of mapping, simulation enables the remediation and enrichment of pre-digital forms of representation, but also gives rise to new visual metaphors based on the inherent characteristics of AR. This is the case of the representation of quantitative data, able to use the horizontal perspective of the emotional space to communicate strategic information. Replica simulation introduces the possibility of being in front of increasingly reliable dopplegängers of the original ‘object’, artificially removing the barriers of space and time and providing experiences that increasingly better simulate direct contact and physical proximity. Furthermore, in the ‘view’ category, we highlight the appearance of a visual encoding genre exclusive to this medium, which is the augmented reality filter, present in “Election Forecasts” [54] as means of quantitative data representation.
In the ‘focus’ scope, the adaptation of the details-on-demand interaction technique to the hybrid space, resulting in hotspots, stands out. The discovery of hotspots in the hybrid space opens possibilities for the narrative sequence, in the sense that it becomes possible to create a time sequence in real space (similar to what happens in exhibitions, for instance). According to the authors, the use of hotspots enhances exploration, which is fundamental in the appropriation of data by the user, in the sense that it allows a true discovery of information in space through wandering.
More broadly, AR brings physicality to the narrative without the limitations of a real physical object. Through AR, it is possible to simulate the actors of the narrative in real space (e.g., the case of the simulation of real people) or to simulate the objects where the narrative is mapped (the case of dioramas). This simulation, which obviously is not equivalent to being in front of the agents of the narrative, allows us to digitally recreate physical objects and distribute them without the constraints inherent to their physical construction and distribution, but also to the constraints of their own material condition. The constraints of physical construction and distribution involve, for example, the use of material resources and financial outlay in the execution and distribution of a real object. Constraints relating to material condition include, for example, the inability of an inanimate physical object to float, teleport or change its shape.
Some of the technical limitations encountered in this study were the unavailability of some visualizations online, especially before 2018; also, the unavailability of the mobile apps of some newspapers under analysis in the country where the study was conducted, such as the Time Immersive or the ARc Stories App (Washington Post’s previous app). Most of the accessed mobile applications do not work properly on Android, requiring the use of an iOS system to access the AR content. A more comprehensive data collection in time would give rise to more robust research; however, the early state of AR-based narrative visualization practice in journalism does not allow for a greater temporal scope. In future work, we intend to investigate no-code AR authoring tools to provide designers with knowledge about the available tools that do not require programming languages, which can be a limitation to the exploration of this type of information design.
Author Contributions
Conceptualization, A.B.M. and V.B.; methodology, A.B.M. and V.B.; validation, V.B. and R.C.; formal analysis, A.B.M.; investigation, A.B.M.; resources, A.B.M.; data curation, A.B.M.; writing—original draft preparation, A.B.M.; writing—review and editing, R.C. and V.B.; supervision, V.B. and R.C.; project administration, A.B.M.; funding acquisition, V.B., R.C. and A.B.M. All authors have read and agreed to the published version of the manuscript.
Funding
This research was funded by FCT—Fundação para a Ciência e a Tecnologia (Foundation for Science and Technology), I.P., under the Ph.D. grant «SFRH/BD/144937/2019».
Institutional Review Board Statement
Not applicable.
Informed Consent Statement
Not applicable.
Data Availability Statement
Data supporting reported results is publicly available and can be found at: https://0-doi-org.brum.beds.ac.uk/10.5281/zenodo.7331412 (accessed on 23 November 2022).
Conflicts of Interest
The authors declare no conflict of interest.
Appendix A

Table A1.
Index of the reviewed cases.
| Nr. | Source | Date | Title |
|---|---|---|---|
| 7 | New York Times | 5 February 2018 | Augmented Reality: Four of the Best Olympians, as You’ve Never Seen Them |
| 9 | New York Times | 21 July 2018 | Step Inside the Thai Cave in Augmented Reality |
| 10 | New York Times | 30 October 2020 | How Masks Work |
| 11 | New York Times | 19 October 2021 | Wildfire Storms |
| 12 | New York Times | 25 December 2021 | What Webb Will See |
| 13 | New York Times | 20 April 2022 | Inflation Shrinking Ray |
| 14 | USA Today | 1 May 2020 | Kent State shootings: A day of tragedy |
| 15 | New York Times | 20 March 2018 | Augmented Reality: David Bowie in Three Dimensions |
| 16 | New York Times | 8 July 2022 | How smoke Spreads |
| 18 | New York Times | 26 February 2021 | Why Opening Window is a Key to Reopening Schools |
| 21 | USA Today | 9 January 2021 | What happened where? A virtual look at last year’s Capitol riot |
| 22 | New York Times | 14 April 2020 | This 3-D Simulation Shows Why Social Distancing is So Important |
| 23 | New York Times | 2 December 2019 | See How the World’s Most Polluted Air Compares With Your City’s |
| 25 | National Geographic | April 2020 issue | The World in 2070 |
| 26 | National Geographic | August 2022 issue | Stonehenge |
| 27 | National Geographic | October 2020 issue | Deinonychus |
| 28 | USA Today | 24 January 2022 | Step inside the crime scene at the heart of ‘Accused’, Season 4’ |
| 32 | New York Times | 19 June 2018 | A Volcano Turns a Town Into a Cemetery |
| 33 | New York Times | 1 May 2018 | Augmented Reality: Explore NASA’s InSight Mission on Mars |
| 34 | New York Times | 25 October 2018 | Monsters that live on you |
| 35 | Washington Post | 20 July 2021 | Scale a 50-foot speed climbing wall in augmented reality |
| 36 | New York Times | 12 August 2022 | What will the megastorm’s rain look like? |
| 37 | Washington Post | 17 July 2019 | How to Dress for Space |
| 38 | New York Times | 19 August 2022 | EV Battery Breakdown |
| 39 | National Geographic | 28 April 2021 | California Condor |
| 40 | New York Times | 26 October 2020 | Election Forecasts |
| 41 | USA Today | 12 August 2022 | Get up close with Heat domes, a culprit behind the summer’s heat |
| 42 | USA Today | 8 September 2021 | Story of deadliest prison riot in U.S. history told in augmented reality |
| 43 | USA Today | 12 February 2021 | Explore Mars Perseverance rover in augmented reality |
| 44 | USA Today | 13 August 2020 | Statues bring suffrage history to you in augmented reality |
| 45 | USA Today | 27 January 2021 | Journey into the body to see COVID vaccine at work |
| 46 | USA Today | 7 July 2020 | Learn more about destroyed Frederick Douglass statue, in Augmented Reality |
| 47 | USA Today | 7 May 2020 | No mask? Here’s how far your germs can travel |
| 48 | USA Today | 16 July 2020 | Woman’s suffrage: Famous speeches come to life |
| 49 | USA Today | 6 February 2020 | 737 MAX: what happened to the airliner? |
| 50 | USA Today | 21 August 2019 | Rocket science made easy. Learn about Apollo 11 in AR. |
| 51 | USA Today | 27 August 2019 | Notre Dame: After the Fire |
| 52 | USA Today | 21 August 2019 | Oscars 2019: See costumes from your favorite films, from every angle |
| 53 | USA Today | 27 August 2019 | Capitals’ John Carlson discusses the All-Star game |
| 54 | Florida Today | 2018 | 321 LAUNCH—Falcon 9 |
| 55 | New York Times | 13 November 2018 | Take a Tour of Lady Liberty’s Torch (Right This Second) |
| 56 | USA Today | 19 July 2021 | Skateboarding with Tom Schaar |
| 57 | USA Today | 19 July 2021 | Sport climbing with Kyra Condie |
| 58 | New York Times | 4 August 2018 | A fire tornado hit their neighborhood. This is all that’s left. |
| 59 | New York Times | 21 December 2018 | It’s Intermission for the Large Hadron Collider |
| 62 | USA Today | 29 December 2019 | Show of Force—Explore the Fog of War |
| 65 | New York Times | 2021 | Gymnastics in Tokyo |
| 66 | New York Times | 2021 | Hurdling in Tokyo |
| 67 | Washington Post | 5 November 2018 | Practice makes perfect: Carve this virtual turkey |
| 69 | Deutsche Welle | 5 February 2020 | Water footprint: Augmented Reality shows water cost of beef |
References
- Bach, B.; Stefaner, M.; Boy, J.; Drucker, S.; Bartram, L.; Wood, J.; Ciuccarelli, P.; Engelhardt, Y.; Köppen, U.; Tversky, B. Narrative Design Patterns for Data-Driven Storytelling. In Data-Driven Storytelling; A K Peters/CRC Press: Boca Raton, FL, USA, 2018; pp. 107–133. [Google Scholar] [CrossRef]
- Segel, E.; Heer, J. Narrative Visualization: Telling Stories with Data. IEEE Trans. Vis. Comput. Graph. 2010, 16, 1139–1148. [Google Scholar] [CrossRef] [PubMed] [Green Version]
- Kosara, R.; MacKinlay, J. Storytelling: The next Step for Visualization. Computer 2013, 46, 44–50. [Google Scholar] [CrossRef] [Green Version]
- Azuma, R. Location-Based Mixed and Augmented Reality Storytelling. In Fundamentals of Wearable Computers and Augmented Reality; Barfield, W., Ed.; CRC Press: Boca Raton, FL, USA, 2015; pp. 259–276. [Google Scholar]
- Ikonen, P.; Uskali, T. Augmented Reality as News. In Immersive Journalism as Storytelling; Uskali, T., Gynnild, A., Jones, S., Sirkkunen, E., Eds.; Routledge: Oxford, UK, 2021; pp. 147–160. [Google Scholar] [CrossRef]
- Chandler, T.; Cordeil, M.; Czauderna, T.; Dwyer, T.; Glowacki, J.; Goncu, C.; Klapperstueck, M.; Klein, K.; Marriott, K.; Schreiber, F. Immersive Analytics. 2015 Big Data Vis. Anal. BDVA 2015, 2015, 1–8. [Google Scholar] [CrossRef]
- Schmitz Weiss, A. Place-Based Knowledge in the Twenty-First Century. Digit. J. 2015, 3, 116–131. [Google Scholar] [CrossRef]
- Thudt, A.; Walny, J.; Gschwandtner, T.; Dykes, J.; Stasko, J. Exploration and Explanation in Data-Driven Storytelling. In Data-Driven Storytelling; A K Peters/CRC Press: Boca Raton, FL, USA, 2018; pp. 59–83. [Google Scholar] [CrossRef]
- Ryan, M.-L. Narrative Across Media: The Language of Storytelling; University of Nebraska Press: Lincoln, NE, USA; London, UK, 2004. [Google Scholar]
- Azuma, R.; Baillot, Y.; Behringer, R.; Feiner, S.; Julier, S.; MacIntyre, B. Recent Advances in Augmented Reality. IEEE Comput. Graph. Appl. 2001, 21, 34–47. [Google Scholar] [CrossRef] [Green Version]
- Rieser, M. Artistic Explorations: Mobile, Locative and Hybrid Narratives. In Interactive Digital Narrative—History, Theory and Practice; Koenitz, H., Ferri, G., Haahr, M., Sezen, D., Sezen, T.İ., Eds.; Taylor & Francis: New York, NY, USA; London, UK, 2015; pp. 241–257. [Google Scholar]
- MacIntyre, B.; Bolter, J.D.; Moreno, E.; Hannigan, B. Augmented Reality as a New Media Experience. In Proceedings of the IEEE and ACM International Symposium on Augmented Reality, New York, NY, USA, 29–30 October 2001; pp. 197–206. [Google Scholar] [CrossRef] [Green Version]
- Liestøl, G. Augmented Reality Storytelling—Narrative Design and Reconstruction of a Historical Event in Situ. Int. J. Interact. Mob. Technol. IJIM 2019, 13, 196. [Google Scholar] [CrossRef]
- Lee, B.; Riche, N.H.; Isenberg, P.; Carpendale, S. More Than Telling a Story: Transforming Data into Visually Shared Stories. IEEE Comput. Graph. Appl. 2015, 35, 84–90. [Google Scholar] [CrossRef] [PubMed] [Green Version]
- Figueiras, A.R.d.P. How to Tell Stories Using Visualization: Strategies towards Narrative Visualization. Ph.D. Thesis, Universidade Nova de Lisboa, Lisboa, Portugal, 2016. [Google Scholar]
- Ma, K.L.; Liao, I.; Frazier, J.; Hauser, H.; Kostis, H.N. Scientific Storytelling Using Visualization. IEEE Comput. Graph. Appl. 2012, 32, 12–19. [Google Scholar] [CrossRef] [PubMed]
- Bastiras, J.; Thomas, B.H. Combining Virtual Reality and Narrative Visualisation to Persuade. In Proceedings of the 2017 International Symposium on Big Data Visual Analytics (BDVA), Adelaide, SA, Australia, 7–10 November 2017; pp. 1–8. [Google Scholar] [CrossRef]
- Isenberg, P.; Lee, B.; Qu, H.; Cordeil, M. Immersive Visual Data Stories. In Lecture Notes in Computer Science; Including Subseries Lecture Notes in Artificial Intelligence and Lecture Notes in Bioinformatics; Springer: Cham, Switzerland, 2018; Volume 11190, pp. 165–184. [Google Scholar] [CrossRef]
- Marques, A.B.; Branco, V.; Costa, R.; Costa, N. Data Visualization in Hybrid Space—Constraints and Opportunities for Design. In Advances in Design and Digital Communication III—Proceedings of the 6th International Conference on Design and Digital Communication, Digicom 2022; Martins, N., Brandão, D., Eds.; Springer: Barcelos, Portugal, 2022. [Google Scholar]
- Ryan, M.-L. Emotional and Strategic Conceptions of Space in Digital Narratives. In Interactive Digital Narrative—History, Theory and Practice; Koenitz, H., Ferri, G., Haahr, M., Sezen, D., Sezen, T.İ., Eds.; Taylor & Francis: New York, NY, USA; London, UK, 2015; pp. 106–120. [Google Scholar]
- Tong, C.; Roberts, R.; Borgo, R.; Walton, S.; Laramee, R.; Wegba, K.; Lu, A.; Wang, Y.; Qu, H.; Luo, Q.; et al. Storytelling and Visualization: An Extended Survey. Information 2018, 9, 65. [Google Scholar] [CrossRef] [Green Version]
- Esser, F.; Vliegenthart, R. Comparative Research Methods. In The International Encyclopedia of Communication Research Methods; Wiley: Hoboken, NJ, USA, 2017; pp. 1–22. [Google Scholar] [CrossRef] [Green Version]
- Aitamurto, T.; Aymerich-Franch, L.; Saldivar, J.; Kircos, C.; Sadeghi, Y.; Sakshuwong, S. Examining Augmented Reality in Journalism: Presence, Knowledge Gain, and Perceived Visual Authenticity. New Media Soc. 2022, 24, 1281–1302. [Google Scholar] [CrossRef]
- Tejedor-Calvo, S.; Romero-Rodríguez, L.M.; Moncada-Moncada, A.-J.; Alencar-Dornelles, M. Journalism That Tells the Future: Possibilities and Journalistic Scenarios for Augmented Reality. Prof. Inf. 2020, 29, 6. [Google Scholar] [CrossRef]
- Van Pavlik, J.; Bridges, F. The Emergence of Augmented Reality (AR) as a Storytelling Medium in Journalism. J. Commun. Monogr. 2013, 15, 4–59. [Google Scholar] [CrossRef]
- Marques, A.B. AR Data Storytelling. Zenodo 2022, 2022, 7331412. [Google Scholar] [CrossRef]
- Herman, D.; Jahn, M.; Ryan, M.-L. Routledge Encyclopedia of Narrative Theory, 1st ed.; Routledge: Oxfordshire, UK, 2005. [Google Scholar]
- Bolter, J.D.; Grusin, R. Remediation: Understanding New Media; The MIT Press: Cambridge, MA, USA; London, UK, 1999. [Google Scholar]
- USA Today. Step Inside the Crime Scene at the Heart of “Accused”, Season 4’. Available online: https://eu.usatoday.com/story/augmented-reality/2022/01/24/interactivestory-experienceid-accusedusat/6620625001/ (accessed on 27 September 2022).
- USA Today. Kent State Shootings: A Day of Tragedy. Available online: https://eu.usatoday.com/story/augmented-reality/2020/05/01/interactivestory-experienceid-kentstate/3047603001/ (accessed on 27 September 2022).
- USA Today. Journey Into the Body to See COVID Vaccine at Work. Available online: https://eu.usatoday.com/story/augmented-reality/2021/01/27/interactivestory-experienceid-mrna/6701446002/ (accessed on 27 September 2022).
- New York Times. Monsters That Live on You. Available online: https://www.nytimes.com/interactive/2018/10/25/multimedia/bugs-halloween-kids-ar-ul.html (accessed on 27 September 2022).
- New York Times. See How the World’s Most Polluted Air Compares with Your City’s. Available online: https://www.nytimes.com/interactive/2019/12/02/climate/air-pollution-compare-ar-ul.html (accessed on 27 September 2022).
- National Geographic. The World in 2070. Available online: https://www.nationalgeographic.com/pages/article/earth-day-instagram-ar-experience (accessed on 27 September 2022).
- USA Today. Woman’s Suffrage: Famous Speeches Come to Life. Available online: https://eu.usatoday.com/story/augmented-reality/2020/07/16/interactivestory-experienceid-suffrage/3134483001/ (accessed on 27 September 2022).
- New York Times. Augmented Reality: Four of the Best Olympians, as You’ve Never Seen Them. Available online: https://www.nytimes.com/interactive/2018/02/05/sports/olympics/ar-augmented-reality-olympic-athletes-ul.html (accessed on 27 September 2022).
- Washington Post. Scale a 50-Foot Speed Climbing Wall in Augmented Reality. Available online: https://www.washingtonpost.com/sports/olympics/interactive/2021/sport-climbing-brooke-raboutou-augmented-reality/ (accessed on 27 September 2022).
- New York Times. Gymnastics in Tokyo. Available online: https://www.nytimes.com/interactive/2021/sports/olympics/suni-lee-gymnastics.html (accessed on 27 September 2022).
- Masud, L.; Valsecchi, F.; Ciuccarelli, P.; Ricci, D.; Caviglia, G. From Data to Knowledge—Visualizations as Transformation Processes within the Data-Information-Knowledge Continuum. In Proceedings of the 2010 14th International Conference Information Visualisation, London, UK, 26–29 July 2010; pp. 445–449. [Google Scholar] [CrossRef]
- New York Times. Take a Tour of Lady Liberty’s Torch. Available online: https://www.nytimes.com/interactive/2018/11/13/nyregion/statue-of-liberty-torch-ar-ul.html (accessed on 27 September 2022).
- National Geographic. Deinonychus. Available online: https://www.nationalgeographic.com/magazine/article/reimagining-dinosaurs-prehistoric-icons-get-a-modern-reboot-interactive-feature (accessed on 27 September 2022).
- New York Times. What Will the Megastorm’s Rain Look Like? Available online: https://www.nytimes.com/interactive/2022/08/12/climate/california-rain-storm.html (accessed on 27 September 2022).
- New York Times. Inflation Shrinking Ray. Available online: https://www.nytimes.com/interactive/2022/04/20/business/inflation-shrink-ray.html?shared=1 (accessed on 27 September 2022).
- New York Times. Step Inside the Thai Cave in Augmented Reality. Available online: https://www.nytimes.com/interactive/2018/07/21/world/asia/thai-cave-rescue-ar-ul.html?mtrref=www.google.com&gwh=20B4938FE47F02B62FDAF2C714F48BCF&gwt=pay&assetType=PAYWALL (accessed on 27 September 2022).
- New York Times. EV Battery Breakdown. Available online: https://www.nytimes.com/interactive/2022/08/19/business/electric-vehicle-battery-made.html (accessed on 27 September 2022).
- Hullman, J.; Drucker, S.; Henry Riche, N.; Lee, B.; Fisher, D.; Adar, E. A Deeper Understanding of Sequence in Narrative Visualization. IEEE Trans. Vis. Comput. Graph. 2013, 19, 2406–2415. [Google Scholar] [CrossRef] [PubMed]
- Ryan, M.-L. The Many Forms of Interactivity. In Narrative as Virtual Reality 2: Revisiting Immersion and Interactivity in Literature and Eletronic Media; John Hopkins University Press: Baltimore, MD, USA, 2015. [Google Scholar]
- USA Today. Notre Dame: After the Fire. Available online: https://eu.usatoday.com/story/augmented-reality/2019/08/27/interactivestory-experienceid-notredame/2083634001/ (accessed on 27 September 2022).
- USA Today. Explore Mars Perseverance Rover in Augmented Reality. Available online: https://eu.usatoday.com/story/augmented-reality/2021/02/12/interactivestory-experienceid-mars/4452739001/ (accessed on 27 September 2022).
- USA Today. Sport Climbing with Kyra Condie. Available online: https://eu.usatoday.com/story/augmented-reality/2021/07/19/interactivestory-experienceid-climb/7800474002/ (accessed on 27 September 2022).
- USA Today. Capitals’ John Carlson Discusses the All-Star Game. Available online: https://eu.usatoday.com/story/augmented-reality/2019/08/27/interactivestory-experienceid-carlson/2122972001/ (accessed on 27 September 2022).
- USA Today. Statues Bring Suffrage History to You in Augmented Reality. Available online: https://eu.usatoday.com/story/augmented-reality/2020/08/13/interactivestory-experienceid-suffragestatues/3358813001/ (accessed on 27 September 2022).
- Florida Today. 321 Launch—Falcon 9. Available online: https://www.321launchapp.com/ (accessed on 27 September 2022).
- New York Times. Election Forecasts. Available online: https://rd.nytimes.com/projects/augmented-reality-storytelling#election-forecast (accessed on 27 September 2022).
Figure 1.
Exploration and explanation as complementary instances, as proposed by Thudt et al. [8].
Figure 1.
Exploration and explanation as complementary instances, as proposed by Thudt et al. [8].

Figure 2.
Types of narrative structures found in the case studies.

Figure 3.
Types of combinations between different narrative structures.

Table 1.
Dimensions of a narrative visualization and strategies for flexibility and interpretation [15]. Functional equivalents to search for in the case studies.
Table 1.
Dimensions of a narrative visualization and strategies for flexibility and interpretation [15]. Functional equivalents to search for in the case studies.
| Dimension | Aspects Addressed | Functional Equivalents | Strategies for Flexibility (Without AR) | Strategies for Interpretation (Without AR) |
|---|---|---|---|---|
| View | The ways in which data is shown to the reader, including the available encodings and any transformations made on the data (such as normalization or aggregation). | Strategies for the visual encoding of data. Strategies for reader-driven visual encoding. | Multiple separate views (to highlight different aspects of the data); Multiple coordinated views; Animated transitions; Reader-driven visual encoding. | Choice of representation: visual encoding (color, media, etc.); Choice of how data is represented (data aggregation, data normalization); Use of visual metaphors. |
| Focus | The subject of the story, the particular set or subset of data shown, and the aspects of data that are shown. | Strategies allowing the user to select a particular set of the data shown. | Allow readers to view different subsets of the data or decide which attributes to show. Interaction techniques that allow the reader to change focus: filtering, selecting, zooming/panning, drill down. | Guiding the focus of the reader specifically to the aspects that support the story; Highlight and annotations; Fading out or omitting data that is not directly relevant to the interpretation. |
| Sequence | The order in which the information in the story can be viewed. | Types of narrative structure. Strategies allowing the user to choose the narrative order. | Ways that allow readers to determine order or aspects of order. Flexible methods that allow a reader to explore freely typically permit the reader to jump to different visualizations in any order. | Interface controls that support interpretation: Step-by-step (stepper); scrolling (scrolly-telling); Panning and zooming. |
Table 2.
Summary of the strategies found concerning view, focus and sequence.
| Dimension | Strategies | Count | Cases (Nr.) | ||
|---|---|---|---|---|---|
| View | Mockup/Diorama | 15 | 11, 14, 18, 21, 26, 28, 42, 47, 49, 50, 51, 54, 56, 57, 62 | ||
| Microscopic or atomic representation | 6 | 10, 23, 34, 45, 47, 59 | |||
| 3D Astronomic representation | 6 | 12, 25, 33, 41, 43, 50 | |||
| Traditional narrative form | 1 | 1 | |||
| Real person | 4 | 7, 53, 56, 57 | |||
| Human activity/performance | 3 | 35, 65, 66 | |||
| Full Scale real artifact | 13 | 15, 32, 33, 37, 43, 44, 46, 47, 52, 55, 57, 58, 67 | |||
| Full scale animal | 2 | 27, 39 | |||
| Natural phenomenon | 2 | 16, 36 | |||
| Quantitative data representation | 5 | 13, 38, 40, 49, 69 | |||
| Two-dimensional area, size or configuration | 2 | 9, 22 | |||
| Focus | Selecting | 26 | 7, 10, 12, 13, 18, 25, 26, 28, 33, 38, 39, 40, 42, 43, 44, 46, 48, 50, 51, 52, 53, 54, 56, 57, 59, 62 | ||
| Filter | 1 | 23 | |||
| Searching Tool | 1 | 23 | |||
| Sequence | Narrative Order | Linear | 24 | 9, 11, 13, 14, 15, 16, 21, 22, 27, 32, 34, 35, 36, 37, 41, 45, 47, 49, 55, 58, 65, 66, 67, 69 | |
| Non-linear | 26 | 7, 10, 12, 18, 23, 25, 26, 28, 33, 38, 39, 40, 42, 43, 44, 46, 48, 50, 51, 52, 53, 54, 56, 57, 59, 62 | |||
| Narrative Sequence | Structure Type | Linear structure | 20 | 9, 11, 14, 15, 16, 21, 27, 32, 34, 35, 36, 41, 45, 47, 49, 55, 65, 66, 67, 69 | |
| Linear structure variation | 4 | 13, 22, 37, 58 | |||
| Time parallel linear structure | 1 | 28 | |||
| Flow chart | 1 | 23 | |||
| Complete graph | - | Complete graph only occurs in combination with other types of structure. | |||
| Combined Narrative Structures | Linear path leading to complete graph. | 6 | 12, 25, 26, 39, 46, 51 | ||
| Sequence of linear events interrupted by a complete graph. | 3 | 43, 54, 59 | |||
| A succession of linear events interspersed by complete graphs. | 8 | 7, 33, 38, 42, 50, 56, 57, 62 | |||
| Initial linear event followed by a succession of complete graphs. | 1 | 53 | |||
| Action-Space | 6 | 10, 18, 40, 44, 48, 52 | |||
| User Intervention | User Intervention Type | (A) The user controls the framing of the view, controls the way of seeing. | 50 | All cases | |
| (B) The user progresses through the narrative and/or activates an animation. | 46 | All except 25, 27, 39, 51 | |||
| (C) Although the user only progresses through the narrative and/or activates an animation, there is a simulation of greater control of the narrative. | 3 | 13, 43, 54 | |||
| (D) The materials that make up the narrative are totally predetermined, but their order is variable and chosen by the user. | 25 | 7, 10, 12, 18, 25, 26, 28, 33, 38, 39, 40, 42, 43, 44, 46, 48, 50, 51, 52, 53, 54, 56, 57, 59, 62 | |||
| (E) The user chooses a certain narrative path, but the ending is always the same regardless of his choice. | 1 | 23 | |||
| Combined User Intervention | AB | 22 | 9, 11, 14, 15, 16, 21, 22, 32, 34, 35, 36, 37, 41, 45, 47, 49, 55, 58, 65, 66, 67, 69 | ||
| ABD | 20 | 7, 10, 12, 18, 26, 28, 33, 38, 40, 42, 44, 46, 48, 50, 52, 53, 56, 57, 59, 62 | |||
| AD | 3 | 25, 39, 51 | |||
| ABCD | 2 | 43, 54 | |||
| ABE | 1 | 23 | |||
| ABC | 1 | 13 | |||
| A | 1 | 27 | |||
Publisher’s Note: MDPI stays neutral with regard to jurisdictional claims in published maps and institutional affiliations. |
© 2022 by the authors. Licensee MDPI, Basel, Switzerland. This article is an open access article distributed under the terms and conditions of the Creative Commons Attribution (CC BY) license (https://creativecommons.org/licenses/by/4.0/).
Share and Cite
MDPI and ACS Style
Marques, A.B.; Branco, V.; Costa, R. Narrative Visualization with Augmented Reality. Multimodal Technol. Interact. 2022, 6, 105. https://0-doi-org.brum.beds.ac.uk/10.3390/mti6120105
AMA Style
Marques AB, Branco V, Costa R. Narrative Visualization with Augmented Reality. Multimodal Technologies and Interaction. 2022; 6(12):105. https://0-doi-org.brum.beds.ac.uk/10.3390/mti6120105
Chicago/Turabian StyleMarques, Ana Beatriz, Vasco Branco, and Rui Costa. 2022. "Narrative Visualization with Augmented Reality" Multimodal Technologies and Interaction 6, no. 12: 105. https://0-doi-org.brum.beds.ac.uk/10.3390/mti6120105