1. Introduction
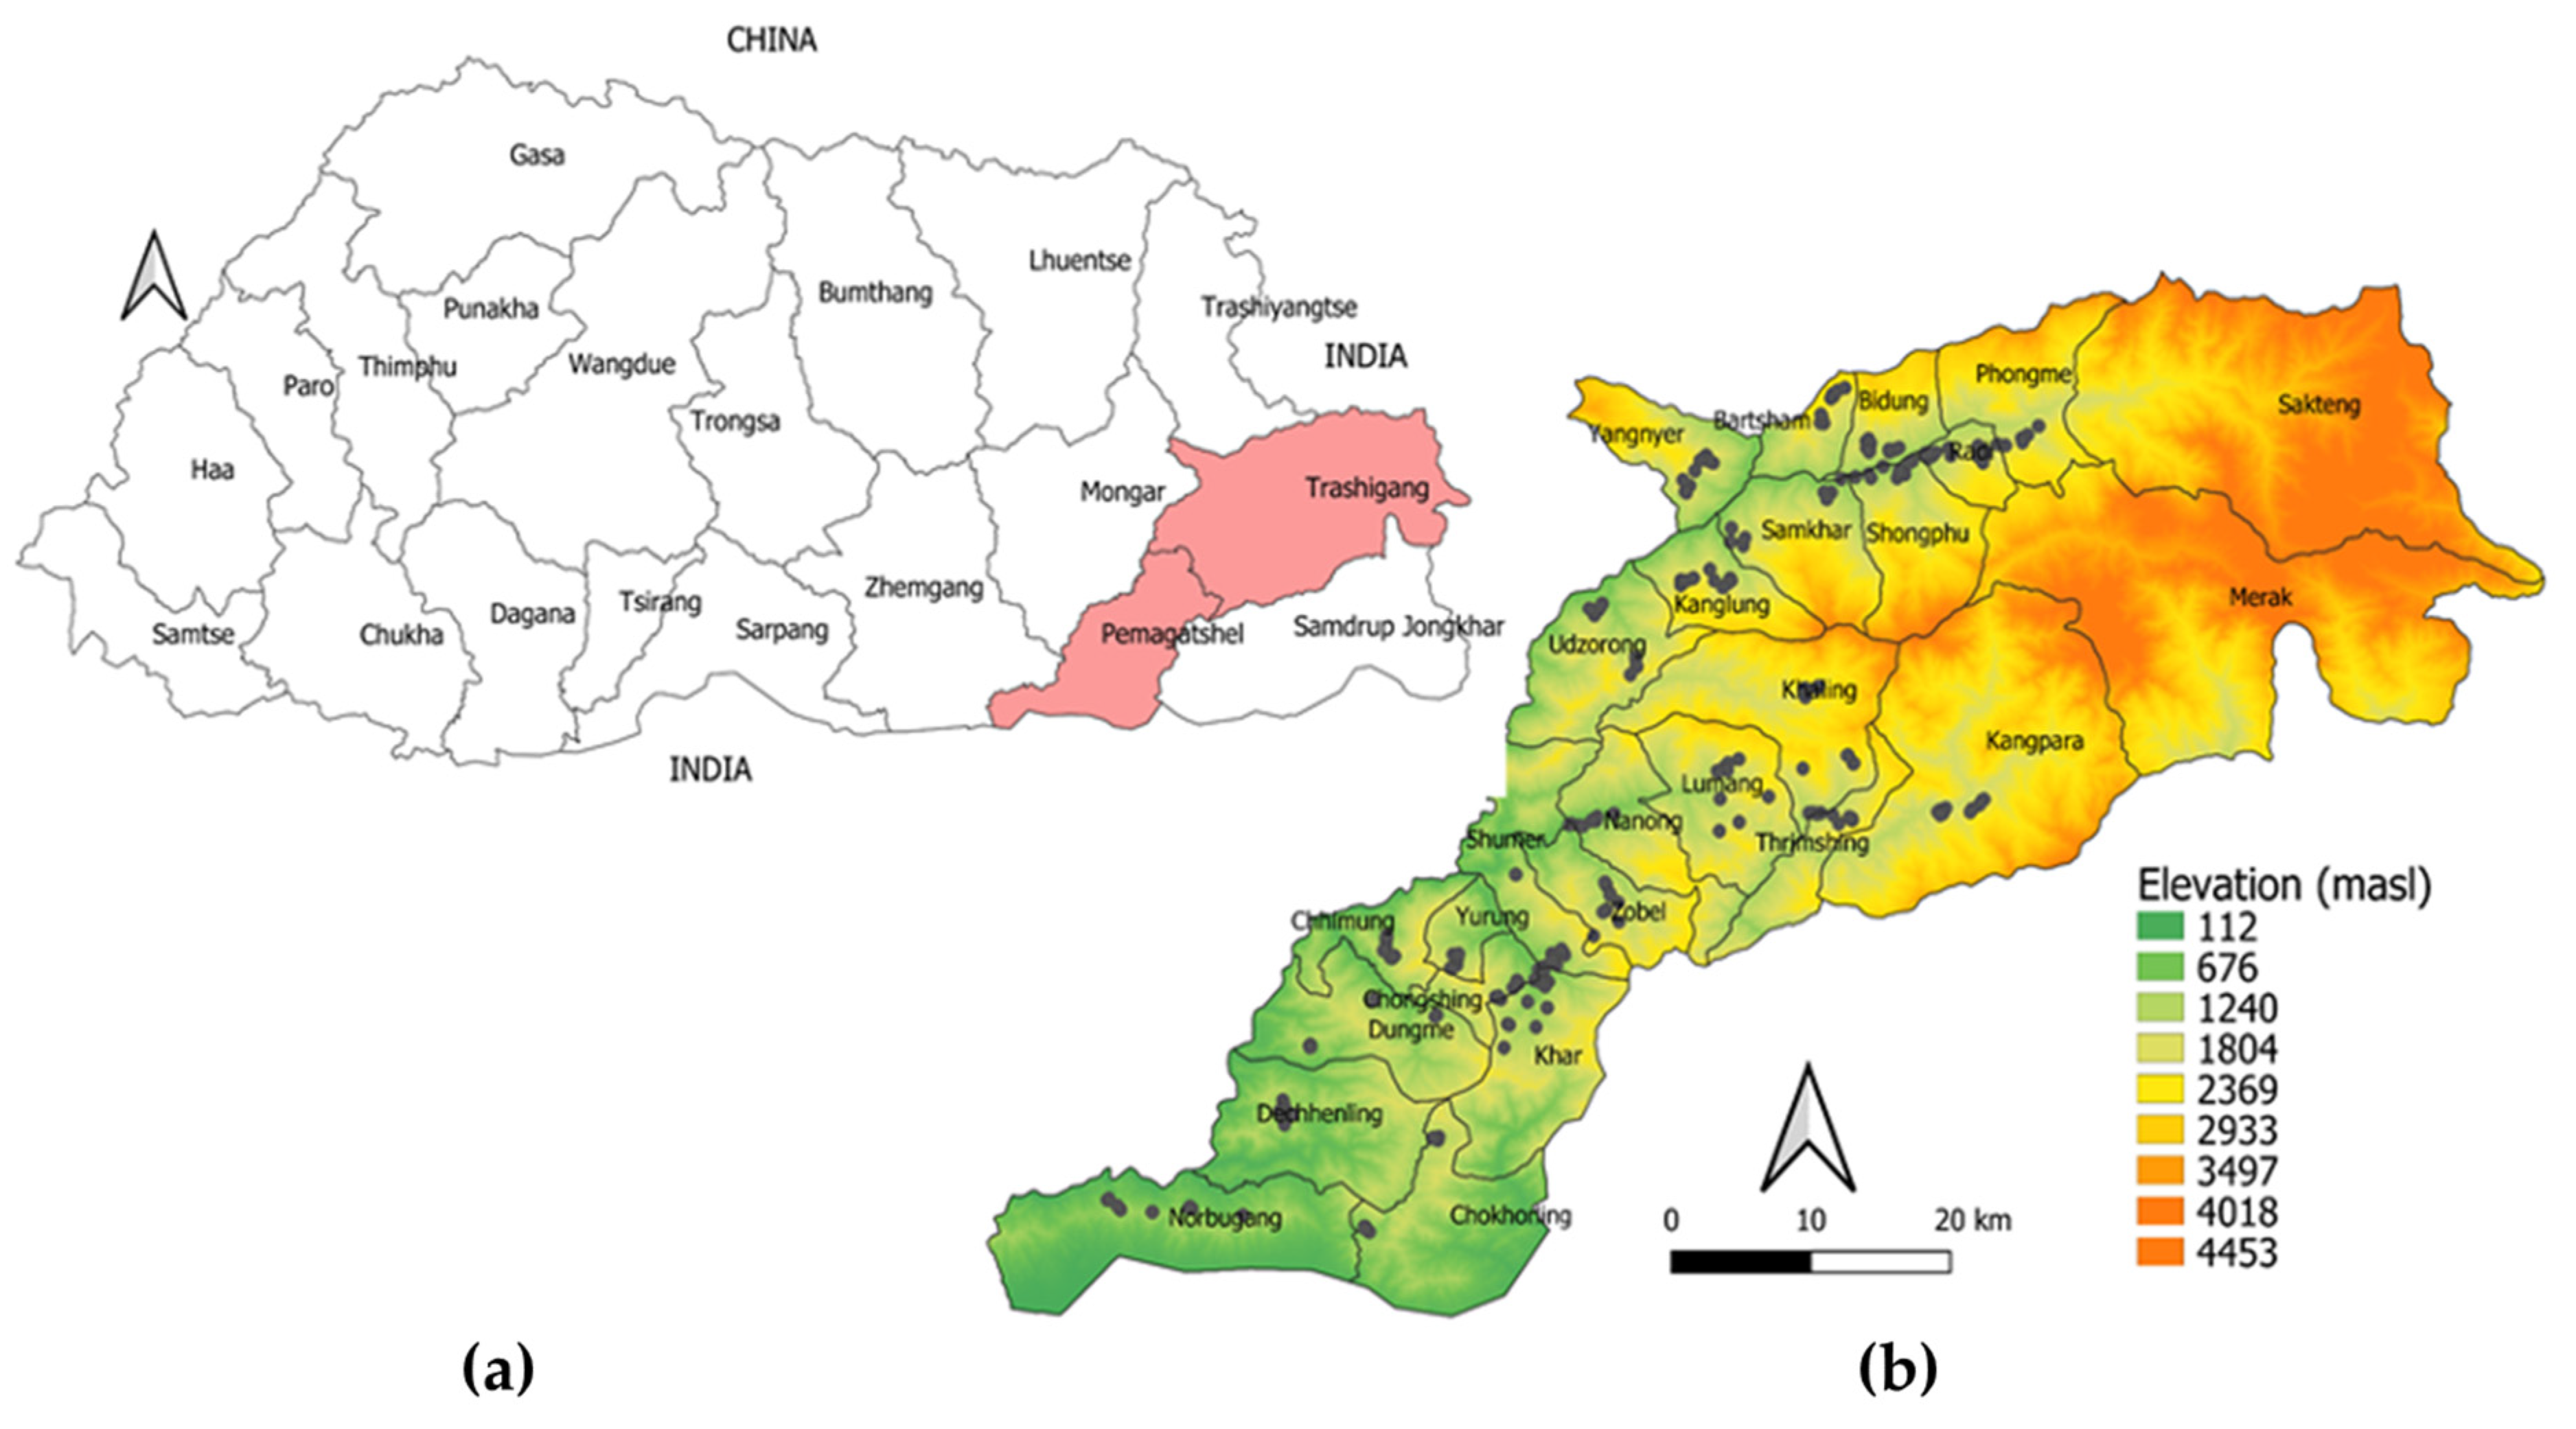
Bhutan is a small kingdom located in the Eastern Himalayas between latitudes 26°45′ N and 28°10′ N, and longitudes 88°45′ E and 92°10′ E. It shares borders with China to the north, the Indian states of Assam and West Bengal to the south, Arunachal Pradesh to the east, and Sikkim to the west. It has a total land area of 38,394 km
2, out of which 70.8% is covered by forest mainly dominated by broadleaf and mixed conifers [
1]. It is divided administratively into 20 districts (dzongkhags) and 205 subdistricts (gewogs). The population is 735,553 (as of 30 May 2017), of which 62.2% lives in rural areas, and their livelihoods depend on agriculture and livestock farming [
2]. Geographically, the country is characterized by high mountains, dense forests, and fast-flowing rivers that form narrow valleys before flowing out onto the vast north Indian plains. There is a pronounced south–north elevation gradient (100–7500 m above sea level (masl)) and an inverse north–south precipitation gradient (500 to >2000 mm) [
1,
3]. This extreme variation in altitude and the impact of the North Indian monsoon have resulted in extremely diverse climatic conditions and ecosystems across the country, resulting in six agroecological zones (wet subtropical, humid subtropical, dry subtropical, warm temperate, cool temperate, and alpine) [
4]. Vegetation coverage, cropping system, land use, and livestock farming are mainly determined by these agroecological zones.
Livestock farming plays an important role in the rural economy of Bhutan. It not only provides the major income for 49.1% of the population who are subsistence farmers [
2] but also contributes toward meeting the increasing demands for dairy products in the country. Cattle, including yaks (
Bos grunniens L.) and mithuns (
Bos frontalis Lambert), are the predominant livestock farmed with the population of 0.35 million [
5]. They are the most important livestock farmed with their diverse role in providing milk, draught power, transport, and organic manure [
6]. The crossbreeds of local indigenous Siri cattle (
Bos taurus indicus L.) and mithun comprise 56% of the total cattle population while European breeds (
Bos taurus taurus L.) such as Jersey, Brown Swiss, and Holstein Friesian form 30%. The yaks and their crossbreeds comprise 14% of the country’s cattle population [
5].
Tick infestation is a significant challenge for the livestock sector in Bhutan due to direct and indirect impacts on cattle health and production [
7]. In 2019, 89% of the parasite related cases reported in cattle were due to tick infestation, and 42% of the cattle in the country were reported to have been treated for it, costing the government approximately 3.18 million Bhutanese Ngultrum (1 USD = Nu.70) for purchasing acaricides alone [
8]. Tick-borne diseases like anaplasmosis, babesiosis, and theileriosis are also present in cattle in Bhutan, especially in the southern subtropical districts [
7,
8]. Despite ticks being prevalent throughout the country, there is currently limited data available on tick diversity, infestation prevalence, tick ecology, and geographic distribution. Current knowledge consists of one unpublished study conducted over a period of one year in cattle in Eastern Bhutan (Dr. Susan C. Cork, personal communication, 2018) and one government report [
9] from Western Bhutan. The unpublished study may be the first to identify some tick species present on cattle in Bhutan. They reported
Rhipicephalus microplus (Canestrini) as the most predominant tick species with
Haemaphysalis spp. and
Hyalomma spp. identified to the genus level. The other study by the Regional Livestock Development Center [
9] in Western Bhutan identified the genera
Rhipicephalus (
Boophilus) spp.,
Rhipicephalus spp.,
Haemaphysalis spp.,
Ixodes spp., and
Amblyomma spp. but no information on species is available.
In this study, we used targeted field sampling to: (1) determine the presence, diversity, and infestation prevalence of tick species in cattle in two districts of Eastern Bhutan; (2) examine the variation in infestation prevalence of tick species between agroecological zones in Trashigang and Pema Gatshel districts; (3) assess the relationships between cattle, geographic factors, and infestation prevalence using logistic regression analyses; and (4) develop habitat suitability models for tick species identified in Eastern Bhutan, under current environmental conditions, using MaxEnt [
10]. The findings from this study are expected to provide information necessary to initiate and plan a targeted tick control program and to develop enhanced surveillance for ticks and tick-borne diseases in cattle in Bhutan.
4. Discussion
The level of tick infestation in animals is generally influenced by both host and environmental factors. The host (cattle in our study) factors such as age, sex, and breed can influence the susceptibility of animals to tick infestation [
43,
44]. Ticks are also generally dependent on the temperature and rainfall for their development and activity [
16]. In Bhutan, climatic variables such as temperature and rainfall are primarily determined by altitude and latitude [
45]. Thus, in the first part of our study, the relationships between cattle and geographic factors and infestation prevalence were assessed. In the second part, we modeled the relationship between tick species presence and the environmental variables, using the MaxEnt [
10] species distribution modeling to identify environmental factors associated with the geographical distribution of the tick species found in the study area. MaxEnt modeling was selected because it can build a reliable model of species distribution using presence-only data and environmental variables without assuming species absence in locations not sampled or surveyed [
46].
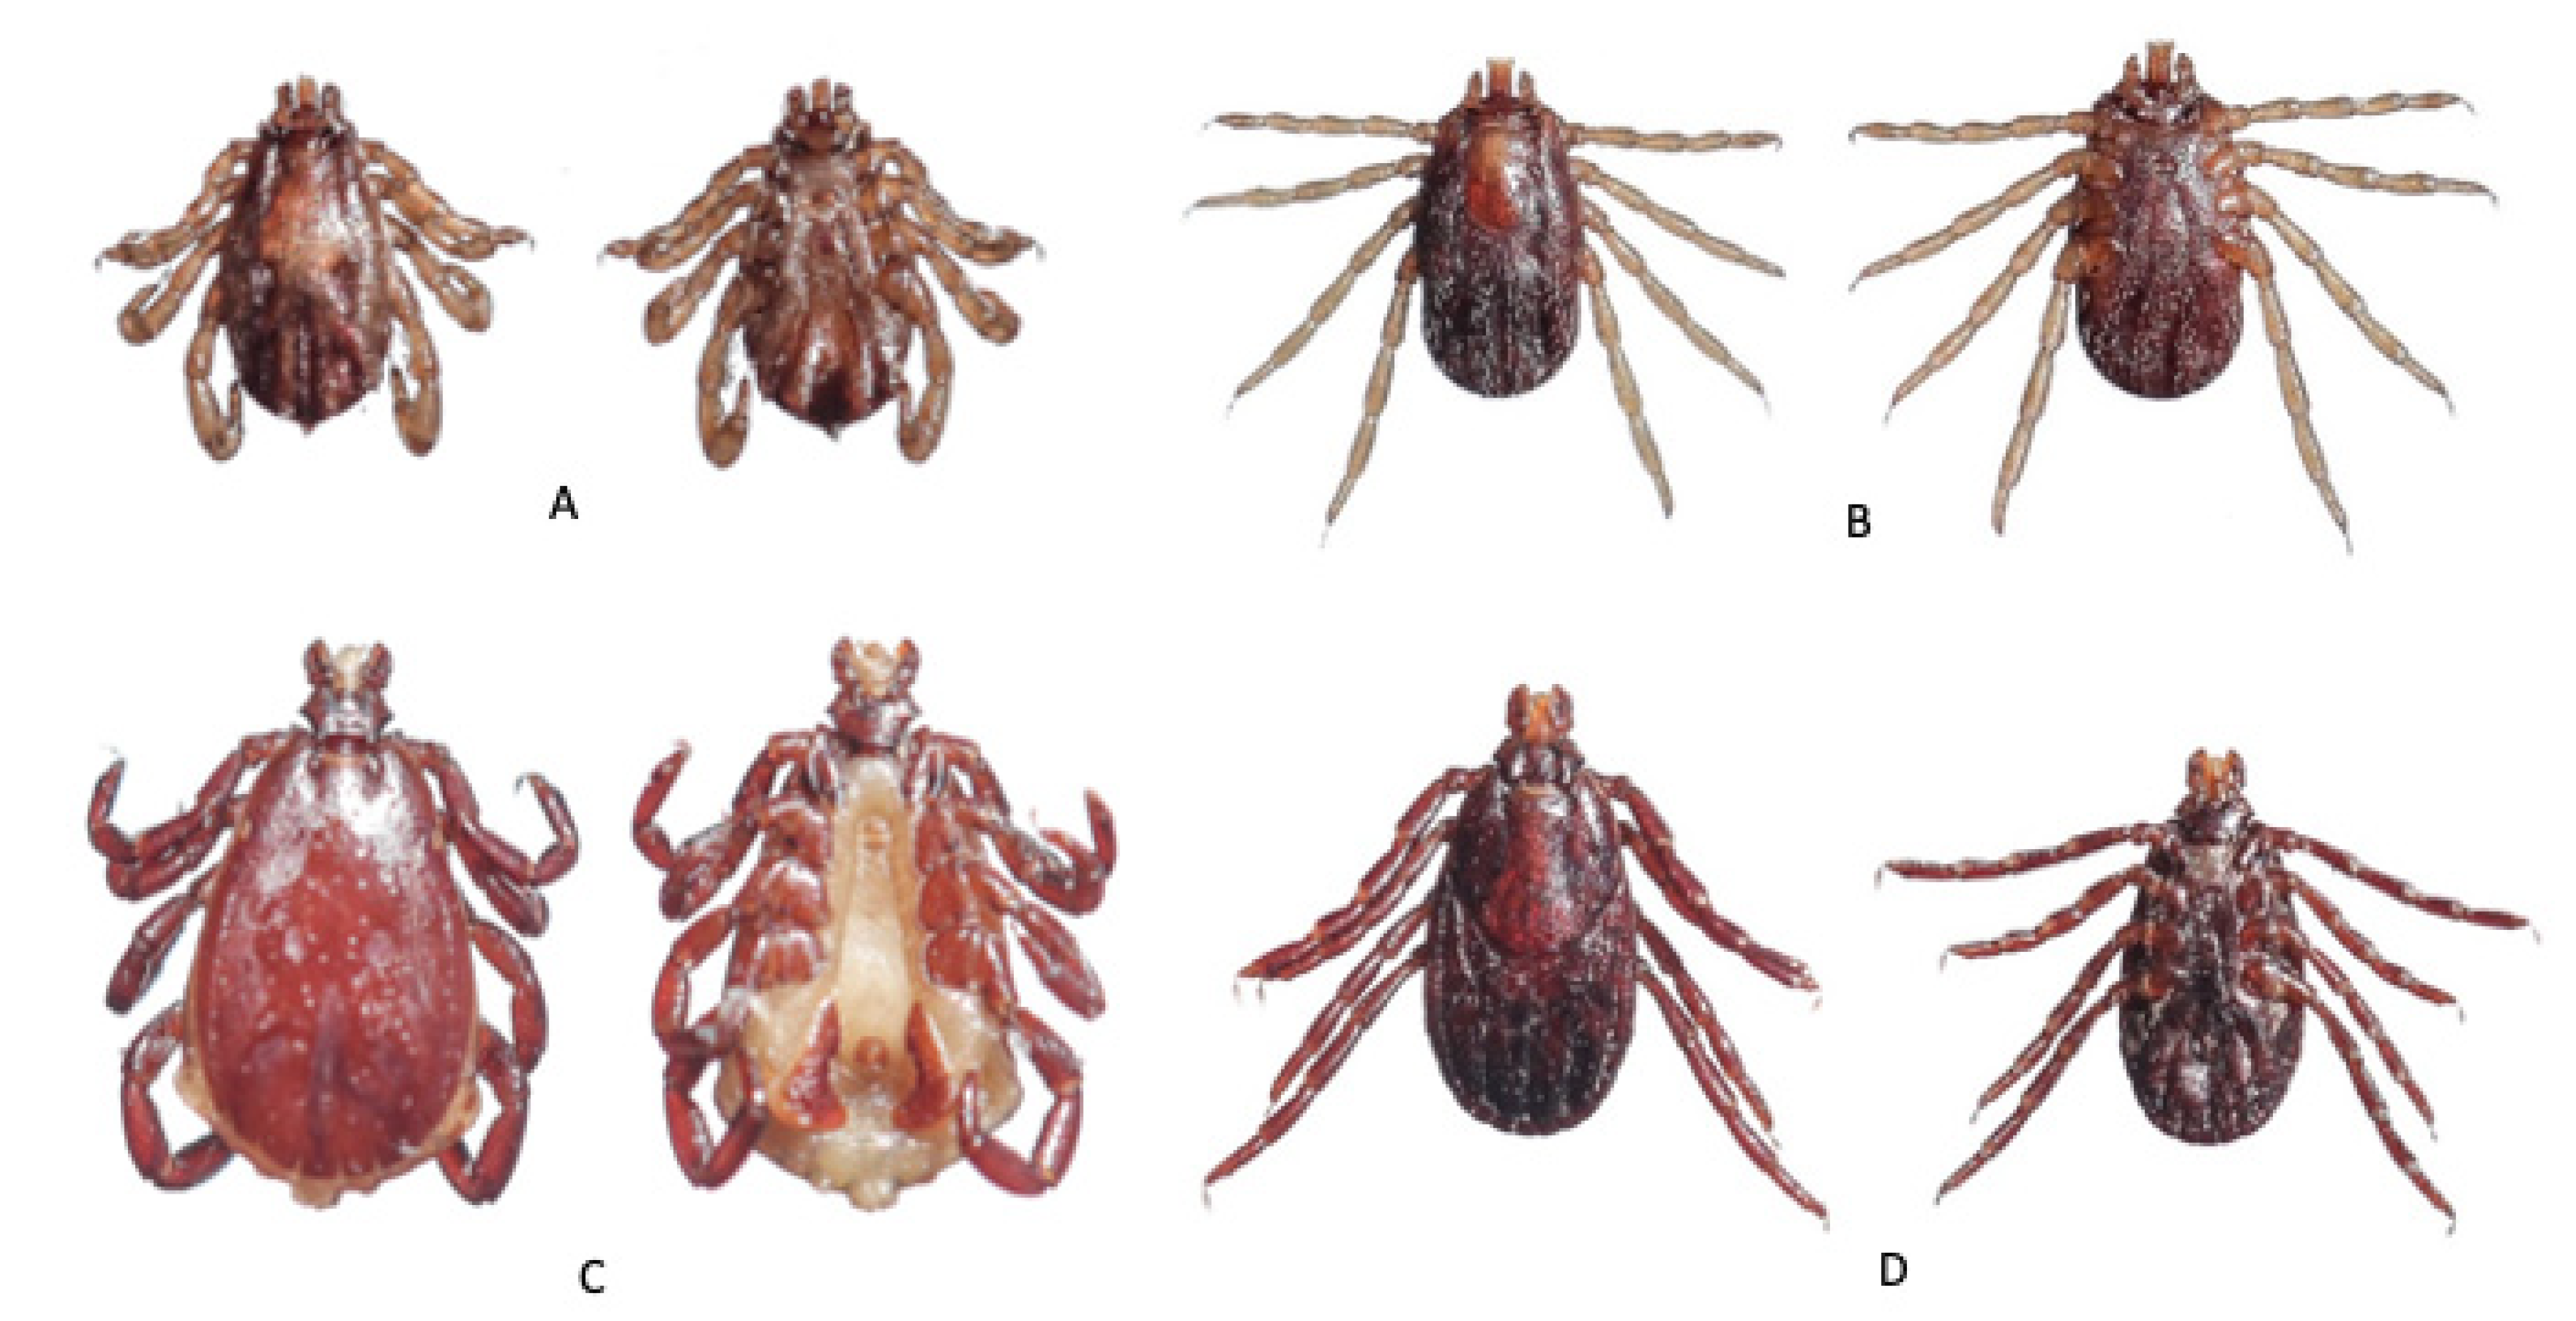
In this study,
R. microplus was found to be the most predominant tick species infesting cattle in Eastern Bhutan (
Table 3) and was collected from all subdistricts. Our study findings agreed with a previous unpublished study, which found
R. microplus to be the primary tick species in cattle in the surveyed areas of eastern Bhutan. Further, a tick survey conducted in the western region of Bhutan also found
R. microplus to be the most prevalent tick species [
9]. This tick species is also one of the most predominant tick species infesting livestock in India [
47]. Moreover, this tick species is distributed throughout the world, especially in tropical and subtropical regions, and considered to be the most important tick species of cattle in the world [
48,
49]. Recently, it was recognized that
R. microplus is a complex species that is comprised of at least five taxa:
R. australis, R. annulatus, R. microplus clade A,
R. microplus clade B, and
R. microplus clade C [
50,
51]. However, the
R. microplus we have collected was identified based on morphological keys [
12,
16], and further studies should be conducted to determine which clade of
R. microplus it belongs to.
Rhipicephalus microplus was found more frequently in animals sampled in Pema Gatshel (98.2%) compared with those sampled in Trashigang (78.3%). Generally, this one-host tick species prefers warm and humid conditions [
52], and temperature and rainfall are the most important climatic factors driving its geographic distribution [
53,
54]. Pema Gatshel, located at the warmer south, has the majority of its area dominated by subtropical climate with higher temperatures, abundant rainfall, and high relative humidity, while Trashigang is mainly characterized by a temperate climate with moderate temperature, rainfall, and relative humidity. This difference in the climatic conditions could be one factor that could have led to the greater prevalence of
R. microplus in Pema Gatshel.
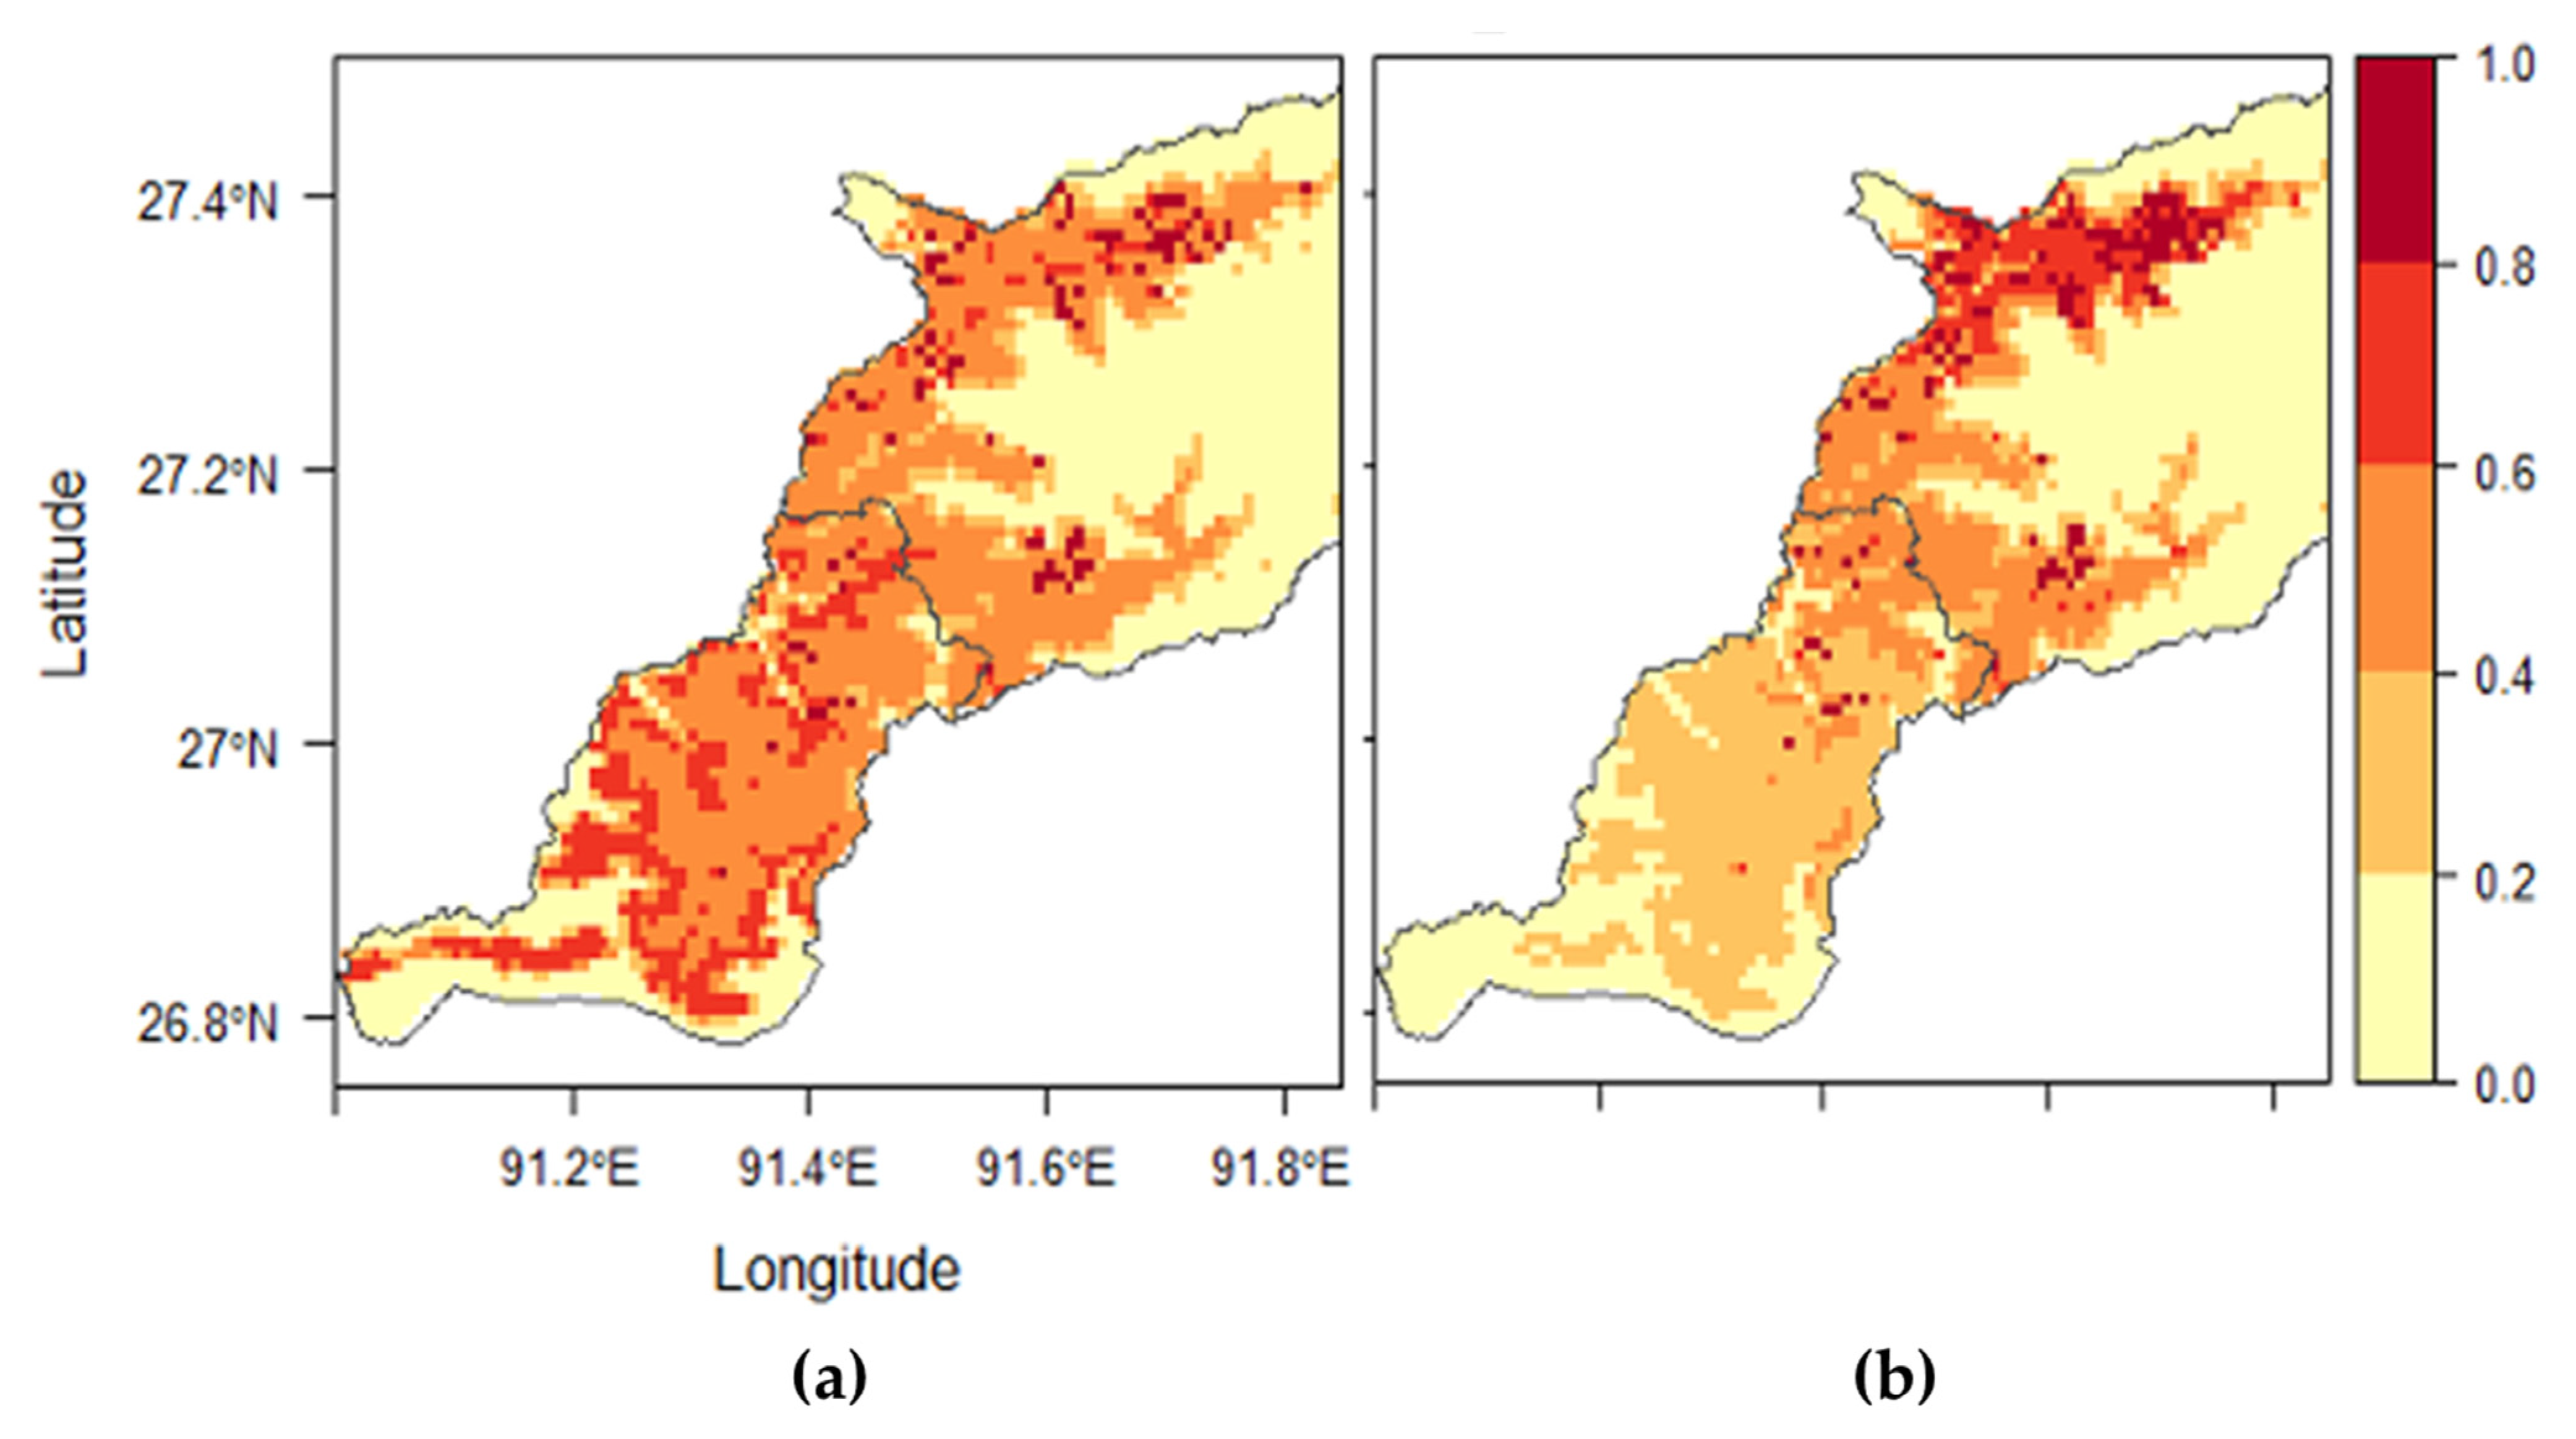
The infestation prevalence of
R. microplus was found to decrease with increasing longitude (
Table 6). Geographically, the longitudes of our study area ranged from 91° to 92° E. The areas between the longitudes 91° and 91.5° E are at an elevation of below 2000 m. Between the longitudes 91.5° and 92° E, the areas are at an elevation of more than 2000 m. This variation in elevation toward the east with increasing longitude could be the reason for the decrease in
R. microplus infestation as
R. microplus is known to avoid higher altitudes such as mountains and plateaus, where low temperatures are prevalent [
55,
56]. Elevation was also found as the most important environmental variable in the best habitat suitability model generated for
R. microplus. The highest probability of its occurrence corresponded to the low elevation range (500–1000 masl) and decreased after that threshold. This elevation range corresponds to the humid subtropical zone (600–1200 masl) in Bhutan, characterized by an annual mean temperature of 19.5 °C and an annual rainfall of 1200–2500 mm [
1]. This agrees with a study from Zimbabwe, where elevation was found as the most influential factor for the geographic distribution of
R. microplus and
R. decoloratus [
54]. In Bhutan, areas with higher elevation are characterized by colder temperatures and low rainfalls, and that might result in such areas to be less suitable habitats for
R. microplus.
A greater prevalence of
R. microplus was observed in younger cattle compared with that of adult cattle (
Table 6), which is consistent with the similar studies conducted in the neighboring Indian state of West Bengal [
57], Bangladesh [
58], and Nigeria [
59]. However, studies conducted in Pakistan [
60], Ethiopia [
61], Egypt [
43], and Nigeria [
62] indicated lower prevalence in young cattle due to factors such as frequent grooming by dams and innate immunity. In our study area, those calves that are reared in the stall-fed systems are deprived of grooming as the farmers tether them at a safe distance from their dam to avoid milk suckling. Furthermore, young calves, especially the males, are the least attended by farmers, unlike the milking adult females. In most cattle owning households in the study area, calves and young heifers are often let out for grazing in nearby pastures and forests while milking adults are kept tethered around the homestead. Lack of maternal grooming and free access to pastures and forests likely increase the risk of tick infestation, and this could be the reason for the greater prevalence of
R. microplus in younger animals in this study.
Rhipicephalus haemaphysaloides was the second most predominant tick species in this study (
Table 3) and was collected from 20 subdistricts. This typical three-host tick has a limited geographical distribution in the world [
63]; however, it is widely distributed in the neighboring Indian states bordering Bhutan [
47] and China [
64]. Unlike
R. microplus, the prevalence of
R. haemaphysaloides was greater in animals sampled from Trashigang (56.9%) compared with those sampled in Pema Gatshel (15.4%). It also showed a positive association with latitude indicating northerly distribution in the study area (
Table 6). Trashigang, located toward the north in the study area, is at a higher elevation compared with Pema Gatshel. Temperatures and rainfalls are also comparatively low. Generally, temperature is considered to be the key climatic factor influencing the biological performance of this tick [
63]. However, our findings suggest that
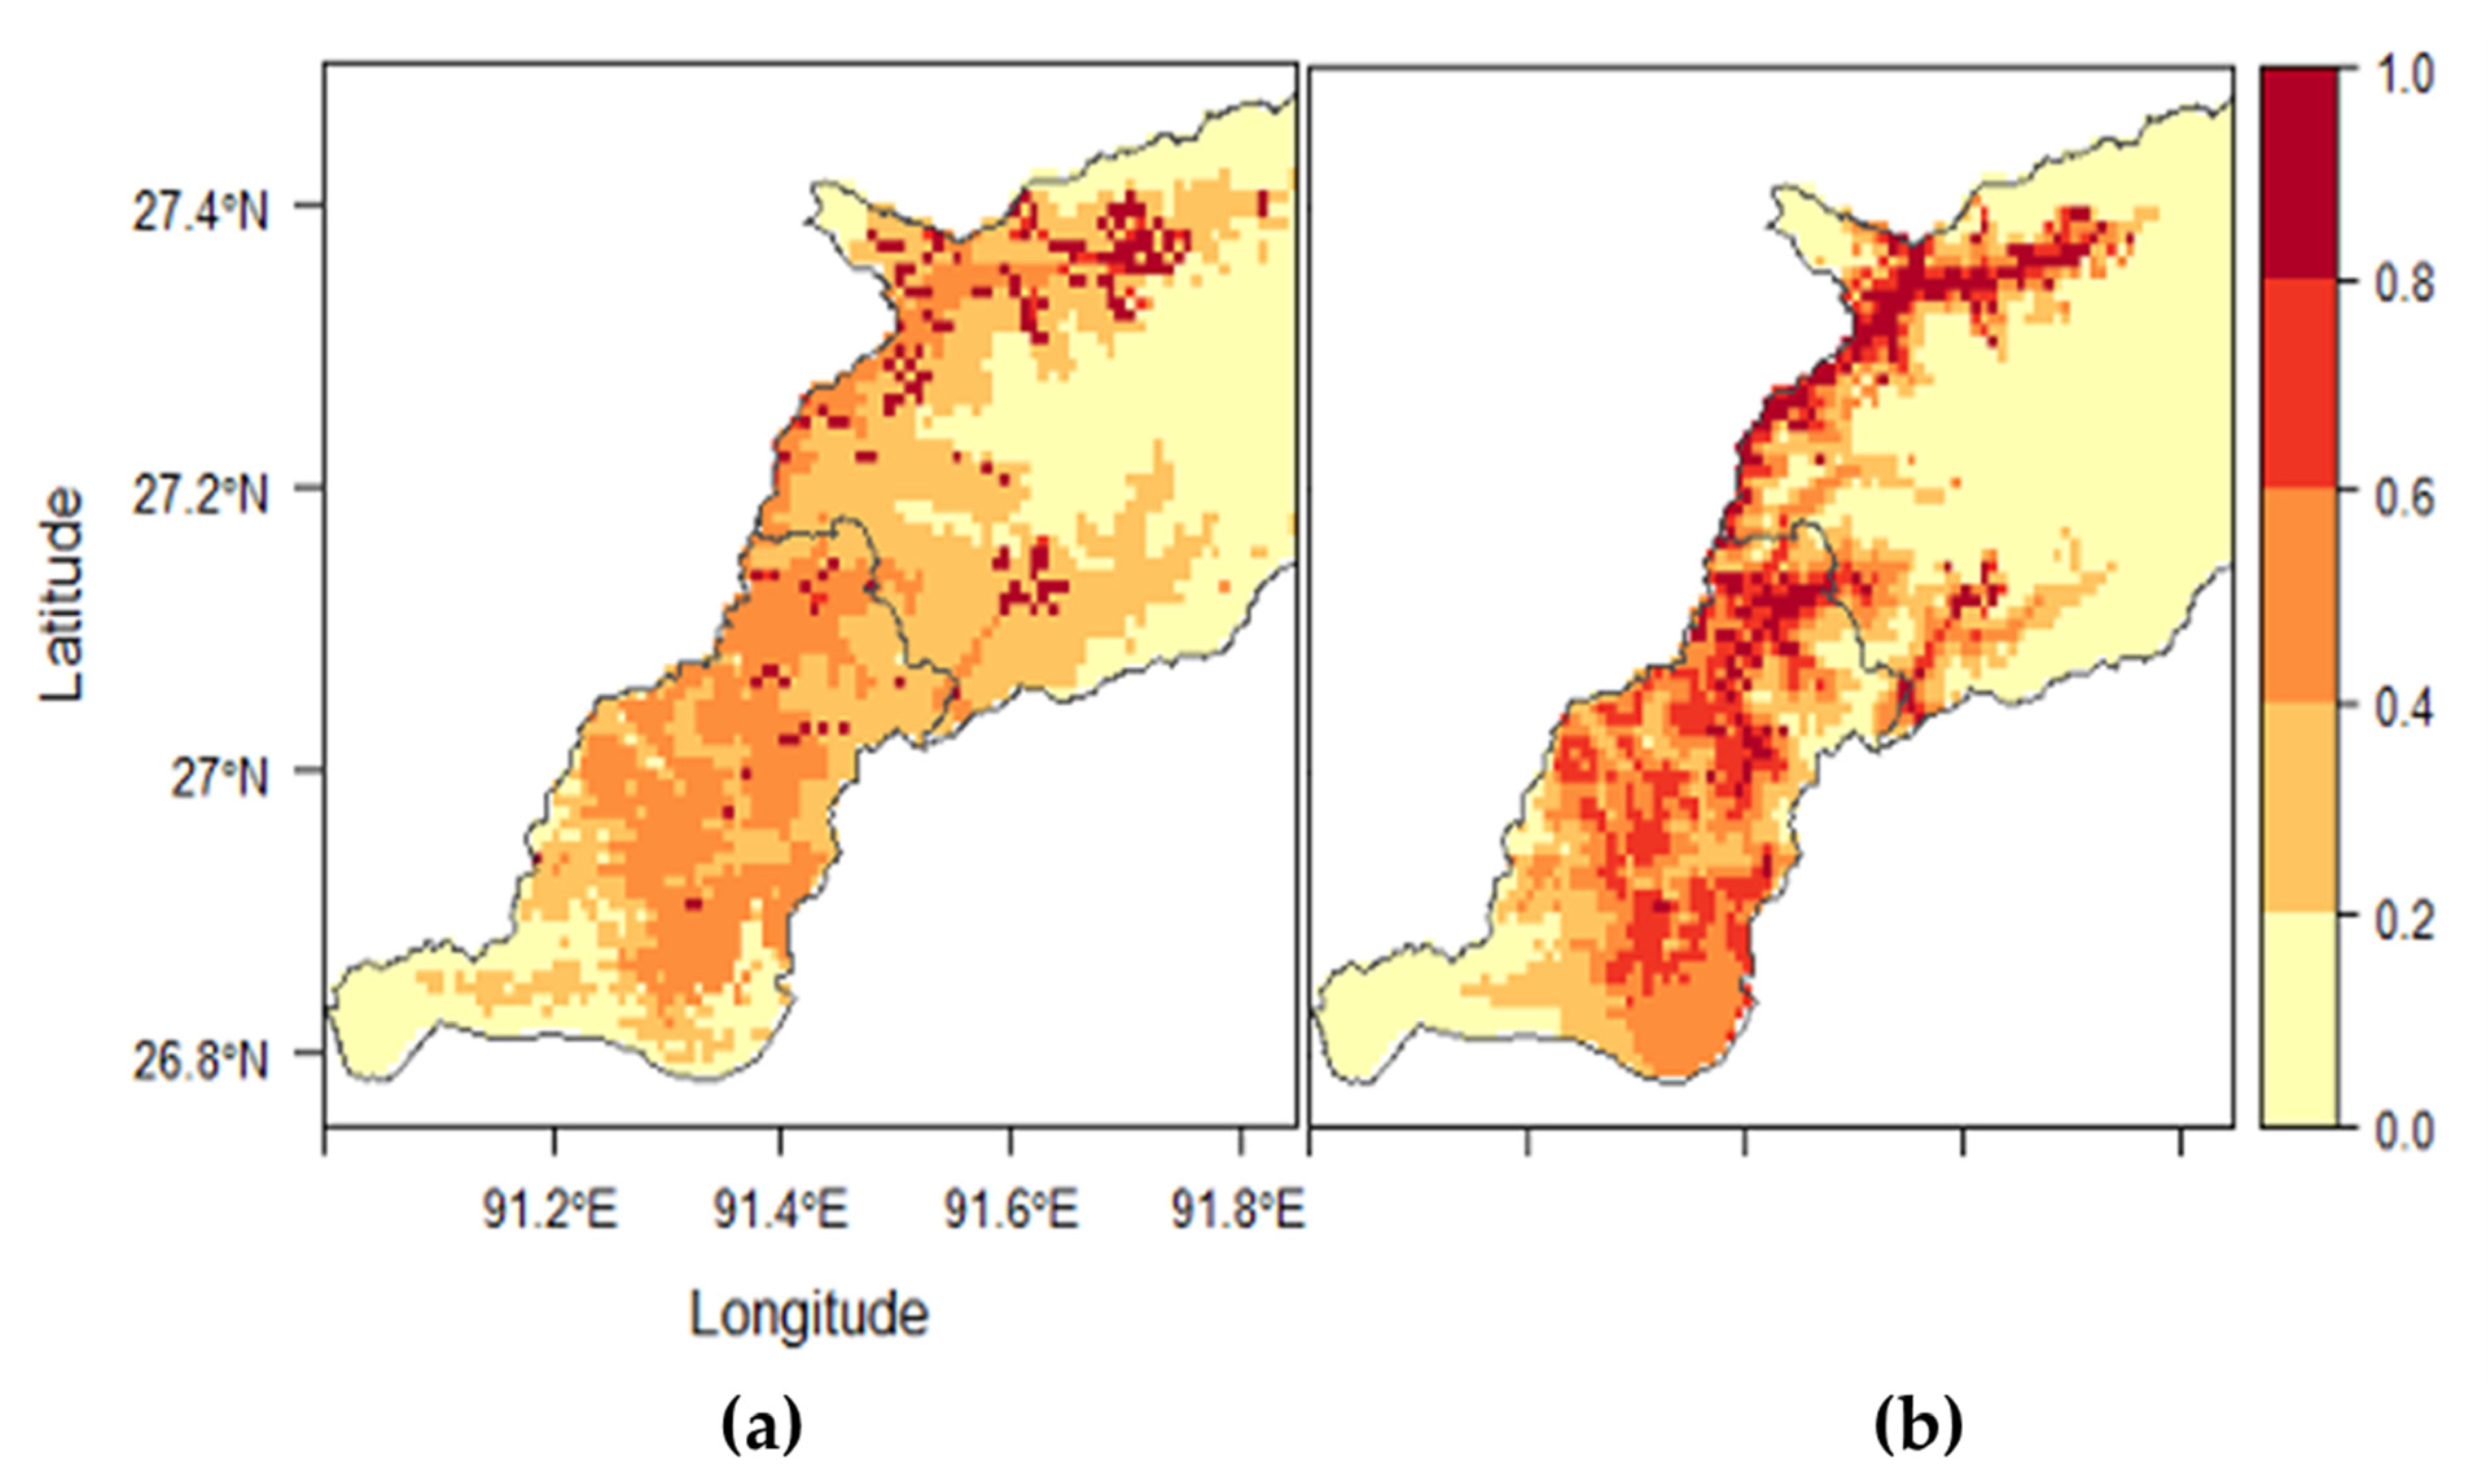
R. haemaphysaloides might be tolerating cooler temperatures than other tick species at some point in their life cycle. In the habitat suitability modeling,
R. haemaphysaloides presence was related to Bio 10 (temperature of the warmest quarter) and Bio 16 (precipitation of the wettest quarter) with the highest probability of occurrence at 25 °C and 1100 mm precipitation, respectively. Generally, the relative humidity plays a significant role in regulating the questing activity of ticks, and, further, the mortality of ticks also depends on the loss of water [
65]. This tick species is an exophilic tick that may lose water while questing for a host, and thus its survival may be dependent on its ability to retain or gain water. Therefore, precipitation might play a critical role in the survival of this tick in the environment as the relative humidity is largely influenced by precipitation.
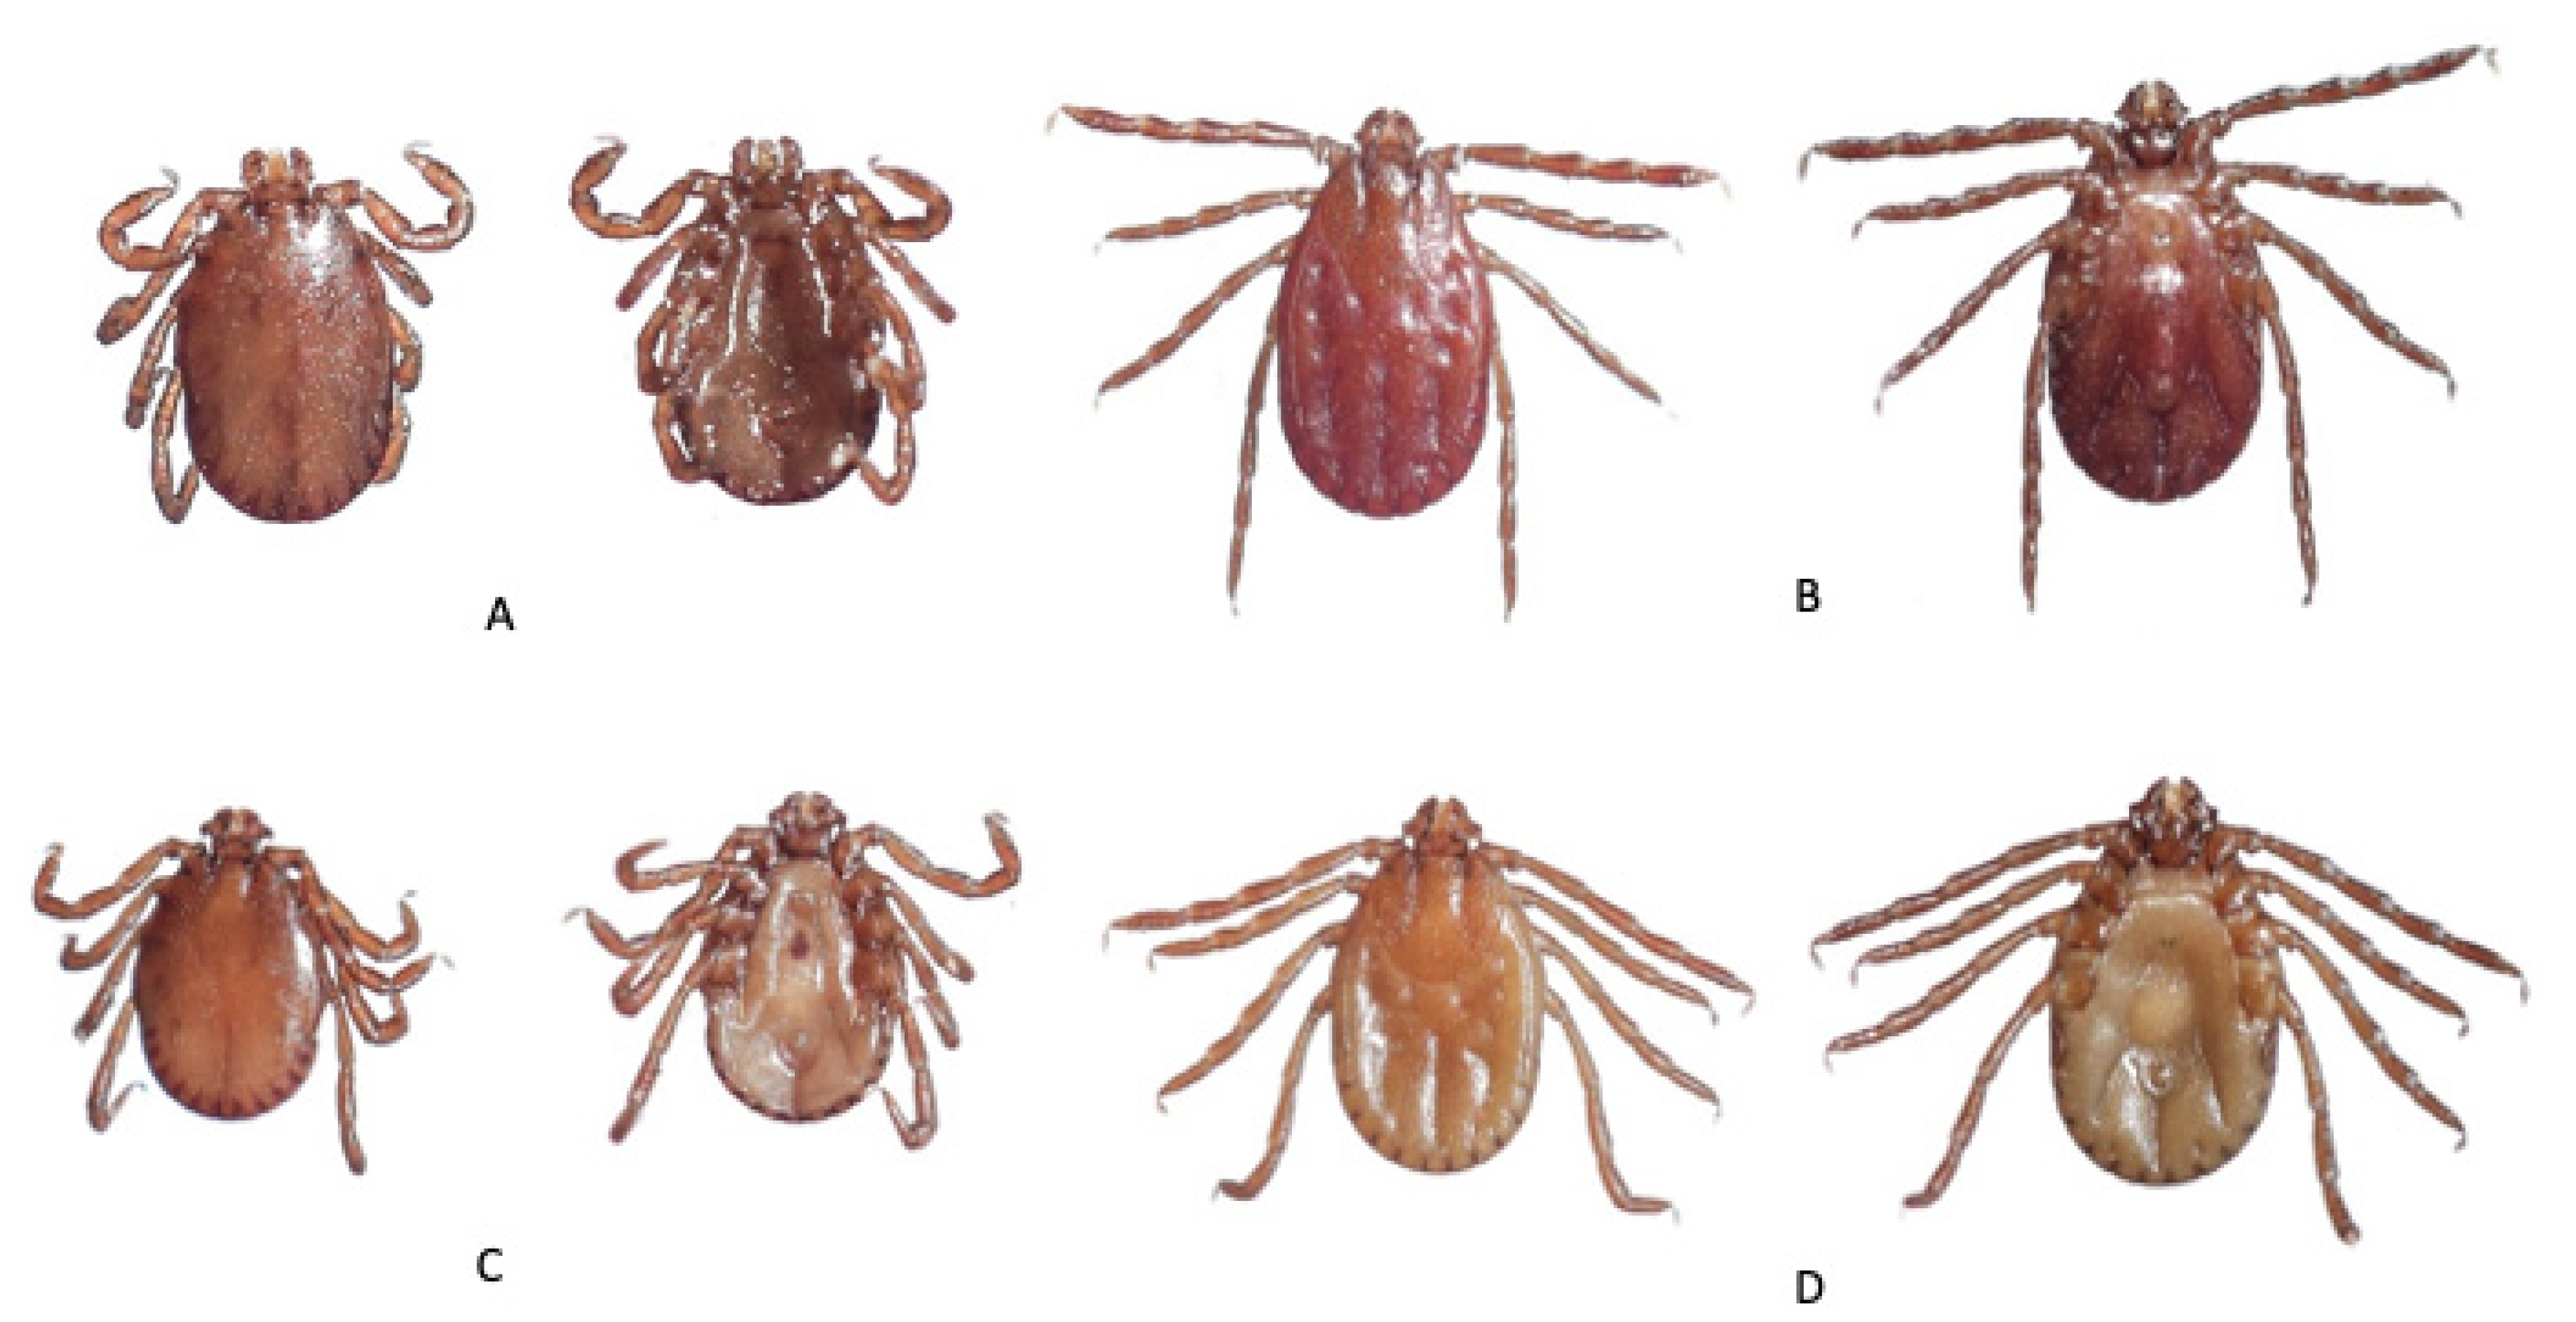
Haemaphysalis bispinosa was the third most predominant tick species identified in this study (
Table 3) and was collected from 22 subdistricts. In South Asia, this tick is distributed in India, Nepal, Sri Lanka, Pakistan, Bangladesh, and Myanmar [
66]. In India, it is widely distributed throughout the country and has been reported from the Indian states of Assam, Arunachal Pradesh, West Bengal, and Sikkim [
17,
47,
67] that border Bhutan. In China, this tick has been considered to exist in the southern parts of the country, but most of the
H. bispinosa reported in the Chinese literature are considered to be, in fact,
H. longicornis [
68].
Haemaphysalis spinigera was collected from 14 subdistricts in the study area. This tick is found in the foothills of the Central and Eastern Himalayan region, through Nepal to West Bengal in India [
69]. It is widely distributed in India and has been reported from the Indian states of Assam and West Bengal [
17,
47], which border Bhutan.
The prevalence of both
H. bispinosa and
H. spinigera was greater in indigenous breeds compared to European breeds. This could be attributed to the difference in preferred management systems used for European and indigenous breeds. The European breeds are mostly reared in a stall-fed system with limited access to forests, whereas the indigenous breeds are mostly reared in a free-grazing system with easy access to forests. The risk of exposure to ticks becomes greater when cattle graze in the forests. Studies have observed a higher prevalence of tick infestation in grazing cattle [
58,
70,
71]. Furthermore, indigenous breeds of cattle in Bhutan are generally considered resistant to many pests and diseases, and the management practices like grooming, brushing, and acaricide application, are rarely practiced by the farmers [
7].
Haemaphysalis bispinosa infestation increased with increasing altitude while
H. spinigera infestation decreased with increasing altitude (
Table 6). This might indicate that
H. bispinosa can tolerate a cooler temperature at some point in its life cycle while
H. spinigera prefers low altitude subtropical areas. However, altitude is not the only driving factor in the distribution of this tick species. Climatic factors such as temperature, rainfall, relative humidity, vegetation, and host availability also influence its distribution [
72]. In Bhutan, the high mountains and narrow valleys cause an extreme variation in climate, and temperature is mainly affected by altitude and precipitation by latitude [
45]. Further, the types of vegetation in the country are thought to be determined by the terrain and local climatic conditions; therefore, in the absence of detailed data on these various climatic and environmental factors, it is difficult to interpret what factors largely drive the distribution of ticks in Bhutan. Nevertheless, altitude could be one of the main driving factors determining the habitat suitability of tick species as it is believed to change the temperature by 0.5 °C with every 100 m change in altitude [
45].
The best habitat suitability model generated for
H. bispinosa showed that Bio 18 (precipitation of the warmest quarter) and Bio 16 (precipitation of the wettest quarter) were the two variables, besides land cover, predicting its distribution. For
H. spinigera, Bio 16 (precipitation of the wettest quarter) and Bio 19 (precipitation of the coldest quarter) were the two important variables, besides land cover. This indicates that the distribution of both
Haemaphysalis species was related to precipitation variables and land cover. The pattern of influence by Bio 16 (precipitation of the wettest quarter) was similar for both species—the probability of occurrence increased at 400 mm and then decreased when Bio 16 exceeded 1600 mm. Other studies from the neighboring countries like Bangladesh and India had similar findings for these two
Haemaphysalis species.
Haemaphysalis bispinosa seems to thrive well in areas with high summer rainfall in Bangladesh [
73]. In India, the population of the engorged adults increased during the monsoon seasons when there is a lot of rain [
17]. Similarly,
H. spinigera is also known to prefer wet and moist habitats with heavy to moderate rainfall [
17]. In South India, where Kysanuar forest disease (KFD) is endemic, the nymphal activity of
H. spinigera (the principal vector of KFD) peaks in spring and summer seasons coinciding with the onset of monsoons [
74]. Further, a habitat suitability modeling study (preprint) [
75] from South India for
H. spinigera has identified precipitation variables such as annual precipitation and wettest month precipitation as the important climatic variables influencing its geographical distribution. These findings indicate that precipitation is one of the important climatic factors that determine the distribution of
H. bispinosa and
H. spinigera.
The habitat suitability models developed indicated that the land cover classes such as kamzhing, meadows, chuzhing, and shrublands were suitable habitats for the tick species modeled. This might be associated with the presence of a host in these types of land. Kamzhing is the most important land type for dry land agricultural farming in Bhutan. Besides cultivating cereal crops, kamzhing is also used for growing fodder crops like oats and clover, especially in winters. Cattle are usually tethered and allowed to graze on the small patches of grasses and weeds in the kamzhing areas, and this might explain why kamzhing is a suitable land type for ticks, especially for a one-host tick like
R. microplus. The high probability of tick(s) occurrence in the meadows could also be due to host availability. Most of the indigenous cattle breeds reared in a free grazing system are grazed in the meadows, and frequently, wild cervids like deer also graze in the meadows. Chuzhing, at least theoretically, should not be a suitable habitat as ticks would not be able to withstand flooding. However, the entire area categorized as chuzhing is not under rice cultivation. The insufficient irrigation supply, farm labor shortage, erratic rainfall, and human–wildlife conflicts, among many other factors, have pushed many farmers to leave their chuzhing fallow [
76]. Consequently, these fallow lands have become a grazing area for domestic animals like cattle and wild cervids like deer. Occasionally, some farmers also grow fodder grasses on chuzhings that could not be utilized for rice cultivation. This changing pattern of land use might be the reason for chuzhing featuring as one of the suitable habitats for ticks. Shrublands were also identified as a suitable land type for some of the tick species modeled. Generally, shrublands in Bhutan are suitable for tick–host interactions as they are normal grazing areas for cattle and wild herbivores such as deer. Further, shrublands provide a conducive environment for small mammals, especially rodents, which can serve as reservoir hosts for the larvae and nymphs of multihost tick species.
For all tick species modeled, the northeastern and the southernmost parts of the study area were predicted to be unsuitable areas. The northeastern region is the area with higher elevations where temperatures and rainfall are low. In this region, the vegetation is predominantly mixed conifer forests. The low temperatures, scanty rainfall, and the occasional snow and frosts might be the limiting factors for tick survival. However, there might be some other species of ticks such as Hyalomma spp., which can tolerate high elevations. Hyalomma spp. were collected in Eastern Bhutan in areas with high elevation (above 2700 masl) (Dr. Susan C. Cork, personal communication, 2018). Therefore, additional studies using other sampling methods such as flagging and dragging may have to be conducted for at least a year to ascertain whether these areas are unsuitable for ticks. The southernmost part predicted as unsuitable areas are the subtropical floodplains at a very low elevation (less than 500 masl). The vegetation in these areas is predominantly broadleaf forests. Climatically, these areas will be suitable for ticks, but the host unavailability (especially the bovines) might be the limiting factor. There are no human activities such as settlement and farming in these areas. The frequent flooding during the monsoon will also be one of the limiting factors. However, there are some wild animals inhabiting these areas, which might be potential hosts for some species of ticks. Therefore, future efforts must be targeted toward tick collection from wild animals and the environment in these areas to understand the habitat suitability better.
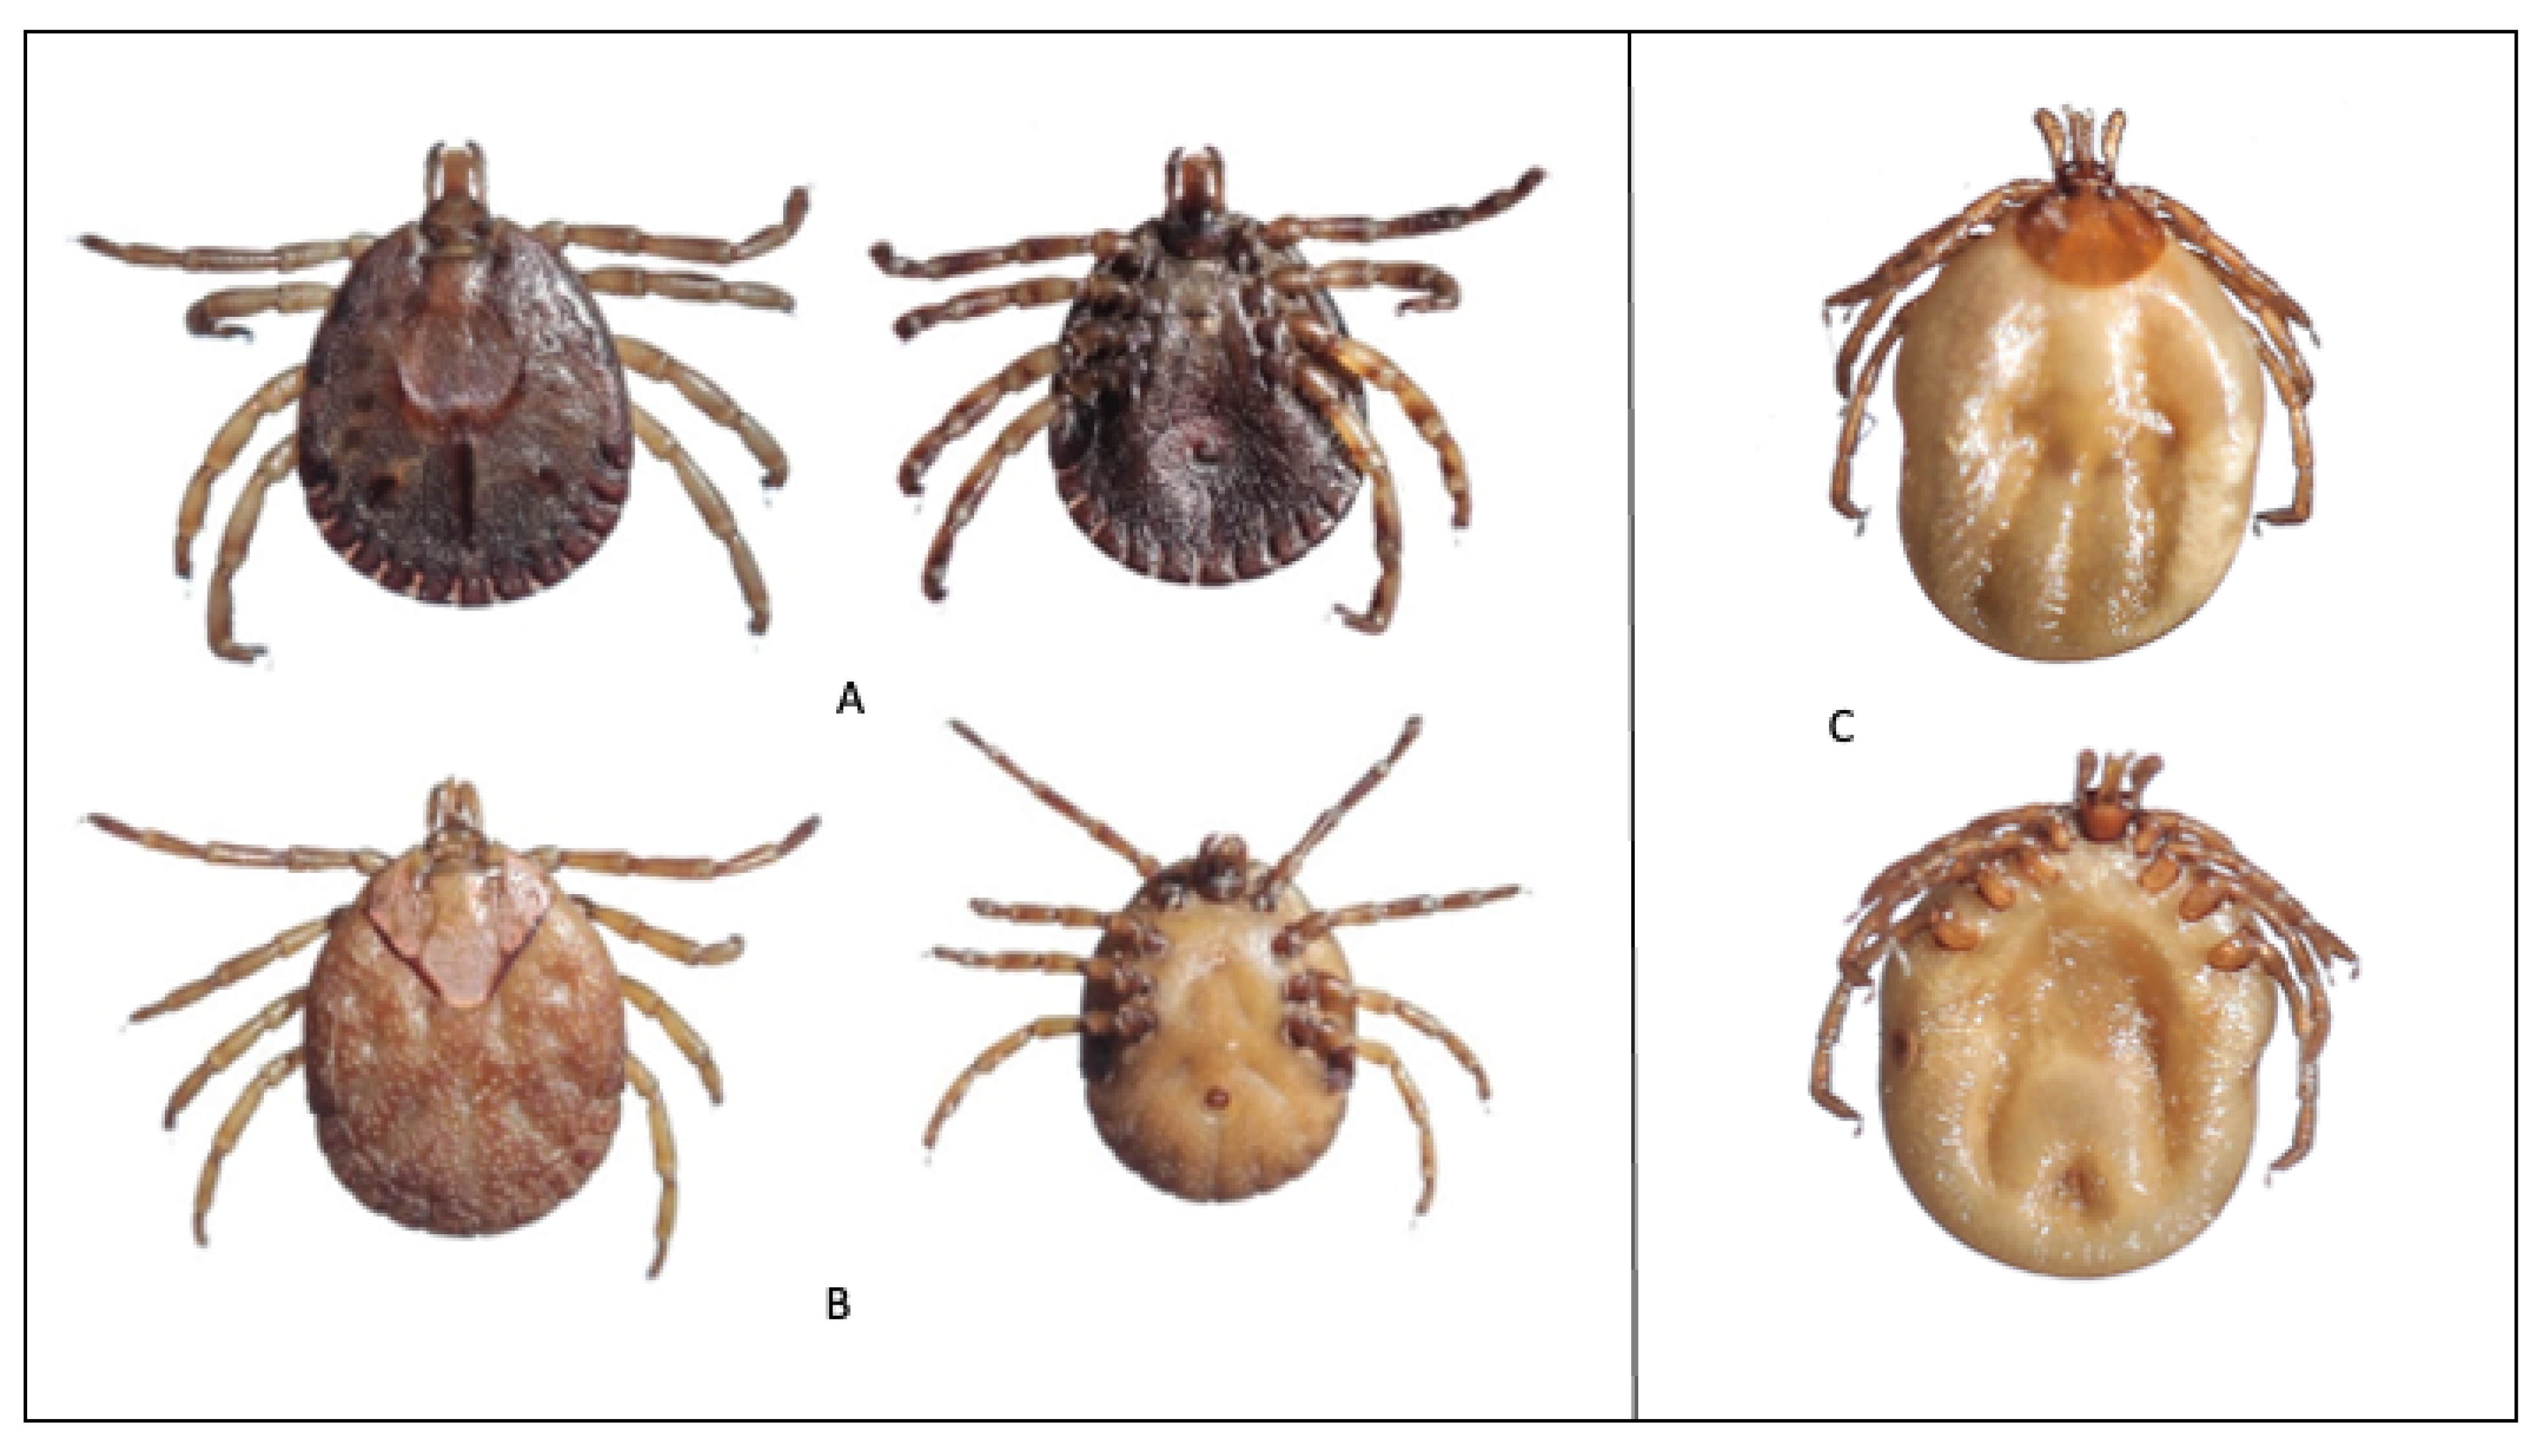
Seven specimens of
A. testudinarium were collected from seven subdistricts in Pema Gatshel, and one unidentified specimen of
Ixodes was collected from a subdistrict in Trashigang.
Amblyomma testudinarium is considered to be a rare tick species reported only from Asian countries like Malaysia, India, Japan, Korea, and China [
47,
77,
78]. In India, it has been collected from cattle, mithuns, yaks, and wild animals such as the tiger, wild boar, barking deer, and elephant in Assam, Arunachal Pradesh, Mizoram, and West Bengal [
47,
79]. These reports suggest that this tick species is predominantly found on the animals that live in and around the forests of the Himalayan foothills. In this study,
A. testudinarium was found only in the southeastern district of Pema Gatshel. Since this study lacked year-round sampling and was conducted only in cattle, it is difficult to interpret why
A. testudinarium was not collected from Trashigang. As with
Ixodes, there are 11 valid species reported from India [
47], 24 valid species from China [
19], and 15 valid species from Nepal [
80]. This tick can infest a wide range of hosts, including domestic animals and humans, small mammals, wildlife such as deer, birds, and reptiles [
80]. However, in this study, only one specimen of
Ixodes was found on cattle. This could have been biased due to our sampling procedure as tick collection was done only from the cattle in May–June 2019.
This study has some limitations. Since the primary aim of our study was to understand the presence and diversity of tick species in cattle, our sampling was biased toward areas dominated by cattle rearing. The presence data used in this modeling study were based on tick collection from cattle, and it may not represent the exact location from where tick(s) originated. Therefore, future studies should include tick sampling from the environment and other hosts. The sampling for this study was conducted only once in May and June 2019 as this time period is thought to be the season for peak tick infestation in cattle in Bhutan. More species might have been found if the sampling was conducted throughout the year. To reduce these knowledge gaps, future studies should focus on active surveillance for some years targeting a wider range of hosts. Other sampling methods like flagging and dragging on vegetation should also be conducted to improve the knowledge of tick species diversity. The three-host ticks like
R. haemaphysaloides,
H. bispinosa, and
H. spinigera depend on multiple hosts to complete their life-cycle; however, we collected ticks only from cattle, and the status of other potential hosts that these ticks might be feeding on is not known. In Bhutan, tick collection from a wider range of hosts could be done in collaboration with wildlife officials who often encounter wild animals and birds during rescue and relocation operations. The resampled bioclimatic variables may not represent the extreme climatic variations in the mountainous terrain of Bhutan, thereby increasing the uncertainty of the models. Therefore, more local climate or weather data should be used for future modeling studies. Further, the MaxEnt approach, as a correlative species distribution model, estimates the realized niche but not the fundamental niche of the species [
81]; therefore, potential habitat is likely to be more than what is predicted by the habitat suitability maps. Nevertheless, MaxEnt is a powerful software tool for habitat suitability modeling with several advantages that include the need for few presence points and the ability to use both continuous and categorical variables [
10].


 ,
, 


