An Exploratory Study of COVID-19 Information on Twitter in the Greater Region


1
Faculty of Sciences, Technology and Medicine, University of Luxembourg, L-4364 Esch-sur-Alzette, Luxembourg
2
Interdisciplinary Centre for Security, Reliability and Trust, University of Luxembourg, L-4364 Esch-sur-Alzette, Luxembourg
*
Author to whom correspondence should be addressed.
Big Data Cogn. Comput. 2021, 5(1), 5; https://0-doi-org.brum.beds.ac.uk/10.3390/bdcc5010005
Submission received: 27 December 2020
/
Revised: 13 January 2021
/
Accepted: 21 January 2021
/
Published: 28 January 2021
(This article belongs to the Special Issue Big Data and Cognitive Computing: Feature Papers 2020)
Abstract
:The outbreak of the COVID-19 led to a burst of information in major online social networks (OSNs). Facing this constantly changing situation, OSNs have become an essential platform for people expressing opinions and seeking up-to-the-minute information. Thus, discussions on OSNs may become a reflection of reality. This paper aims to figure out how Twitter users in the Greater Region (GR) and related countries react differently over time through conducting a data-driven exploratory study of COVID-19 information using machine learning and representation learning methods. We find that tweet volume and COVID-19 cases in GR and related countries are correlated, but this correlation only exists in a particular period of the pandemic. Moreover, we plot the changing of topics in each country and region from 22 January 2020 to 5 June 2020, figuring out the main differences between GR and related countries.
1. Introduction
The outbreak of COVID-19 led to an outbreak of information in major online social networks (OSNs), including Twitter, Facebook, Instagram, and YouTube [1]. Facing this massive COVID-19 outbreak and constantly changing situation, OSNs have become an essential platform for people to seek up-to-the-minute and local information. Moreover, due to physical isolation and social distancing, people spend much more time on OSNs—engaging in expressing opinions, encouraging others, openly lambasting mismanagement, and voicing vitriol, etc. Discussions on OSNs can be a reflection of reality, and topics about the pandemic mirror the public concerns in real-time. A growing number of research links OSNs activities to COVID-19. Existing literature has already demonstrated that posts about the pandemic on OSNs can be a leading indicator of COVID-19 daily cases [2,3], related discussions on OSNs can be categorised into multiple specific topics [4,5,6], and OSNs may help to design more efficient pandemic models for social behaviour and thus the government can implement more responsive communication strategies [1,7,8]. However, there are three main problems within the existing research. First, research with geographic data are based on coarse-grained processing of the location information [2,9]. Second, the existing topic modelling studies mostly focus on different topics in a relatively long period (weeks or months) [1,5] and general characteristics of user concerns, which cannot provide a precise representation of how topics change on a daily basis. Third, shared information on OSNs over the global or nations [2,9,10] are too general in terms of geographic dividing.
When analysing the COVID-19 information on Twitter by geographic locations, it cannot be ignored that the movement of population shapes the spatio-temporal patterns of the pandemic [11]. Population mobility plays an important role in the spread of COVID-19. In other words, in terms of regions with highly frequent and mobile cross-border commuters, research only concerning political sovereign states are biased.
To fill this gap, we introduce the concept of the “relational cities”. Relational cities are defined as regions that “constituted through globally critical flows of capital, goods, and ideas, and whose economies are dedicated to intermediary services such as offshore banking, container- and bulk-shipping, and regional re-exportation” [12]. In a nutshell, relational cities are a specific set of cities that exhibit spatial transformations due to the influence of advanced capitalism, and it can be transnational. To be more specific, these cities tend to be located in cross-border regions, influenced by different linguistic, cultural, and political systems, and rely heavily on exchange economy, with a large number of cross-border workers. The high mobility of cross-border workers brings high risks of virus spreading. Studies have shown that lockdown in relational cities is likely to have more severe impact on economy than in cities of traditional concept [13]. However, up to the present time, there is no data-driven analysis of OSNs COVID-19 information about any relational cities yet. The Greater Region (GR), a cross-border region within Europe with the Grand Duchy of Luxembourg at its centre and adjacent regions of Belgium, Germany and France (i.e., Wallonia, Saarland, Lorraine, Rhineland-Palatinate and the German-speaking Community of Belgium) are a set of typical relational cities. For ease of presentation, we define the countries mentioned above as the related countries of the GR. This region has a long history of cooperation between cities of different countries. A large number of cross-border workers choose to work in Luxembourg, but live in related countries where residential prices are cheaper compared to Luxembourg [14]. These structural differences including incomes, prices, living condition and other factors make the region become a set of typical relational cities with the highest number of the cross-border worker in Europe, approximately works per day with a dominant orientation from the neighbouring cities to the Grand Duchy of Luxembourg [15]. This high mobility and cooperation make the GR a particular and outstanding example: virus spreads due to its high mobility, as the whole business model in the GR requires a large number of cross-border workers to sustain. With the implementation of a set of policies including border closures and the progression of the pandemic, the GR is affected in the economy, daily life, travel, and other aspects.
This study focuses on two dimensions, tweet volume (see Section 4) and tweet text (see Section 5) to analyse Twitter information in the GR and related countries about COVID-19. The following two main questions are addressed in the corresponding section.
- RQ1
- Whether there is a strong correlation between tweet volume and COVID-19 daily cases in the GR and related countries, and, if so, whether tweet volume can help predict COVID-19 daily cases?
- RQ2
- How do the categories of topics discussed change over time in each country and region? Does the changing scenario of the topic categories in the GR differ from that of other countries?
We collected tweets from Twitter, which are posted by Twitter users all over the world from 22 January 2020 to 5 June 2020. Among them are posts posted by users in the GR and its related countries. To investigate RQ1, basic reproductive rate and effective reproductive rate in epidemiology [16] are introduced to slice the pandemic periods, and correlations between tweet volume and daily cases in each period are calculated by Pearson Correlations (PC). A novel topic modelling method combing Bidirectional Encoder Representations from Transformers (BERT) [17] and the Latent Dirichlet Allocation (LDA) topic modelling method [18] is introduced, and a supervised Support Vector Machine (SVM) [19] for classifying topics into given categories is trained to study RQ2.
The main contributions in this paper are threefold.
- (I)
- We screen a novel Twitter dataset of 22 January 2020 to 5 June 2020 which contains data from users with locations labelled in the GR, and related countries including Luxembourg, France, Germany and Belgium, and the COVID-19 related tweets from Chen et al’s dataset [20]. This dataset will be shared with the public to advance related research.
- (II)
- Spatio-temporal analysis is carried out to showcase how the COVID-19 daily cases are correlated with tweet volume in a long period. We find that tweet volume and COVID-19 daily cases in the GR and related countries are correlated, and tweet volume can help predict COVID-19 daily cases, but this strong correlation only exists during the early period of the pandemic.
- (III)
- We plot the daily discussions on different topic categories by country and region. It is found that users in the GR show more concern in anti-contagion and treatment measures before COVID-19 reaches its peak, and have a higher level of interest in policy and daily life before than the related countries.
This study sheds light on how the Twitter users in the GR and related countries react differently over time through an interdisciplinary approach. It may, therefore, help to understand changes in public concerns on Twitter during the pandemic, and in particular, the distinctive characteristics of topics in the GR, a relational city with high mobility.
2. Related Work
Since the pandemic of social media panic spreads faster than COVID-19 outbreak [21], research has been conducted based on social media platforms to investigate relations between them. Existing results showed that social media conversations could be a leading predictor of new pandemic cases and tweets increase in volume before the number of confirmed cases increases [3,22] and Shen et al. [23] predicted COVID-19 case counts with reports of symptoms and diagnoses on social media. Moreover, studies showed that anti-contagion policies could significantly and substantially reduce the spread of COVID-19 [24,25,26]. Park et al. [27] demonstrated that information with medically oriented thematic framework had a broader spillover effect on COVID-19 issues in a Twitter context. The effect of policies on the mitigation of spread varies, influenced by factors including culture, demographic information, socio-economic status and national health systems, where changes in public knowledge may affect the impact of the policies. If the public adjusts their behaviour in response to information from sources that are not policy-related, it may change the spread of COVID-19 [24].
Research of public behaviour patterns of the pandemic were conducted based on data from smart devices [7], search index [28,29], and COVID-19 related conversations on Twitter. Bento et al. [8] mentioned that, there was a spike in searches for basic information about COVID-19 when the first case was announced in each state in the United States, but the first case report did not trigger discussions about policy and daily life. Lwin et al. [30] and Samuel et al. [31] provided globally insights of the public sentiments and an overview of public awareness. Topic modelling, an unsupervised approach that detects latent semantic structure [4], is widely used to analyse the public behaviour patterns. Cinelli et al. [1] extracted topics with word embedding on a global scale, making the conclusion that social media may help to design more efficient epidemic models for social behaviour and to implement more timesaving communication strategies. The LDA model was used by Abd-Alrazaq et al. [32] and Medford et al. [5] to analyse the topics in the early period of the pandemic. Zamani et al. [33] proposed a dynamic content-specific LDA topic modelling to identify COVID-19 related discussion. However, LDA, a bag-of-words approach, which is widely used to identify latent subject information in a large-scale document collection or corpus, has some drawbacks: it needs large corpus to train, ignores contextual information and performs mediocrely in handling short texts [34]. As a result, these studies extracted the topic over certain time periods, and the time granules were too coarse to accurately reflect the trend of the topics.
3. Data Description
In this section, we briefly describe how we screened COVID-19 tweets from Chen et al.’s dataset [20] to build our dataset of GR and the related countries, and how we obtained information on COVID-19 daily cases for these region and countries.
3.1. Twitter Data Collection
Twitter, one of the most prominent online social media platform, has been used extensively during the pandemic. In this study, 51,966,639 tweets posted by more than 15 million Twitter users from 22 January 2020 to 5 June 2020 are hydrated from Chen et al.’s dataset [20] via the Twitter Streaming API. This COVID-19 Twitter dataset collects tweets with specific keywords including ‘COVID-19’, ‘coronavirus’, ‘lockdown’, etc. Attribute with * in Table 1 is contained in the dataset. To comply with Twitter’s Terms of Service, they only publicly released the tweet ids of the collected tweets. To compose our dataset, we first collect raw data via the API based on the tweet ids they provided, which included tweet id, full text, user id and user-defined location information.
Secondly, as the user location information we collected so far is user-defined, nether accurately revealing a true location nor machine-parseable, we processed the fuzzy location context into real location information by leveraging geocoding APIs, Geopy (https://bit.ly/3gfW2PP) and ArcGis Geocoding (https://bit.ly/3f9OUDa). In more detail, user-defined locations in many cases, detailed country locations are not included, usually just a city or an abbreviation of a state. If user-defined locations are matched directly based on characters, users who fill in this kind of context will be ignored. Geopy, a Python client for geocoding services and ArcGIS Geocoding, a geo graphic information services system, geocode a fuzzy string into a complete address of a fixed format including state and country. For example, ‘Moselle’ in Table 1 would be geocoded as ‘Moselle, Lorraine, France’.
As a widely used service on gecoding [35,36], AicGIS has been validated for its accuracy. Data from past research show that although 16–18% of Twitter users have blank user-defined location information [37] and 8.03–8.10% of invalid or generic location information (e.g., earth, heaven). However, for non-blank and general (e.g., country, state, region) data, the geocoding approach can achieve an accuracy of 80.46–88.50%, regardless of whether the user’s location at the time of tweeting is different from their user-defined location [38].
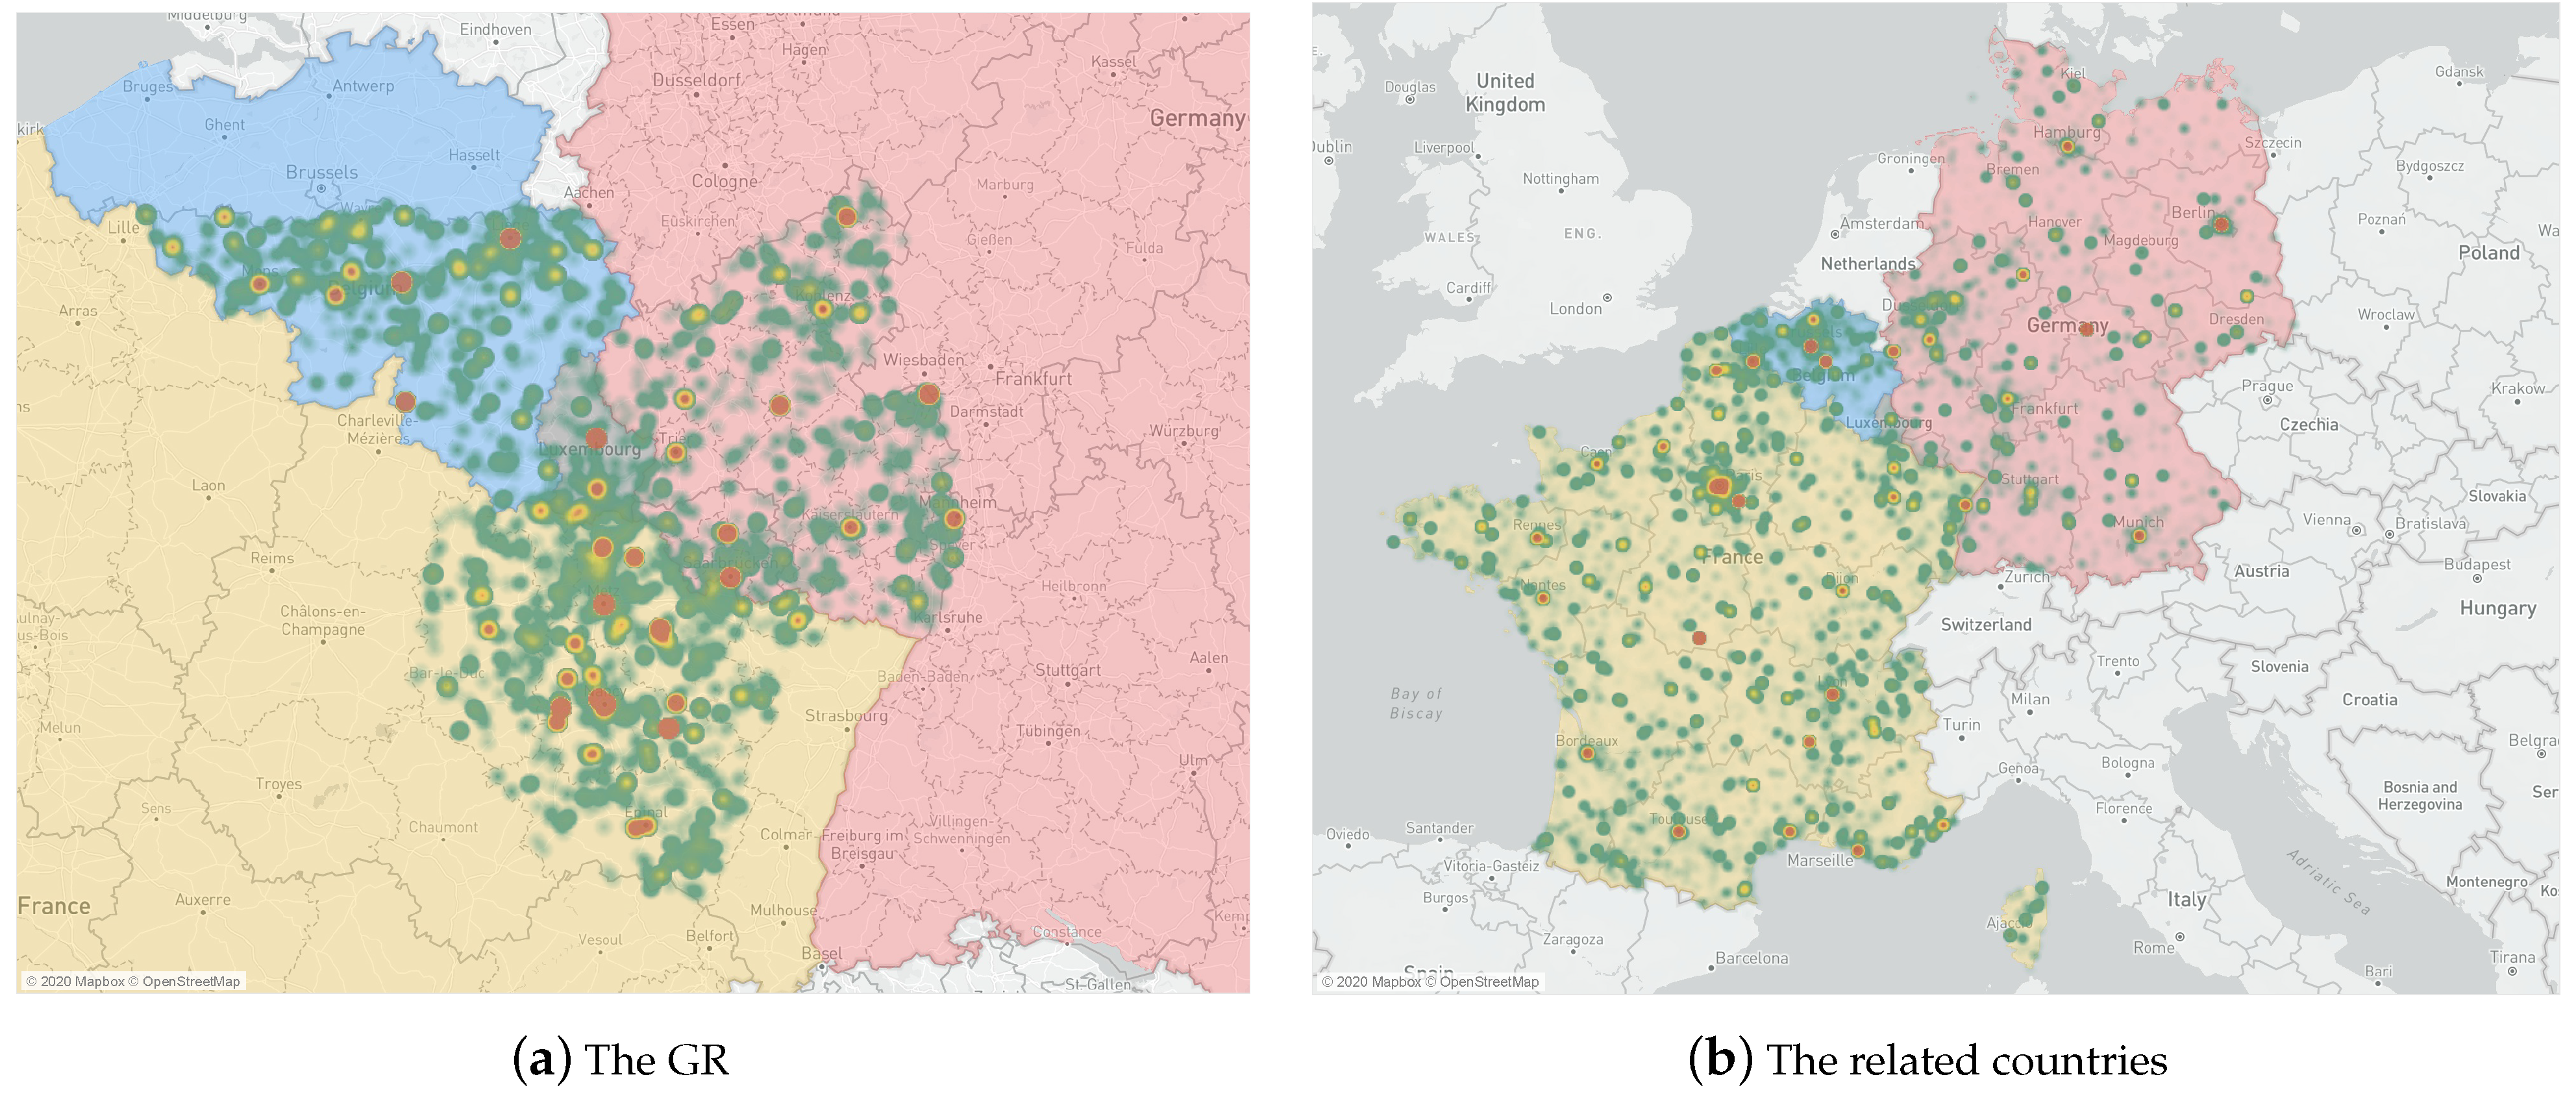
Once the location information has been geocoded, users located in the the GR, Luxembourg, France, Germany, and Belgium are screened by character matching. Table 1 gives an example in the final dataset, and Table 2 shows the summary of the collected tweet data of the GR, Luxembourg, France, Germany, Belgium and globally. Figure 1 contains two heatmaps of user locations in the GR and the related countries for a better understanding of this study.
3.2. COVID-19 Data Collection
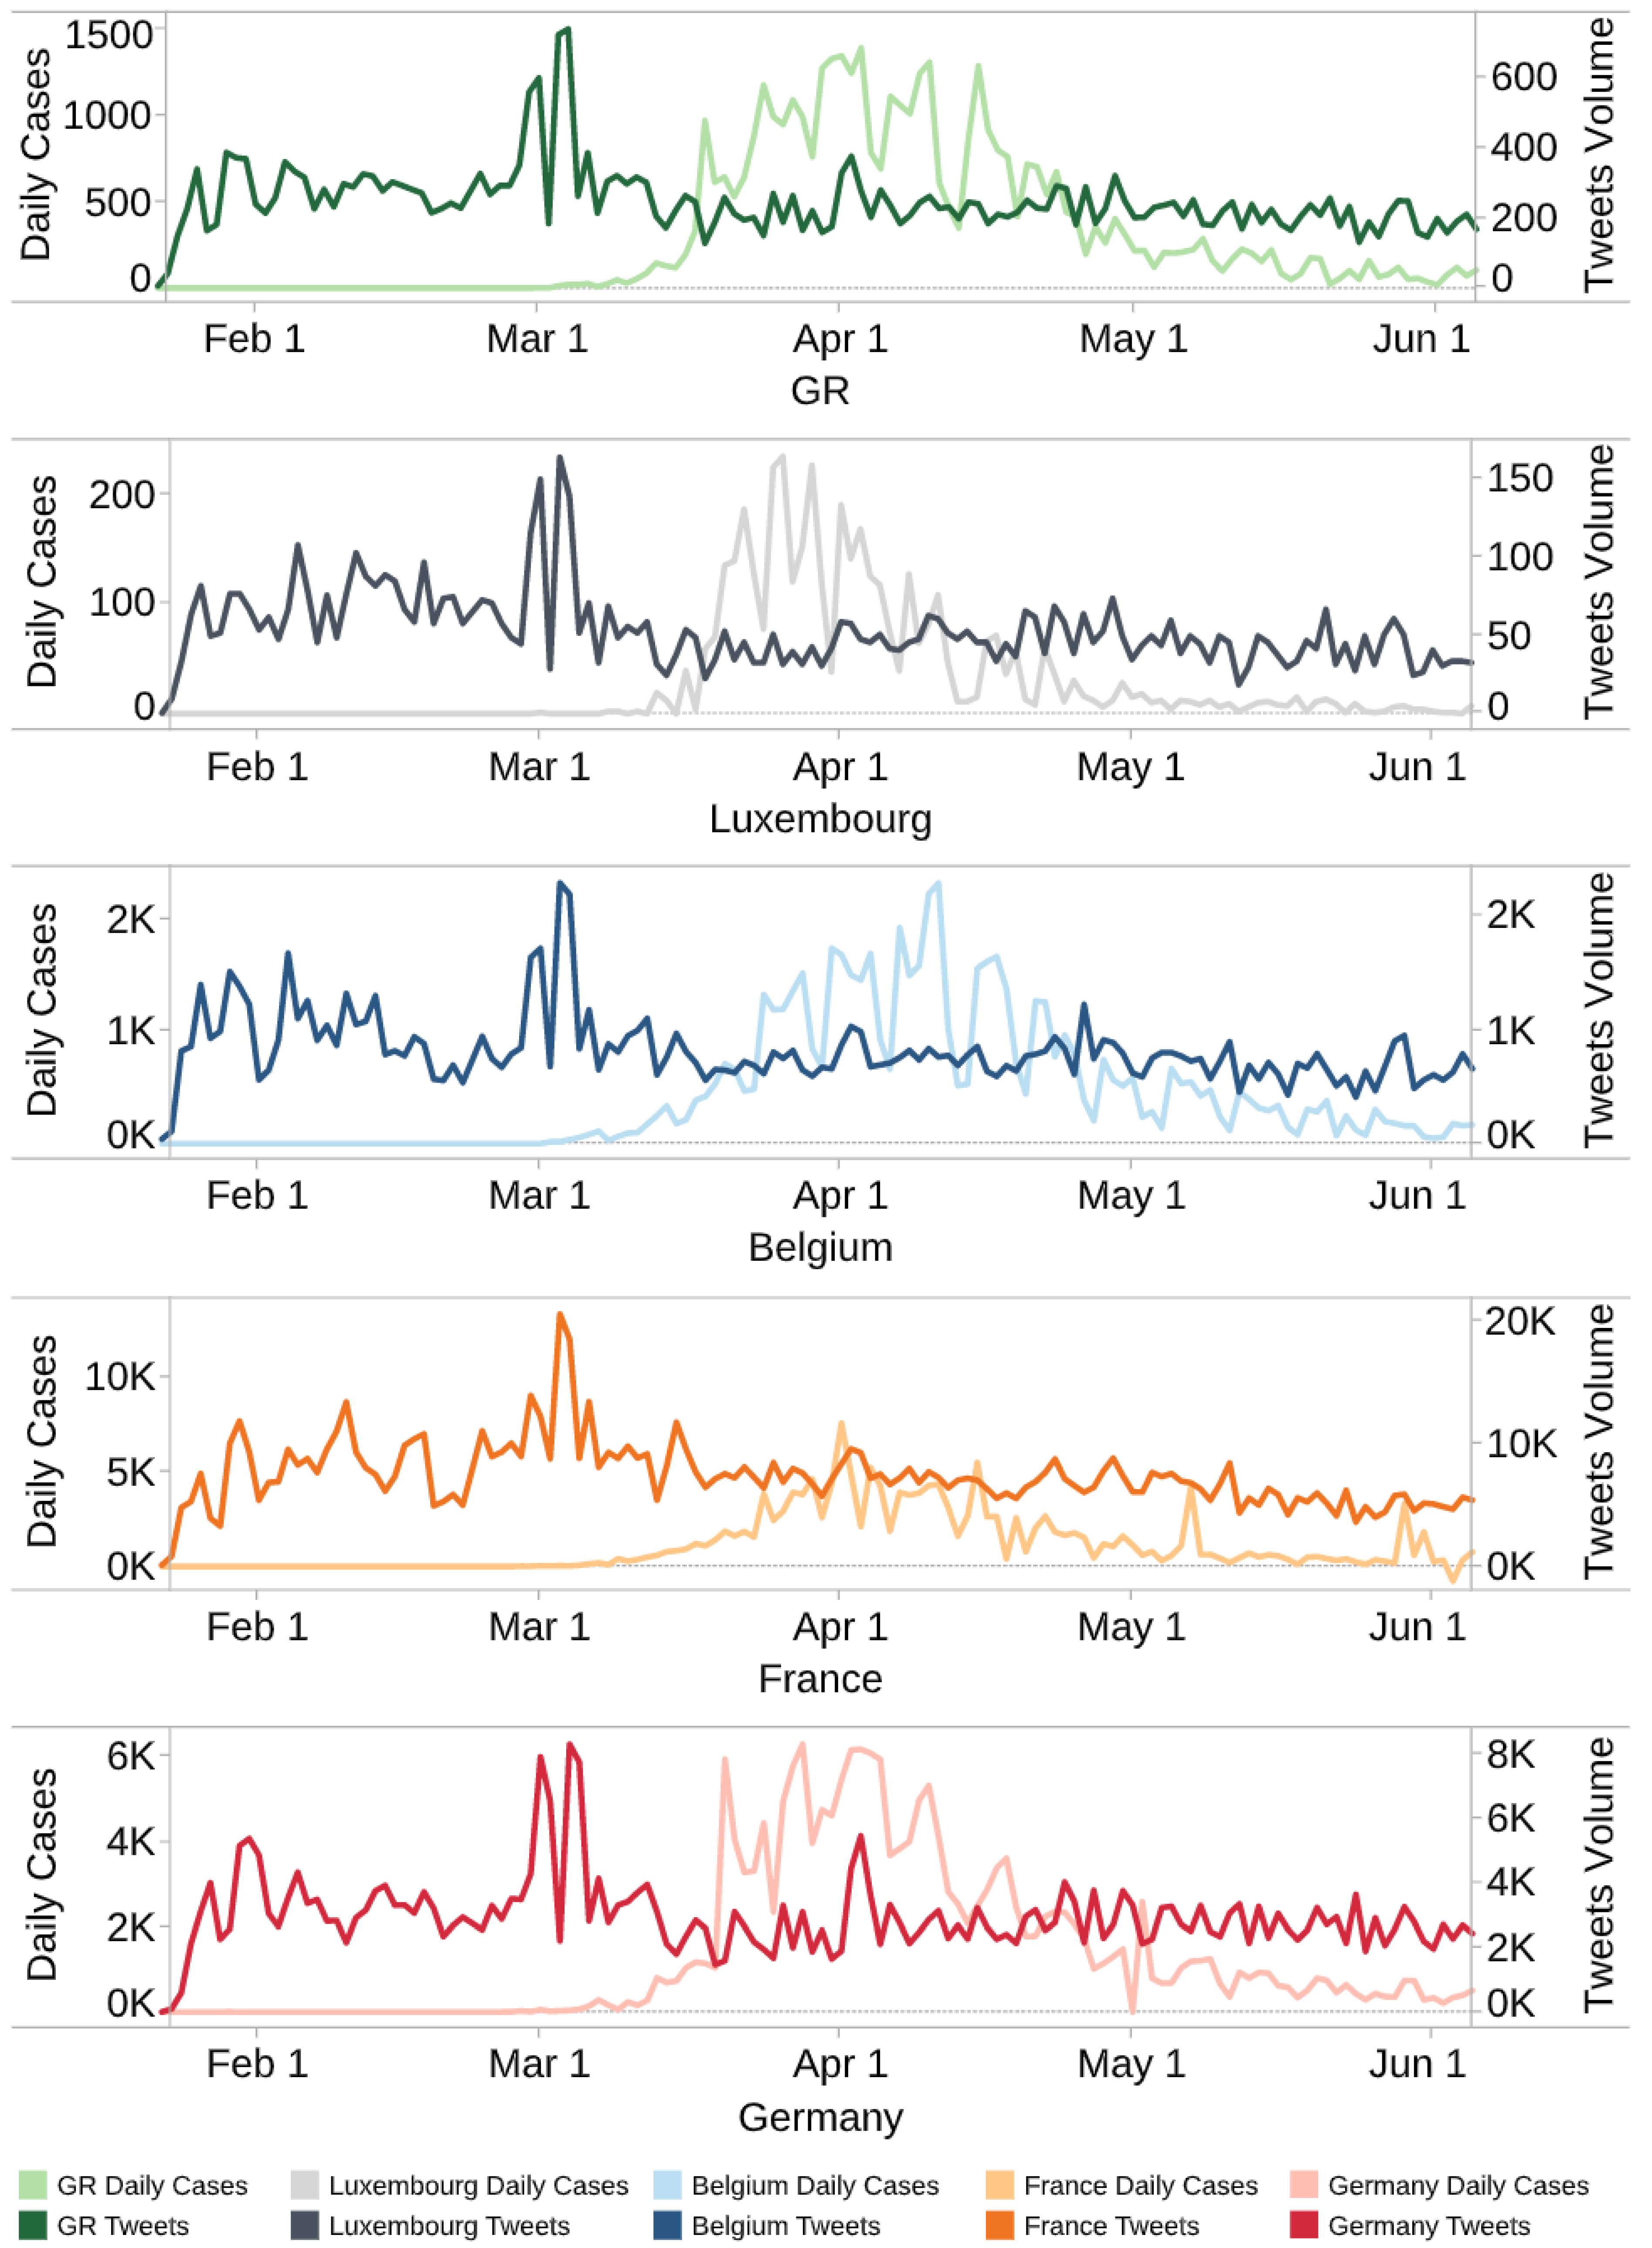
The dataset published by the European Center for Disease Prevention and Control [39] allows us to obtain COVID-19 data including daily cases, deaths and locations for the country we selected. As there is no official COVID-19 data published for the GR, which is composed of Luxembourg, Wallonia in Belgium, Saarland and Rhineland-Palatinate in Germany and Lorraine in France, we add up all the data for the cities and regions mentioned above from the datasets [40,41,42] published by corresponding countries as the final the GR data when counting daily cases and deaths in the GR. It should be noted that as the number of daily new cases in France is not available at the regional level, and deaths, hospitalisations, departures data have been published only since 18 March 2020, data for Lorraine is counted as zero until 18 March 2020, and the sum of hospitalisations, hospital departures and deaths is considered as the total number of cases on that particular day. Figure 2 shows the daily tweet volume and COVID-19 new cases of each country and region.
4. Correlation between COVID-19 Daily Cases and Tweet Volume
To explore the correlation between tweet volume and COVID-19 daily cases in GR and the related countries, we introduce basic reproductive rate and effective reproductive rate in epidemiology to slice the periods of the pandemic, and a spatio-temporal analysis of the correlation between tweet volume and daily cases in each period is conducted by Pearson Correlations ().
4.1. -Based Time Division
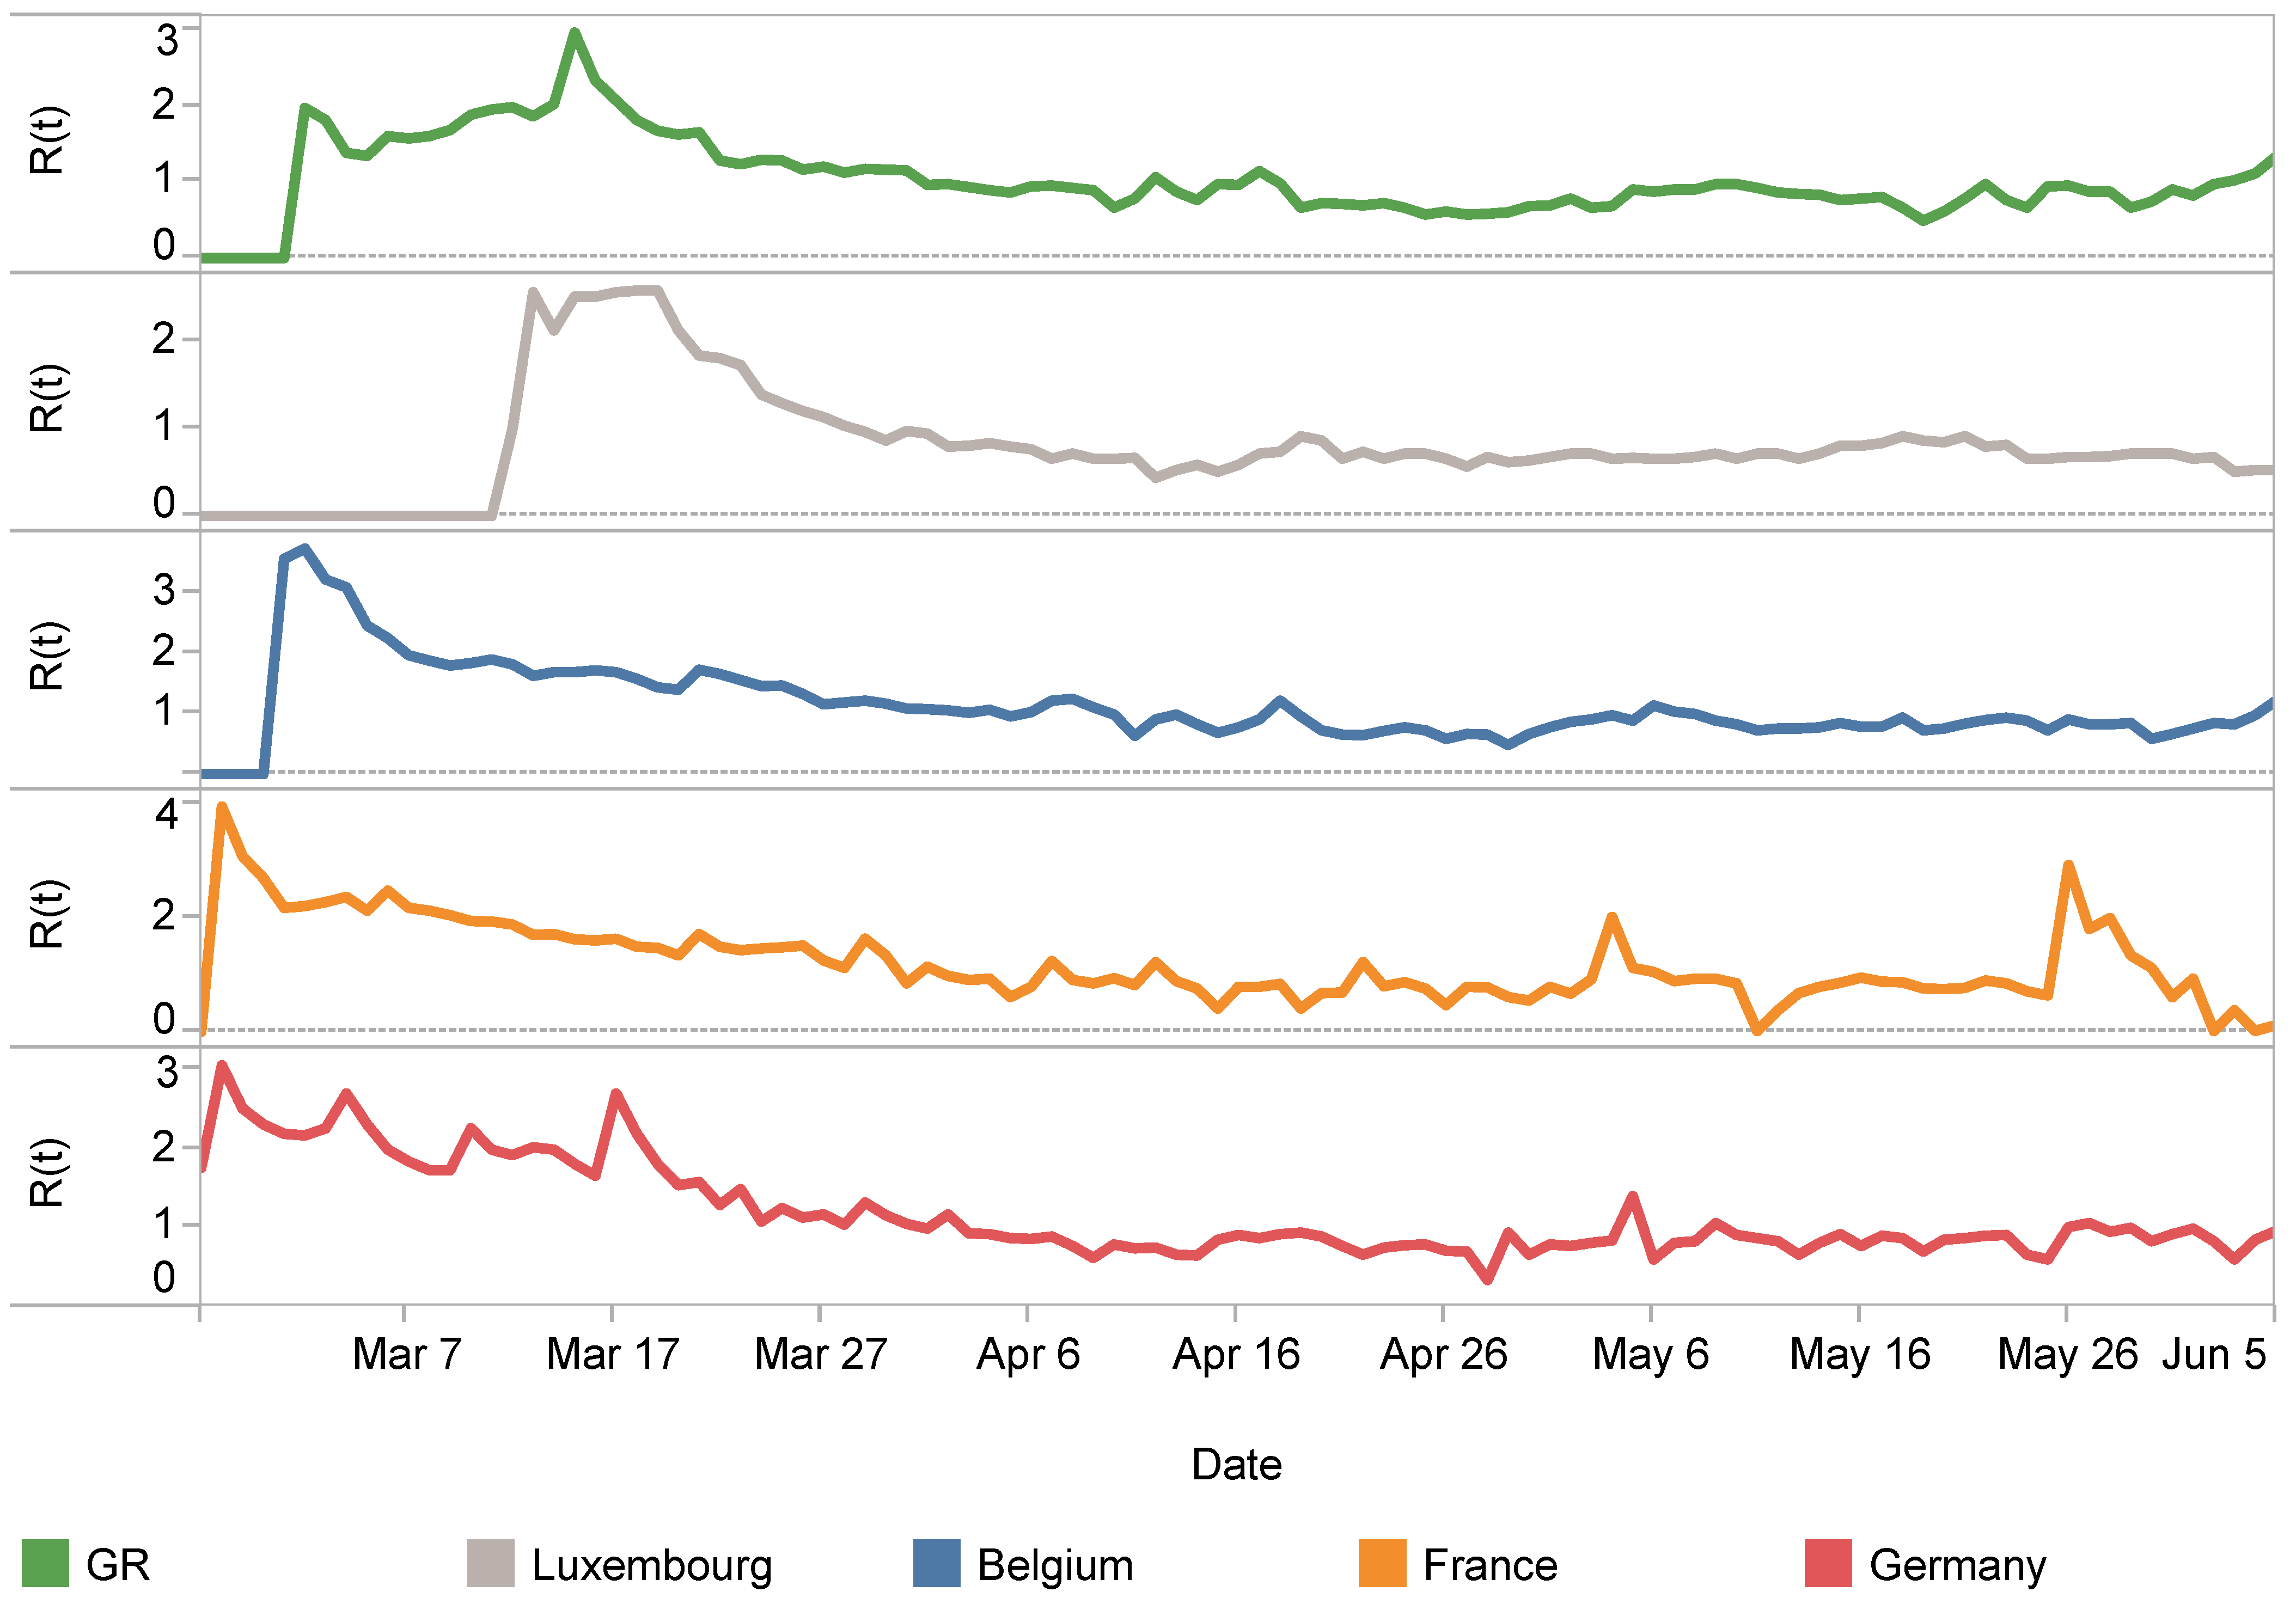
is the expected number of cases arising directly from a single case in a population where all individuals are susceptible to infection [16] and represents the average number of new infections caused by an infected person at time t. If , the number of cases will increase, e.g., at the beginning of an epidemic. When , the disease is endemic, and when , the number of cases will decrease. For the calculation of real-time , we use a Bayesian approach [43] with Gaussian noise to calculate the time-varying based on daily new cases, which is also the official method for calculating in Luxembourg [44]. While the study of calculating of COVID-19 have not reached a consensus conclusion [45,46,47,48], we use estimated by WHO [49]. with , in this study. The results of time-varying for the GR, Luxembourg, Belgium, France, and Germany are shown in Figure 3.
The relationship between and the indicates the spreading ability of the virus. As the estimation of values is a range, we discuss here as a range as well. When , it indicates that the virus is spreading at a higher rate than natural transmission, and the number of cases is about to reach a peak. When , the virus spreads within the basic reproductive rate range, which implies that the effectiveness of the containment measures is not yet reflected in . In short, the virus is still spreading freely at its natural transmission. When , it means that the virus is spreading at a rate lower than , the transmission is impeded, and the containment measures are in effect. When , the virus spreads slowly, and can eventually die out.
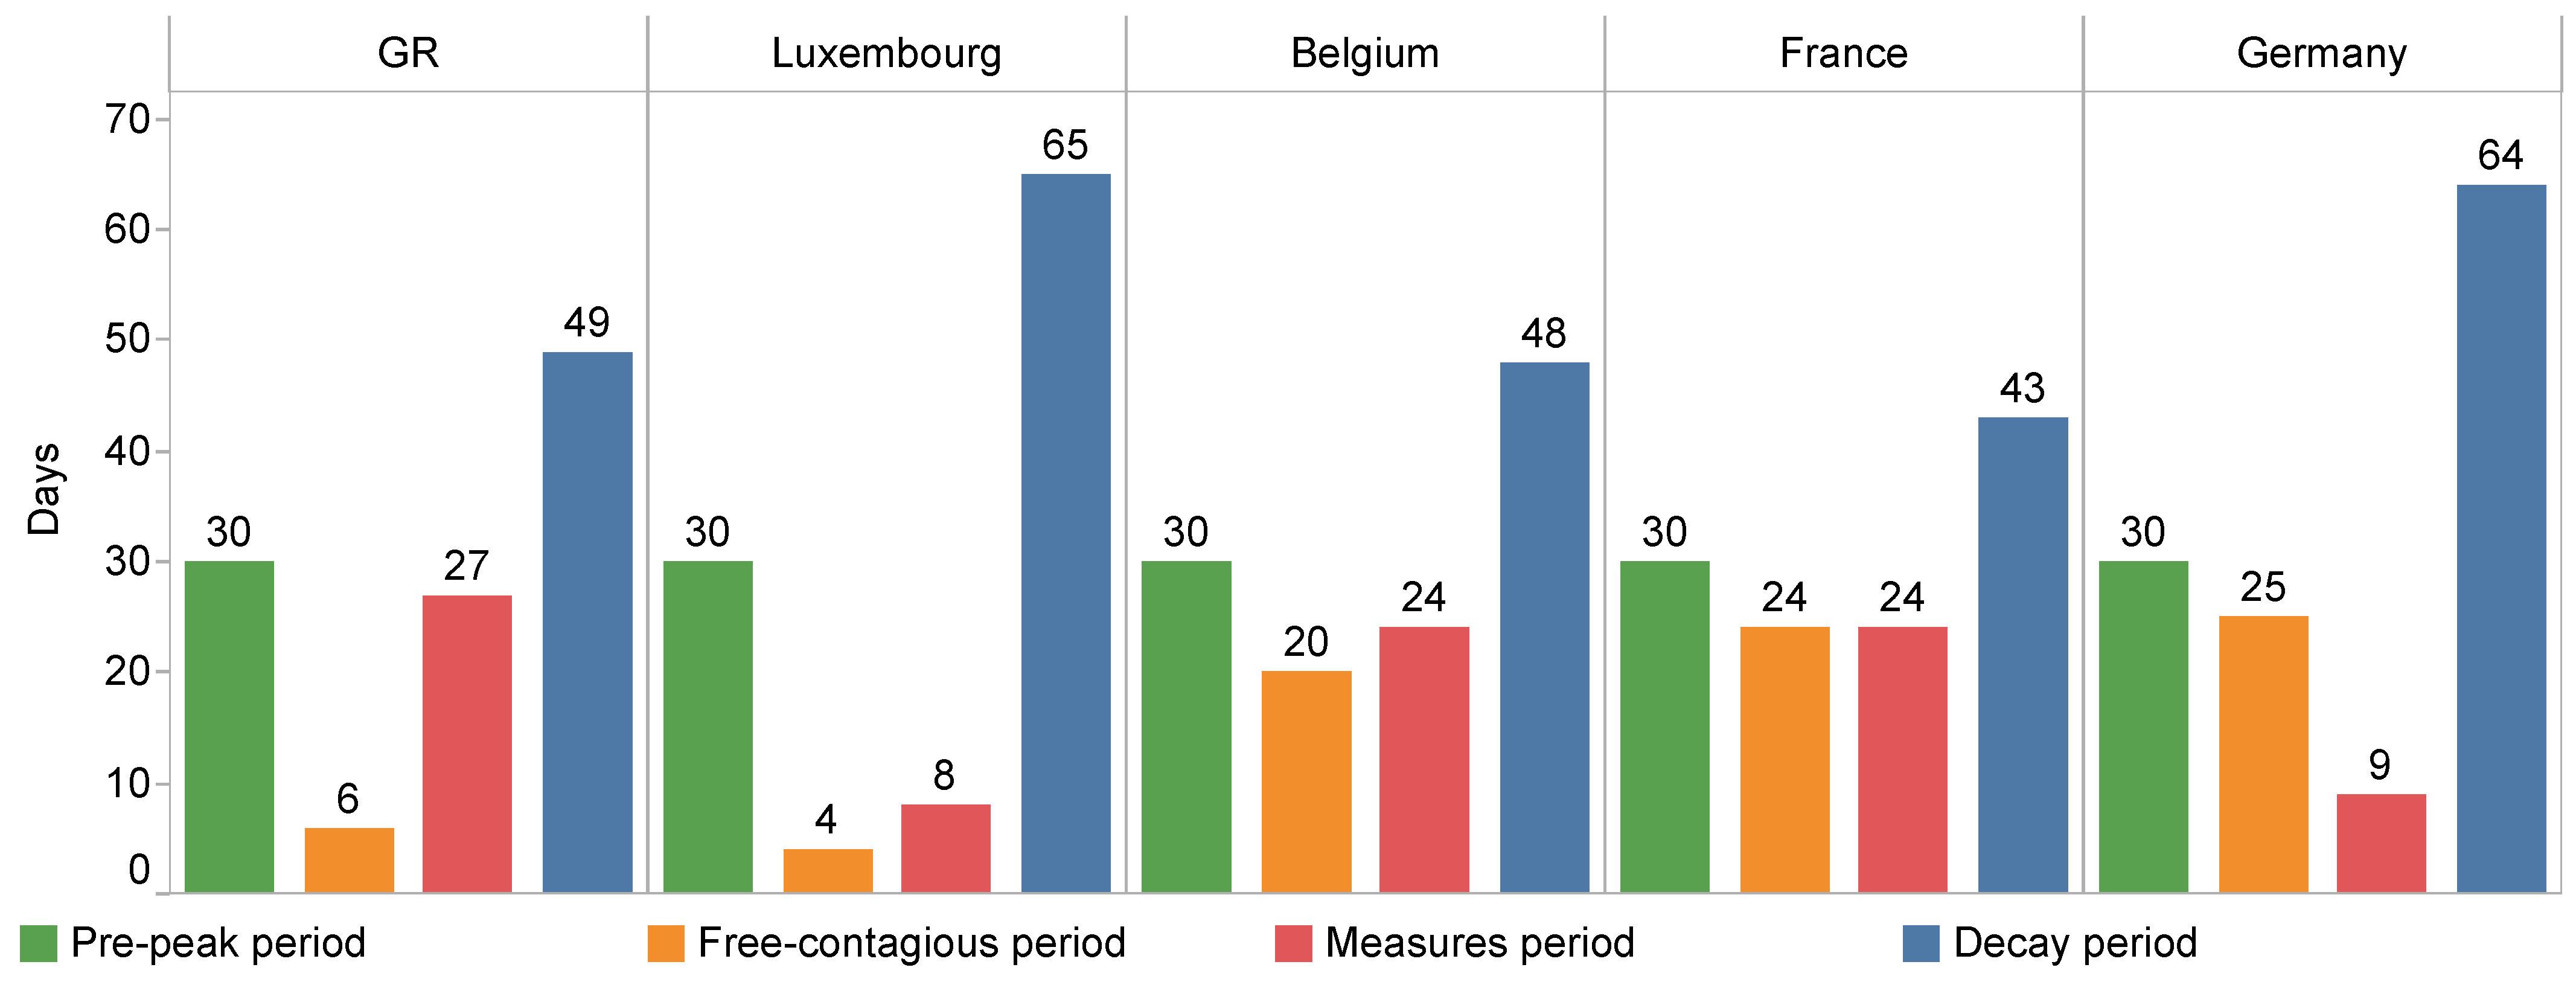
Here, we divide the pandemic into four periods based on the above analysis, which are: Pre-peak period (if peaks for the first time on day and begins to decrease, with on day , then the pre-peak period is the 30-day period before ). Free-contagious period (); Measures period (); Decay period (). It should be noted that the second wave of the pandemic did not begin at the time when this study was conducted, so this division of intervals only applies to this time period, i.e., from 22 January 2020 to 5 June 2020. The precise time duration of these pandemic periods for each country and region is summarised in Table 3.
The exact numbers of days of each pandemic period are shown in Figure 4 for the region and countries. The Free-contagious period in Luxembourg and the GR is particularly shorter (4 and 6 days) compared to other countries (24–20 days). Being a relational city characterised by high mobility, it may be relatively difficult to control the pandemic. The reason why the GR and Luxembourg, has a shorter Free-contagious period instead, will be discussed in Section 5 in terms of the public concerns that reflected by tweet text.
4.2. Research Question RQ1
To answer RQ1, we test the following hypotheses:
- H1
- There is a strong correlation between tweet volume and COVID-19 daily cases in the GR and related countries.
- H2
- Tweet volume can help predict COVID-19 daily cases.
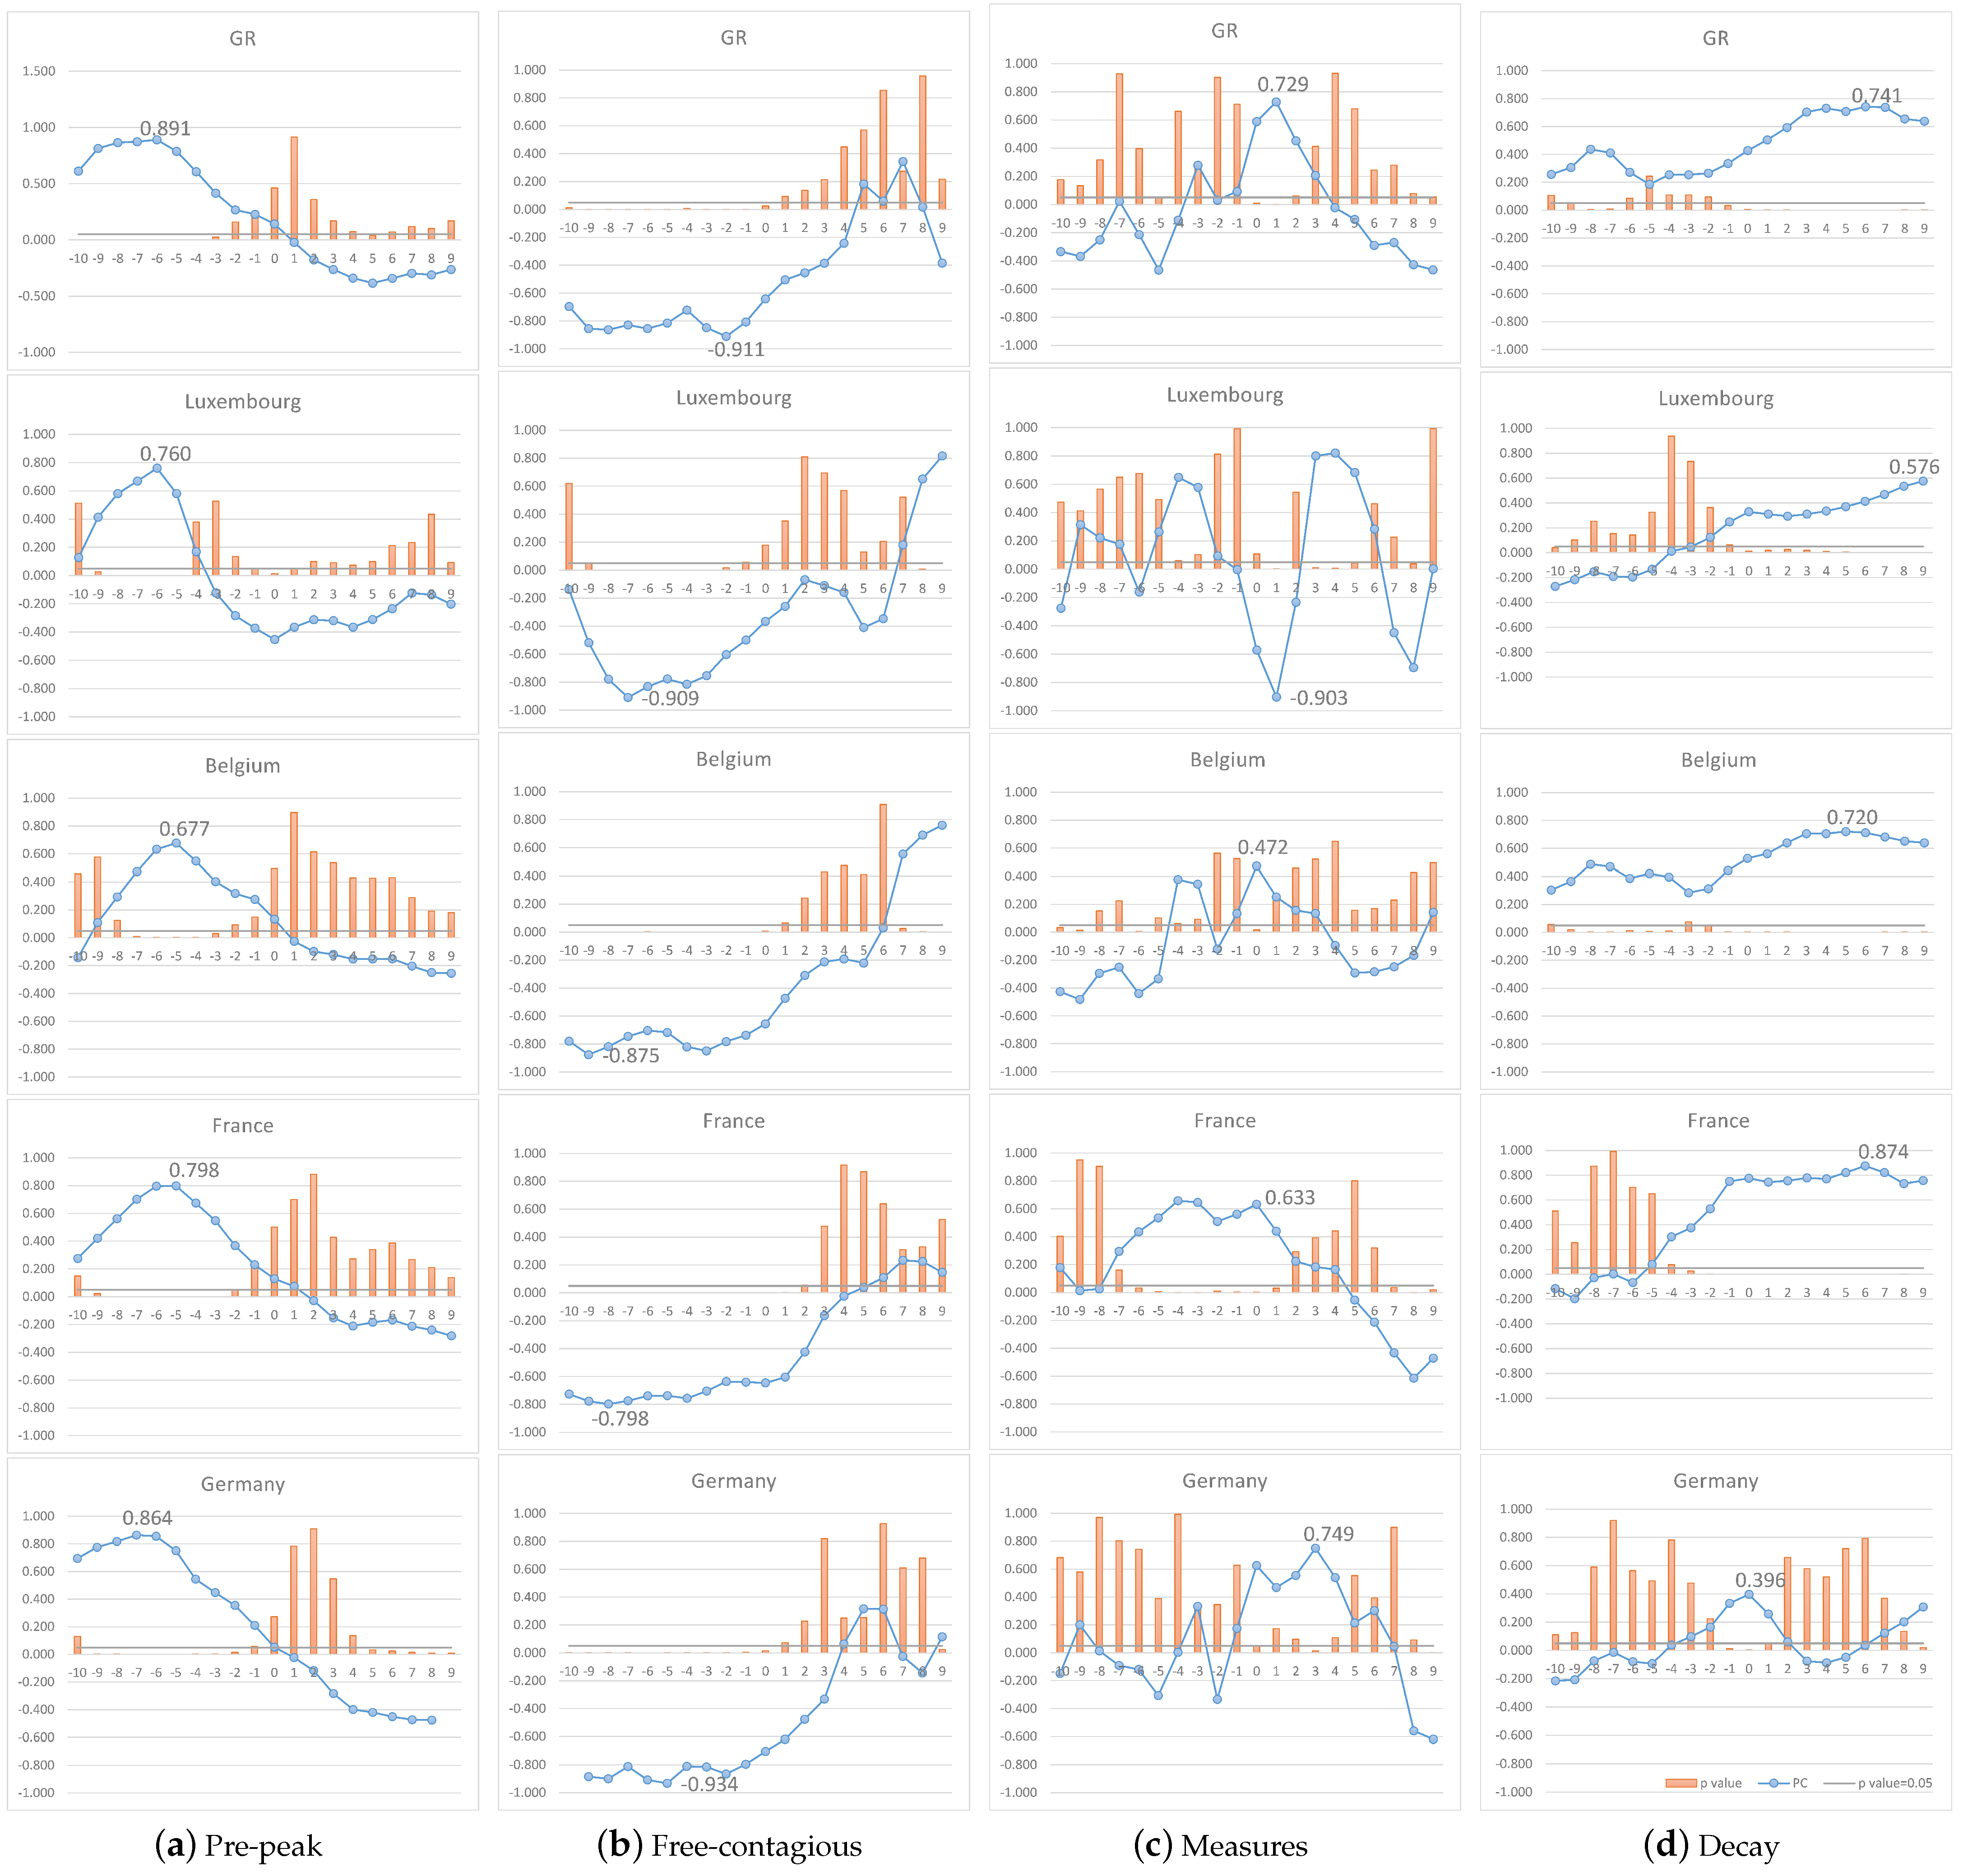
We calculate the correlation between tweet volume and COVID-19 daily cases by , where a with a large absolute value means greater relation strength. The results are shown in Figure 5. A lag refers to the tweets occurring after the cases; a Lag = −5 days means that we match the daily cases with the tweet volume from five days earlier, in other words, a 5-days lead.
Pre-peak period. As shown from Figure 5, there is a clear trend of strong correlation (, ) with lags during the Pre-peak period, reaching its’ maximum at −5 or −6days, indicating that a correlation exists between tweet volume and COVID-19 daily cases and tweet volume can help predict COVID-19 daily cases in this period. This is highly consistent to the conclusions presented in the existing studies [2,3,22,50].
Free-contagious period. There is no clear trend of correlation with lags except the value of Luxembourg, indicating that tweet volume cannot help predict the daily cases in the Free-contagious period. The period only lasted for 4 days in Luxembourg, which is too small to make a reflection of the correlation. However, the values show a highly negative correlation between tweet volume and daily cases. This indicates that there is a short downward trend in the discussion of the pandemic after it reached its peak, even though the number of cases continued to rise rapidly. This result validates the conclusion of Smith et al. [51] from our dataset, who noted that public concerns of disease decline sharply after the peak even though the infection rates remain high. In other words, the public concerns of the pandemic decline after the Pre-peak period.
Measures period. There is a clear trend of correlation with lags, tweet volume begins to level off, with a 0 or 1-day-lag moderate correlation (, ) to the daily cases. Tweet volume cannot help predict daily cases here because it fluctuates with the number of cases on the current or previous day. It is worth noting that Pearson’s coefficient is sensitive to outliers and is not robust. With too few dates included, a single outlier can change the direction of the coefficients. This period existed for only 8 days in Luxembourg, resulting in an anomaly value (). It is assumed here that fluctuating changes in tweet volume during this period are influenced by local news and policies, and further discussion will take place in Section 5.
Decay period. The correlations between tweet volume and daily cases occur in two ways. One is weakly correlated, the other reveals a correlation, but the trend of correlation with lags is insignificant. Both ways demonstrate that it is not possible to estimate daily cases with the help of tweet volume during this period.
In summary, with the Spatio-temporal analysis of the correlation between tweet volume and COVID-19 daily cases during the four periods of the pandemic, we reject the hypothesis that there is a strong correlation between tweet volume and COVID-19 daily cases in the GR and related countries (H1) and tweet volume can help predict COVID-19 daily cases (H2). More accurately, H1 and H2 can only be confirmed during the Pre-peak period. In this period, regardless of the time at which peaks, there is a 5–6 day lead between tweet volume and COVID-19 daily cases. Moreover, before the pandemic strikes, there is a high level of tweet volume regarding the pandemic. On the particularity of the GR, we find that the Free-contagious period in the GR and Luxembourg are exceedingly shorter (6 and 4 days, respectively), during the Measures period.
5. Topic Modelling and Classification of Tweets
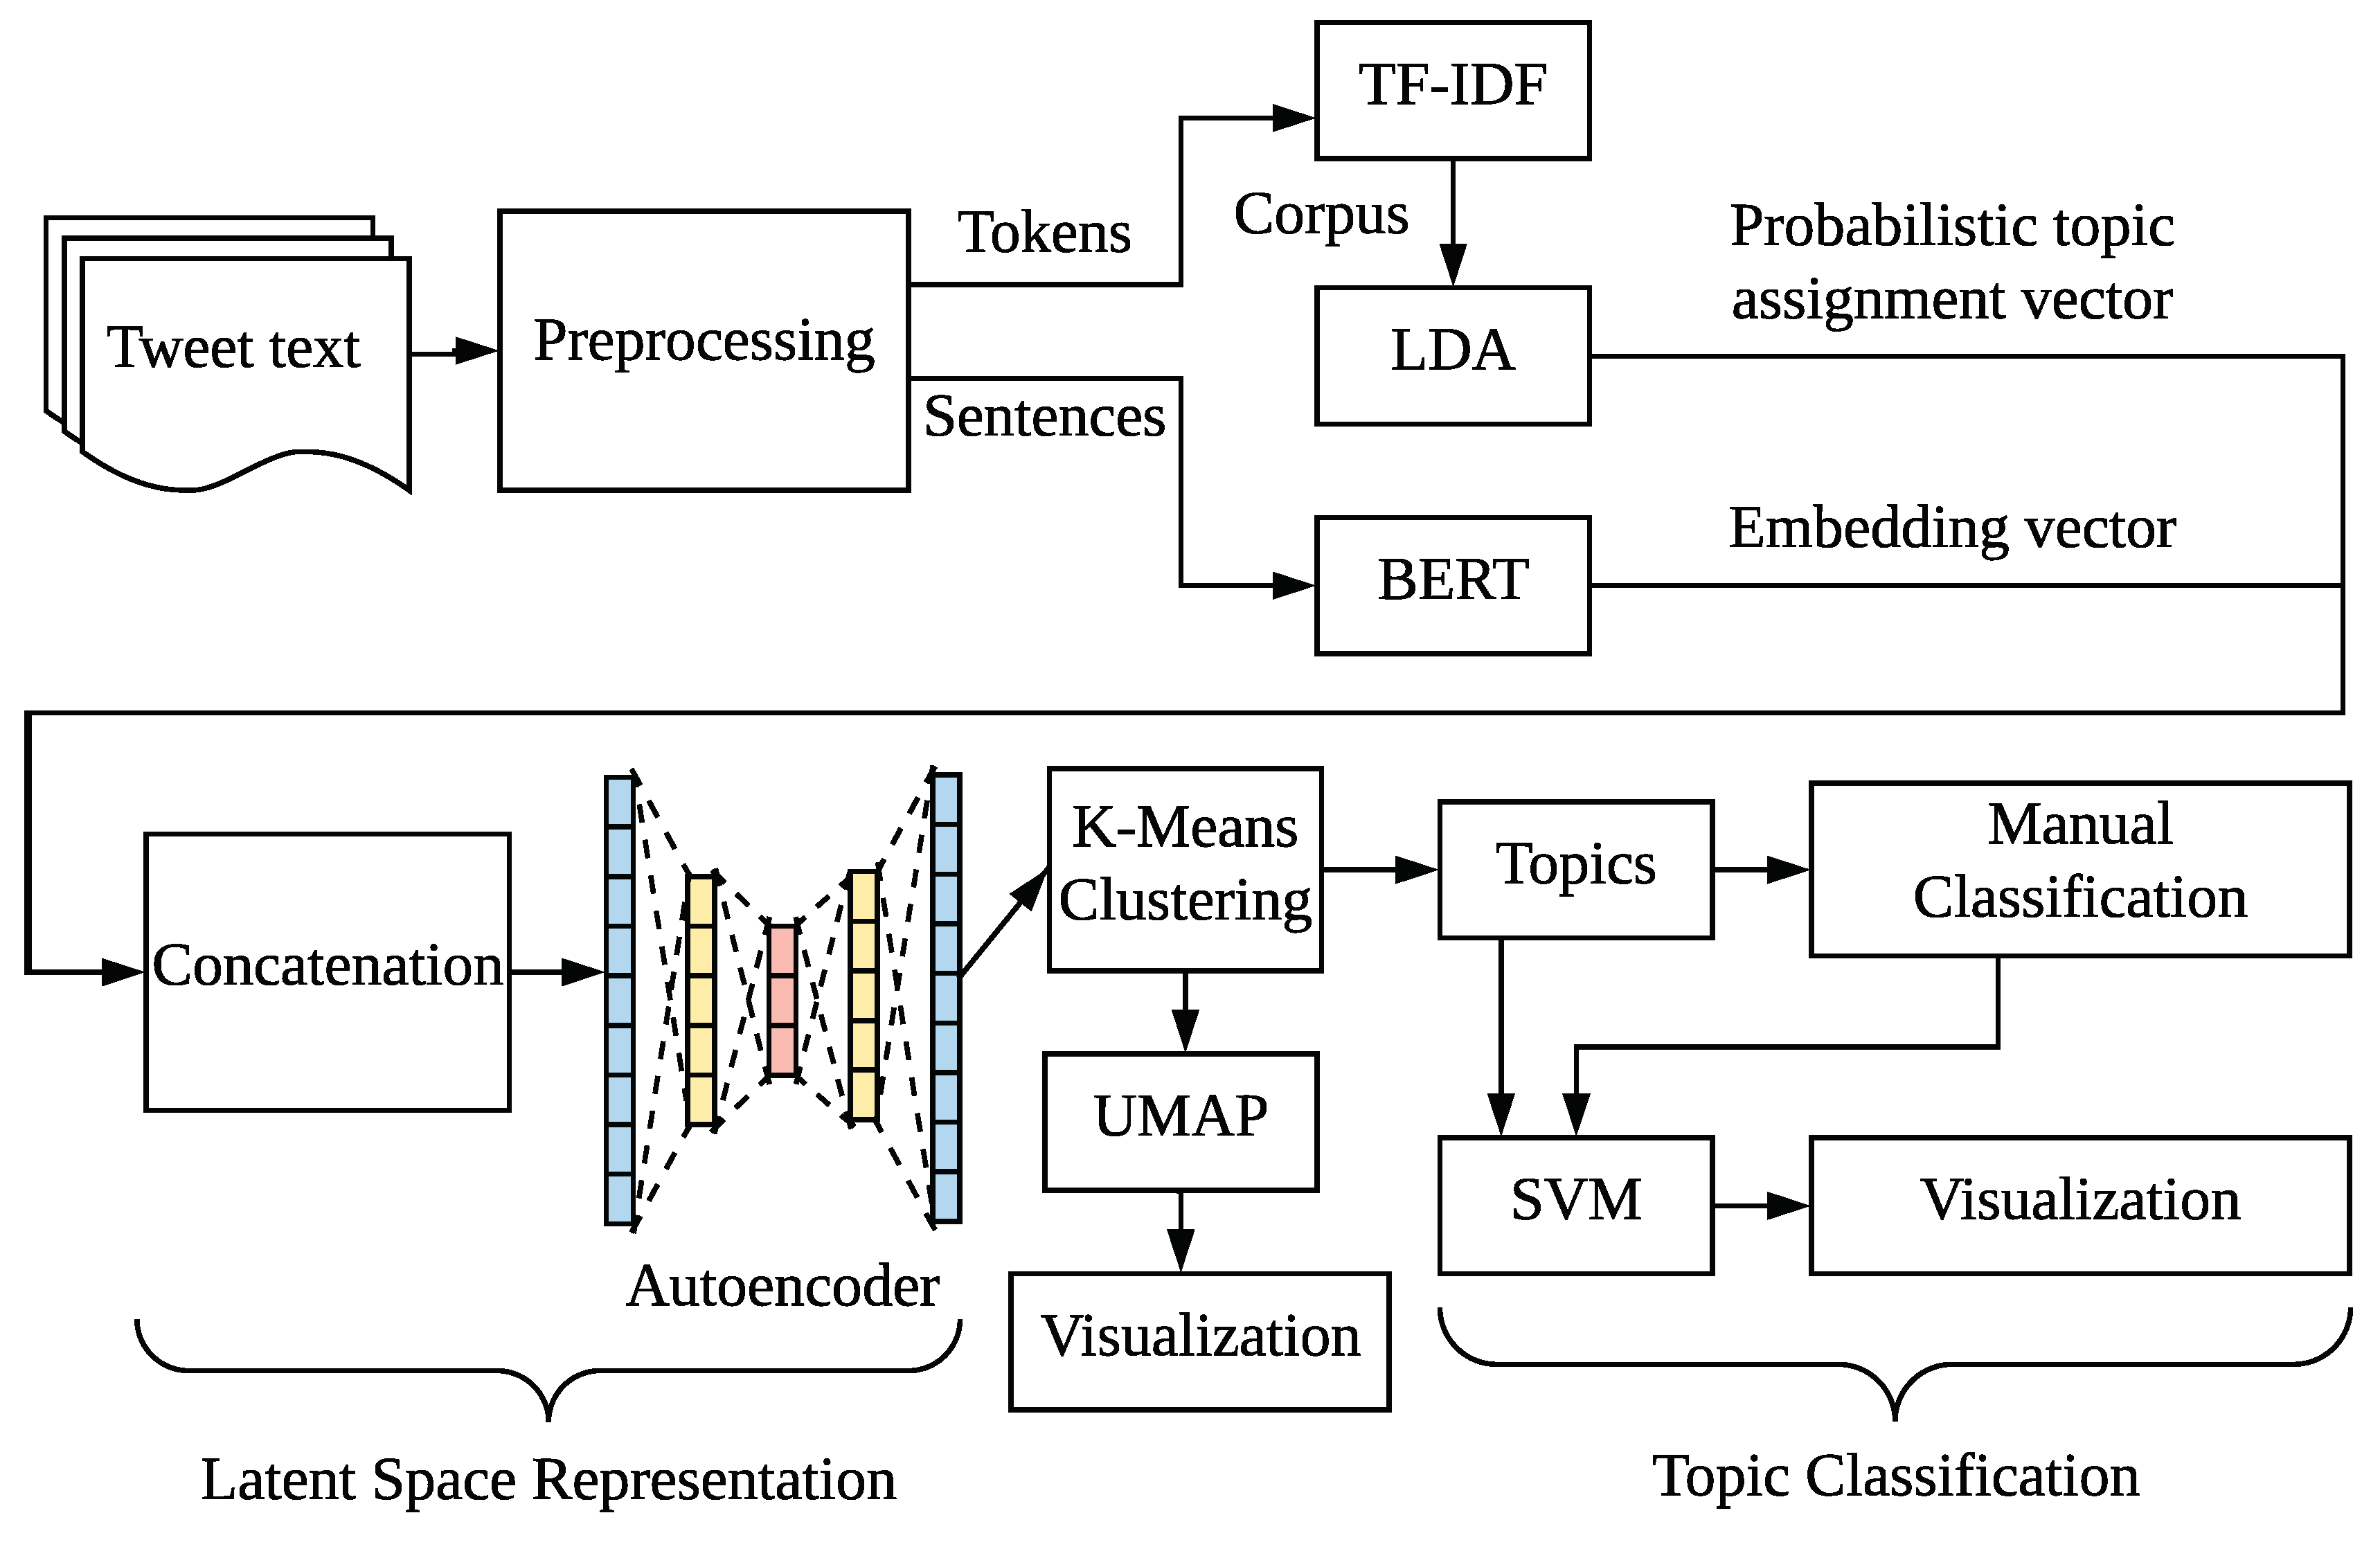
In the previous section, we conduct an overarching preliminary analysis of tweet volume, but without the in-depth discussion of tweet text. In this section, we build a workflow to analyse tweet text as shown in Figure 6. This workflow includes tweet text pre-possessing, topical modelling, and classification of the generated topics, each part is described in details below. We perform topical modelling on the tweet text to extract the main topics discussed every day in each region and country. After extracting the tweet text topics, we generally followed the pipeline of previous studies [52,53]. However, the number of topics extracted in previous studies was relatively small, so the topics were classified by manually labelling. The number of topics we extract is relatively large. Hence, we take a supervised learning approach and train a classifier to distinguish these topics into 7 categories in order to observe and analyse the changes in the topics discussed in each region and country during different periods of the pandemic. In parallel, we observe and investigate the changes of topic categories, and focus on the differences that exist in the GR.
5.1. Text Pre-Processing and Topic Modelling
Text pre-processing. Prior to topical modelling, the tweets data needs to be pre-processed. All text are lower-cased, while URLs that mention usernames and ‘RT’ are removed as well. Besides, punctuation and numbers are filtered out, typos are corrected by Symspel [54] and stop words are removed. Since the tweets are collected based on the keyword search, each tweet contains keywords such as “coronavirus”, “koronavirus”, “corona”, “covid-19”, and “covid”. As these frequent subject-specific words are unlikely to assist for classification and topic modelling [55] and result in a large number of topics in the final result containing these words, rather than a more precise topic about COVID-19. In detail, if these general high-frequency keywords are not removed, these words will be ranked high in the results of topic modelling. As a consequence, this will make the final extracted topics not well represent the topics of the clusters of tweet text. Therefore, we considered these words as subject-specific stop words and remove them following Älgå et al.’s work [56].
Topic modelling. Aiming to identify the latent topics of the tweets posted by the public in the GR and related countries, we adopt the general structure of contextual topic embedding method (CTE) [57] to extract daily topics and get a more accurate picture of topic trends. CTE mainly consists of two components, LDA and BERT, to extract different information from sentences to embedding.
LDA, a bag-of-words approach which is widely used to identify latent subject information in a large-scale archives or corpus has its drawback: it needs large corpus to train, ignores contextual information and performs mediocrely in handling short texts [34].
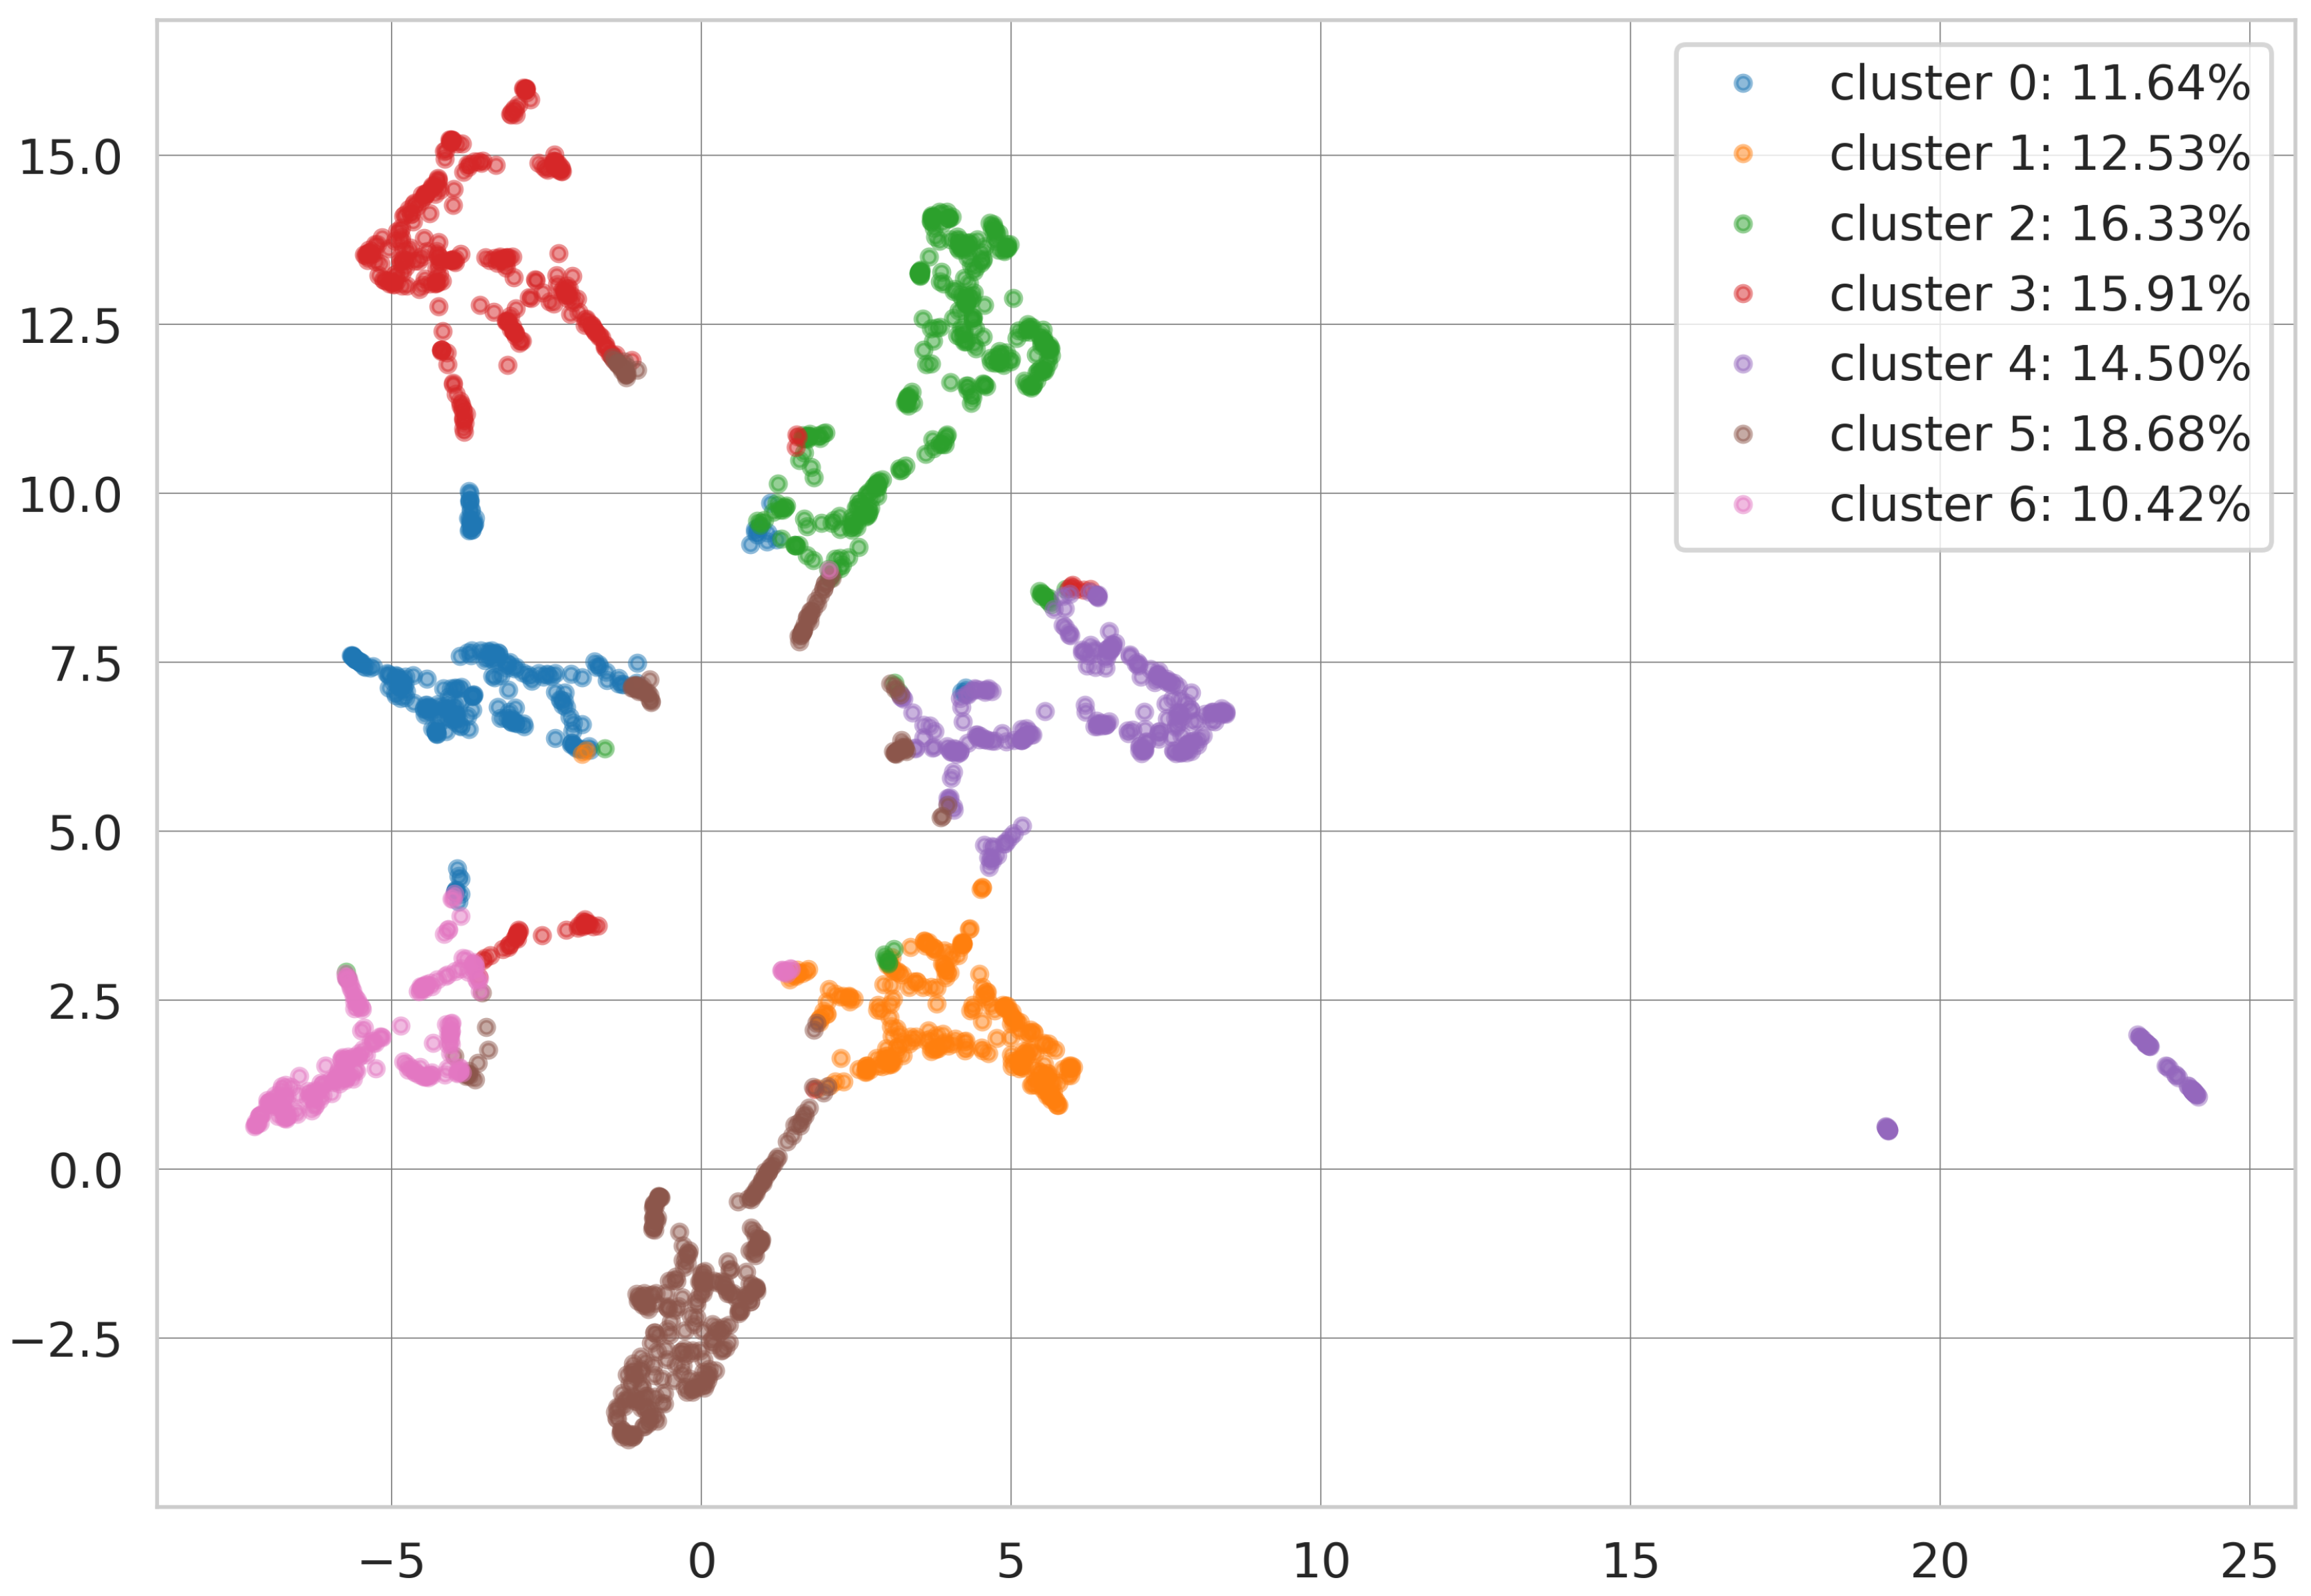
BERT utilises bidirectional transformers for pre-training on a large unlabelled text corpus, taking both left and right context into account simultaneously, which compensates for the shortcoming of LDA. Also, BERT is a method available for sentence embedding, thus we concatenate the generated tokens of each tweet text as input sentences for BERT to obtain sentence embedding vectors. CTE combines the sentence embedding vector generated by BERT with the probabilistic topic assignment vector generated by LDA with a hyper-parameter . After obtaining the concatenated vector in high-dimensional space, CTE uses an autoencoder to learn a low-dimensional latent space representation of the concatenated vector with more condensed information. Then k-means [58] is implemented for clustering, and the number of clusters k, that is, the number of topics, reserved as a hyper-parameter. We extract the word frequency in each cluster, sort and then take the top ten as the representative topics of that cluster. In terms of visualisation, Uniform Manifold Approximation and Projection (UMAP) [59] is used for low-dimensional latent space degradation, which is the state-of-the-art visualisation and dimension reduction algorithm.
The CTE rather than a single LDA model is chosen as our topical modelling approach due to the fact that LDA is designed for monolingual contents and lacks the structure necessary to generate effective multilingual topics [60]. The GR, as a relational city, are multilingualism. CTE includes BERT, a sentence embedding model that can handle multi-language, can tackle this problem. Two adjustments are therefore made to the original CTE. For one, we adopt the BERT-based multilingual model as the pre-trained model in BERT [17] In addition, some words appear less frequent than in English which is predominantly spoken and are easily overlooked in LDA. Thus, we adopt the TF-IDF model to determine word relevance in the documents [61]. We further feed the generated corpus by TF-IDF to LDA, instead of simple bag-of-words corpus.
Average coherence score [62,63] and average silhouette score [64] are utilised as the metrics of CTE. We calculated an average coherence score by calculating the topic coherence for each topic individually and averaging them. The hyper-parameters are tuned to obtain the best results. The value of k is chosen from and the value of is chosen from . The model arrive at the optimal with and .
The results are shown in Table 4 and a sample of clustering result from UMAP is shown in Figure 7. It can be observed from Table 4 and Figure 7 that the results generated by CTE are coherent and can be observed as well-separated clusters.
We extract topics by day for 137 days from the text of each country’s tweets and region and get a total of 4795 topics. Since the essence of CTE is to cluster the tweet text’s embedding vectors and extract the top ten words with the highest frequency in the tweet text corresponding to all vectors in each cluster as the final topic. The clusters containing too few tweets and their corresponding topics do not convey information well, so we remove the topics containing no more than 2 tweets from the clusters and end up with 4763 topics. Then we randomly selected 51% (2435 in total) of the topics from each country and region for manual labelling following the central idea existing work [65,66]. We used three annotators to label these topics and only labels that are agreed by at least two annotators can be used as the final label.
5.2. Topic Classification
We classified the 2435 topics manually into the following 7 categories:
- ‘Wuhan and China’: Topics about Wuhan and China.
- ‘Measures’: Topics about basic information including symptoms, anti-contagion and treatment measures of COVID-19.
- ‘Local news’: Topics about local COVID-19 news, including daily new cases, deaths, etc.
- ‘International news’: Topics about international COVID-19 news
- ‘Policy and daily life’: Topics about COVID-19 related policies encompass lockdown, closure of borders, limits on public gatherings and the impact of the policies on daily life.
- ‘Racism’: Topics about racism.
- ‘Other’: Other topics.
The division of these 7 categories is based on the classification of COVID-19 related Twitter topics analysis in existing studies [32], and is determined empirically on the basis of common knowledge and the status quo.
These manually classified topics are used to train a Support Vector Machine (SVM) [19] for supervised classification. The reasons for training a classifier instead of manually labelling all the topics are, on the one hand, the classifion of all the topics manually is time-consuming, and, on the other hand, the classifier can be used in further studies.
Words of each topic are converted to word frequency vectors with TfidfVectorizer and country are encoded with Label Encoder [67]. The feature vector is consisted by these two elements. Since our manually labelled dataset is imbalance in classification, Synthetic Minority Oversampling Technique [68] is utilised for oversampling imbalanced the dataset and mitigate imbalances. The dataset is split, of which is the training dataset and the test dataset. Grid search with 10-fold cross-validation is deployed on training dataset to find the optimal hyper-parameter, and the final SVM model is obtained with the entire training set Table 5 shows the precision, recall, F1 score, support and Macro-average F-Score of the trained classifier for each topic category. Then, the obtained SVM model classifies the rest of topics. Table 6 shows the number of topics of each category for each country and region.
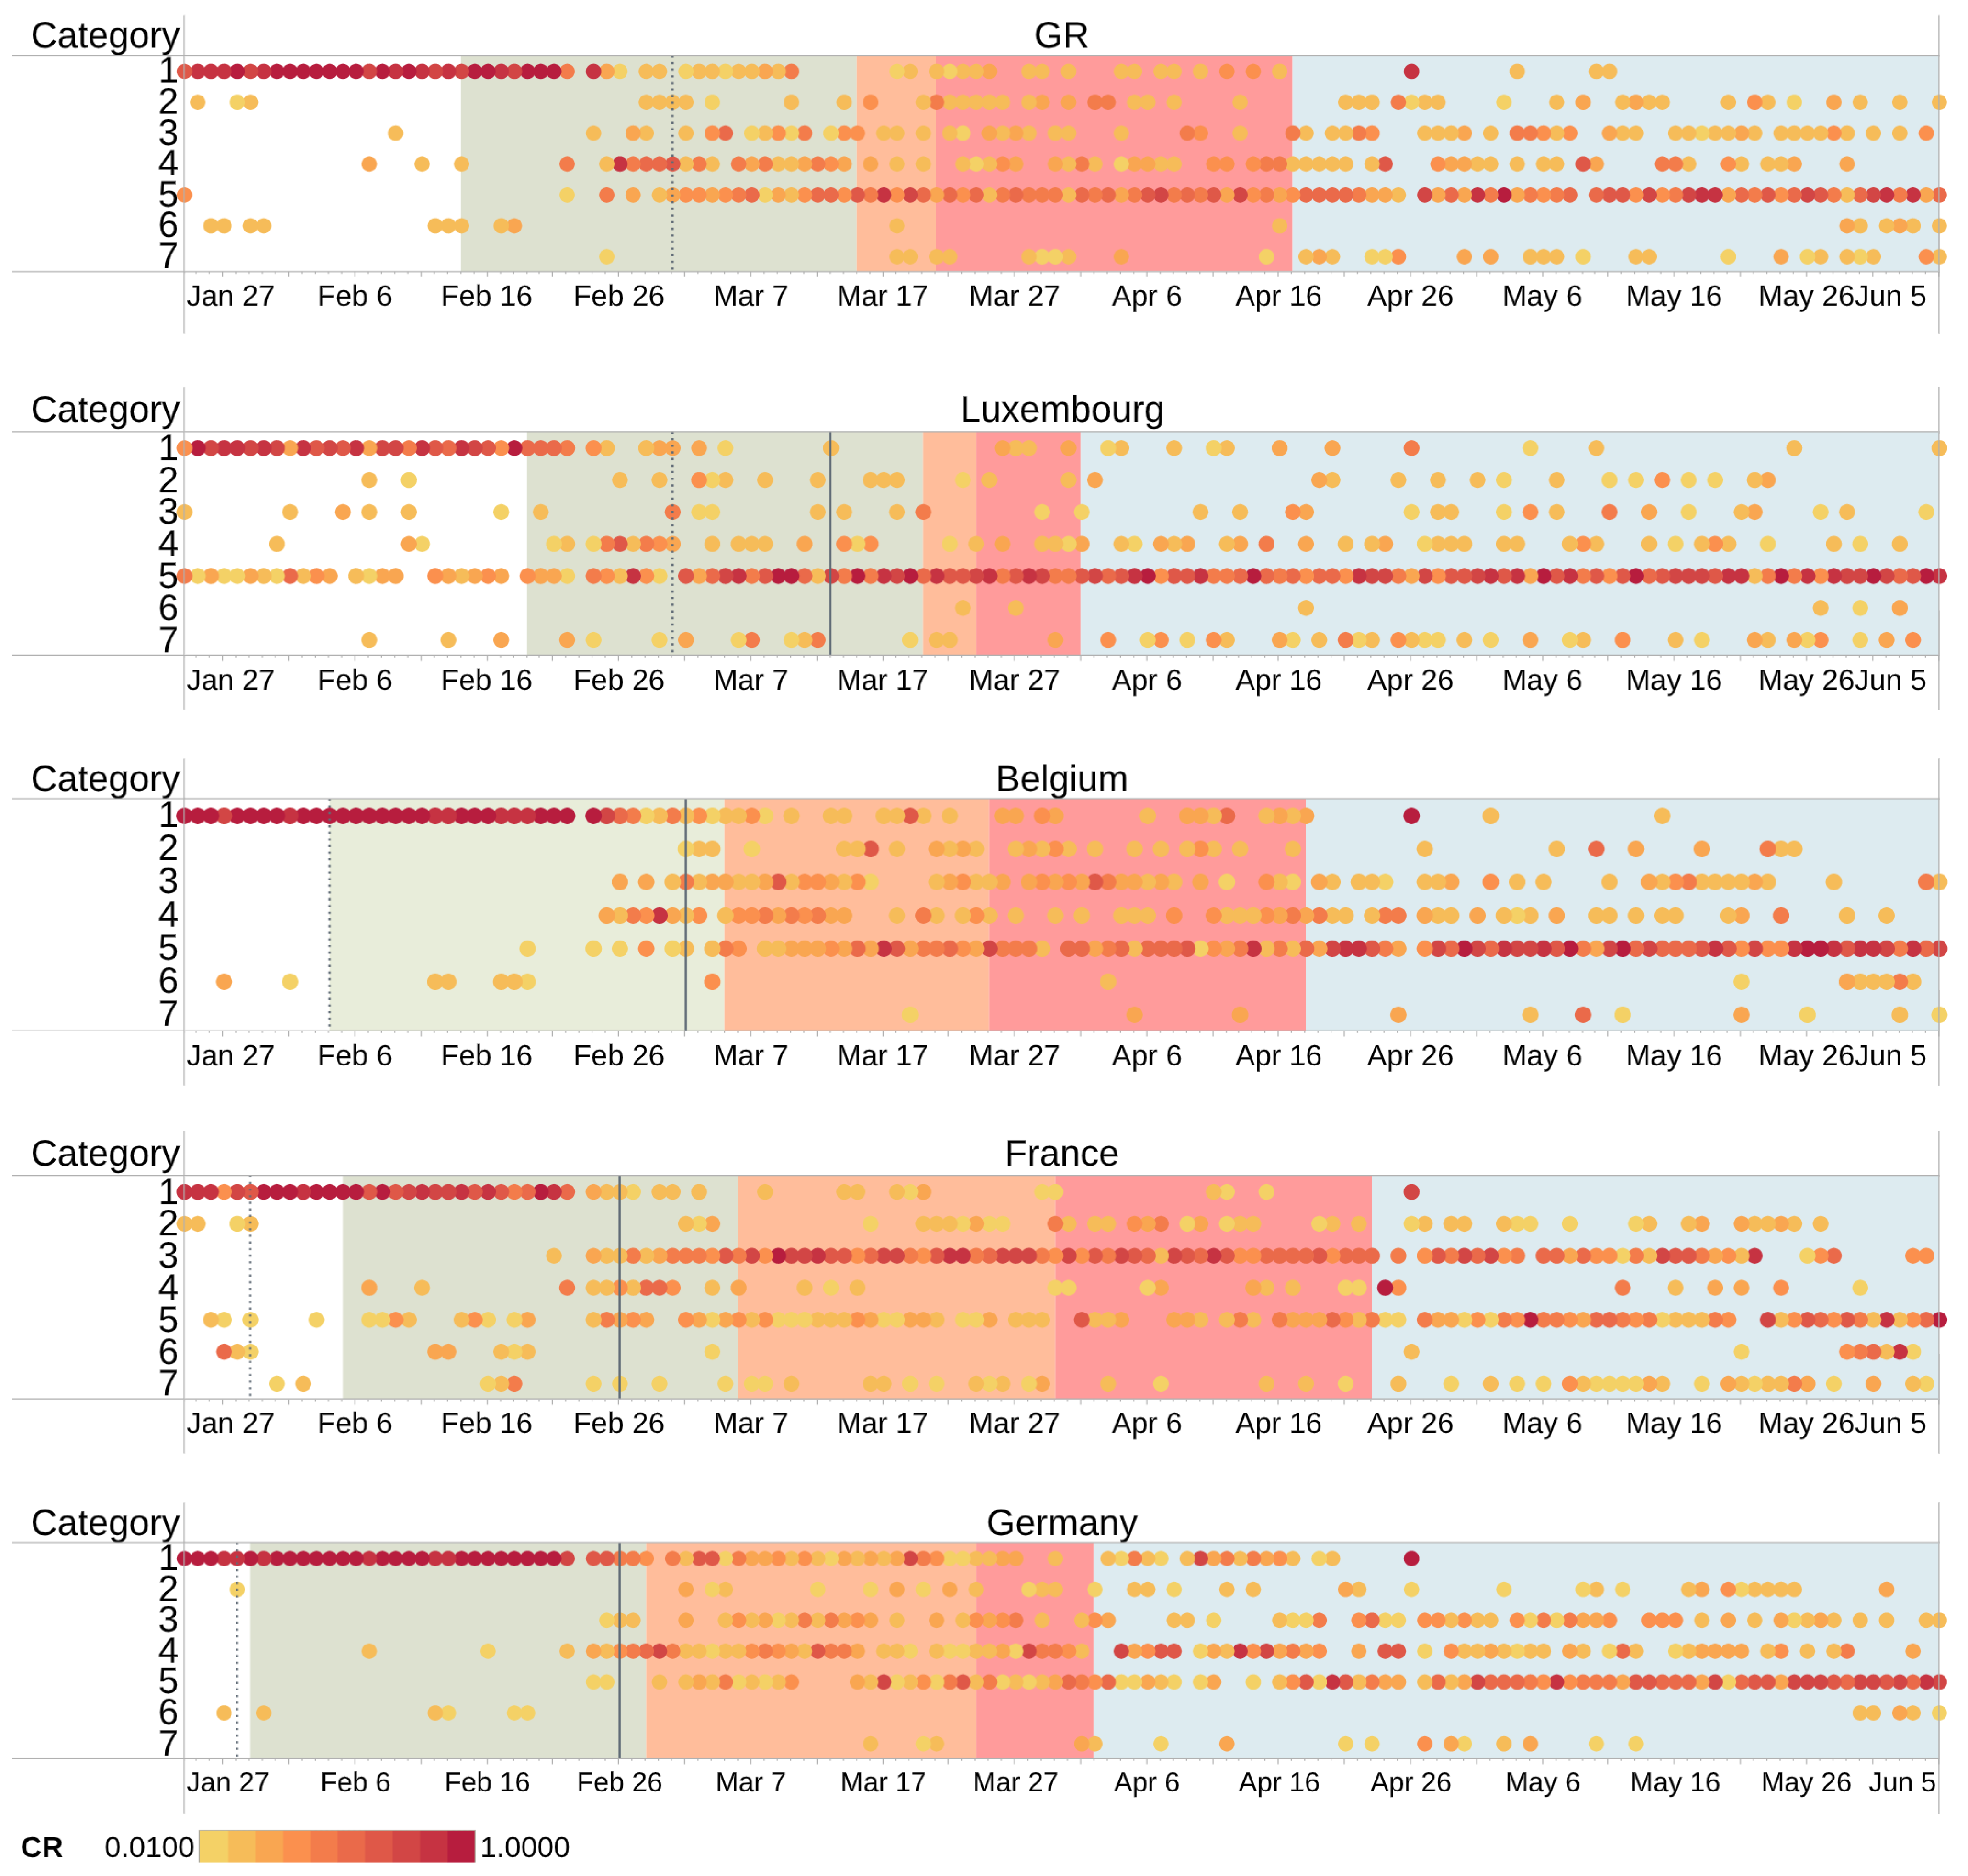
The categories with higher percentages are topics of Wuhan and China and policy and daily life. In general, the number of topics about policy and daily life is much higher in Luxembourg () than in other countries (). France, on the other hand, shows a high level of interest in local news (), compared with other countries (). In terms of the overall data of the GR, however, it does not show particular differences compared with other countries. Note that as there may be cases where the cluster for a topic contains no more than two tweets, we treat such topics as the invalid topic and remove them. This leads to a different total number of topics in each country. Next, we introduce dates to plot the changes in categories over time.
Figure 8 shows the tweet volume contained in each category demonstrated in the form of percentage of the total tweet volume on that day (CR), with the darker red representing higher CR. The interval colored in white represents the period from 22 January to the start of Pre-peak period, other regions in different colours indicate, in sequence, Pre-peak period, Free-contagious period, Measures period, and Decay period. The black dotted line illustrates the date on which the first case appeared. The figure shows an interval between the date of the first case and the date of consecutive cases every day in the GR. The solid black line indicates the date that new cases appear every day since that date. For ease of discussion, we name the day as ‘outbreak day’ (OD).
5.3. Research Question RQ2
In this section, we aim to answer RQ2, i.e., how do the categories of topics discussed change over time in each country and region? Does the changing scenario of the topic categories in the GR differ from that of other countries?
Figure 8 reveals that initially, the main topic in all the countries and region is about China, but over time the categories of topics change. In France, Germany and Belgium, the appearance of the first case trigger only a small amount of discussions about the protective measures, and related discussions do not start to increase until OD. In other words, the public concerns in these region and countries do not really heed the protective measures until OD, when the virus is already spreading. The change in topic is at odds with the conclusion of Bento et al. [8] that the announcements of the first case have the greatest impact on the public concerns for searching basic information about COVID-19 and its symptoms.
Moreover, the report of first case does not stimulate discussions about policies and daily life as well, and discussions about it do not emerge frequently until OD. This may be explained by the existence of a large interval between the date of the first case and OD (27.3 days on average) in France, Germany, and Belgium. During this interval, sporadic cases may not attract enough public concerns, and the public’s concerns is still focused on China-related news.
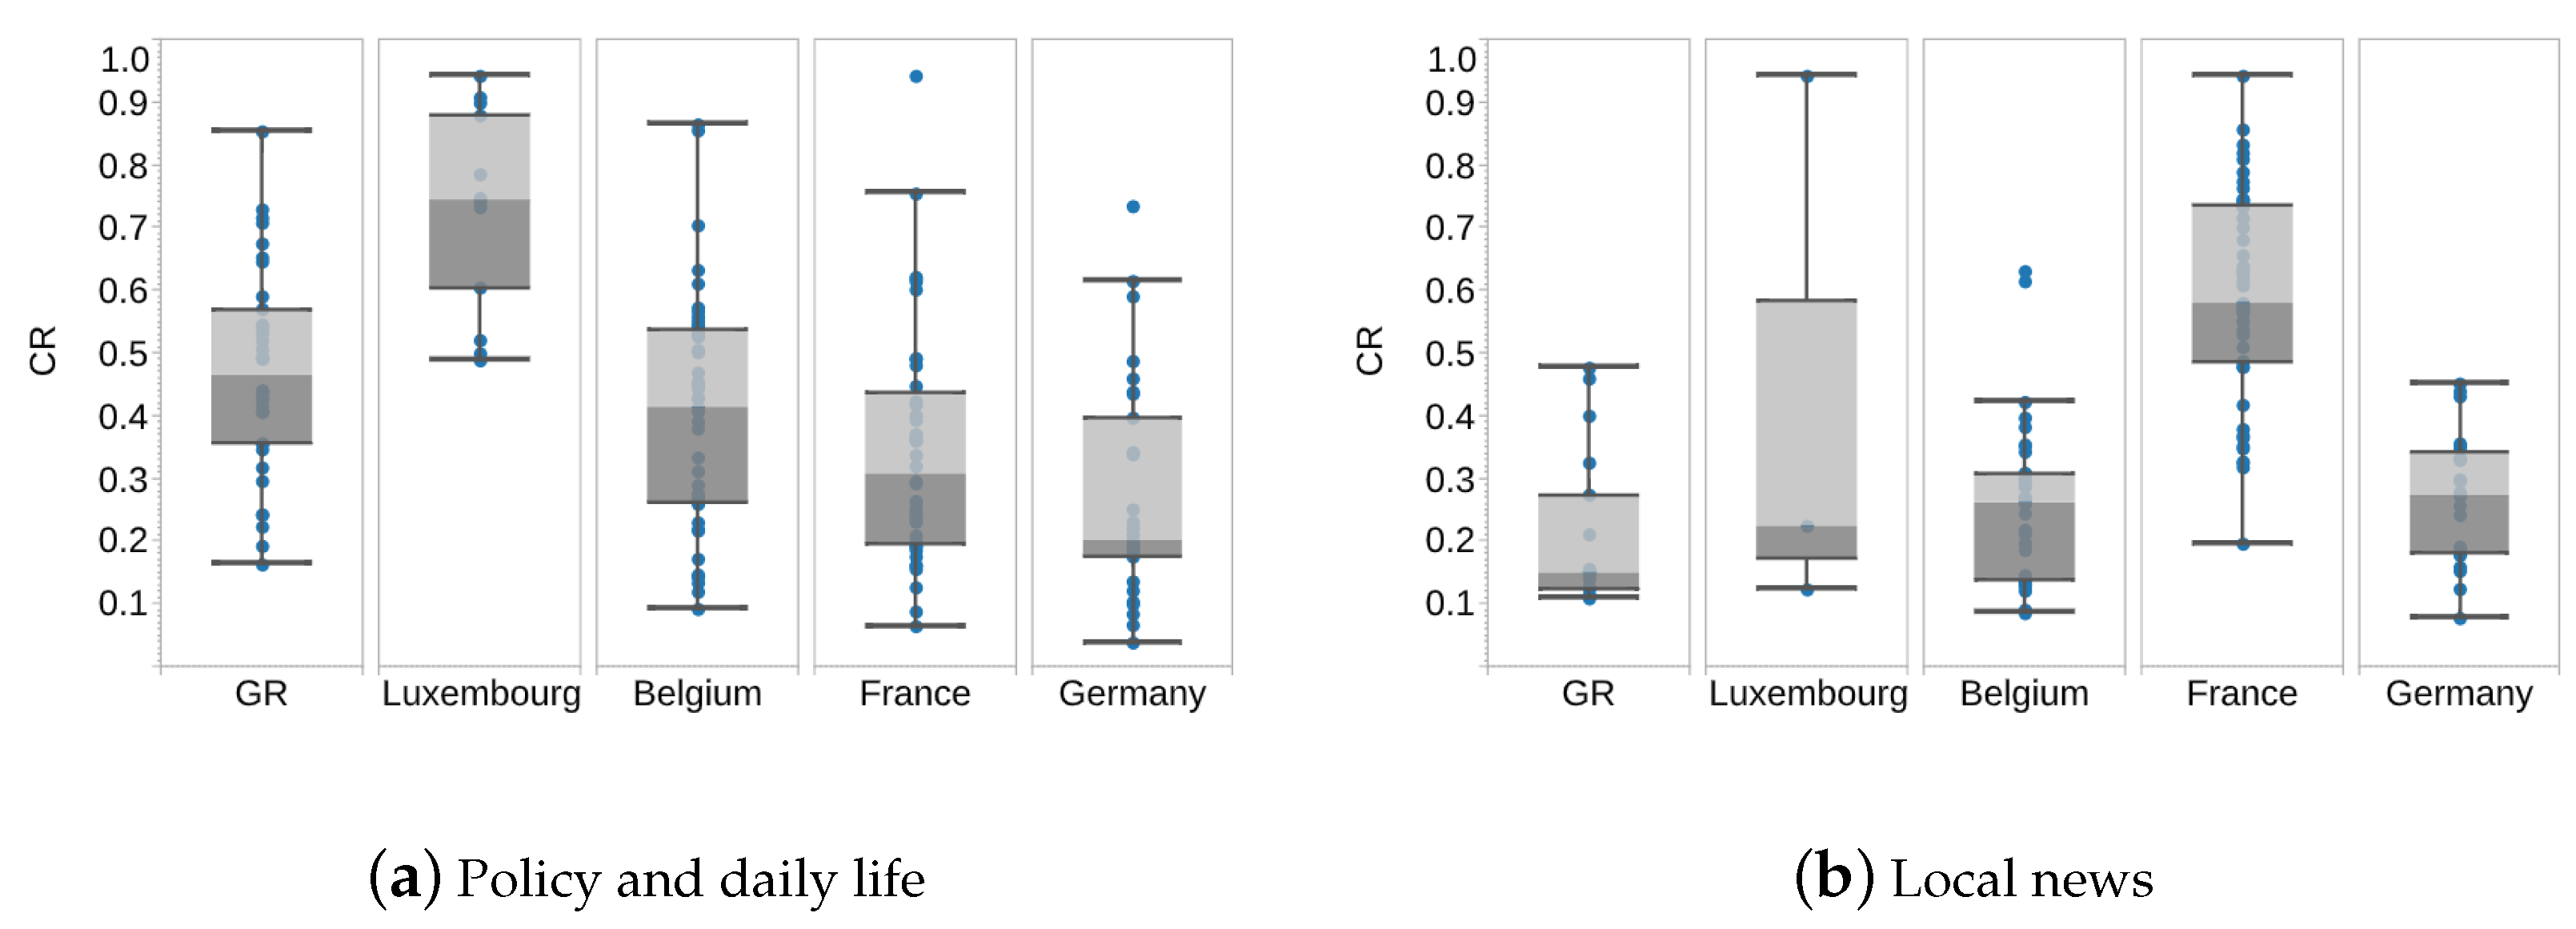
The situation is different in the GR, a relational city, and in Luxembourg, its centre. Figure 8 shows that the public in Luxembourg and the GR start to have discussions about measures 1–2 days before the first case appears. Furthermore, during the Pre-peak period, the CR of measures is much higher in the GR () and Luxembourg () than in France (), Belgium () and Germany (). It should be noted that discussions of measures are not totally non-existent in Germany, but the tweet volume may be too small to be recognised as separate topics during the topic modelling process. By comparing the topics discussed in other countries of the same time, this may be explained by the late occurrence of the first case in Luxembourg and the GR, where the other three countries have already passed OD, the outbreak in other countries may have attracted public concerns in the GR and Luxembourg. Concurrently, the results indicate that the GR exhibits a high level of interest in policy and daily life with of total tweet volume during the Free-contagious and the Measures period, while for Luxembourg, this rate is . Figure 9a shows boxplots of the distribution of the CR on policy and daily life during the Free-contagious and the Measures period. This shows that the public is more responsive to policies as a region that relies on foreign labour and has high mobility than Belgium, France and Germany.
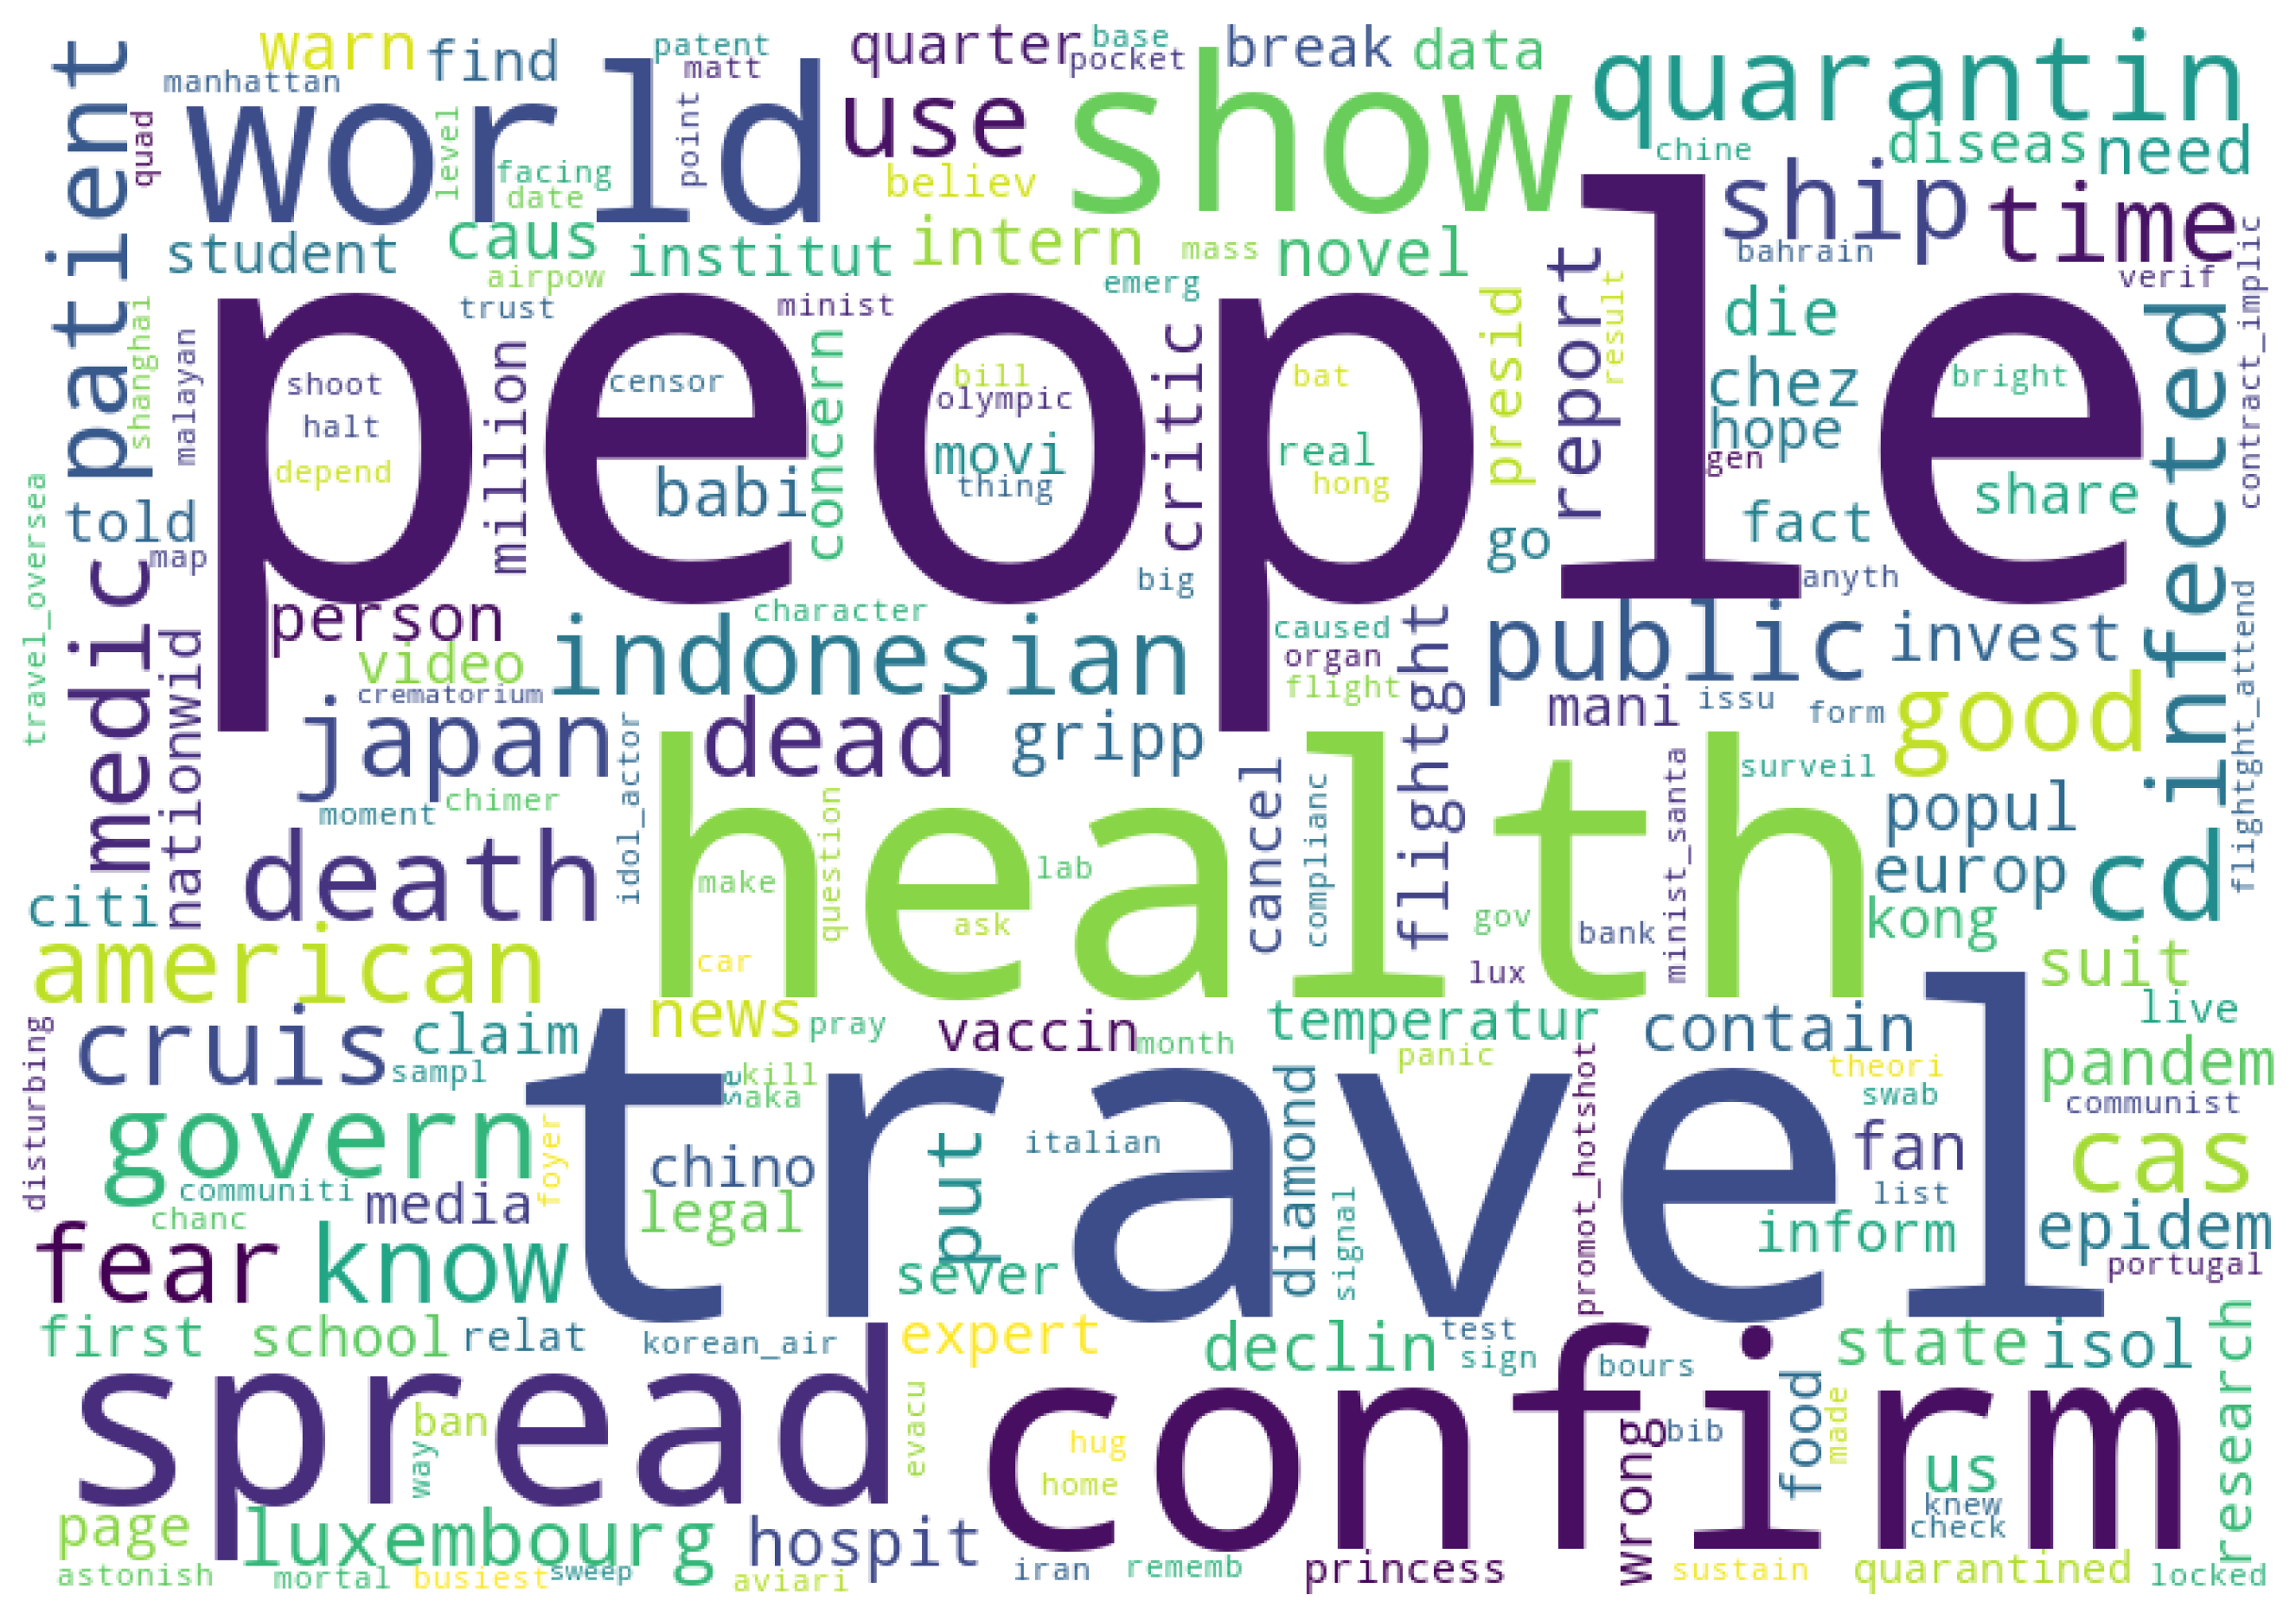
The reason why Free-contagious is a period more transient in Luxembourg and the GR compared with other regions is still unclear, but part of the reason may stem from the fact that the public concerns to the virus itself during Pre-peak period led to better responsiveness to the anti-contagion policies in these region and countries. Interestingly, in Luxembourg, the discussion about policies and daily life persisted before the first case is announced and increased immediately after then. A word cloud of the topics from 22 January to 1 March (date of the first case) of Luxembourg is depicted in Figure 10, this shows that the topics are mainly travel-related. This may be explained by the fact that the proportion of foreign residents in the Luxembourg region is % [69], and residents are more concerned about travel-related policies in Luxembourg and other countries.
In addition, Figure 9b illustrates that the Free-contagious and Measures periods coincided with the France municipal election, and thus the public concerns in local news among French is higher. In the end, during the Decay period, while there is a downward trend () in the total daily tweet volume, there is a upward trend () in the CR of policy and daily life, except in Luxembourg, where the rate is consistently high.
6. Conclusions and Discussion
In this paper, we studied the information related to COVID-19 on Twitter, introduced the concept of relational city and chose the GR and its related country for our exploratory study. Our analysis has focused on two dimensions of pandemic information on Twitter, i.e., tweet volume and tweet text.
Based on the Spatio-temporal analysis of the correlation between tweet volume and COVID-19 cases during the four periods of the pandemic, our answer to RQ1 is that tweet volume and COVID-19 cases in the GR and related countries are correlated, but this strong correlation only exists during the Pre-peak period of the pandemic. Regardless of the time at which peaks, there is a 5–6 day lead between tweet volume and COVID-19 cases.
For RQ2, we found out the categories of topics discussed change over time about COVID-19 concerned by Twitter users from different countries and region. While a common topic on China was shared initially among all analysed regions, in all the countries and regions, the main topic was about China, the region and countries reacted differently on the topic after the first case emerged. In France, Germany, and Belgium, the first case did not attract much attention to anti-contagious and treatment measures, policies and local news, until a complete outbreak. Whereas the GR, as a relational city with a large number of cross-border workers, has shown high interest in policies since the first case, even if no lockdown policy has been implemented at that time. At the same time, Luxembourg, which has a foreign resident population of , has shown a great concern for policies including travel from the beginning of the pandemic, which is not found in the other analysed countries.
We speculate that the reason for this can be explained by the fact that in these countries there was not an immediate outbreak of the pandemic after the first case, but rather after an interval of an average of 27.3 days. Thus, there may be an underestimation of the severity of the pandemic by the public in these countries during the Pre-peak period. We tentatively suggest that a possible explanation for this phenomenon is optimism bias, which makes people believe their exposure risk to disease is low [70]. During a pandemic, people often exhibit an optimism bias, a cognitive bias that causes someone to believe that they will be less likely to get involved in negative events [71]. Here, we offer a speculative interpretation that even though these countries have shown sustained and long-term concern about COVID-19 occurring in China on Twitter, optimism bias emerged when COVID-19 appeared, causing the public to ignore the emergence of the cases and to pay little attention on anti-contagious measures and government policies [72]. Further analysis of this issue will be undertaken in future studies.
Our results in the current paper can be used to understand topics being discussed on Twitter, and the differences exhibited in the GR, the relational city, when facing the pandemic. At the same time, we make a speculative conclusion of the ideal point of time to conduct the pandemic precaution advocacy which help to provide policy support.
There are still some limitations of our study. First, in our dataset, we did not detect misleading information posted by bots, which can lead to a possible bias in topical modelling and classification. For our initial exploration of topic categories, we chose SVM to build a baseline method for topic classification. We will utilise other state-of-the-art text classification methods to refine the classification in further study. Second, our case study has some statistical limitations. Data from more countries will be included in future studies to ensure the statistical significance of the conclusions. Third, more research can be performed based on our dataset. For example, in future, we will conduct sentiment analysis on the tweets of different categories at each pandemic period to find out the changing in the public’s sentiment about the pandemic and how it differs between the GR and other countries. And for RQ2, multi-class sentiment analysis with BERT will be conducted to figure out whether and to what extent people are optimistic or pessimistic about being affected by a pandemic during the Pre-peak period. Finally, during the writing of this article, the second wave of COVID-19 emerges in Luxembourg and other studied countries. In a future study, we will conduct a comparative study focusing on the regions that have the second wave. Sentiment analysis and text classification with the state-of-the-art method will be deployed to investigate whether OSNs information impact public attitude and behaviour. We will attempt to identify topics that may help to predict the second wave, such as laxity or resistance to policies and anti-infection measures. Such timely indicators are potentially useful for making appropriate policy adjustments to avoid a new pandemic outbreak.
Author Contributions
Conceptualization, N.C., Z.Z. and J.P.; Data curation, N.C. and Z.Z.; Formal analysis, N.C.; Investigation, N.C. and Z.Z.; Methodology, N.C.; Project administration, J.P.; Resources, J.P.; Supervision, J.P.; Validation, N.C.; Visualization, N.C.; Writing—original draft, N.C.; Writing—review & editing, Z.Z. and J.P. All authors have read and agreed to the published version of the manuscript.
Funding
This work was partially supported by Luxembourg’s Fonds National de la Recherche, via grant COVID-19/2020-1/14700602 (PandemicGR), grant PRIDE15/10621687/SPsquared and grant PRIDE17/12252781/DRIVEN.
Conflicts of Interest
The authors declare no conflict of interest.
References
- Cinelli, M.; Quattrociocchi, W.; Galeazzi, A.; Valensise, C.M.; Brugnoli, E.; Schmidt, A.L.; Zola, P.; Zollo, F.; Scala, A. The COVID-19 Social Media Infodemic; Scientific Reports; Nature Publishing Group: London, UK, 2020. [Google Scholar]
- Singh, L.; Bansal, S.; Bode, L.; Budak, C.; Chi, G.; Kawintiranon, K.; Padden, C.; Vanarsdall, R.; Vraga, E.; Wang, Y. A first look at COVID-19 information and misinformation sharing on Twitter. arXiv 2020, arXiv:2003.13907. [Google Scholar]
- Jahanbin, K.; Rahmanian, V. Using Twitter and web news mining to predict COVID-19 outbreak. Asian Pac. J. Trop. Med. 2020, 13, 26–28. [Google Scholar]
- Wang, C.; David, M.B. Collaborative topic modelling for recommending scientific articles. In Proceedings of the 2011 International Conference on Knowledge Discovery and Data Mining (SIGKDD), San Diego, CA, USA, 21–24 August 2011; pp. 448–456. [Google Scholar]
- Medford, R.J.; Saleh, S.N.; Sumarsono, A.; Perl, T.M.; Lehmann, C.U. An “Infodemic”: Leveraging high-volume Twitter data to understand public sentiment for the COVID-19 outbreak. Open Forum Infect. Dis. 2020, 7. [Google Scholar] [CrossRef] [Green Version]
- Sharma, K.; Seo, S.; Meng, C.; Rambhatla, S.; Liu, Y. COVID-19 on Social Media: Analyzing Misinformation in Twitter Conversations. arXiv 2020, arXiv:2003.12309. [Google Scholar]
- Gupta, S.; Nguyen, T.D.; Rojas, F.L.; Raman, S.; Lee, B.; Bento, A.; Simon, K.I.; Wing, C. Tracking Public and Private Response to the COVID-19 Epidemic: Evidence from State and Local Government Actions; Technical report; National Bureau of Economic Research: Cambridge, MA, USA, 2020. [Google Scholar]
- Bento, A.I.; Nguyen, T.; Wing, C.; Lozano-Rojas, F.; Ahn, Y.Y.; Simon, K. Evidence from Internet search data shows information-seeking responses to news of local COVID-19 cases. Proc. Natl. Acad. Sci. USA 2020, 117, 11220–11222. [Google Scholar] [CrossRef]
- Lopez, C.E.; Vasu, M.; Gallemore, C. Understanding the perception of COVID-19 policies by mining a multilanguage Twitter dataset. arXiv 2020, arXiv:2003.10359. [Google Scholar]
- Thelwall, M.; Thelwall, S. Retweeting for COVID-19: Consensus building, information sharing, dissent, and lockdown life. arXiv 2020, arXiv:2004.02793. [Google Scholar]
- Balcan, D.; Colizza, V.; Gonçalves, B.; Hu, H.; Ramasco, J.J.; Vespignani, A. Multiscale mobility networks and the spatial spreading of infectious diseases. Proc. Natl. Acad. Sci. USA 2009, 106, 21484–21489. [Google Scholar] [CrossRef] [Green Version]
- Sigler, T.J. Relational cities: Doha, Panama City, and Dubai as 21st century entrepôts. Urban Geogr. 2013, 34, 612–633. [Google Scholar] [CrossRef]
- Hesse, M.; Rafferty, M. Relational cities disrupted: reflections on the particular geographies of COVID-19 For small but global urbanisation in Dublin, Ireland, and Luxembourg City, Luxembourg. Tijdschr. Voor Econ. Soc. Geogr. 2020, 111, 451–464. [Google Scholar] [CrossRef]
- Decoville, A.; Durand, F. Challenges and obstacles in the production of cross-border territorial strategies: the example of the Greater Region. Trans. Assoc. Eur. Sch. Plan. 2017, 1, 65–78. [Google Scholar] [CrossRef]
- The Greater Region at a Glance. Available online: http://www.granderegion.net/en/The-Greater-Region-at-a-Glance (accessed on 24 January 2021).
- Heesterbeek, J.A.P.; Dietz, K. The concept of Ro in epidemic theory. Stat. Neerl. 1996, 50, 89–110. [Google Scholar] [CrossRef]
- Devlin, J.; Chang, M.W.; Lee, K.; Toutanova, K. BERT: Pre-training of deep bidirectional transformers for language understanding. In Proceedings of the 2019 Annual Meeting of the Association for Computational Linguistics: Human Language Technologies (HLT), Minneapolis, MN, USA, 2–7 June 2019; Volume 1, pp. 4171–4186. [Google Scholar]
- Blei, D.M.; Ng, A.Y.; Jordan, M.T.I. Latent dirichlet allocation. J. Mach. Learn. Res. 2003, 3, 993–1022. [Google Scholar]
- Chang, C.C.C.; Lin, C.J.J. LIBSVM: A library for support vector machines. Trans. Intell. Syst. Technol. 2011, 2, 1–27. [Google Scholar] [CrossRef]
- Chen, E.; Lerman, K.; Ferrara, E. COVID-19: The First Public Coronavirus Twitter Dataset. arXiv 2020, arXiv:2003.07372. [Google Scholar]
- Depoux, A.; Martin, S.; Karafillakis, E.; Preet, R.; Wilder-Smith, A.; Larson, H. The pandemic of social media panic travels faster than the COVID-19 outbreak. J. Travel Med. 2020, 27, taaa031. [Google Scholar] [CrossRef] [Green Version]
- St Louis, C.; Zorlu, G. Can Twitter predict disease outbreaks? Br. Med J. 2012, 344, e2353. [Google Scholar] [CrossRef]
- Shen, C.; Chen, A.; Luo, C.; Zhang, J.; Feng, B.; Liao, W. Using reports of symptoms and diagnoses on social media to predict COVID-19 case counts in mainland China: observational infoveillance study. J. Med. Internet Res. 2020, 22, e19421. [Google Scholar] [CrossRef]
- Hsiang, S.; Allen, D.; Annan-Phan, S.; Bell, K.; Bolliger, I.; Chong, T.; Druckenmiller, H.; Huang, L.Y.; Hultgren, A.; Krasovich, E.; et al. The effect of large-scale anti-contagion policies on the COVID-19 pandemic. Nature 2020, 584, 262–267. [Google Scholar] [CrossRef]
- Courtemanche, C.; Garuccio, J.; Le, A.; Pinkston, J.; Yelowitz, A. Strong social distancing measures in the United States reduced The COVID-19 Growth Rate. Health Aff. 2020, 39, 1237–1246. [Google Scholar] [CrossRef]
- Dergiades, T.; Milas, C.; Panagiotidis, T. Effectiveness of government policies in response to the COVID-19 outbreak. SSRN 2020. [Google Scholar] [CrossRef]
- Park, H.W.; Park, S.; Chong, M. Conversations and medical news frames on Twitter: Infodemiological study on covid-19 in South Korea. J. Med. Internet Res. 2020, 22, e18897. [Google Scholar] [CrossRef] [PubMed]
- Hu, D.; Lou, X.; Xu, Z.; Meng, N.; Xie, Q.; Zhang, M.; Zou, Y.; Liu, J.; Sun, G.P.; Wang, F. More effective strategies are required to strengthen public awareness of COVID-19: Evidence from Google trends. J. Glob. Health 2020, 10, 011003. [Google Scholar] [CrossRef] [PubMed]
- Effenberger, M.; Kronbichler, A.; Shin, J.I.; Mayer, G.; Tilg, H.; Perco, P. Association of the COVID-19 pandemic with Internet search volumes: A Google trendsTM Analysis. Int. J. Infect. Dis. 2020, 95, 192–197. [Google Scholar] [CrossRef]
- Lwin, M.O.; Lu, J.; Sheldenkar, A.; Schulz, P.J.; Shin, W.; Gupta, R.; Yang, Y. Global sentiments surrounding the COVID-19 pandemic on Twitter: analysis of Twitter trends. JMIR Public Health Surveill. 2020, 6, e19447. [Google Scholar] [CrossRef]
- Samuel, J.; Ali, G.; Rahman, M.; Esawi, E.; Samuel, Y. COVID-19 public sentiment insights and machine learning for tweets classification. Information 2020, 11, 314. [Google Scholar] [CrossRef]
- Abd-Alrazaq, A.; Alhuwail, D.; Househ, M.; Hamdi, M.; Shah, Z. Top concerns of tweeters during the COVID-19 pandemic: infoveillance study. J. Med. Internet Res. 2020, 22, e19016. [Google Scholar] [CrossRef] [Green Version]
- Zamani, M.; Schwartz, H.A.; Eichstaedt, J.; Guntuku, S.C.; Ganesan, A.V.; Clouston, S.; Giorgi, S. Understanding weekly COVID-19 concerns through dynamic content-specific LDA topic modeling. In Proceedings of the 4th Workshop on Natural Language Processing and Computational Social Science (NLP+CSS), online. 20 November 2020; pp. 193–198. [Google Scholar]
- Yan, X.; Guo, J.; Lan, Y.; Cheng, X. A biterm topic model for short texts. In Proceedings of the 22nd International Conference on World Wide Web, Rio de Janeiro, Brazil, 13–17 May 2013; pp. 1445–1456. [Google Scholar]
- Weidemann, C.; Swift, J. Social Media Location Intelligence: The Next Privacy Battle-An ArcGIS add-in and Analysis of Geospatial Data Collected from Twitter. com. Int. J. Geoinform. 2013, 9, 21–27. [Google Scholar]
- Salas-Olmedo, M.H.; Moya-Gómez, B.; García-Palomares, J.C.; Gutiérrez, J. Tourists’ digital footprint in cities: Comparing Big Data sources. Tour. Manag. 2018, 66, 13–25. [Google Scholar] [CrossRef] [Green Version]
- Hecht, B.; Hong, L.; Suh, B.; Chi, E.H. Tweets from Justin Bieber’s heart: the dynamics of the location field in user profiles. In Proceedings of the SIGCHI Conference on Human Factors in Computing Systems, Vancouver, BC, Canada, 7–12 May 2011; pp. 237–246. [Google Scholar]
- Graham, M.; Hale, S.A.; Gaffney, D. Where in the world are you? Geolocation and language identification in Twitter. Prof. Geogr. 2014, 66, 568–578. [Google Scholar] [CrossRef] [Green Version]
- European Centre for Disease Prevention and Control. 2020. Available online: https://www.ecdc.europa.eu/en (accessed on 24 January 2021).
- Sciensano: Belgian Institute for Health. 2020. Available online: https://epistat.wiv-isp.be/covid/ (accessed on 24 January 2021).
- NPGEO Corona Hub 2020. 2020. Available online: https://npgeo-corona-npgeo-de.hub.arcgis.com/ (accessed on 24 January 2021).
- Données Hospitalières Relatives à l’épidémie de COVID-19. 2020. Available online: https://www.data.gouv.fr/fr/datasets/donnees-hospitalieres-relatives-a-lepidemie-de-covid-19 (accessed on 24 January 2021).
- Bettencourt, L.M.L.M.A.; Ribeiro, R.M. Real time Bayesian estimation of the epidemic potential of emerging infectious diseases. PLoS ONE 2008, 3, e2185. [Google Scholar] [CrossRef] [PubMed] [Green Version]
- A Collection of Work Related to COVID-19. 2020. Available online: https://github.com/k-sys/covid-19 (accessed on 24 January 2021).
- Wu, J.T.; Leung, K.; Leung, G.M. Nowcasting and forecasting the potential domestic and international spread of the 2019-nCoV outbreak originating in Wuhan, China: A modelling study. Lancet 2020, 395, 689–697. [Google Scholar] [CrossRef] [Green Version]
- Shen, M.; Peng, Z.; Xiao, Y.; Zhang, L. Modelling the epidemic trend of the 2019 novel coronavirus outbreak in China. BioRxiv 2020. [Google Scholar] [CrossRef]
- Walker, P.; Whittaker, C.; Watson, O.; Baguelin, M.; Ainslie, K.; Bhatia, S. The Global Impact of COVID-19 and Strategies for Mitigation and Suppression. 2020. Available online: https://www.imperial.ac.uk/mrc-global-infectious-disease-analysis/covid-19/report-12-global-impact-covid-19/ (accessed on 24 January 2021).
- Riou, J.; Althaus, C.L. Pattern of early human-to-human transmission of Wuhan 2019 novel coronavirus (2019-nCoV), December 2019 to January 2020. Eurosurveillance 2020, 25, 2000058. [Google Scholar] [CrossRef]
- Statement on the First Meeting of the International Health Regulations (2005) Emergency Committee Regarding the Outbreak of Novel Coronavirus (2019-nCoV). 2020. Available online: https://www.who.int/news/item/23-01-2020-statement-on-themeeting-of-the-international-health-regulations-(2005)-emergency-committee-regarding-the-outbreak-of-novel-coronavirus-(2019-ncov) (accessed on 24 January 2021).
- Younis, J.; Freitag, H.; Ruthberg, J.S.; Romanes, J.P.; Nielsen, C.; Mehta, N. Social media as an early proxy for social distancing indicated by the COVID-19 reproduction number: observational study. JMIR Public Health Surveill. 2020, 6, e21340. [Google Scholar] [CrossRef]
- Smith, M.C.; Broniatowski, D.A.; Paul, M.J.; Dredze, M. Towards real-time measurement of public epidemic awareness: Monitoring influenza awareness through twitter. In Proceedings of the Spring Symposium on Observational Studies Through Social Media and Other Human-generated Content, Stanford, CA, USA, 21–23 March 2016; Volume 20052, p. e198. [Google Scholar]
- Pang, P.C.I.; McKay, D.; Chang, S.; Chen, Q.; Zhang, X.; Cui, L. Privacy concerns of the Australian My Health Record: Implications for other large-scale opt-out personal health records. Inf. Process. Manag. 2020, 57, 102364. [Google Scholar] [CrossRef]
- Kolini, F.; Janczewski, L. Clustering and topic modelling: A new approach for analysis of national cyber security strategies. In Proceedings of the Pacific Asia Conference on Information Systems. Association For Information Systems, Langkawi, Malaysia, 16–20 July 2017. [Google Scholar]
- Garbe, W. Python port of SymSpell. Available online: https://github.com/mammothb/symspellpy (accessed on 24 January 2021).
- Sinka, M.P.; Corne, D.W. Towards modernised and web-specific stoplists for web document analysis. In Proceedings of the IEEE/WIC International Conference on Web Intelligence (WI), Halifax, NS, Canada, 13–17 October 2003; pp. 396–402. [Google Scholar]
- Älgå, A.; Eriksson, O.; Nordberg, M. Analysis of scientific publications during the early phase of the COVID-19 pandemic: Topic modeling study. J. Med Internet Res. 2020, 22, e21559. [Google Scholar] [CrossRef]
- Contextual Topic Identification for Steam Reviews. Available online: https://github.com/Stveshawn/contextual_topic_identification (accessed on 24 January 2021).
- Wagstaff, K.; Cardie, C.; Rogers, S.; Schrödl, S. Constrained k-means clustering with background knowledge. In Proceedings of the 2001 International Conference on Machine Learning (ICML). Citeseer, Williamstown, MA, USA, 28 June–1 July 2001; Volume 1, pp. 577–584. [Google Scholar]
- McInnes, L.; Healy, J.; Melville, J. Umap: Uniform manifold approximation and projection for dimension reduction. arXiv 2018, arXiv:1802.03426. [Google Scholar]
- Gutiérrez, E.D.; Shutova, E.; Lichtenstein, P.; de Melo, G.; Gilardi, L. Detecting cross-cultural differences using a multilingual topic model. Trans. Assoc. Comput. Linguist. 2016, 4, 47–60. [Google Scholar] [CrossRef]
- Ramos, J. Using TF-IDF to determine word relevance in document queries. In Proceedings of the 2003 International Conference on Machine Learning (ICML), Washington, DC, USA, 21–24 August 2003; Volume 242, pp. 133–142. [Google Scholar]
- O’callaghan, D.; Greene, D.; Carthy, J.; Cunningham, P.; O’Callaghan, D.; Greene, D.; Carthy, J.; Cunningham, P. An analysis of the coherence of descriptors in topic modelling. Expert Syst. Appl. 2015, 42, 5645–5657. [Google Scholar] [CrossRef]
- Newman, D.; Lau, J.H.; Grieser, K.; Baldwin, T. Automatic evaluation of topic coherence. In Proceedings of the 2010 Annual Meeting of the Association for Computational Linguistics: Human Language Technologies, ACL, Los Angeles, CA, USA, 2–4 June 2010; pp. 100–108. [Google Scholar]
- Aranganayagi, S.; Thangavel, K. Clustering categorical data using silhouette coefficient as a relocating measure. In Proceedings of the 2007 International Conference on Computational Intelligence and Multimedia Applications, Sivakasi, Tamil Nadu, India, 13–15 December 2007; Volume 2, pp. 13–17. [Google Scholar]
- Liu, B.; Li, X.; Lee, W.S.; Yu, P.S. Text classification by labeling words. In Proceedings of the AAAI, San Jose, CA, USA, 25–29 July 2004; Volume 4, pp. 425–430. [Google Scholar]
- Lee, K.; Palsetia, D.; Narayanan, R.; Patwary, M.M.A.; Agrawal, A.; Choudhary, A. Twitter trending topic classification. In Proceedings of the 2011 IEEE International Conference on Data Mining Workshops (ICDM), Vancouver, BC, Canada, 11 December 2011; pp. 251–258. [Google Scholar]
- Pedregosa, F.; Varoquaux, G.; Gramfort, A.; Michel, V.; Thirion, B.; Grisel, O.; Blondel, M.; Prettenhofer, P.; Weiss, R.; Dubourg, V.; et al. Scikit-learn: Machine Learning in Python. J. Mach. Learn. Res. 2011, 12, 2825–2830. [Google Scholar]
- Chawla, N.V.; Bowyer, K.W.; Hall, L.O.; Kegelmeyer, W.P. SMOTE: Synthetic minority over-sampling technique. J. Artif. Intell. Res. 2002, 16, 321–357. [Google Scholar] [CrossRef]
- Total Population, Luxembourgers and Foreigners, of Usual Residence in Luxembourg. 2019. Available online: https://statistiques.public.lu/stat/TableViewer/tableView.aspx?ReportId=12856 (accessed on 24 January 2021).
- Smith, M.C.; Broniatowski, D.A.; Paul, M.J.; Dredze, M. Using social and behavioural science to support COVID-19 pandemic response. Nat. Hum. Behav. 2020, 4, 1–12. [Google Scholar]
- Sharot, T. The optimism bias. Curr. Biol. 2011, 21, 941–945. [Google Scholar] [CrossRef] [Green Version]
- Paek, H.J.J.; Hilyard, K.; Freimuth, V.S.; Barge, J.K.; Mindlin, M. Public support for government actions during a flu pandemic: lessons learned from a statewide survey. Health Promot. Pract. 2008, 9, 60–72. [Google Scholar] [CrossRef]
Figure 1.
User location heatmap of the Greater Region (GR) and the related countries.

Figure 2.
Daily tweet volume and COVID-19 new cases (On 3rd June, France published a revision of data that lead to a negative number of new cases, see [42] for the original news).
Figure 2.
Daily tweet volume and COVID-19 new cases (On 3rd June, France published a revision of data that lead to a negative number of new cases, see [42] for the original news).

Figure 3.
Effective reproductive rate ().

Figure 4.
Total days for each pandemic period.

Figure 5.
PC (Pearson’s correlation) between tweet volume and COVID-19 daily cases with different lags.
Figure 5.
PC (Pearson’s correlation) between tweet volume and COVID-19 daily cases with different lags.

Figure 6.
Workflow of topic modelling and classification.

Figure 7.
A sample of Uniform Manifold Approximation and Projection (UMAP) clustering results.

Figure 8.
Topic categories in the GR and related countries. 1: Wuhan and China; 2: Measures; 3: Local news; 4: International news; 5: Policy and daily life; 6: Racism; 7: Other.
Figure 8.
Topic categories in the GR and related countries. 1: Wuhan and China; 2: Measures; 3: Local news; 4: International news; 5: Policy and daily life; 6: Racism; 7: Other.

Figure 9.
Distribution of proportion of tweets on ‘policy and daily life’ and ‘local news’ during Free-contagious and Measures period.
Figure 9.
Distribution of proportion of tweets on ‘policy and daily life’ and ‘local news’ during Free-contagious and Measures period.

Figure 10.
Word cloud of Luxembourg Tweets from 22 January 2020 to 1 March 2020.


Table 1.
A sample of our COVID-19 Twitter dataset.
| Attribute | Description | Example |
|---|---|---|
| Tweet_id | A unique identifier for a Tweet | 12319668395****** |
| Full_text | Text of a tweet | RT @******: The Diamond princess is a UK ship managed by the US. UK should Be Responsible. #DiamondPrincess #coronavirus |
| User_id | Unique identifier for this user | u9181074902***** |
| User_geo_orginal | User-defined location information | Moselle |
| User_geo | Geocoded user location | Moselle, Lorraine, France |
Table 2.
Summary of our COVID-19 Twitter dataset.
| Region/Country | Tweet Volume | USer Volume |
|---|---|---|
| 51,966,639 | 15,551,266 | |
| The GR | 35,329 | 7894 |
| Luxembourg | 7512 | 1545 |
| Belgium | 119,467 | 31,446 |
| France | 1,050,312 | 288,009 |
| Germany | 430,688 | 87,796 |
Table 3.
Time duration of the four pandemic periods for the GR, Luxembourg, Belgium, France and Germany.
Table 3.
Time duration of the four pandemic periods for the GR, Luxembourg, Belgium, France and Germany.
| Pre-Peak | Free-Contagious | Measures Period | Decay Period | |
|---|---|---|---|---|
| The GR | 2/14–3/15/2020 | 3/15–3/21/2020 | 3/21–4/17/2020 | 4/17–6/05/2020 |
| Luxembourg | 2/19–3/20/2020 | 3/20–3/24/2020 | 3/24–4/01/2020 | 4/01–6/05/2020 |
| Belgium | 2/04–3/05/2020 | 3/05–3/25/2020 | 3/25–4/18/2020 | 4/18–6/05/2020 |
| France | 2/05–3/06/2020 | 3/06–3/30/2020 | 3/30–4/23/2020 | 4/23– 6/05/2020 |
| Germany | 1/29–2/28/2020 | 2/28–3/24/2020 | 3/24–4/02/2020 | 4/02–6/05/2020 |
Table 4.
Average coherence score and average silhouette score of contextual topic embedding method (CTE).
Table 4.
Average coherence score and average silhouette score of contextual topic embedding method (CTE).
| Country | Coherence Score | Silhouette Score |
|---|---|---|
| The GR | 0.432 | 0.893 |
| Luxembourg | 0.474 | 0.894 |
| France | 0.351 | 0.590 |
| Belgium | 0.377 | 0.864 |
| Germany | 0.336 | 0.655 |
Table 5.
Metrics of the classification results.
| Category | Precision | Recall | F1-Score | Support |
|---|---|---|---|---|
| 1 | 0.89 | 0.77 | 0.82 | 163 |
| 2 | 0.92 | 0.93 | 0.93 | 166 |
| 3 | 0.80 | 0.79 | 0.80 | 155 |
| 4 | 0.74 | 0.86 | 0.80 | 155 |
| 5 | 0.73 | 0.68 | 0.71 | 149 |
| 6 | 0.99 | 1.00 | 0.99 | 157 |
| 7 | 0.97 | 1.00 | 0.98 | 142 |
| Macro avg | 0.86 | 0.86 | 0.86 | 1087 |
Table 6.
Topic volume for each category/country (region).
| Category | The GR | Luxembourg | Belgium | France | Germany | Total |
|---|---|---|---|---|---|---|
| 1 | 245 | 168 | 287 | 202 | 315 | 1217 |
| 2 | 64 | 34 | 48 | 65 | 41 | 252 |
| 3 | 99 | 44 | 109 | 285 | 110 | 647 |
| %midrule 4 | 134 | 77 | 114 | 52 | 167 | 544 |
| 5 | 353 | 525 | 370 | 250 | 295 | 1793 |
| 6 | 23 | 7 | 23 | 31 | 15 | 99 |
| 7 | 41 | 72 | 15 | 60 | 23 | 211 |
| Total | 959 | 927 | 966 | 945 | 966 | 4763 |
Publisher’s Note: MDPI stays neutral with regard to jurisdictional claims in published maps and institutional affiliations. |
© 2021 by the authors. Licensee MDPI, Basel, Switzerland. This article is an open access article distributed under the terms and conditions of the Creative Commons Attribution (CC BY) license (http://creativecommons.org/licenses/by/4.0/).
Share and Cite
MDPI and ACS Style
Chen, N.; Zhong, Z.; Pang, J. An Exploratory Study of COVID-19 Information on Twitter in the Greater Region. Big Data Cogn. Comput. 2021, 5, 5. https://0-doi-org.brum.beds.ac.uk/10.3390/bdcc5010005
AMA Style
Chen N, Zhong Z, Pang J. An Exploratory Study of COVID-19 Information on Twitter in the Greater Region. Big Data and Cognitive Computing. 2021; 5(1):5. https://0-doi-org.brum.beds.ac.uk/10.3390/bdcc5010005
Chicago/Turabian StyleChen, Ninghan, Zhiqiang Zhong, and Jun Pang. 2021. "An Exploratory Study of COVID-19 Information on Twitter in the Greater Region" Big Data and Cognitive Computing 5, no. 1: 5. https://0-doi-org.brum.beds.ac.uk/10.3390/bdcc5010005