Nutrient Availability under Lettuce Grown in Rye Mulch in Histosols

Soil and Agri-Food Engineering Department, Laval University, 2480 Boulevard Hochelaga, Quebec City, QC G1V 0A6, Canada
*
Author to whom correspondence should be addressed.
Nitrogen 2020, 1(2), 137-150; https://0-doi-org.brum.beds.ac.uk/10.3390/nitrogen1020012
Submission received: 23 September 2020
/
Revised: 30 October 2020
/
Accepted: 10 November 2020
/
Published: 13 November 2020
Abstract
:Vegetable crop production, which is expanding worldwide, is managed extremely intensively and is therefore raising concerns about soil degradation. The objective of this study was to analyze the impact of using rye mulch as a conservation practice on nutrient availability for lettuce grown in histosols. The rye cover crop was established in the fall of 2018 at two cultivated peatland sites. The following summer, lettuce crops were planted at both sites on the rye mulch cover and on control plots. Lysimeters were used to extract the soil solution once a week during lettuce growth. Various soil properties were analyzed in the soil sampled at the end of the lettuce growing season. The rye yield was higher at site 1 than at site 2 and the lettuce growth was reduced at site 1 under the rye mulch treatment. The rye mulch reduced mineral N and dissolved organic N availability at both sites. The N dynamics in histosols might be fast enough to supply the lettuce needs; however, the implantation difficulties must first be overcome to confirm that hypothesis. At the end of the lettuce growth period, soil total and active C pools and soluble organic soil N in the rye mulch treatment sample were significantly higher at site 1 than at site 2. The presence of rye mulch improved the carbon pool over a single growing season. The use of rye mulch as a soil conservation practice for vegetable crop production appears promising for histosols; however, more work is needed to gain a better understanding on the long-term effects of decomposing rye mulch and roots on soil nutrient availability, soil health and C sequestration, and on the nitrogen uptake pathways and growth of cash crops. Future works which would include consecutive years of study at multiple sites are also needed to be able to confirm and generalize the observations found in the present work.
1. Introduction
Vegetable crop production is expanding rapidly worldwide [1], due in part to health guidelines that recommend increasing vegetable consumption, in addition to a growing interest in how the human diet impacts climate change [2,3]. Vegetable crop production is managed extremely intensively, however, raising concerns about soil degradation [4]. The same is true for vegetable production on cultivated peatland.
Cultivated peatland (organic soils, histosols) in Canada constitutes an important part of the agricultural economy. In Quebec, Canada, although there is a lot of natural peatland throughout the territory [5], the cultivated peat soils are mostly in the southwest area, due to the favorable climate and the proximity of the markets of Montreal and the East Coast of the United States [6]. The area plays an essential role in the production of high-value vegetable crops, such as Daucus carota (carrots), Lactuca sativa (lettuce), and Allium cepa (onion), supplying fruits and vegetables to Canada and the northeastern United States [5]. Cultivated peatlands can be highly productive, but are also very sensitive to degradation and compaction [7,8]. Wind and water erosion, subsidence, and oxidation of organic matter are the main causes of the degraded soil conditions observed in cultivated histosols. The use of biomass crops as a soil amendment has been proposed as a way to make vegetable crop production in histosols more sustainable [9].
Most of the research on conservation agriculture has focused on field crops grown in mineral soils, particularly grain, cereal, and oilseed crops. The research focusing on conservation practices for sustainable vegetable cropping systems has been lacking [4,10]. Recent studies on alternative conservation practices, such as using rye or other cover crops as mulch, have shown promising results [11,12].
Although the main reasons for producing vegetables on rye mulch are to protect soils from erosion [13] and enhance their organic matter content [14], this farming practice has other important benefits as well. First, growing horticultural crops on rye mulch significantly limits proliferation of weeds [15,16]. In addition to mechanically suppressing weed growth, decomposing rye mulch releases allelochemical molecules that harm weeds [17,18]. Moreover, the use of rye as a cover crop has been shown to improve both the physical (particularly, water infiltration and retention) and biological properties of soils [19,20,21]. Global soil health (soil aggregate stability, potentially mineralizable nitrogen, active soil carbon, and microbial activity) has also been shown to be significantly improved under rye mulch [10]. Nevertheless, the use of rye mulch can present some major drawbacks. Nitrogen may be immobilized as the mulch decomposes, substantially reducing cash crop yields [22]. Likewise, a greenhouse study demonstrated the allelopathic effect of rye residues and water extracts on lettuce, which led to reduced yields, inhibited root growth, and resulted in the discoloration of apical meristems [17]. Although the use of rye mulch as a soil conservation practice is getting more attention, most studies to date have focused on weed suppression [23,24,25]. More research is required to gain a better understanding of nutrient cycling under rye mulch. Additionally, although rye mulch has been used for several years in mineral soils, no studies have examined this practice in cultivated histosols. In the present study, it was hypothesized that decomposing rye mulch and roots would immobilize nitrogen pools during lettuce growth, but would not affect phosphorus availability. The objective of this study was therefore to analyze the impact of rye mulch on nutrient availability in lettuce crops grown in histosols, with a particular focus on nitrogen pools in the soil solution.
2. Materials and Methods
2.1. Study Sites
The soils at the two research sites (45°11′ N, 73°20′ W and 45°09′ N, 73°37′ W) were similar, moderately decomposed histosols (Mesisol great group [26]), with a pH of 5.9 and 5.2, 46% and 45% C, and 1.7% and 2.1% N for site 1 and site 2, respectively.
The average annual precipitation at both sites is 961 mm, and the annual average temperature is 6.6 °C. The annual frost-free period is 146 days, with 3289 degree-days above 0 °C (http://climate.weather.gc.ca/climate_normals/).
Experimental Design
- Site description
The rye cover crop was established in the fall of 2018 at two cultivated peatland sites in the southwest region of the province of Quebec, Canada. The following summer, the rye crops were chemically killed, then scrolled, and the lettuce crops were planted. Both sites were divided into two plots of 0.9 ha in size at site 1 and 0.5 ha in size at site 2. The two plots were used for a control treatment and a rye cover crop treatment. The lettuce field protection program included periodic mechanical and manual weeding as requested and no pesticides were used in the field during the lettuce crop growth. The details of the experimental design are presented in Table 1. The experimental scheme was as follows: at site 1, 10 sampling points for the soil solution sampling were established in each experimental plot. The sampling points were distributed randomly across the site, following two times a «W» scheme. At 5 of the 10 sampling points, two root zones were established: a rhizosphere zone and a root exclusion zone. The root exclusion zone was obtained using an aluminum cylinder of about 15 cm high and 10 cm in diameter. At site 2, which was smaller, 5 sampling points for the soil solution sampling were established in each experimental plot. The sampling points were distributed randomly across the site, following one «W» scheme. At 3 of the 5 sampling points, two root zones were established: a rhizosphere zone and a root exclusion zone. At each site, two lysimeters for soil solution sampling were installed at a sampling point and a root zone. Following lettuce harvest, the soil was sampled at each of the soil solution sampling points. Although the field experiment was conducted only within one year, the experimental design developed and applied was rigorous and can warrant the representativeness of our data which are characteristic of these sites/year, specifically.
- Soil solution sampling
At both sites, Rhizon® (MOM) soil solution samplers (Rhizosphere Research Product, Wageningen, The Netherlands) were installed in each of the experimental plots at a depth of 10 to 20 cm (lysimeters were 10 cm long). The lysimeters were used to extract the soil solution once a week during lettuce growth. As explained above, at site 1, 10 sampling points were established in each experimental plot. At each sampling point, two lysimeters were inserted into the root zone of the lettuce plants. At 5 of the 10 sampling points, two additional lysimeters were inserted into a root exclusion cylinder. At site 2, which was smaller, 5 sampling points were established in each experimental plot. At each sampling point, two lysimeters were inserted into the lettuce root zone. At 3 of the 5 sampling points, two additional lysimeters were inserted into a root exclusion cylinder. The soil solution was extracted by suction using 20-mL syringes, and the samples were quickly stored at −20 °C. Samples of less than 15 mL of solution were combined to obtain samples of at least 15 mL for subsequent analysis.
- Soil chemical sampling
Prior to tilling the soil after harvesting the lettuce, composite soil samples were taken at four points in each of the plots to ensure representative sampling. Samples of at least 500 mL of soil were taken at three depths: 0 to 20 cm, 20 to 40 cm, and 40 to 60 cm. The soil samples were then dried at 70 °C, sieved at 2 mm, and used for chemical analyses.
- Soil solution analysis
Ammonium and nitrate levels were analyzed with a Quikchem 8500 Series 2 system (Lachat Instruments, Loveland, CO, USA), using Quikchem methods 10-107-06-2-B and 12-107-04-1-F, respectively. Total nitrogen was measured after persulfate oxidation according to Qualls (1989) and dissolved organic nitrogen (DON) was calculated by subtracting nitrates and ammonium from total nitrogen. In addition, dissolved carbon was analyzed using a total organic carbon analyzer TOC-5000/5050 (Shimadzu Corporation, Tokyo, Japan), and total dissolved phosphorus (TDP) was analyzed following the methods of [27].
- Soil analysis
Soil mineral nitrogen and total soluble nitrogen were analyzed following the methods of [28]. Nitrates, ammonium, and soluble organic nitrogen (SON) were extracted from the soil with distilled water at a 1 g soil to 10 mL solution ratio, centrifuged at 3000 rpm for 10 min, filtered through a No. 42 Whatman paper filter, and then stored at −20 °C until analysis. Ammonium, nitrate, total nitrogen, and SON were analyzed using the same methods as used for the soil solution analysis.
Phosphorus was extracted according to the Mehlich III method [29] using a 1 g soil to 30 mL solution ratio, agitation at 200 rpm for 5 min, and filtration through a No. 42 Whatman filter. Elements were analyzed by ICP-MS within 12 h of extraction to prevent organic compounds from precipitating with metals.
For the active carbon fraction, a 0.02 M KMnO4/0.1 M CaCl2 solution was used according to the procedure described in [30,31]. Total organic carbon and total nitrogen concentrations were determined using a Leco CN-2000 dry combustion analyzer.
- Data visualization and statistical analyses
Data visualization was done using the ggplot package and the statistical analyses were done by site using ANOVA, followed by Tukey’s post-hoc honestly significant difference test (RStudio Team 2019. RStudio: Integrated Development for R. RStudio, Inc., Boston, MA, USA, URL: http://www.rstudio.com/).
3. Results
3.1. Rye and Lettuce Crop Yields
Rye yields reached 6 Mg ha−1 at site 1 and 2.5 Mg ha−1 at site 2. At site 1, the lettuce yield was five times lower in the rye cover crop treatment than in the control. At site 2, the lettuce yield under the rye mulch was only about 7% lower than in the control treatment. For the following result description, site 1 is high rye yield cover and site 2 is low rye yield cover.
3.2. Rye and Rhizosphere Influence on Soil Nutrient Concentrations
- Nitrogen pools
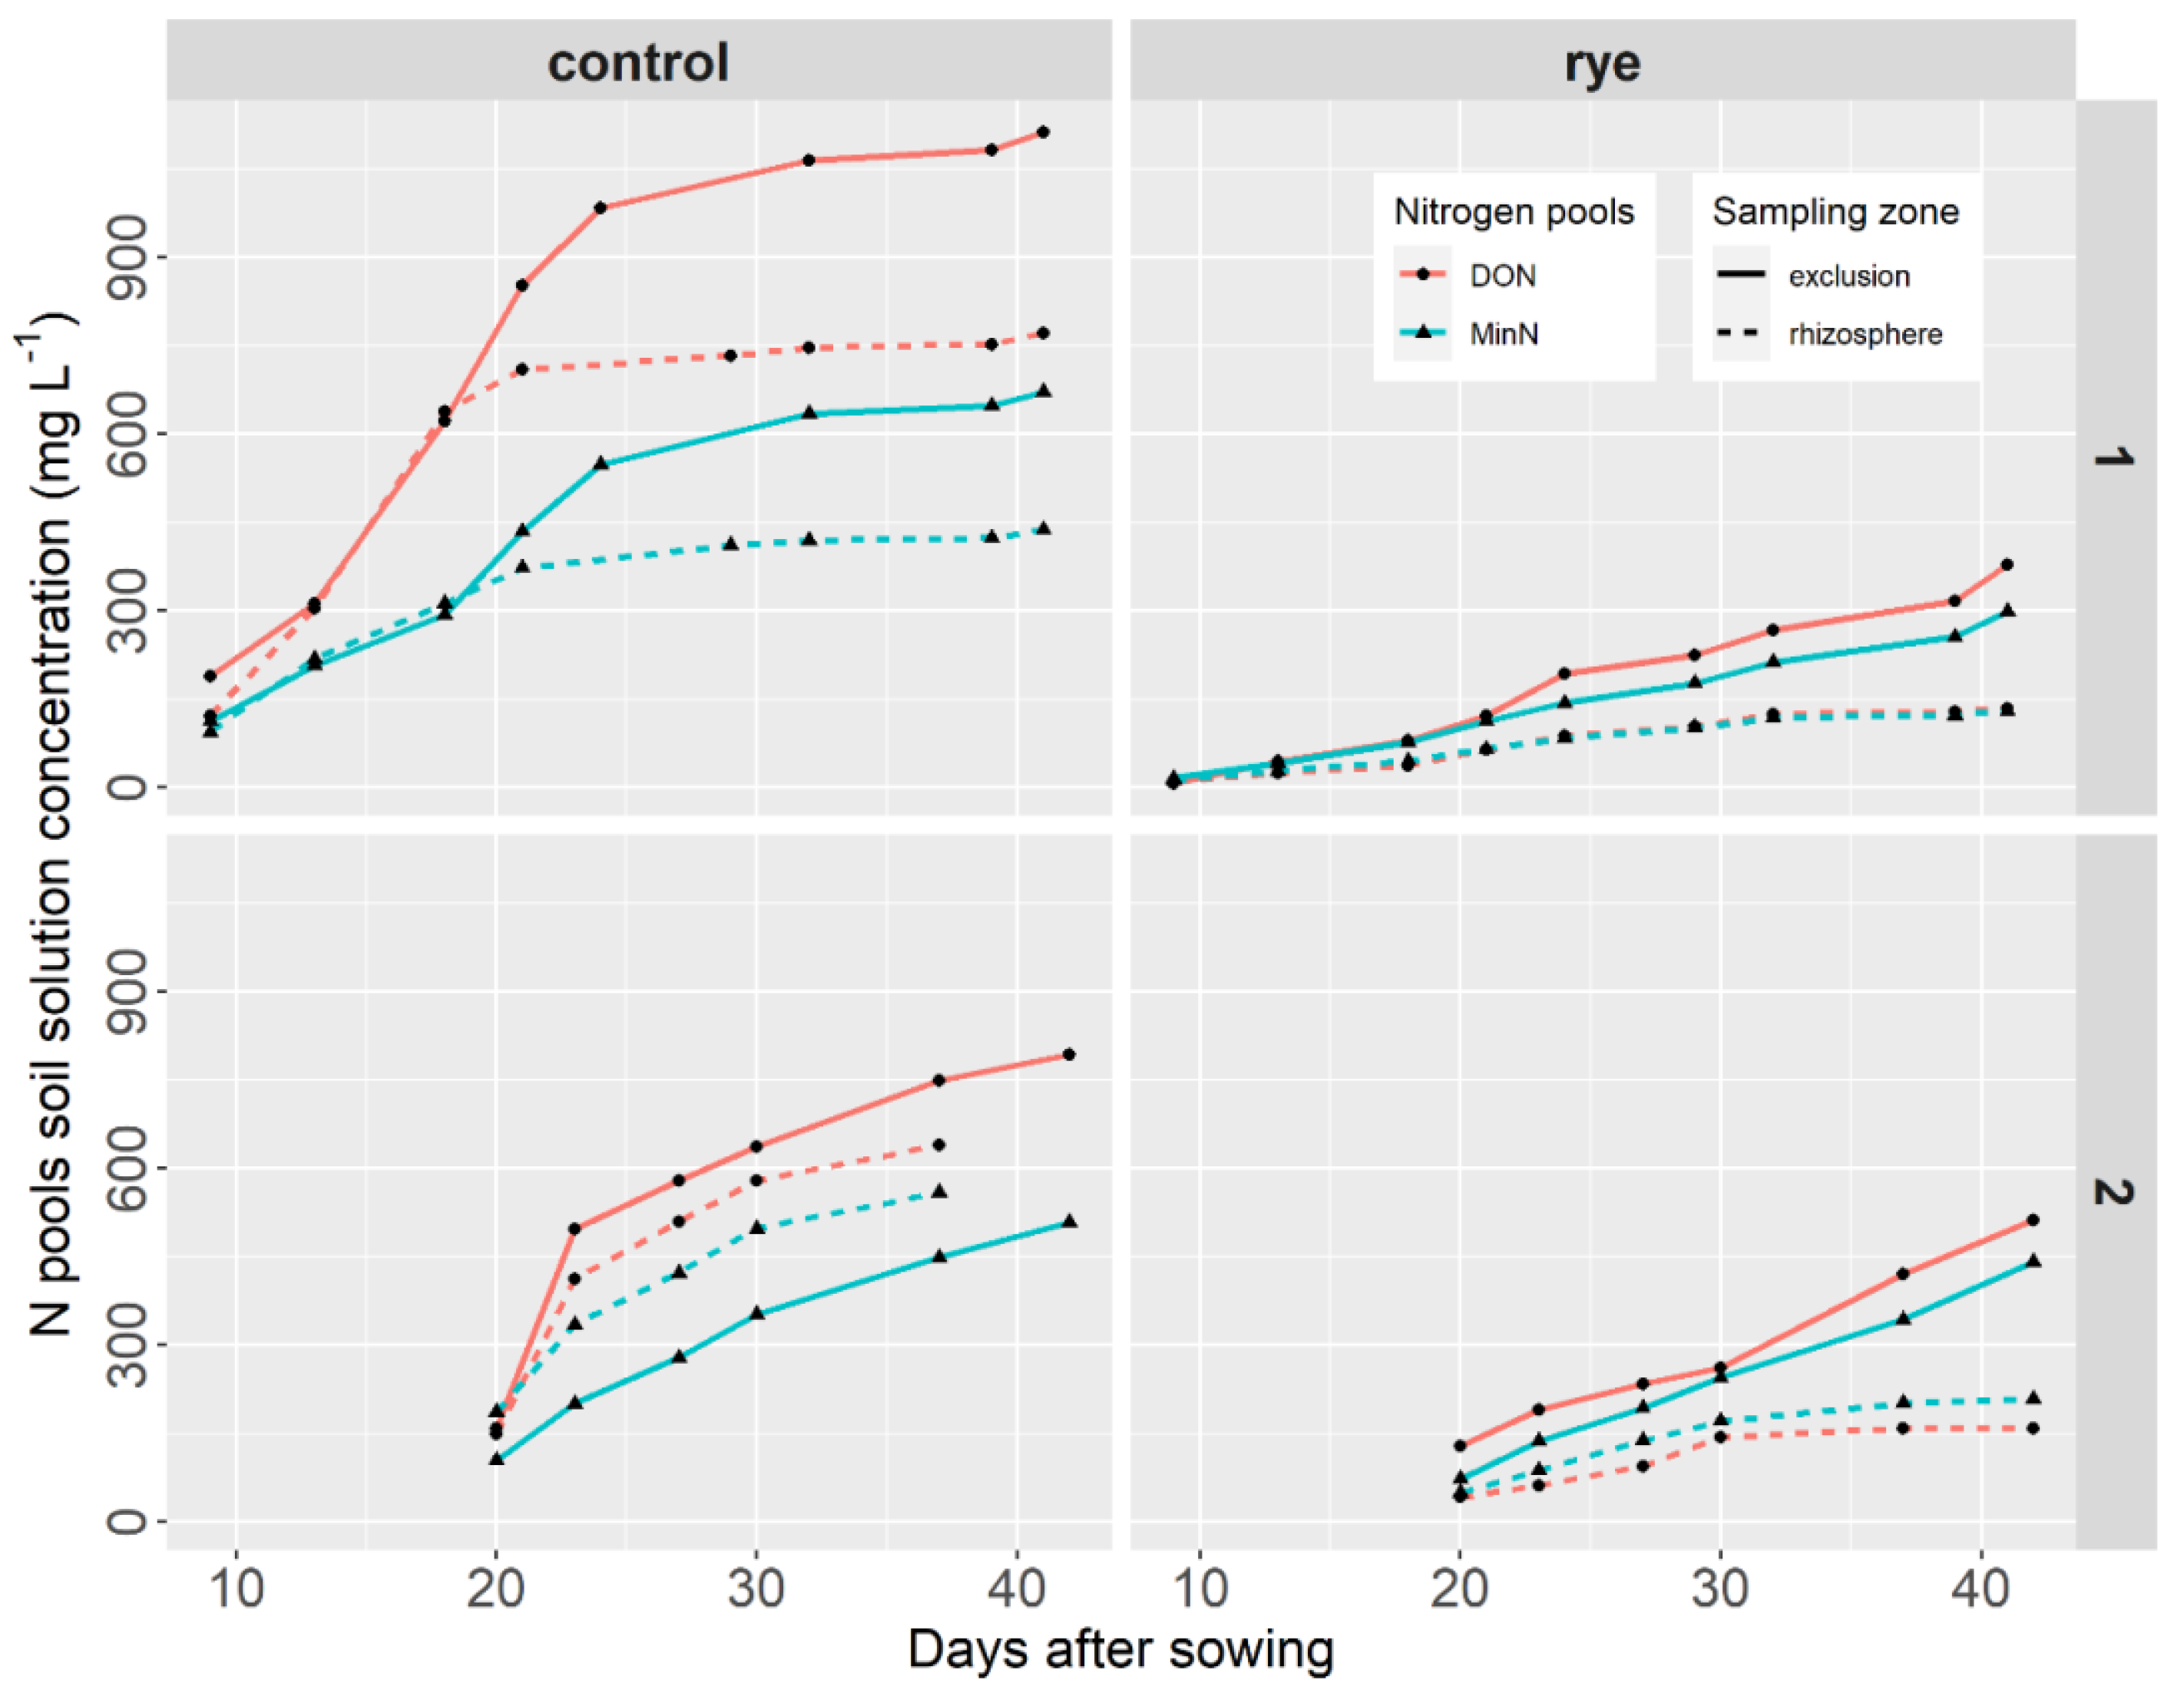
At both sites, the cumulative mineral N data (MinN) and the dissolved organic N data (DON) showed interesting behavior patterns (Figure 1).
In the control treatment sample at site 1 (Figure 1: control, site 1), rhizosphere and exclusion data for both MinN and DON were similar for about the first 20 days after seeding. Thereafter, however, the cumulative data differed significantly between sampling zones for both MinN and DON, reaching a plateau that was maintained until harvest. For both MinN and DON, the rhizosphere data were lower than the exclusion data, which may be indicative of N uptake by the lettuce crop. The difference between the rhizosphere and exclusion data varied from close to 0% to 35% for MinN and from close to 0% to 30% for DON from the beginning to the end of the lettuce growth period. In addition, in the control treatment, the DON pool was greater than the MinN pool, by a difference that varied from 23 to 51% in the rhizosphere sampling zone and from 34% to 53% in the exclusion zone (Figure 1: control, site 1).
In the rye mulch treatment sample at site 1 (high rye yield cover) (Figure 1: rye, site 1), the cumulative DON and MinN data followed a pattern similar to that observed in the control treatment sample: cumulative exclusion and rhizosphere data differed significantly for both MinN and DON, in this case, right from the beginning of the lettuce growth period, followed by a continuous and slow increase until the end of growth. The difference between the rhizosphere and exclusion data in the rye mulch treatment varied from about 21% to 58% for MinN and from close to 0% to 64% for DON from the beginning to the end of the lettuce growth period. At site 1, the difference between the rhizosphere and exclusion sampling zones was therefore greater under the rye mulch treatment as compared to what was observed under the control treatment. In this treatment, the DON pool was greater than the MinN pool only in the exclusion sampling zone (the difference varied from close to 0% to 25%). The difference between MinN and DON in the rhizosphere zone was negligible (Figure 1: rye, site 1). At site 1, the presence of rye mulch and its decomposing roots clearly had a significant effect on nitrogen availability: at the end of the lettuce growth period, cumulative MinN and DON in the exclusion sampling zone were 2.2 and 2.9 times lower, respectively, in the rye mulch treatment sample than in the control treatment sample (Figure 1, last sampling period). In the rhizosphere sampling zone, cumulative MinN and DON were 3.4 and 5.7 times lower, respectively, in the rye mulch treatment sample than in the control treatment sample.
In the control treatment sample at site 2 (Figure 1: control, site 2), the cumulative MinN and DON data increased continuously in both the exclusion and rhizosphere sampling zones during lettuce growth. DON was higher than MinN in both sampling zones and the rhizosphere MinN was higher than the exclusion MinN. The difference between rhizosphere and exclusion sampling zones decreased over time for MinN from about 44% to 15% and increased overtime for DON from about 5% to 16% from the beginning to the end of lettuce growth. In the rhizosphere sampling zone, the difference between MinN and DON varied between 24% and 51%; in the exclusion zone, the difference varied between 0% and 33% (Figure 1: control, site 2).
In the rye mulch treatment sample at site 2 (low-yield rye cover crop) (Figure 1: rye, site 2), the cumulative MinN and DON data were lower than in the control treatment sample, similar to what was observed at site 1 (high-yield rye cover crop). During the lettuce growth period, DON and MinN under rye mulch evolved in a pattern similar to that observed in the control treatment sample: cumulative exclusion and rhizosphere MinN and DON data increased slowly and continuously until the end of lettuce growth. However, the difference between rhizosphere and exclusion data varied during lettuce growth, increasing from about 30% to 53% for MinN and from about 47% to 69% for DON. The difference between the rhizosphere and exclusion sampling zones was therefore greater under the rye mulch treatment. In addition, the DON pool was only greater than the MinN pool in the exclusion sampling zone (the difference varied from close to 6% to 44%). In the rhizosphere sampling zone, MinN was greater than DON and the difference varied between 16% and 46% (Figure 1: control, site 2).
At site 2, the presence of rye mulch and its decomposing roots influenced nitrogen availability, although at a lower intensity than what was observed at site 1: cumulative MinN and DON in the exclusion sampling zone were 1.4 and 1.6 times lower, respectively, in the rye mulch treatment sample than in the control treatment sample. In the rhizosphere sampling zone, cumulative MinN and DON were 2.4 and 4.2 times lower, respectively, in the rye mulch treatment sample than in the control treatment sample (Figure 1, last sampling period).
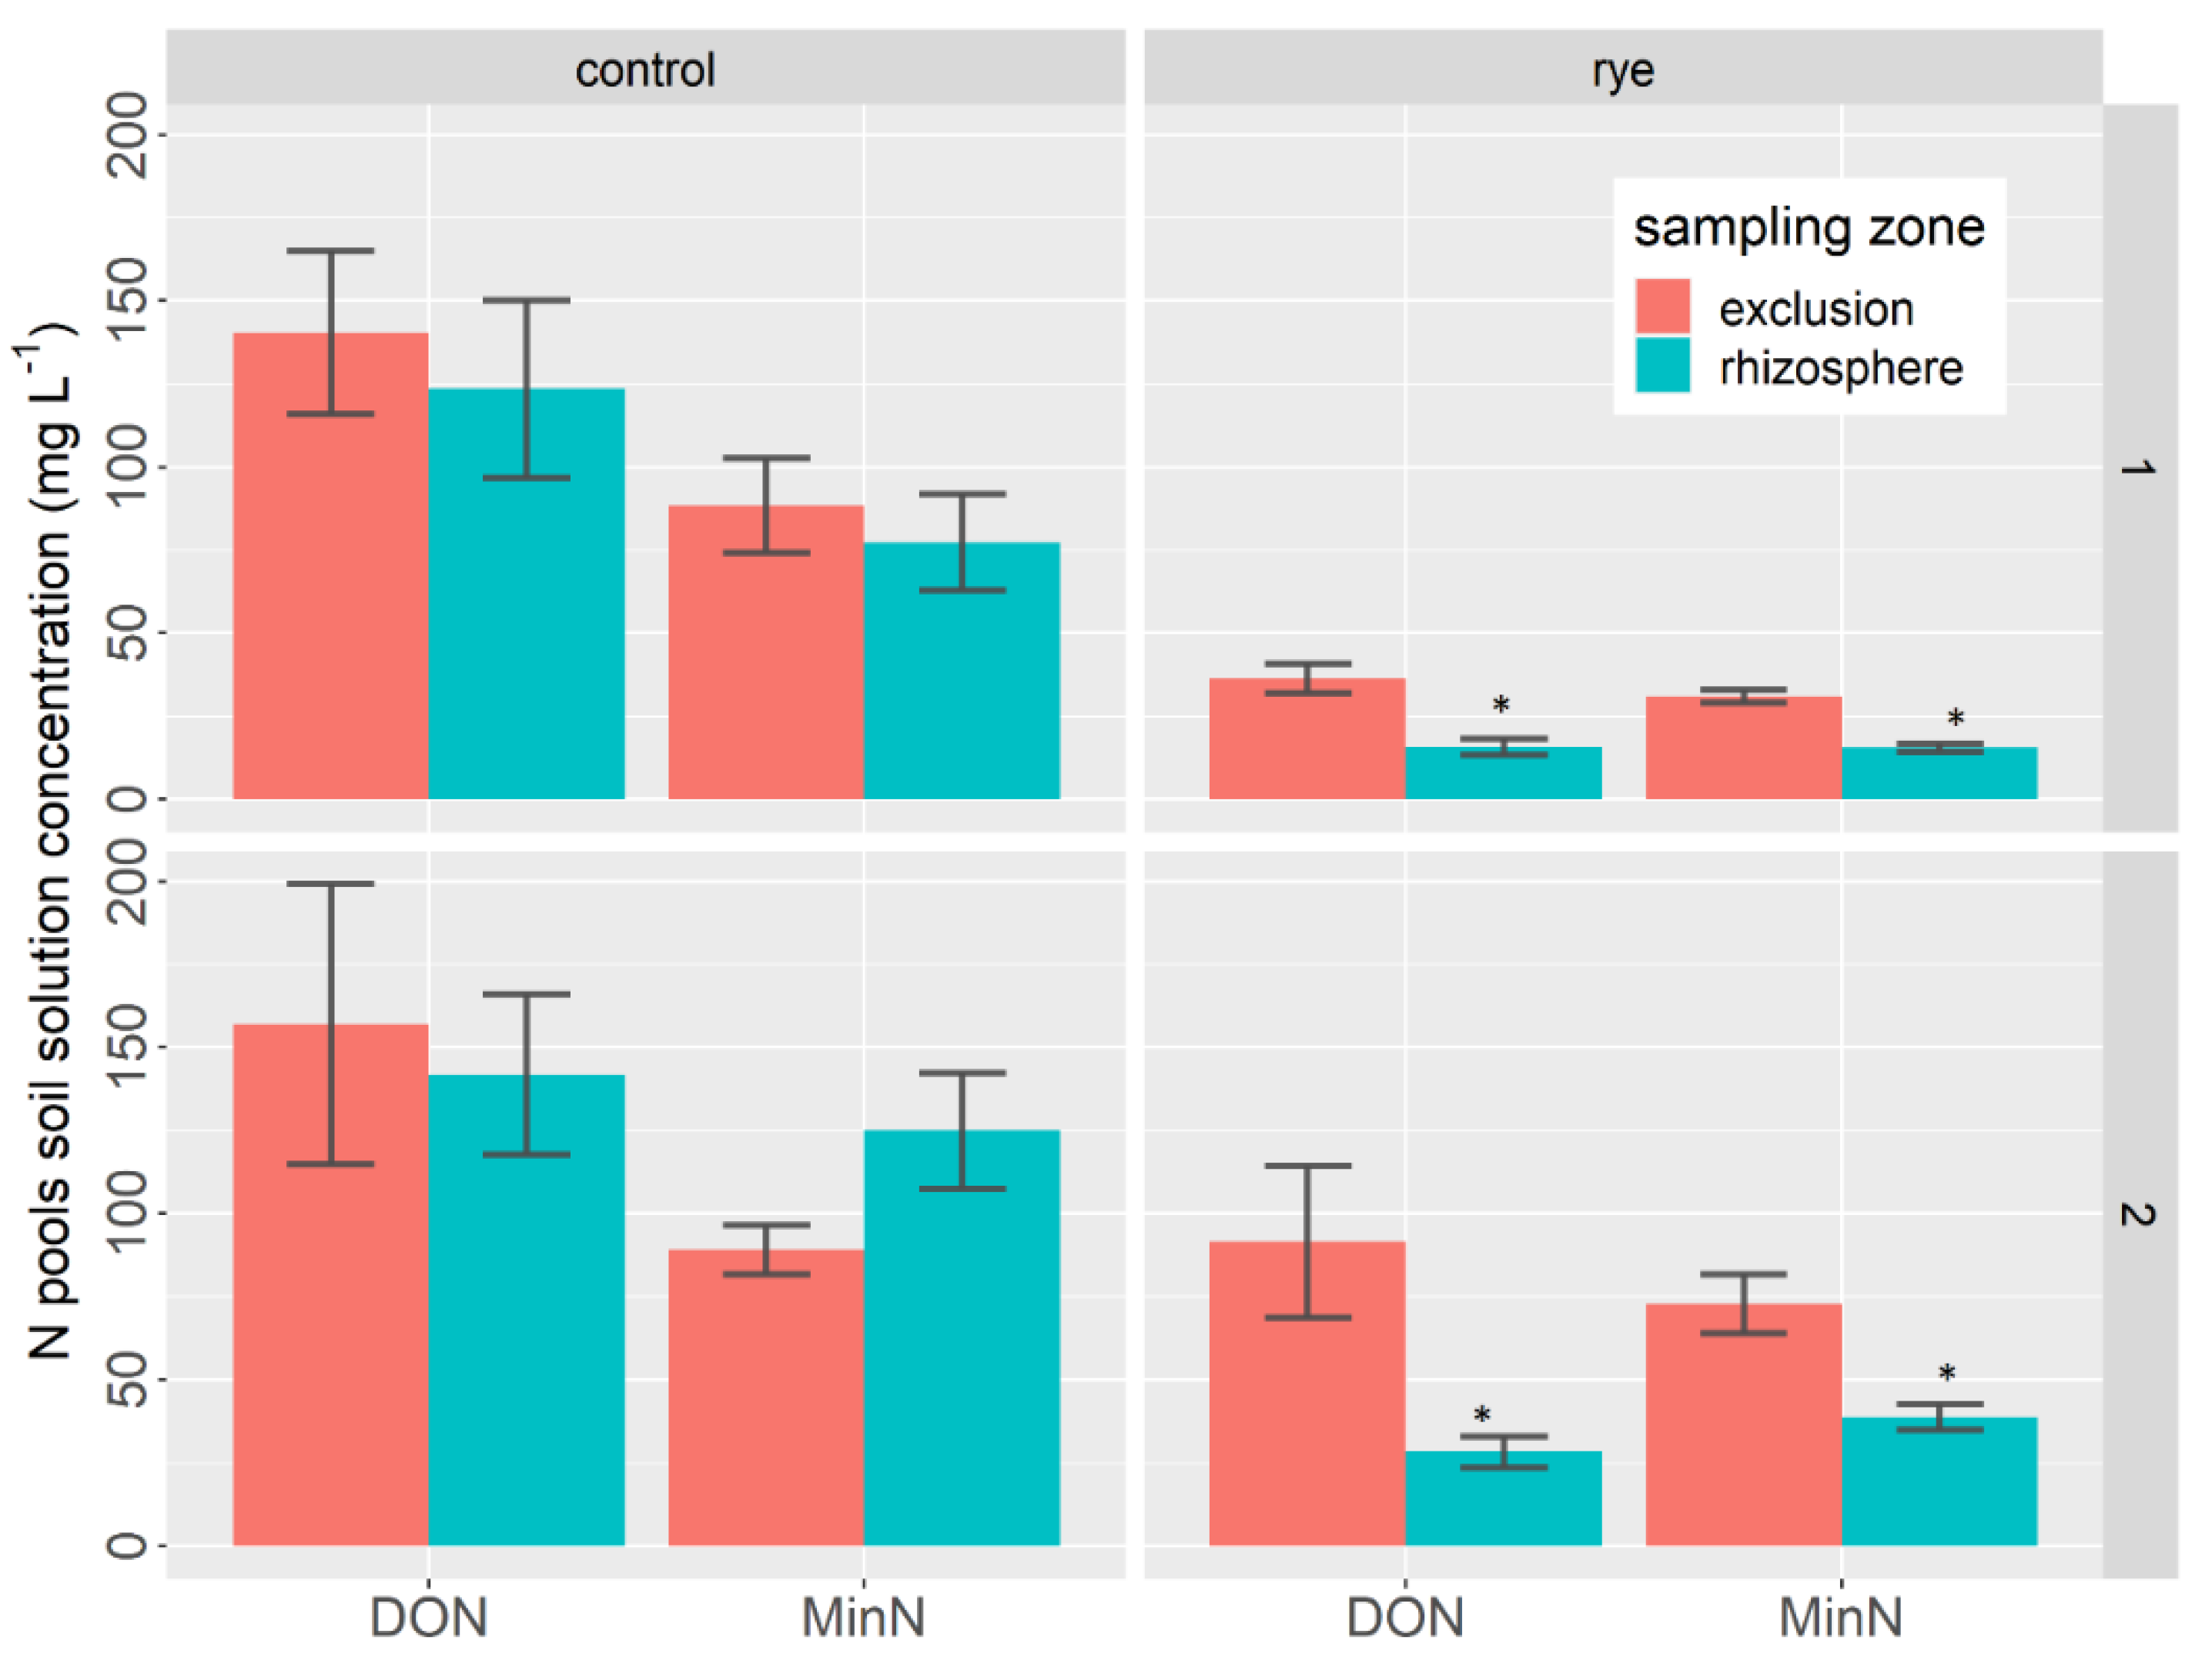
In addition, two important findings emerged from the statistical analysis (Table 2) and the average daily concentration data (Figure 2). First, the statistical analysis showed that the effect of rye was highly significant at both sites.
Second, in the control treatment sample, there was no significant effect of the rhizosphere on the daily average data analyzed for either DON or MinN, although substantial differences between sampling zones were observed at some point during the growth period (see Figure 1: control, both sites). Indeed, at site 1, the average daily DON concentration data differed between the exclusion and rhizosphere sampling zones by 57% in the rye mulch treatment sample and by 21% in the control sample. At site 2, the differences between the sampling zones were 63% in the rye mulch treatment sample and 11% in the control sample. At site 1, the average daily MinN concentration data differed between the exclusion and rhizosphere sampling zones by 51% and 23% for the rye mulch and control treatment, respectively. At site 2, the differences between sampling zones were 43% and −40% for the rye and control treatment, respectively (Figure 2). However, these differences were only found to be significant in the rye mulch treatment sample at both sites (Table 2).
- b.
- Phosphorus
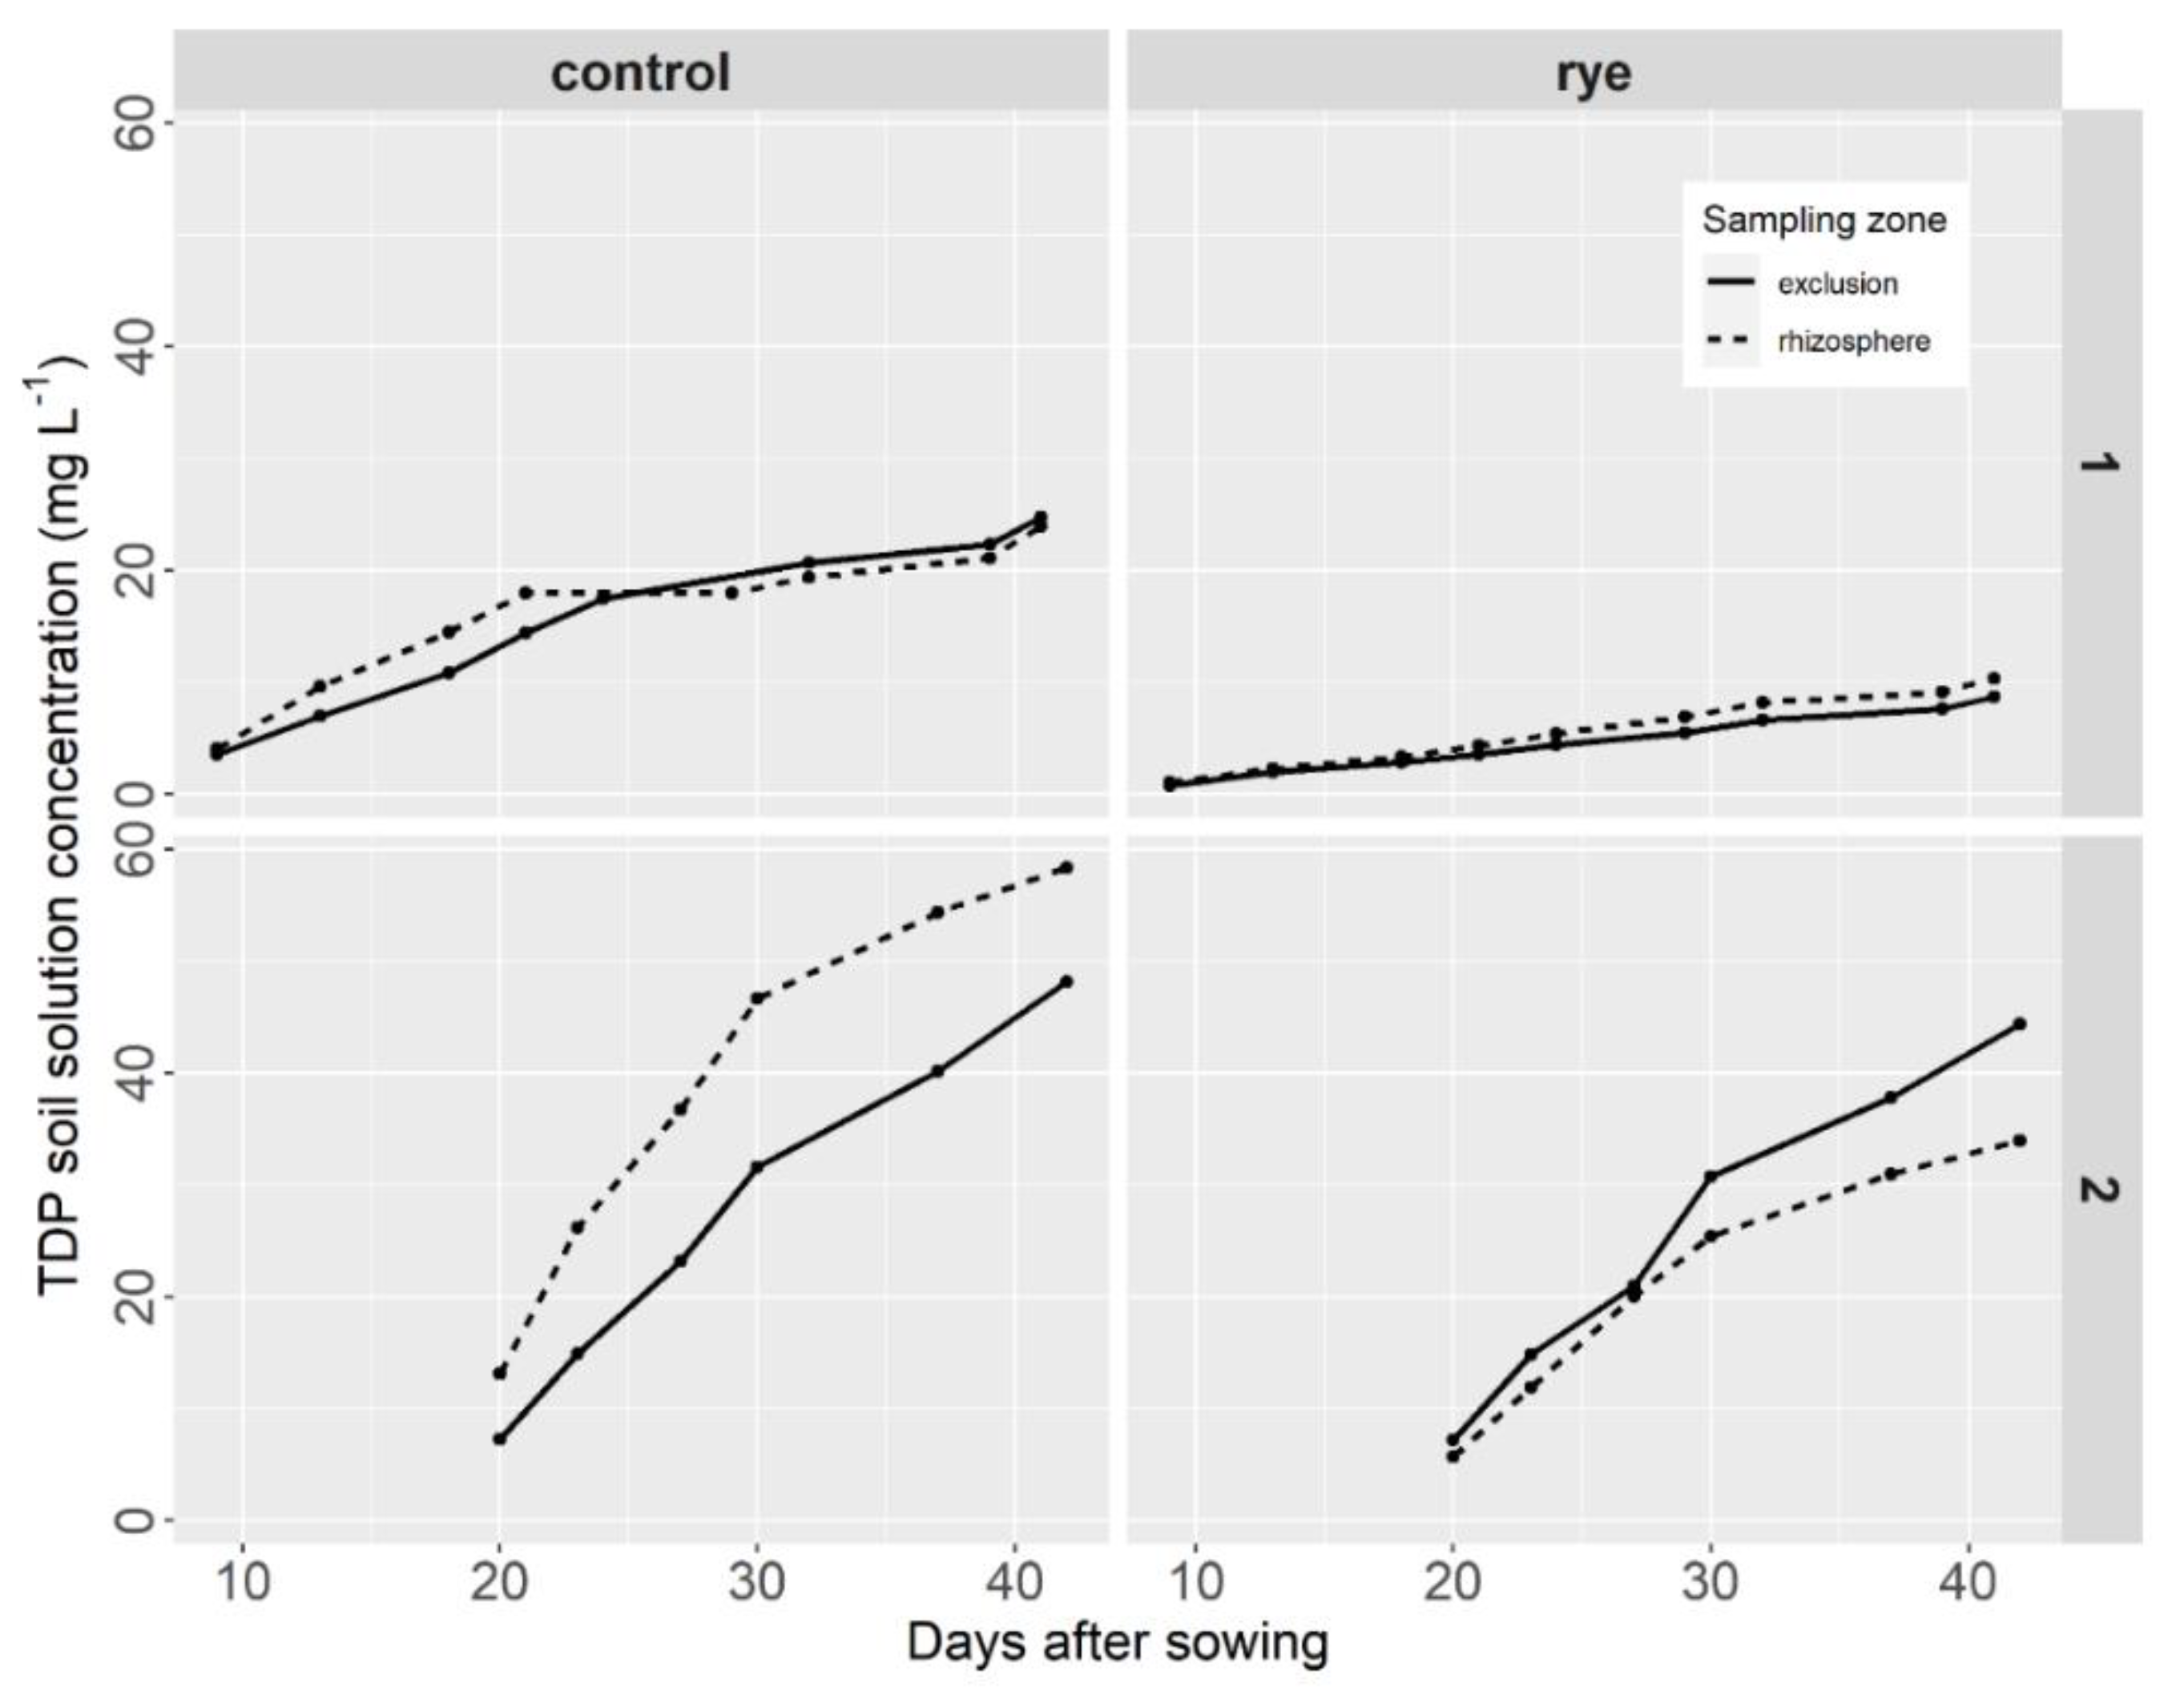
The effect of rye mulch treatment and sampling zone was less important for total dissolved phosphorus (TDP) in the soil solution (Figure 3). At site 1, the cumulative TDP data in the rhizosphere and exclusion zones were very similar and followed the same pattern, with a slow and regular increase over the lettuce growth period. The difference between the rye mulch treatment and the control treatment was important, as soil solution phosphorus in the control treatment sample was almost double that in the rye mulch treatment sample throughout the growth period (Figure 3: site 1). At site 2, there was a notable difference between sampling zones for both soil covers. In the control treatment (Figure 3: control, site 2), TDP was higher in the rhizosphere soil solution than in the exclusion soil solution, with the difference varying between 21 and 80%. In the rye cover crop treatment sample, the opposite was observed, although the difference was smaller, varying between 4 and 24% (Figure 3, site 2).
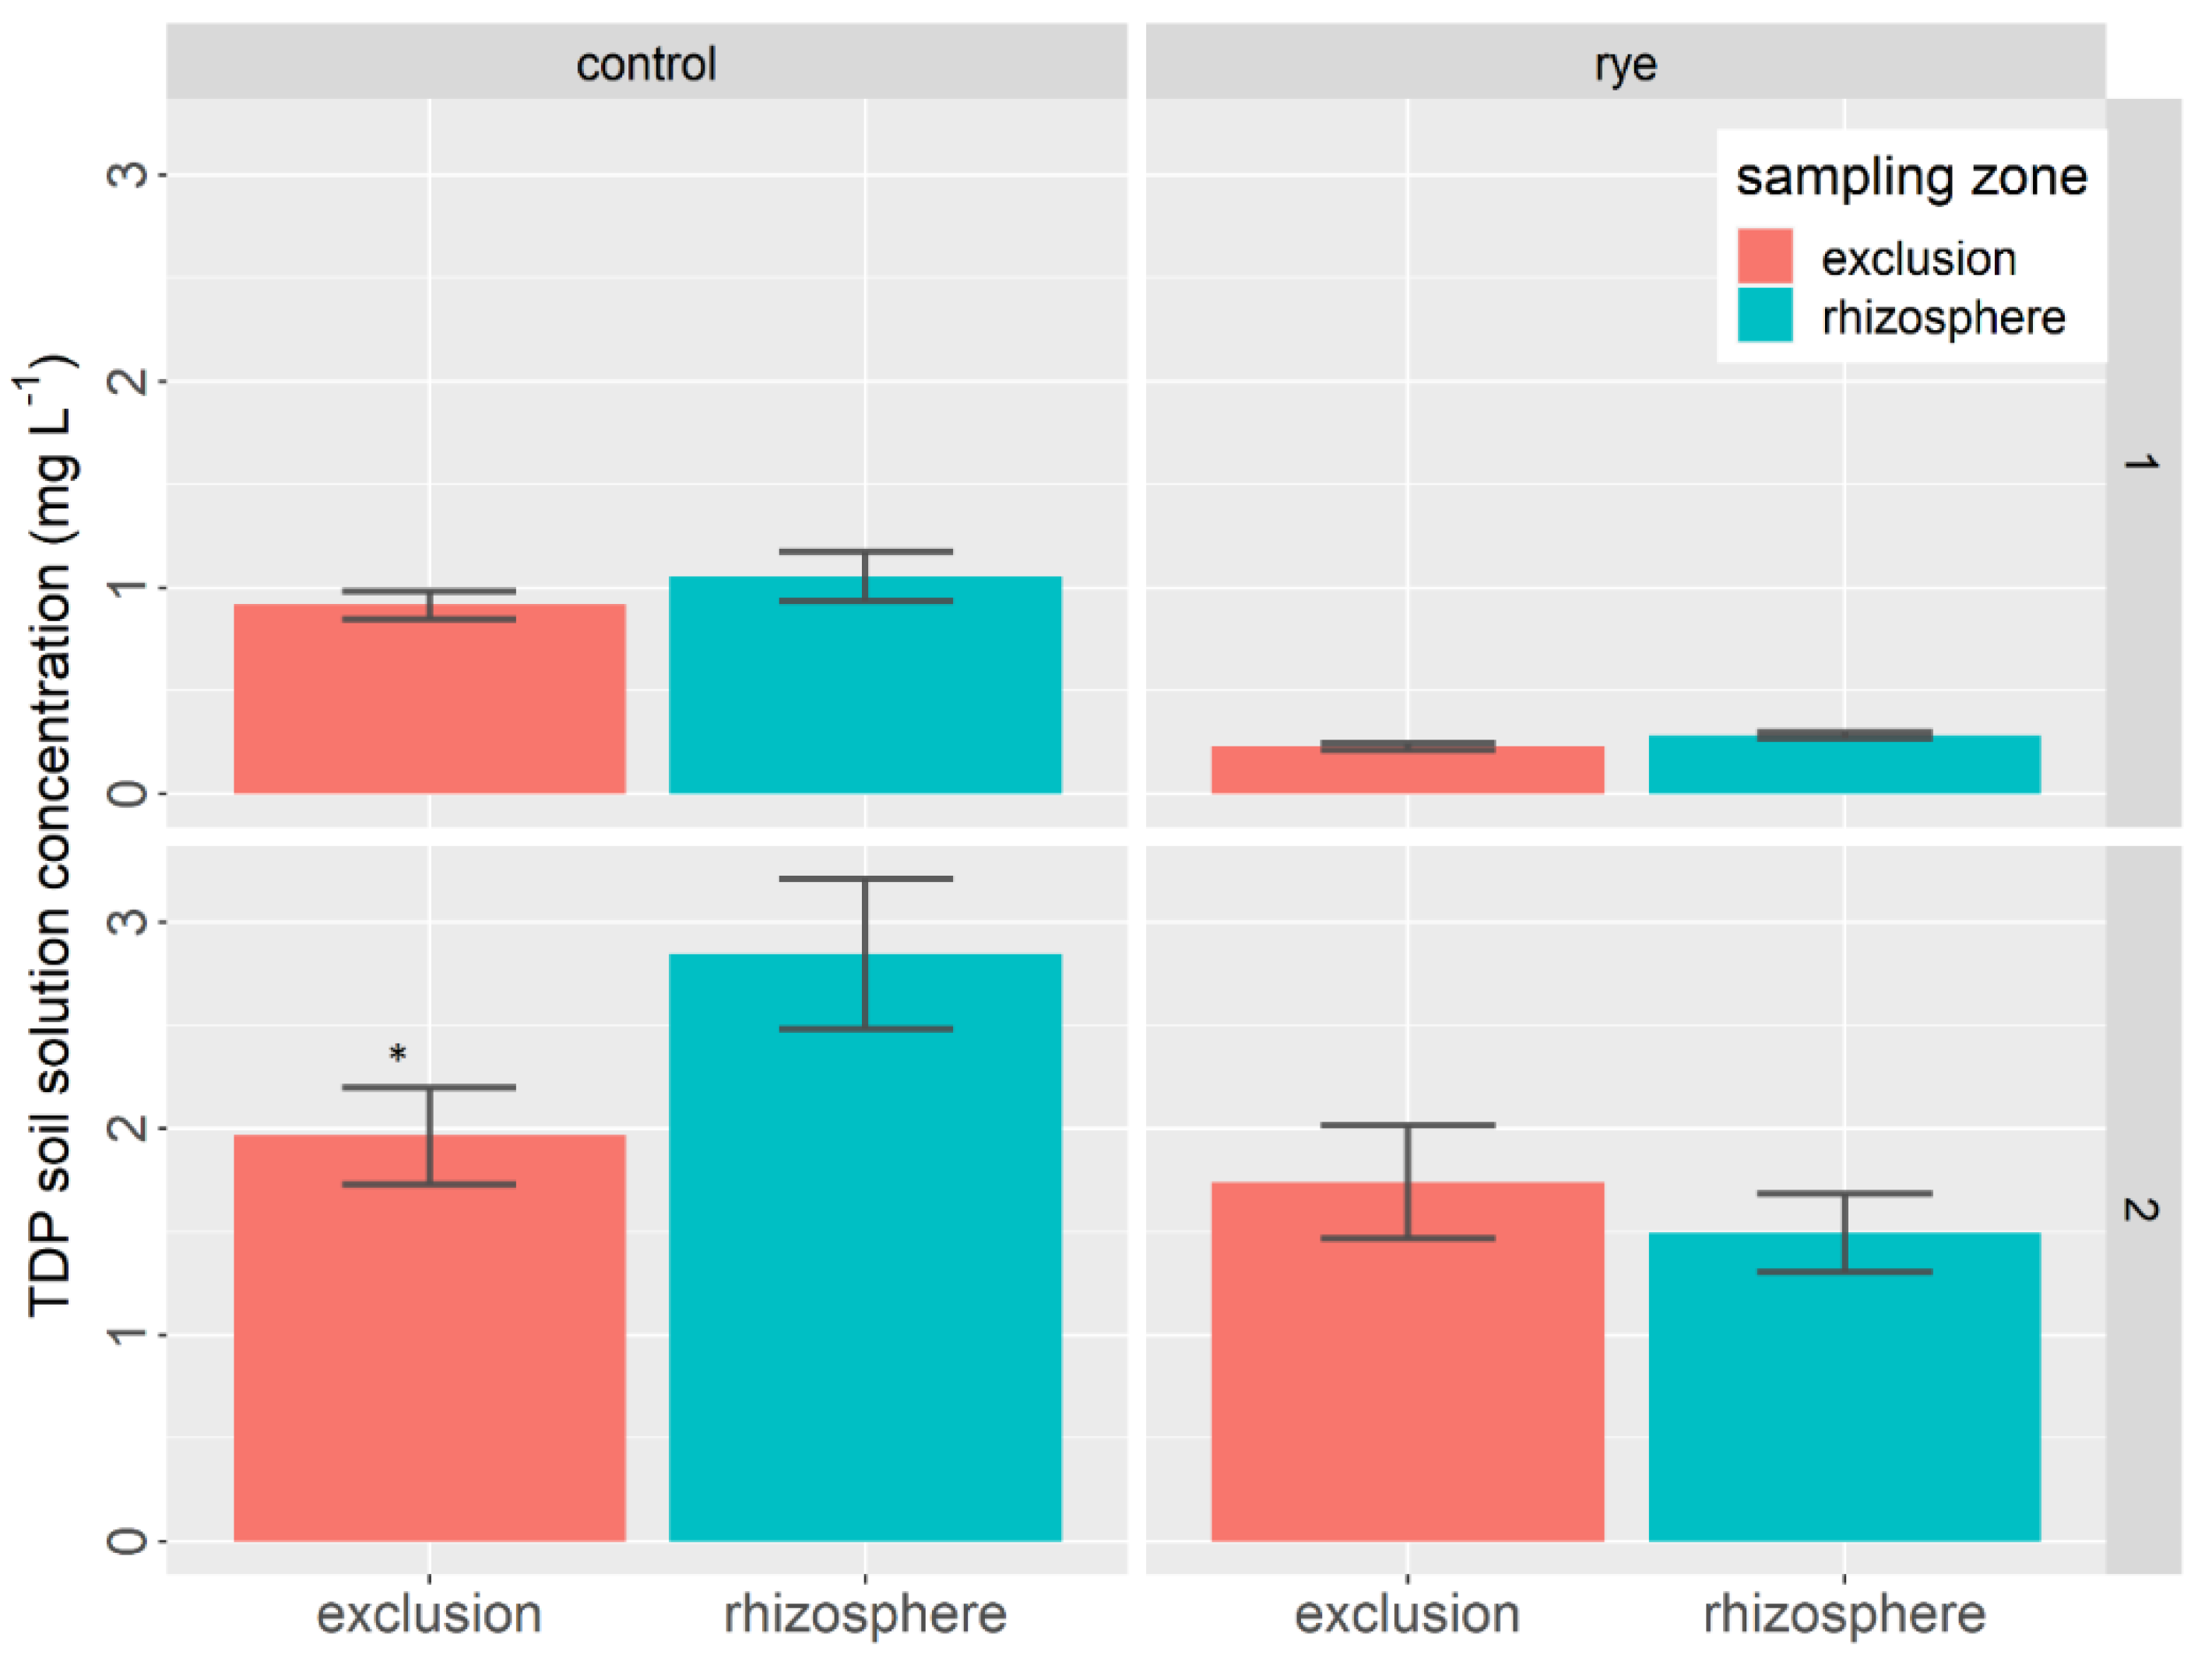
These observations were confirmed by the average daily TDP concentrations measured in the soil solution (Figure 4) and the statistical analysis (Table 2). The effect of the cover crop treatment was found to be significant at both sites (Table 2). At site 1, soil solution TDP in the rye mulch treatment sample was much lower than in the control treatment sample, with a difference of 76% in the exclusion sampling zone and 73% in the rhizosphere sampling zone.
At site 2, the average soil solution TDP in the rye mulch treatment sample was also lower than in the control treatment sample, but the effect was much weaker, with an 11% difference in the exclusion zone and a 28% difference in the rhizosphere sampling zone. In addition, at site 2, the effect of the soil sampling zone was significant in the control treatment sample (Table 2, Figure 4: control, site 2), where soil solution TDP was 31% higher in the exclusion sampling zone than in the rhizosphere zone.
3.3. Soil Nutrients and Carbon Status at the End of the Lettuce Growth Cycle
At the end of the lettuce growth period, significant differences between the rye mulch treatment sample and the control sample were found for mineral N (site 2), SON (both sites), total N (both sites), active C (site 1), total C (site 2), and the soil C/N ratio (both sites) (Table 3).
At site 1, SON, total N, and active C were significantly higher under the rye mulch treatment than under the control treatment. At site 2, mineral N, SON, total N, total C, and the soil C/N ratio were significantly lower under the rye mulch treatment (Table 3).
As expected, most of the soil parameters measured decreased with depth, with a significant difference found for Mehlich-III P, mineral N, SON, and active C (site 1) (Table 3). The opposite was observed for total C (site 2) and the soil C/N ratio (site 2), both of which increased with depth (Table 3).
Significant interactions were found between soil cover and depth for mineral N (site 2), SON (site 1), active C (site 1), and the soil C/N ratio (site 1) (Table 3).
4. Discussion
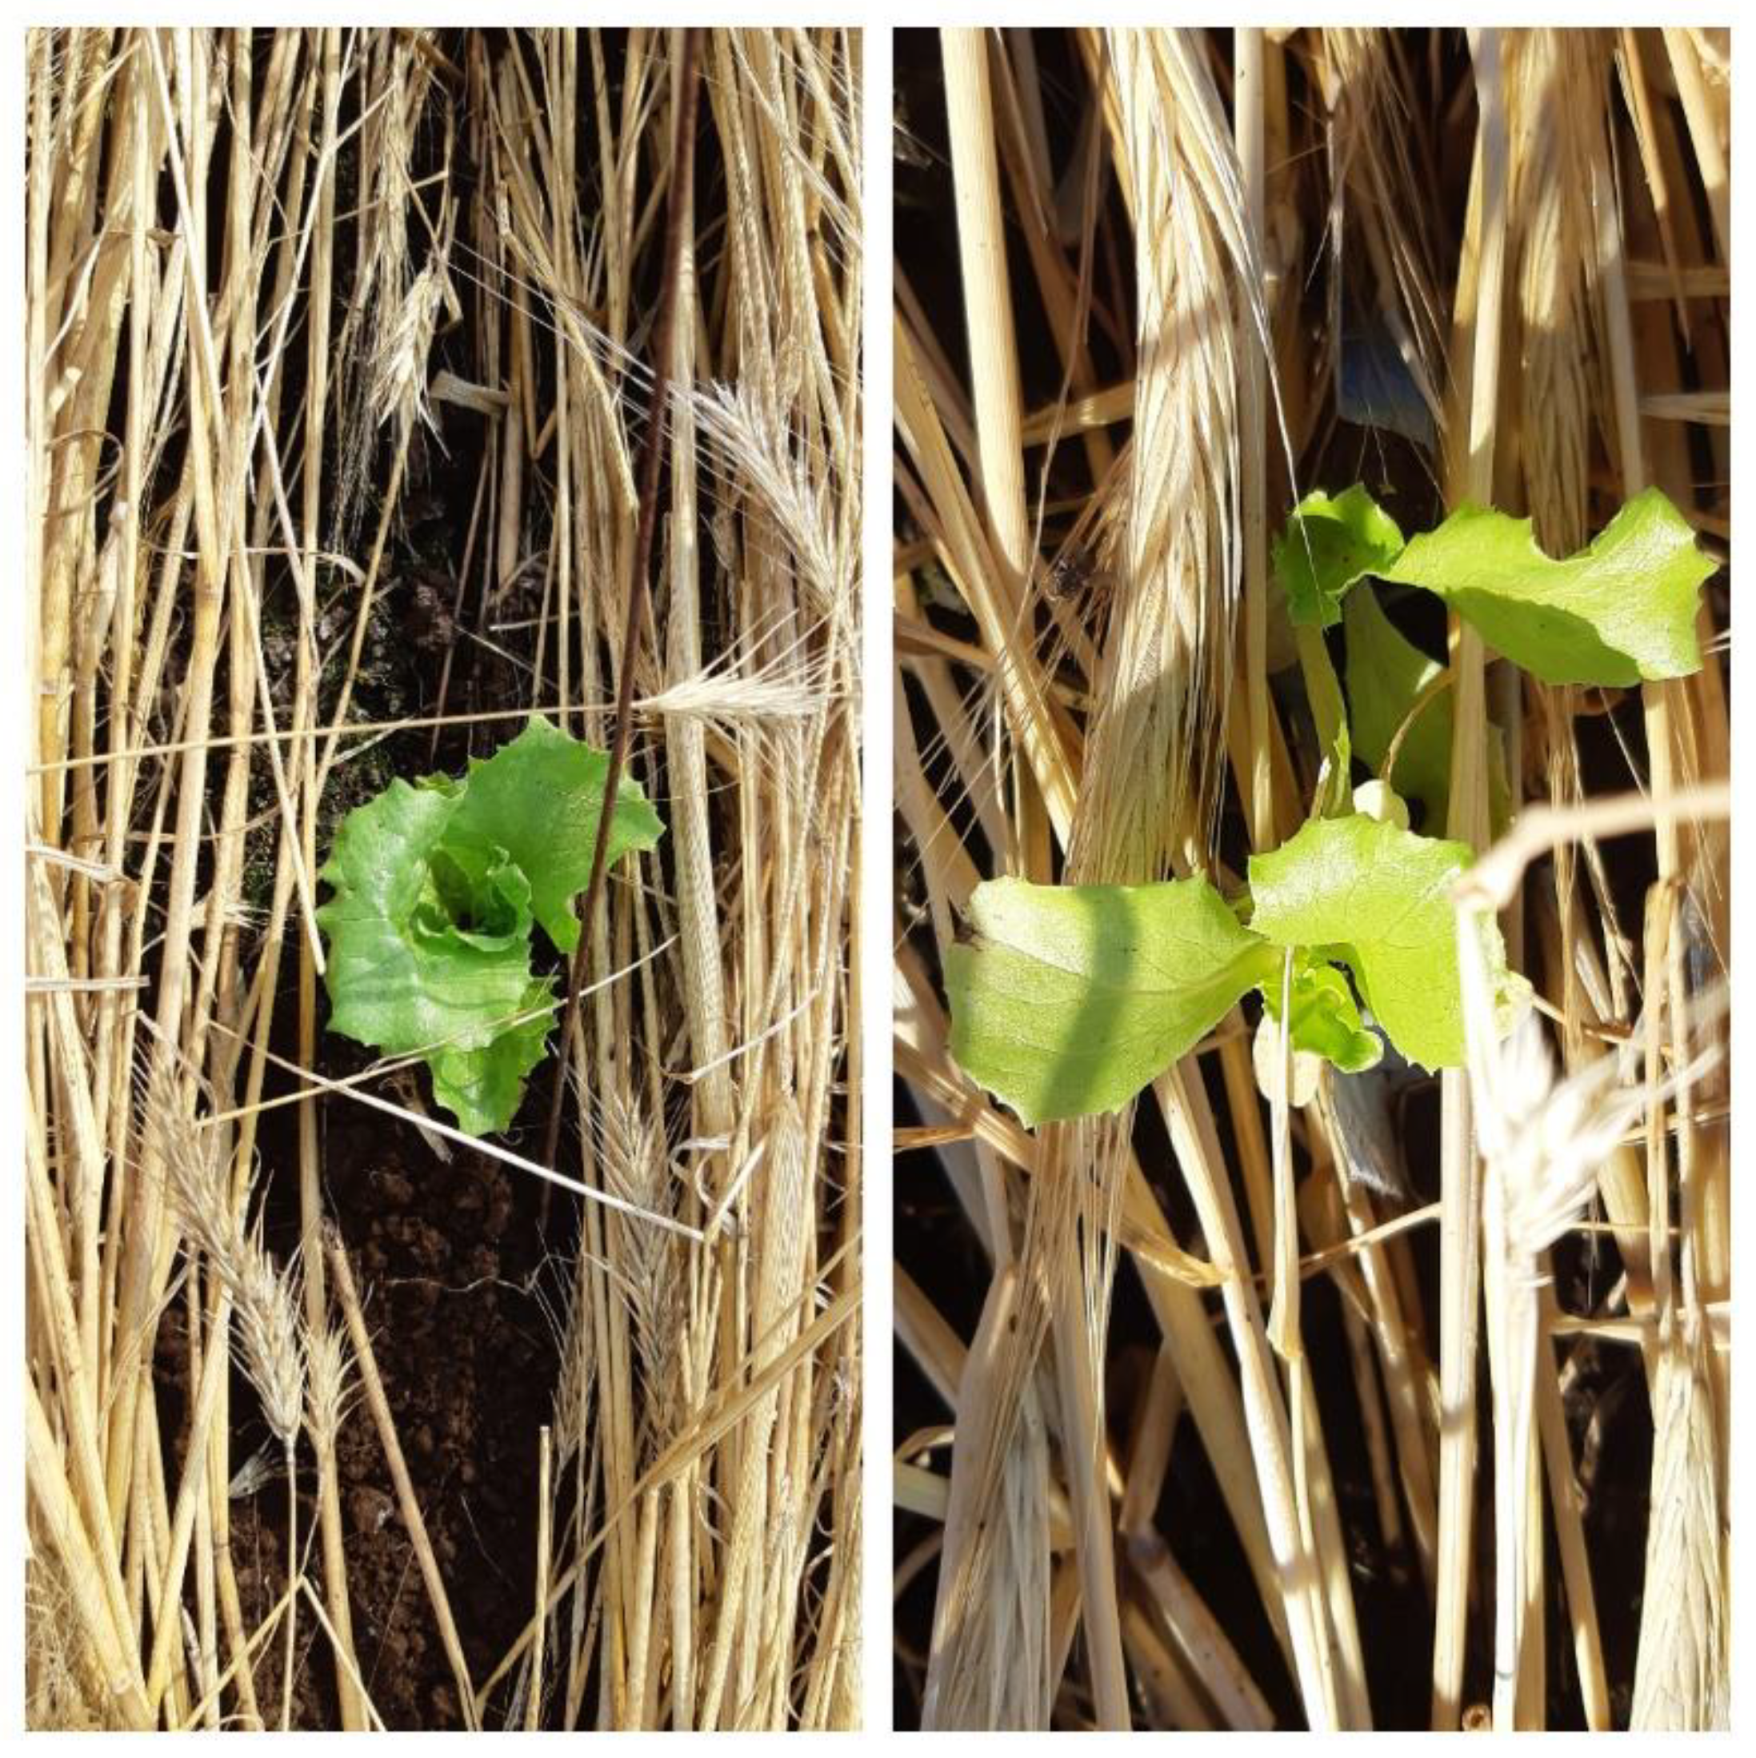
The presence of rye mulch and its decomposing roots diminished the available N pools in the soil solution at both experimental sites. This finding is consistent with those of other studies where C inputs from rye mulch were found to immobilize the available N [32,33]. Although winter rye can produce high yields making it an advantageous choice as a mulch cover [34], its dense and deep root system contributes significantly to the immobilization phenomenon [35,36]. In the present experiment, at site 1 (high rye yield cover), the lettuce yield under the rye mulch treatment was significantly lower than in the control treatment sample, and the available N (MinN + DON) was reduced by 78% (average for both N pools and sampling zones). At site 2, where the rye yield was low, the mulch treatment did not affect lettuce yield, but nonetheless reduced the available N by 58% (average for both N pools and sampling zones). Thus, the lower lettuce yield obtained at site 1 is at least partly due to greater N immobilization at this site. However, in view of the high fertility of histosols [37], it is likely that the reduction in the available N was not the only reason for the reduced lettuce yield at site 1 (high rye yield). The results suggest that in histosols, N pool dynamics, i.e., the rate of mineralization, uptake, and replenishment of the soil solution, might be sufficient to meet the growth requirements of a lettuce crop under rye mulch without increasing the fertilization rates normally used by growers. The reduced lettuce yield in the high-yield rye mulch treatment sample at site 1 might therefore have been the result of other factors, such as the allelopathic effect of rye mulch [17] and technical difficulties linked to the planting method and implantation of younger lettuce plants (5 days old) at this site as compared to site 2, where lettuce plants were transplanted at 15 days growth. The younger lettuce plants were very often found not inserted into the soil, but only sunk into the rye mulch as can be seen in Figure 5. Poor contact between the transplant and the soil could probably slow down the development of the lettuce plant.
The sampling zone strongly influenced the availability of N pools in the rye mulch treatment samples. It was expected that the measurable N pool concentrations in the soil solution would be lower in the rhizosphere due to the plant’s N uptake. It was initially expected that the MinN pool in the rhizosphere would be lower than the DON pool, as lettuce root uptake of the mineral form of N is generally higher. However, both mineral N and DON were found to be lower in the rhizosphere in the rye mulch treatment sample and their concentrations in the soil solution at site 1 were similar (average daily concentration of 15 mg L−1 for both MinN and DON). At site 2, MinN was found to be higher than DON (39 and 28 mg L−1, respectively; data from Figure 2). In the rhizosphere, the N concentration in the soil solution is controlled mainly by root uptake and the exudation and replenishment rate of the nutrient [38]. It is increasingly recognized that roots can take up and assimilate N in the organic form, especially when nitrogen is scarce [39,40,41,42]. The high DON pools in these histosols (mostly higher or equal to the MinN pool) suggest that lettuce roots could use this uptake pathway preferentially when the MinN pool becomes more limited under rye mulch, or that the replenishment rates of MinN and DON are high enough even under a rye mulch to meet the needs of a lettuce crop.
In this study, soil solution phosphorus was only influenced by the rye mulch at site 1, where the TDP concentration in the soil solution in the mulch treatment sample was found to be half that found in the control treatment sample over the course of the lettuce growth period. In contrast, Mehlich-III P extracted at the end of the lettuce growth cycle showed a tendency toward higher available P under rye mulch. Thus, the phosphorus immobilized during lettuce growth at site 1 may have been been released back into the soil as the lettuce and rye roots and mulch decomposed. Although few studies have examined P dynamics under rye mulch, some have observed that the presence of rye increased the soil phosphorus content [43], although the extracted P pool was not the same as in the present study. In addition, a study on the use of wheat and rice straw as soil amendments also found evidence of P immobilization [44].
At the end of the lettuce growth cycle, soil C and N levels differed between sites 1 and 2. At site 1 (high rye yield cover), both active C and soluble organic N contents were higher in the rye mulch treatment sample than in the control treatment sample at all depths. At site 2 (low-yield rye cover), however, active C and SON contents in the rye mulch treatment sample were lower than or similar to those in the control treatment sample. The higher rye yield at site 1 probably corresponded to a greater root biomass. Hence, the rye crop could have contributed significantly to the C pools through its biomass (straw and roots) and through the rhizodeposition process [45], thereby increasing both total and active C and SON pools.
5. Conclusions
Rye mulch can be used to protect cultivated histosols against soil erosion and provide a substantial source of carbon to compensate for the annual carbon losses that occur in these soils. The highly fertile histosols could benefit from this conservation practice and nitrogen availability does not seem to be the most important limiting factor for the growth of a crop such as lettuce. If implantation difficulties can be overcome, for example, by using older transplants and by using a planting method which allows better contact between the young transplant and the soil, this practice may well be a highly recommendable conservation approach for these valuable soils. This one-year field study was exploratory, to initiate the discussion on potential conservation practices for sustainable vegetable crop production on histosols. Future works are needed which would include consecutive years of study at multiple sites to be able to confirm and generalize the observations found in the present work. In addition, future works should focus on the long-term impacts of rye mulch on nutrient cycling, soil health, and C sequestration and could be used to investigate nitrogen uptake pathways under this conservation practice.
Author Contributions
Conceptualization J.D.-R.; Methodology: J.D.-R. and A.G.; formal analysis J.D.-R. and A.G.; investigation, A.G.; resources, J.D.-R. and J.C.; data curation, J.D.-R. and A.G.; writing—original draft preparation, J.D.-R., A.G.; writing—review and editing, J.D.-R., A.G., and J.C.; visualization, J.D.-R.; supervision, J.D.-R. and J.C.; project administration, J.D.-R. and J.C.; funding acquisition, J.C. All authors have read and agreed to the published version of the manuscript.
Funding
We would like to acknowledge the financial support of the Natural Sciences and Engineering Research Council of Canada (NSERC) through a Collaborative Research and Development Grant in partnership with Productions Horticoles Van Winden Inc., Les Fermes Hotte et Van Winden Inc., Maraîchers J.P. & L. Guérin et Fils Inc., Delfland Inc., and Vert Nature Inc., Isabelle inc., La Production Barry inc., Le Potager Montréalais ltée., Les Jardins A. Guérin et fils inc., Les Fermes du Soleil inc., Les Fermes R.R. et fils inc., Productions Maraîchères Breizh inc., and R. Pinsonneault et fils ltée.
Conflicts of Interest
The authors declare no conflict of interest.
References
- Food and Agriculture Organization (FAO). The Future of Food and Agriculture—Alternative Pathways to 2050; Food and Agriculture Organization of the United Nations: Rome, Italy, 2018. [Google Scholar]
- Ritchie, H.; Reay, D.S.; Higgins, P. The impact of global dietary guidelines on climate change. Glob. Environ. Chang. 2018, 49, 46–55. [Google Scholar] [CrossRef] [Green Version]
- Schiermeier, Q. Eat less meat: UN climate-change report calls for change to human diet. Nature 2019, 572, 291–292. [Google Scholar] [CrossRef] [PubMed] [Green Version]
- Norris, C.E.; Congreves, K.A. Alternative management practices improve soil health indices in intensive vegetable cropping systems: A review. Front. Environ. Sci. 2018, 6, 50. [Google Scholar] [CrossRef]
- Kroetsch, D.J.; Geng, X.; Chang, S.X.; Saurette, D.D. Organic soils of Canada: Part 1. Wetland organic soils. Can. J. Soil Sci. 2011, 91, 807–822. [Google Scholar] [CrossRef]
- MAPAQ. Portrait-Diagnostic Sectoriel des Légumes frais au Québec. 2018. Available online: https://www.mapaq.gouv.qc.ca/fr/Publications/Portraitsectoriellegumesfrais.pdf (accessed on 10 November 2020).
- Lucas, R.E.; RE, L. Organic Soils (Histosols) Formation, Distribution, Physical and Chemical Properties and Management for Crop Production. 1982. Available online: https://pascal-francis.inist.fr/vibad/index.php?action=getRecordDetail&idt=PASCALAGROLINEINRA83X0159565 (accessed on 1 August 2019).
- Dessureault-Rompré, J.; Libbrecht, C.; Caron, J. Biomass crops as a soil amendment in cultivated histosols: Can we reach carbon equilibrium? Soil Sci. Soc. Am. J. 2020, 84, 597–608. [Google Scholar] [CrossRef]
- Cassidy, E.S.; West, P.C.; Gerber, J.S.; Foley, J.A. Redefining agricultural yields: From tonnes to people nourished per hectare. Environ. Res. Lett. 2013, 8, 034015. [Google Scholar] [CrossRef]
- Pieper, J.R.; Brown, R.N.; Amador, J.A. Effects of three conservation tillage strategies on yields and soil health in a mixed vegetable production system. HortScience 2015, 50, 1770–1776. [Google Scholar] [CrossRef]
- Saini, R.; Singh, S. Contribution of Cover Crops and Reduced Tillage Systems for Weed Management in Organic Vegetable Production. Agric. Res. 2019, 4, 24. [Google Scholar]
- Siller, A.R.; Albrecht, K.A.; Jokela, W.E. Soil erosion and nutrient runoff in corn silage production with Kura clover living mulch and winter rye. Agron. J. 2016, 108, 989–999. [Google Scholar] [CrossRef]
- Ding, G.; Liu, X.; Herbert, S.; Novak, J.; Amarasiriwardena, D.; Xing, B. Effect of cover crop management on soil organic matter. Geoderma 2006, 130, 229–239. [Google Scholar] [CrossRef]
- Forcella, F.; Eklund, J.; Peterson, D. Rolled–crimped winter rye cover effects on hand-weeding times and fruit yield and quality of cucurbits. Int. J. Veg. Sci. 2015, 21, 386–396. [Google Scholar] [CrossRef]
- Singh, H.; Batish, D.R.; Kohli, R. Allelopathic interactions and allelochemicals: New possibilities for sustainable weed management. Crit. Rev. Plant Sci. 2003, 22, 239–311. [Google Scholar] [CrossRef]
- Barnes, J.P.; Putnam, A.R. Evidence for allelopathy by residues and aqueous extracts of rye (Secale cereale). Weed Sci. 1986, 34, 384–390. [Google Scholar] [CrossRef]
- Shilling, D.G.; Liebl, R.A.; Worsham, A.D. Rye (Secale cereale L.) and Wheat (Triticum aestivum L.) Mulch: The Suppression of Certain Broadleaved Weeds and the Isolation and Identification of Phytotoxins; ACS Publications: Washington, DC, USA, 1985. [Google Scholar]
- Basche, A.D.; Kaspar, T.C.; Archontoulis, S.V.; Jaynes, D.B.; Sauer, T.J.; Parkin, T.B.; Miguez, F.E. Soil water improvements with the long-term use of a winter rye cover crop. Agric. Water Manag. 2016, 172, 40–50. [Google Scholar] [CrossRef] [Green Version]
- Haruna, S.I.; Nkongolo, N.V. Cover crop management effects on soil physical and biological properties. Procedia Environ. Sci. 2015, 29, 13–14. [Google Scholar] [CrossRef] [Green Version]
- Weerasekara, C.S.; Udawatta, R.P.; Gantzer, C.J.; Kremer, R.J.; Jose, S.; Veum, K.S. Effects of cover crops on soil quality: Selected chemical and biological parameters. Commun. Soil Sci. Plant Anal. 2017, 48, 2074–2082. [Google Scholar] [CrossRef]
- Domagała-Świątkiewicz, I.; Siwek, P.; Bucki, P.; Rabiasz, K. Effect of hairy vetch (Vicia villosa Roth.) and vetch-rye (Secale cereale L.) biculture cover crops and plastic mulching in high tunnel vegetable production under organic management. Biol. Agric. Hortic. 2019, 35, 248–262. [Google Scholar] [CrossRef]
- Rosecrance, R.; McCarty, G.; Shelton, D.; Teasdale, J. Denitrification and N mineralization from hairy vetch (Vicia villosa Roth) and rye (Secale cereale L.) cover crop monocultures and bicultures. Plant Soil 2000, 227, 283–290. [Google Scholar] [CrossRef]
- Tabaglio, V.; Marocco, A.; Schulz, M. Allelopathic cover crop of rye for integrated weed control in sustainable agroecosystems. Ital. J. Agron. 2013, 8, 35–40. [Google Scholar] [CrossRef]
- Wells, M.S.; Brinton, C.M.; Reberg-Horton, S.C. Weed suppression and soybean yield in a no-till cover-crop mulched system as influenced by six rye cultivars. Renew. Agric. Food Syst. 2016, 31, 429–440. [Google Scholar] [CrossRef] [Green Version]
- Jabran, K. Rye allelopathy for weed control. In Manipulation of Allelopathic Crops for Weed Control; Springer: Cham, Switzerland, 2017; pp. 49–56. [Google Scholar]
- Canadian Agricultural Services Coordinating Committee. Soil Classification Working Group, National Research Council Canada. Agriculture, & Agri-Food Canada. Research Branch. In The Canadian System of Soil Classification; (No. 1646); NRC Research Press: Ottawa, ON, Canada, 1998. [Google Scholar]
- Rice, E.W.; Baird, R.B.; Eaton, A.D.; Clesceri, L.S. Standard Methods for the Examination of Water and Wastewater; American Public Health Association: Washington, DC, USA, 2012; pp. 2–66. [Google Scholar]
- Jones, D.; Willett, V. Experimental evaluation of methods to quantify dissolved organic nitrogen (DON) and dissolved organic carbon (DOC) in soil. Soil Biol. Biochem. 2006, 38, 991–999. [Google Scholar] [CrossRef]
- CEAEQ. Détermination des Métaux et du Phosphore Assimilables: Méthode par Spectrométrie de Masse à Source Ionisante au Plasma D’argon; MA 200–Mét-P ass 10; Centre d’Expertise en Analyse Environnementale du Québec: Quebec City, QC, Canada, 2014; p. 15. [Google Scholar]
- Blair, G.J.; Lefroy, R.D.; Lisle, L. Soil carbon fractions based on their degree of oxidation, and the development of a carbon management index for agricultural systems. Aust. J. Agric. Res. 1995, 46, 1459–1466. [Google Scholar] [CrossRef]
- Weil, R.R.; Islam, K.R.; Stine, M.A.; Gruver, J.B.; Samson-Liebig, S.E. Estimating active carbon for soil quality assessment: A simplified method for laboratory and field use. Am. J. Altern. Agric. 2003, 18, 3–17. [Google Scholar]
- Wells, M.; Reberg-Horton, S.; Smith, A.; Grossman, J. The reduction of plant-available nitrogen by cover crop mulches and subsequent effects on soybean performance and weed interference. Agron. J. 2013, 105, 539–545. [Google Scholar] [CrossRef]
- Williams, A.; Wells, M.S.; Dickey, D.A.; Hu, S.; Maul, J.; Raskin, D.T.; Reberg-Horton, S.C.; Mirsky, S.B. Establishing the relationship of soil nitrogen immobilization to cereal rye residues in a mulched system. Plant Soil 2018, 426, 95–107. [Google Scholar] [CrossRef] [Green Version]
- Kaspar, T.; Bakker, M. Biomass production of 12 winter cereal cover crop cultivars and their effect on subsequent no-till corn yield. J. Soil Water Conserv. 2015, 70, 353–364. [Google Scholar] [CrossRef]
- Malpassi, R.; Kaspar, T.; Parkin, T.; Cambardella, C.; Nubel, N. Oat and rye root decomposition effects on nitrogen mineralization. Soil Sci. Soc. Am. J. 2000, 64, 208–215. [Google Scholar] [CrossRef] [Green Version]
- Sievers, T.; Cook, R.L. Aboveground and root decomposition of cereal rye and hairy vetch cover crops. Soil Sci. Soc. Am. J. 2018, 82, 147–155. [Google Scholar] [CrossRef]
- Duguet, F.; Parent, L.E.; Ndayegamiye, A. Compositional indices of net nitrification in cultivated organic soils. Soil Sci. 2006, 171, 886–901. [Google Scholar] [CrossRef]
- Coskun, D.; Britto, D.T.; Shi, W.; Kronzucker, H.J. How plant root exudates shape the nitrogen cycle. Trends Plant Sci. 2017, 22, 661–673. [Google Scholar] [CrossRef]
- Dion, P.-P.; Jämtgård, S.; Bertrand, A.; Pepin, S.; Dorais, M. Organic nitrogen uptake and assimilation in Cucumis sativus using position-specific labeling and compound-specific isotope analysis. Front. Plant Sci. 2018, 9, 1596. [Google Scholar] [CrossRef]
- Enggrob, K.L.; Jakobsen, C.M.; Pedersen, I.F.; Rasmussen, J. Newly depolymerized large organic N contributes directly to amino acid uptake in young maize plants. New Phytol. 2019, 224, 689–699. [Google Scholar] [CrossRef] [PubMed]
- Jones, D.L.; Healey, J.R.; Willett, V.B.; Farrar, J.F.; Hodge, A. Dissolved organic nitrogen uptake by plants—An important N uptake pathway? Soil Biol. Biochem. 2005, 37, 413–423. [Google Scholar] [CrossRef]
- Näsholm, T.; Kielland, K.; Ganeteg, U. Uptake of organic nitrogen by plants. New Phytol. 2009, 182, 31–48. [Google Scholar] [CrossRef] [PubMed]
- Harasim, E.; Gawęda, D.; Wesołowski, M.; Kwiatkowski, C.; Gocół, M. Cover cropping influences physico-chemical soil properties under direct drilling soybean. Acta Agric. Scand. Sect. B Soil Plant Sci. 2016, 66, 85–94. [Google Scholar] [CrossRef]
- Fei, C.; Zhang, S.; Wei, W.; Liang, B.; Li, J.; Ding, X. Straw and optimized nitrogen fertilizer decreases phosphorus leaching risks in a long-term greenhouse soil. J. Soils Sed. 2020, 20, 1199–1207. [Google Scholar] [CrossRef]
- Austin, E.E.; Wickings, K.; McDaniel, M.D.; Robertson, G.P.; Grandy, A.S. Cover crop root contributions to soil carbon in a no-till corn bioenergy cropping system. Gcb. Bioenergy 2017, 9, 1252–1263. [Google Scholar] [CrossRef] [Green Version]
Figure 1.
Cumulative N pools during lettuce growth as a function of the sampling zone and the soil cover treatment for site 1 (high rye yield cover) and site 2 (low rye yield cover).
Figure 1.
Cumulative N pools during lettuce growth as a function of the sampling zone and the soil cover treatment for site 1 (high rye yield cover) and site 2 (low rye yield cover).

Figure 2.
Average daily N concentration during lettuce growth as a function of the sampling zone and the soil cover treatment at site 1 (high rye yield cover) and site 2 (low rye yield cover). Note that for simplicity, only the statistical differences between sampling zones for each of the N pools are illustrated in Figure 2. Stars indicate a significant difference at p < 0.05 between rhizosphere and exclusion sampling zones based on Tukey’s post-hoc test.

Figure 3.
Cumulative TDP pool during lettuce growth as a function of the sampling zone and the soil cover treatment at site 1 (high rye yield cover) and site 2 (low rye yield cover).
Figure 3.
Cumulative TDP pool during lettuce growth as a function of the sampling zone and the soil cover treatment at site 1 (high rye yield cover) and site 2 (low rye yield cover).

Figure 4.
Average daily TDP concentrations during lettuce growth as a function of the sampling zone and the soil cover treatment at site 1 (high rye yield cover) and site 2 (low rye yield cover). Note that for simplicity, only the statistical differences between sampling zones for each of the N pools are illustrated in Figure 2. Stars indicate a significant difference at p < 0.05 between rhizosphere and exclusion sampling zones based on Tukey’s post-hoc test.

Figure 5.
Lettuce planted on rye mulch at site 1. The picture on the left shows an example of a good transplant where the lettuce and the soil are in good contact. The picture on the right shows an example of a poor soil–transplant contact and a more difficult implantation.
Figure 5.
Lettuce planted on rye mulch at site 1. The picture on the left shows an example of a good transplant where the lettuce and the soil are in good contact. The picture on the right shows an example of a poor soil–transplant contact and a more difficult implantation.


Table 1.
Description of experimental sites.
| Site 1 | Site 2 | |
|---|---|---|
| Total surface area (control + rye treatment) | 1.8 ha | 1.0 ha |
| Rye variety | Guttino | Gauthier |
| Rye seeding rate (kg/ha) | 225 | 165 |
| Rye seeding date | 16 October 2018 | 25 September 2018 |
| Rye scrolling date | 15 May 2019 | 01 June 2019 |
| Rye yield (Mg ha−1) | 6 | 2.5 |
| Fertilization | 100 kg N/ha, 20 kg P2O5/ha, and 160 kg K2O/ha | 60 kg N/ha, 30 kg P2O5/ha, and 185kg K2O/ha |
| Lettuce variety | Global | Bergams Green |
| Lettuce planting method | PlantTape automated transplanting system | Planting in cubic blocks |
| Lettuce planting date | 30 June (seedlings were about 5 days old) | 10 July (seedlings were about 15 days old) |
| Lettuce harvest date | 08 August | 08 August |
| Lettuce yield: control (g per lettuce plant) | 556 | 648 |
| Lettuce yield: rye mulch cover (g per lettuce plant) | 101 | 605 |
Table 2.
Overview of ANOVA by site for sampling zone, soil cover, and N pool effects.
| Nitrogen | Phosphorus | |||||||
|---|---|---|---|---|---|---|---|---|
| Effect | Site 1 | Site 2 | Site 1 | Site 2 | ||||
| F Values | Pr > F † | F Values | Pr > F | F Values | Pr > F | F Values | Pr > F | |
| Sampling zone | 20.4 | <0.001 | 0.837 | 0.036 | 0.189 | 0.664 | 2.075 | 0.156 |
| Soil cover | 128 | <0.001 | 25.9 | <0.001 | 194 | <0.001 | 13.9 | <0.001 |
| N pools | 5.65 | 0.018 | 2.13 | 0.147 | n.d. ‡ | n.d. | n.d. | n.d. |
| Sampling zone: soil cover | 0.37 | 0.545 | 1.94 | 0.017 | 3.56 | 0.062 | 6.18 | 0.016 |
| Sampling zone: N pools | 0.67 | 0.413 | 1.14 | 0.287 | n.d. | n.d. | n.d. | n.d. |
| Soil cover: N pools | 7.78 | 0.006 | 2.52 | 0.115 | n.d. | n.d. | n.d. | n.d. |
| Sampling zone: soil cover: N pools | 0.01 | 0.906 | 0.28 | 0.599 | n.d. | n.d. | n.d. | n.d. |
† The Pr(>F) gives the p value for that test, i.e., the probability of observing an F ratio greater than that given the null hypothesis is true. ‡ n.d. stands for no data.
Table 3.
Soil nutrients and carbon status at the end of the lettuce growth cycle.
| Mehlich-III P (mg kg−1) | Mineral N (mg kg−1) | Soluble organic N (mg kg−1) | Total N (%) | Active C (mg kg−1) | Total C (%) | Soil C/N | |||||||||
|---|---|---|---|---|---|---|---|---|---|---|---|---|---|---|---|
| Site 1 | Site 2 | Site 1 | Site 2 | Site 1 | Site 2 | Site 1 | Site 2 | Site 1 | Site 2 | Site 1 | Site 2 | Site 1 | Site 2 | ||
| Soil cover | |||||||||||||||
| Rye | 83.2 | 82.7 | 46.9 | 48.0 a | 95.3 b | 111.4 a | 2.0 b | 2.09 b | 9247.9 b | 9209.7 | 48.3 | 45.1 a | 23.8 a | 21.0 a | |
| Control | 66.5 | 70.1 | 51.8 | 75.5 b | 80.2 a | 120.1 b | 1.8 a | 2.15 a | 7260.6 a | 9435.0 | 46.1 | 46.5 b | 26.1 b | 22.3 b | |
| Depth | |||||||||||||||
| 0–20 | 118.7 c | 112.3 c | 70.4 b | 86.8 b | 92.2 b | 129.8 b | 1.9 | 2.1 | 10,134.6 b | 10,537.8 | 46.1 | 44.3 a | 25.1 | 20.8 a | |
| 20–40 | 76.7 b | 92.0 b | 46.4 a | 53.8 a | 88.5 a | 124.5 b | 1.9 | 2.1 | 7913.3 a | 8655.6 | 46.9 | 44.5 a | 24.6 | 20.9 a | |
| 40–60 | 29.2 a | 24.9 a | 31.3 a | 44.7 a | 82.5 a | 93.1 a | 1.9 | 2.1 | 6714.9 a | 8773.6 | 48.6 | 48.6 b | 25.2 | 23.3 b | |
| Soil cover X depth interaction | |||||||||||||||
| Rye | 0–20 | 136.8 | 121.0 | 68.5 | 50.0 a | 96.9 c | 121.0 | 2.0 | 2.1 | 11,926.0 c | 10,573.0 | 46.5 | 43.2 | 22.9 a | 20.1 |
| 20–40 | 91.2 | 106.9 | 46.3 | 52.9 a | 100.1 c | 124.0 | 2.1 | 2.2 | 8760.3 b | 8309.5 | 48.2 | 43.5 | 22.6 a | 20.2 | |
| 40–60 | 21.8 | 20.3 | 25.9 | 41.0 a | 88.8 bc | 89.3 | 2.0 | 2.1 | 7057.5 ab | 8746.5 | 50.4 | 48.7 | 25.8 b | 22.8 | |
| Control | 0–20 | 100.7 | 103.6 | 72.3 | 123.5 b | 87.6 ab | 138.5 | 1.7 | 2.1 | 8343.3 ab | 10,502.5 | 45.7 | 45.5 | 27.2 b | 21.5 |
| 20–40 | 62.3 | 77.2 | 46.5 | 54.6 a | 76.9 a | 125.0 | 1.7 | 2.1 | 7066.3 ab | 9001.8 | 45.6 | 45.5 | 26.5 b | 21.7 | |
| 40–60 | 36.7 | 29.4 | 36.7 | 48.4 a | 76.2 a | 96.9 | 1.9 | 2.1 | 6372.3 a | 8800.8 | 46.8 | 48.5 | 24.6 a | 23.7 | |
| Statistical significance | |||||||||||||||
| Soil cover | NS | NS | NS | *** | *** | * | ** | ** | *** | NS | NS | ** | *** | *** | |
| Depth | *** | *** | ** | *** | ** | *** | NS | NS | *** | NS | NS | *** | NS | *** | |
| Soil cover X depth | NS | NS | NS | *** | * | NS | NS | NS | * | NS | NS | NS | *** | NS | |
| SE (18 df; n = 24) | 6.2 | 4.5 | 3.8 | 1.9 | 1.1 | 2.0 | 0.04 | 0.01 | 219.8 | 349.0 | 1.0 | 0.23 | 0.16 | 0.16 | |
Means in the same column for an individual main effect or interaction followed by a different letter are significantly different based on Tukey’s post-hoc test. Three stars *** indicate a significant difference at p < 0.001, two stars ** indicate a significant difference at p < 0.01, and one star * indicates a significant difference at p < 0.05; NS, not significant, df, degree of freedom.
Publisher’s Note: MDPI stays neutral with regard to jurisdictional claims in published maps and institutional affiliations. |
© 2020 by the authors. Licensee MDPI, Basel, Switzerland. This article is an open access article distributed under the terms and conditions of the Creative Commons Attribution (CC BY) license (http://creativecommons.org/licenses/by/4.0/).
Share and Cite
MDPI and ACS Style
Dessureault-Rompré, J.; Gloutney, A.; Caron, J. Nutrient Availability under Lettuce Grown in Rye Mulch in Histosols. Nitrogen 2020, 1, 137-150. https://0-doi-org.brum.beds.ac.uk/10.3390/nitrogen1020012
AMA Style
Dessureault-Rompré J, Gloutney A, Caron J. Nutrient Availability under Lettuce Grown in Rye Mulch in Histosols. Nitrogen. 2020; 1(2):137-150. https://0-doi-org.brum.beds.ac.uk/10.3390/nitrogen1020012
Chicago/Turabian StyleDessureault-Rompré, Jacynthe, Alexis Gloutney, and Jean Caron. 2020. "Nutrient Availability under Lettuce Grown in Rye Mulch in Histosols" Nitrogen 1, no. 2: 137-150. https://0-doi-org.brum.beds.ac.uk/10.3390/nitrogen1020012