Selecting Biomonitors of Atmospheric Nitrogen Deposition: Guidelines for Practitioners and Decision Makers


Abstract
:1. Introduction
2. Why Should Pollution Be Monitored?
3. Why Is There a Special Concern about Nitrogen Deposition?
4. When Is Biomonitoring of Atmospheric Pollution Recommended?
5. Guidelines for Biomonitoring Nitrogen Deposition: What, Who, and How
5.1. What: Pathways of Nitrogen Deposition
- Dry deposition is the process by which atmospheric pollutants, either gases or suspended particles, “fall” on different surfaces at the ground level by the direct action of gravity [30]. Additionally, gaseous compounds can be taken up directly by the vegetation through their leaf stomata [31]. Compounds such as ammonia (NH3), nitric acid (HNO3), and nitrogen dioxide (NO2) make up part of the dry deposition;
- Wet deposition occurs when the reactive forms of nitrogen are “washed” from the atmosphere by water. Thus, they are deposited by being dissolved in the rain, fog, snow, or aerosols such as mist spray. It is mainly composed of ammonium (NH4+) and nitrate (NO3−) ions, but other chemical forms can also be deposited with water, including nitric acid, one of the components of acid rain [31];
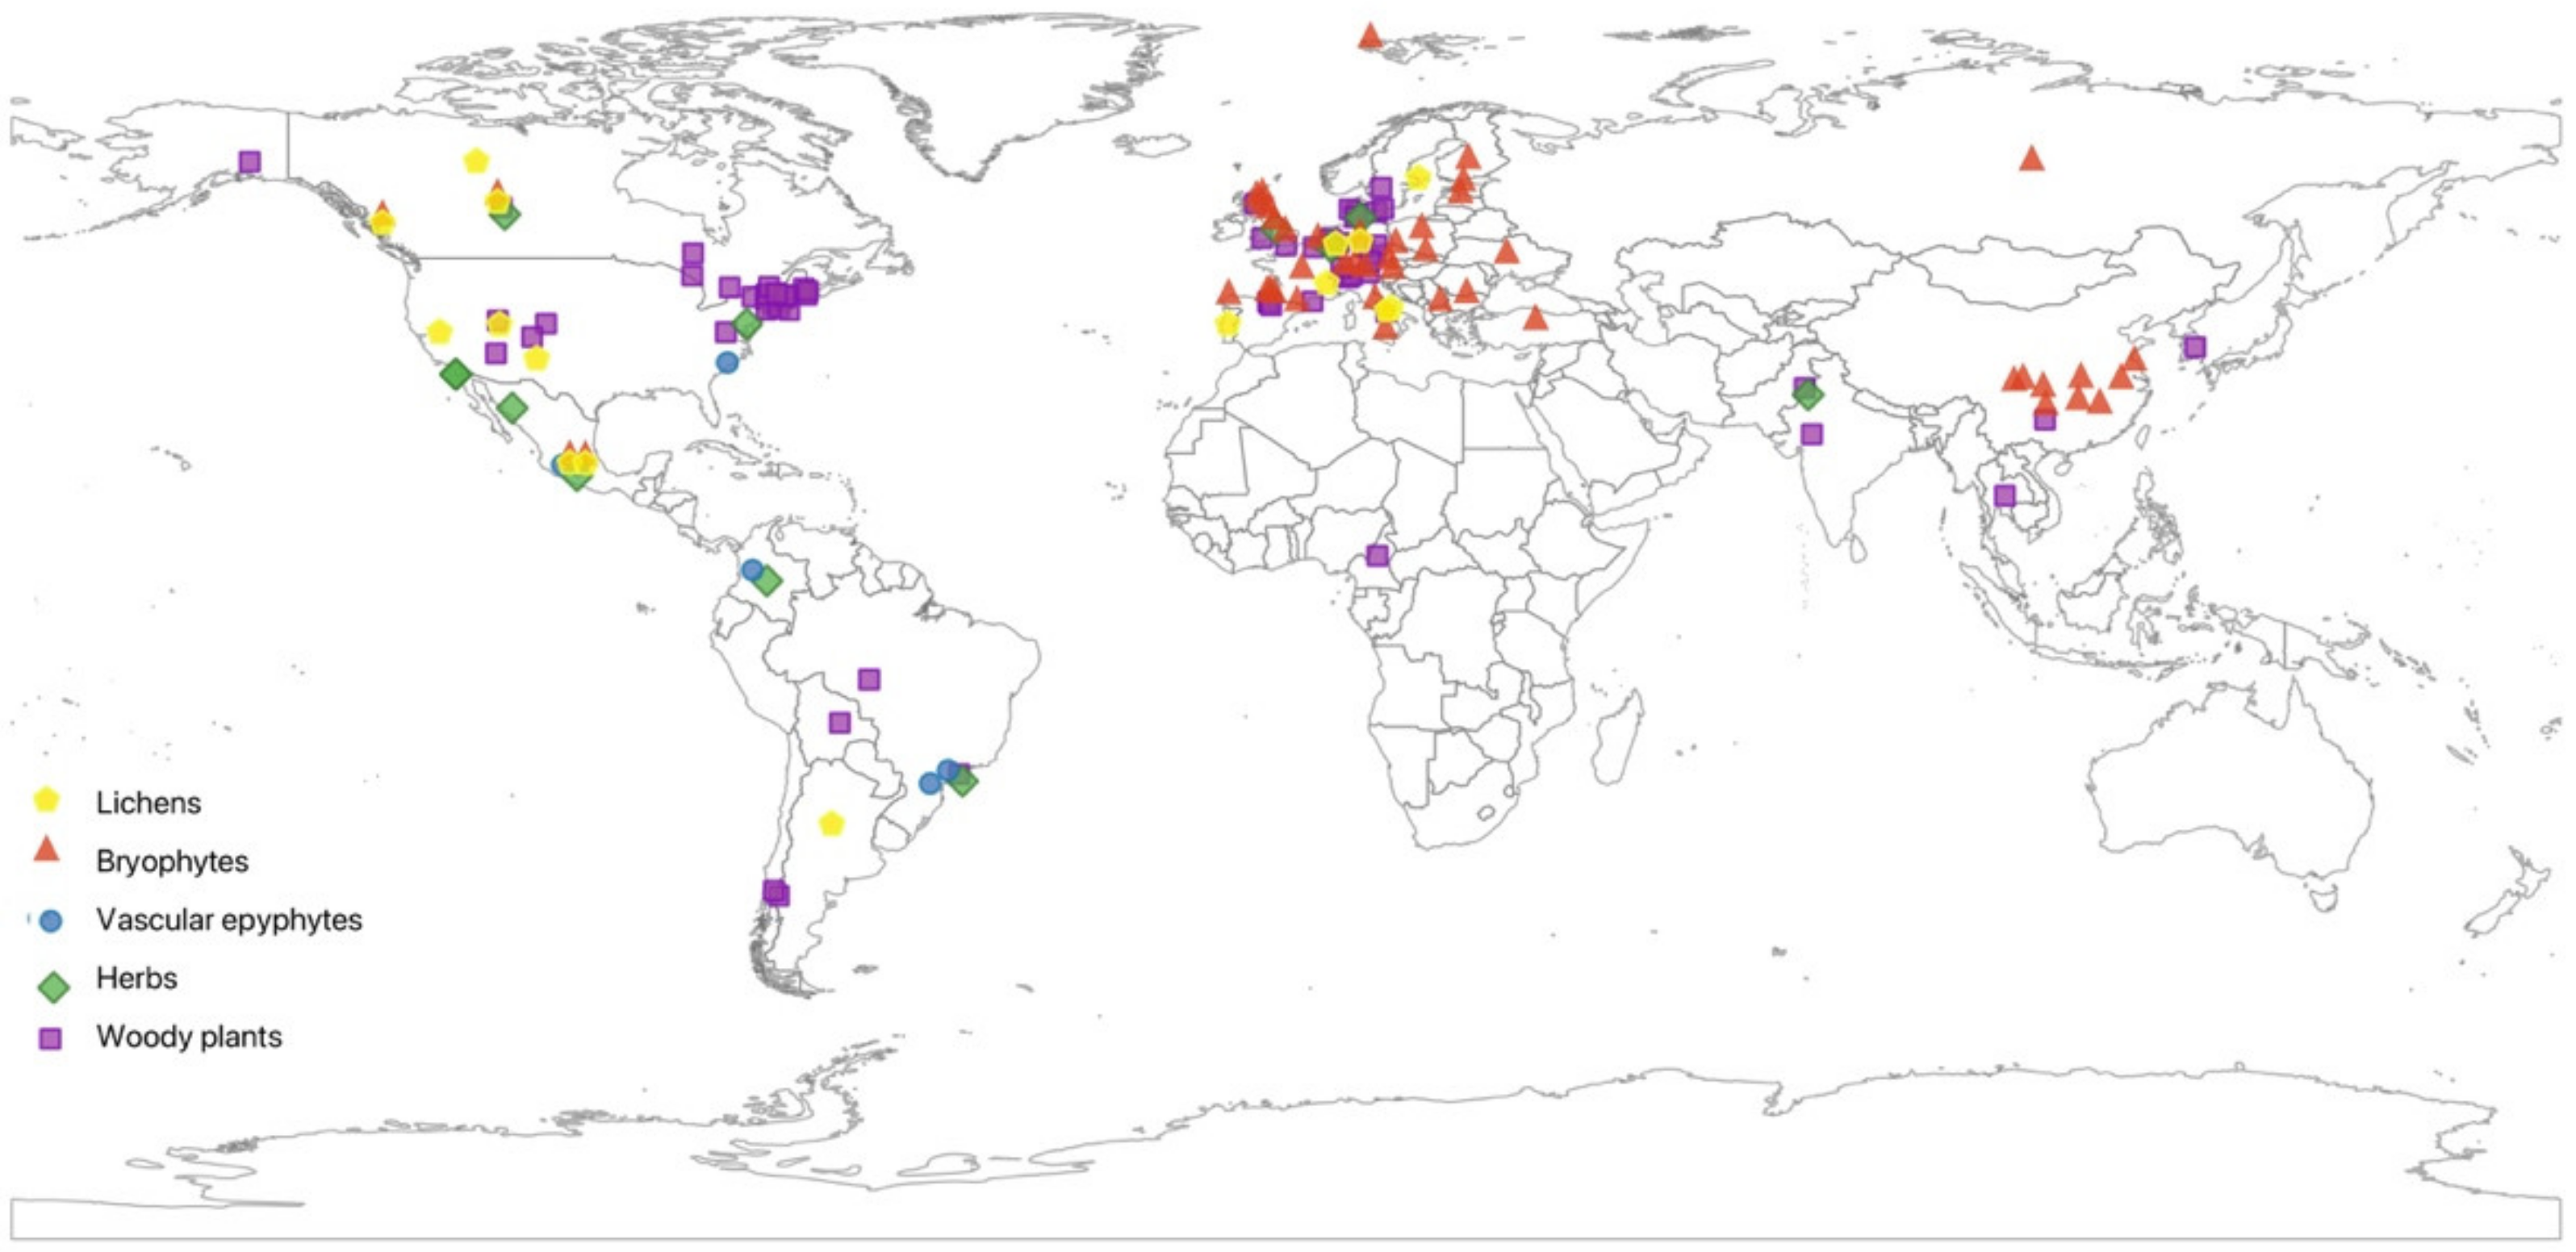
5.2. Who: Suitable Organisms for Biomonitoring Nitrogen Deposition
5.2.1. Lichens
5.2.2. Bryophytes
5.2.3. Vascular Epiphytes
5.2.4. Herbs
5.2.5. Woody Plants
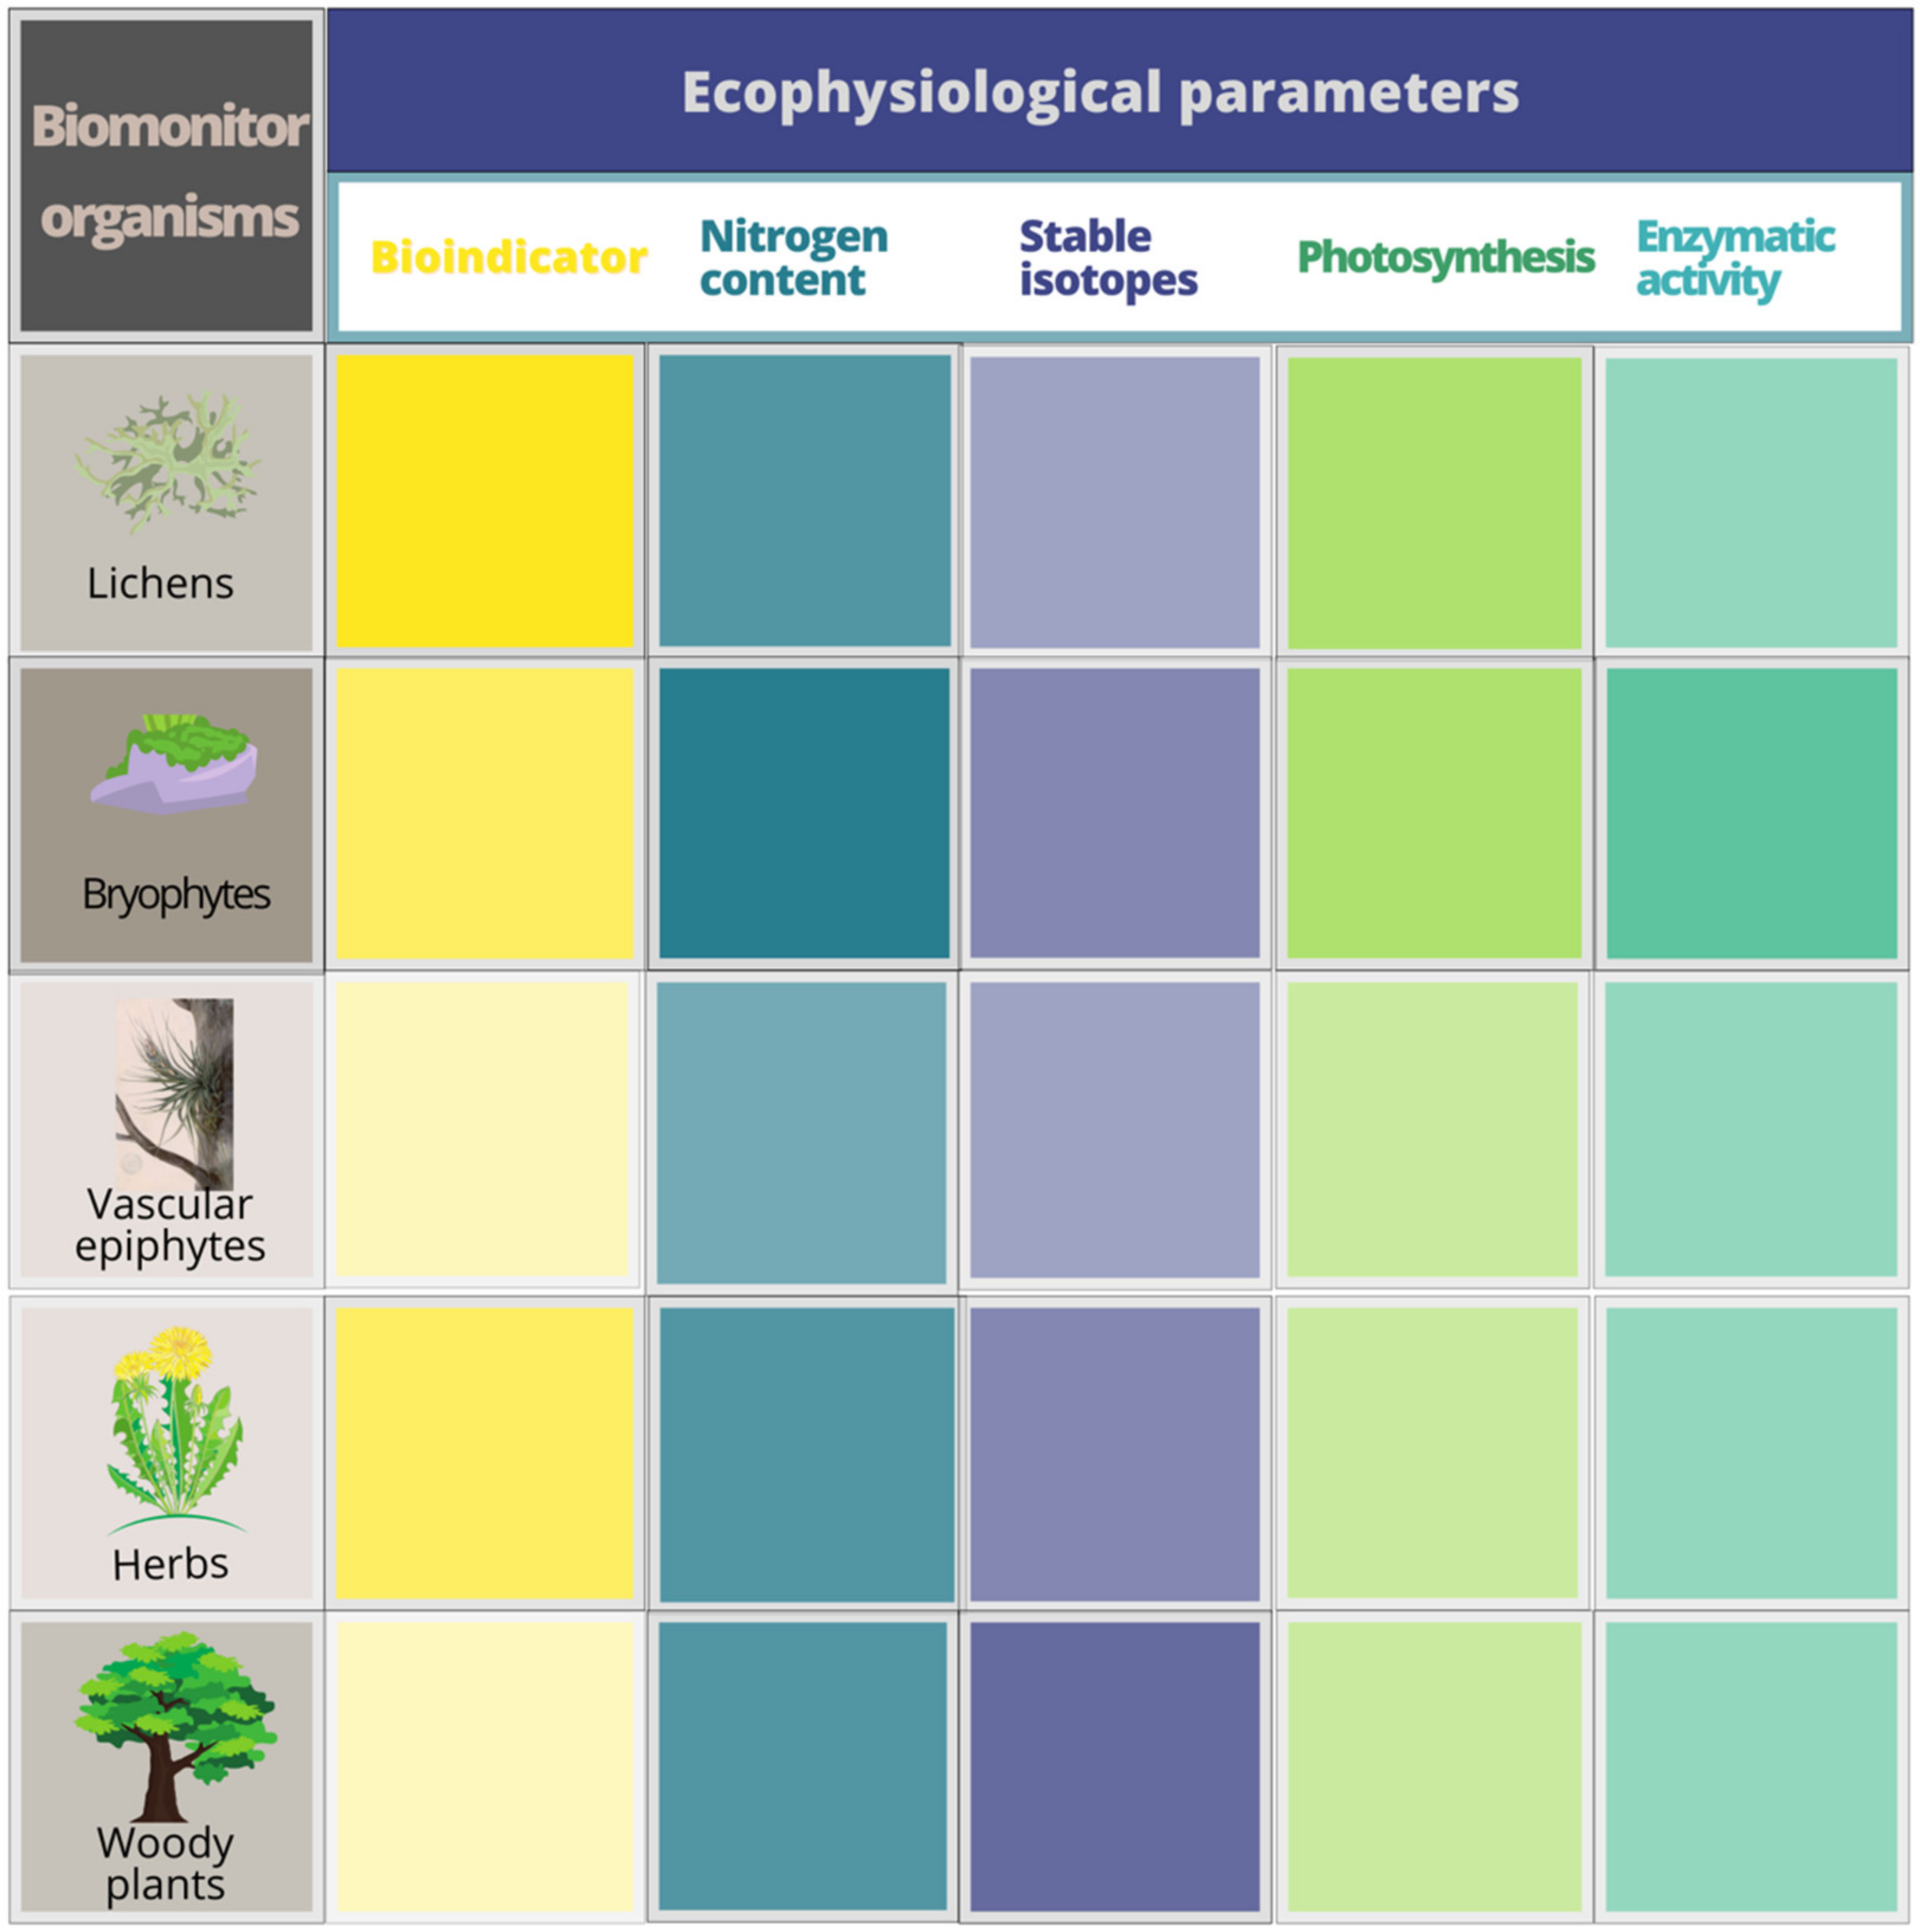
5.3. How: Ecophysiological Parameters That Respond to Nitrogen Deposition
5.3.1. Responses of Bioindicator Species
5.3.2. Nitrogen Concentration
5.3.3. δ15N
5.3.4. Photosynthesis Related Parameters
5.3.5. Enzymatic Activity
6. Policy Perspectives
- Implementation of biomonitoring in localities where automatic stations are not available can help local governments assess whether the human right to a clean environment is being fulfilled.
- The distribution and abundance of conspicuous bioindicator species, especially those with ample geographic distributions, lend themselves to recruit citizen scientist volunteers, who can help create participatory maps of environmental quality in regions of interest.
- Suitable biomonitoring species of different lifeforms can be identified in regions of interest that are relatively abundant and tolerant to the prevailing levels of pollution. The specific parameters to be measured are dependent on the available resources.
- Caution needs to be exercised when selecting biomonitors. Increased rates of nitrogen deposition seem to favor, in some cases, the proliferation of potentially invasive species. While species such as buffelgrass [60] and the castor bean [59] can be excellent biomonitors, they are quite noxious invasive species, so their introduction to new sites is never recommended.
- Because biomonitors can take up various chemical compounds that comprise atmospheric pollution, in addition to those from nitrogen deposition, their adoption can help in an integrated characterization of environmental quality, including responses to various criteria pollutants and other contaminants of concern in each region of interest.
Supplementary Materials
Author Contributions
Funding
Institutional Review Board Statement
Informed Consent Statement
Data Availability Statement
Acknowledgments
Conflicts of Interest
Sample Availability
References
- OECD. The Economic Consequences of Outdoor Air Pollution; OECD Publishing: Paris, France, 2016; pp. 13–30. [Google Scholar] [CrossRef]
- Landrigan, P.J.; Fuller, R.; Acosta, N.J.R.; Adeyi, O.; Arnold, R.; Basu, N.; Baldé, A.B.; Bertollini, R.; Bose-O’Reilly, S.; Boufford, J.I.; et al. The Lancet Commission on Pollution and Health. Lancet 2017, 391, 1–51. [Google Scholar] [CrossRef] [Green Version]
- IPCC Intergovernmental Panel on Climate Change. Available online: https://www.ipcc.ch/ (accessed on 27 May 2021).
- Stevens, G.; Dias, R.H.; Thomas, K.J.A.; Rivera, J.A.; Carvalho, N.; Barquera, S.; Hill, K.; Ezzati, M. Characterizing the epidemiological transition in Mexico: National and subnational burden of diseases, injuries, and risk factors. PLoS Med. 2008, 5, e125. [Google Scholar] [CrossRef]
- United Nations. Right to a Healthy Environment: Good Practices; United Nations: New York, NY, USA, 2019; pp. 1–27. [Google Scholar]
- SEMARNAT Diario Oficial de La Federación. NORMA Oficial Mexicana NOM-172-SEMARNAT-2019, Lineamientos Para La Obtención y Comunicación Del Índice de Calidad Del Aire y Riesgos a La Salud. Available online: https://www.dof.gob.mx/nota_detalle.php?codigo=5579387&fecha=20/11/2019 (accessed on 26 May 2021).
- Criteria Air Pollutants|US EPA. Available online: https://www.epa.gov/criteria-air-pollutants (accessed on 26 May 2021).
- Standards—Air Quality—Environment—European Commission. Available online: https://ec.europa.eu/environment/air/quality/standards.htm (accessed on 26 May 2021).
- Fowler, D.; Muller, J.B.A.; Sheppard, L.J. The GaNE Programme in a Global Perspective. Water Air Soil Pollut. Focus 2004, 4, 3–8. [Google Scholar] [CrossRef]
- Vitousek, P.M.; Aber, J.D.; Howarth, R.W.; Likens, G.E.; Matson, P.A.; Schindler, D.W.; Schlesinger, W.H.; Tilman, D.G. Human Alteration of the Global Nitrogen Cycle: Sources and Consequences. Ecol. Appl. 1997, 7, 737–750. [Google Scholar] [CrossRef] [Green Version]
- Feng, Z.; De Marco, A.; Anav, A.; Gualtieri, M.; Sicard, P.; Tian, H.; Fornasier, F.; Tao, F.; Guo, A.; Paoletti, E. Economic Losses Due to Ozone Impacts on Human Health, Forest Productivity and Crop Yield across China. Environ. Int. 2019, 131, 104966. [Google Scholar] [CrossRef] [PubMed]
- WHO. Nitrate and Nitrite in Drinking-Water; World Health Organization: Geneva, Switzerland, 2011; pp. 1–23. [Google Scholar]
- Townsend, A.R.; Howarth, R.W.; Bazzaz, F.A.; Booth, M.S.; Cleveland, C.C.; Collinge, S.K.; Dobson, A.P.; Epstein, P.R.; Holland, E.A.; Keeney, D.R.; et al. Human Health Effects of a Changing Global Nitrogen Cycle. Front. Ecol. Environ. 2003, 1, 240. [Google Scholar] [CrossRef]
- Britto, D.T.; Kronzucker, H.J. NH4+ Toxicity in Higher Plants: A Critical Review. J. Plant Physiol. 2002, 159, 567–584. [Google Scholar] [CrossRef] [Green Version]
- Adlimoghaddam, A.; Sabbir, M.G.; Albensi, B.C. Ammonia as a Potential Neurotoxic Factor in Alzheimer’s Disease. Front. Mol. Neurosci. 2016, 9, 57. [Google Scholar] [CrossRef] [PubMed] [Green Version]
- Sala, O.E.; Chapin, F.S., III; Armesto, J.J.; Berlow, E.; Dirzo, R.; Huber-sanwald, E.; Huenneke, L.F.; Robert, B.; Kinzig, A.; Leemans, R.; et al. Global Biodiversity Scenarios for the Year 2100. Science 2000, 287, 1770–1774. [Google Scholar] [CrossRef]
- Steffen, W.; Richardson, K.; Rockström, J.; Cornell, S.E.; Fetzer, I.; Bennett, E.M.; Biggs, R.; Carpenter, S.R.; De Vries, W.; De Wit, C.A.; et al. Planetary Boundaries: Guiding Human Development on a Changing Planet. Science 2015, 347, 1259855. [Google Scholar] [CrossRef] [Green Version]
- Phoenix, G.K.; Hicks, W.K.; Cinderby, S.; Kuylenstierna, J.C.I.; Stock, W.D.; Dentener, F.J.; Giller, K.E.; Austin, A.T.; Lefroy, R.D.B.; Gimeno, B.S.; et al. Atmospheric Nitrogen Deposition in World Biodiversity Hotspots: The Need for a Greater Global Perspective in Assessing N Deposition Impacts. Glob. Chang. Biol. 2006, 12, 470–476. [Google Scholar] [CrossRef]
- Horswill, P.; O’Sullivan, O.; Phoenix, G.K.; Lee, J.A.; Leake, J.R. Base Cation Depletion, Eutrophication and Acidification of Species-Rich Grasslands in Response to Long-Term Simulated Nitrogen Deposition. Environ. Pollut. 2008, 155, 336–349. [Google Scholar] [CrossRef] [PubMed]
- Tian, D.S.; Niu, S.L. A Global Analysis of Soil Acidification Caused by Nitrogen Addition. Environ. Res. Lett. 2015, 10, 024019. [Google Scholar] [CrossRef]
- Throop, H.L. Nitrogen Deposition and Herbivory Affect Biomass Production and Allocation in an Annual Plant. Oikos 2005, 111, 91–100. [Google Scholar] [CrossRef]
- SEMARNAT Diario Oficial de La Federación. NORMA Oficial Mexicana NOM-156-SEMARNAT-2012, Establecimiento y Operación de Sistemas de Monitoreo de La Calidad Del Aire. Available online: http://www.dof.gob.mx/nota_detalle.php?codigo=5259464&fecha=16%2F07%2F2012 (accessed on 27 May 2021).
- SINAICA Instituto Nacional de Ecología y Cambio Climático. Available online: https://sinaica.inecc.gob.mx/ (accessed on 21 May 2021).
- ICP Vegetation. Available online: https://icpvegetation.ceh.ac.uk/ (accessed on 27 May 2021).
- Díaz-Álvarez, E.A.; Lindig-Cisneros, R.; de la Barrera, E. Biomonitors of Atmospheric Nitrogen Deposition: Potential Uses and Limitations. Conserv. Physiol. 2018, 6, 1093–1110. [Google Scholar] [CrossRef] [Green Version]
- Soba, D.; Gámez, A.L.; Úriz, N.; Ruiz de Larrinaga, L.; Gonzalez-Murua, C.; Becerril, J.M.; Esteban, R.; Serret, D.; Araus, J.L.; Aranjuelo, I. Foliar Heavy Metals and Stable Isotope (δ13C, δ15N) Profiles as Reliable Urban Pollution Biomonitoring Tools. Urban For. Urban Green. 2021, 57, 126918. [Google Scholar] [CrossRef]
- Conti, M.E.; Cecchetti, G. Biological Monitoring: Lichens as Bioindicators of Air Pollution Assessment—A Review. Environ. Pollut. 2001, 114, 471–492. [Google Scholar] [CrossRef]
- Markert, B.A.; Breure, A.M.; Zechmeister, H.G. Bioindicators & Biomonitors, Principles, Concepts and Applications; Elsevier Science Ltd.: Kidlington, Oxford, UK, 2003; p. 967. [Google Scholar]
- Dokulil, M.T. Algae as ecological bio-indicators. In Bioindicators and Biomonitors, Principles, Concepts and Applications; Markert, B.A., Breure, A.M., Zechmeister, H.G., Eds.; Elsevier Science Ltd.: Kidlington, Oxford, UK, 2003; pp. 238–285. [Google Scholar]
- Beckett, K.P.; Freer-Smith, P.H.; Taylor, G. Urban Woodlands: Their Role in Reducing the Effects of Particulate Pollution. Environ. Pollut. 1998, 99, 347–360. [Google Scholar] [CrossRef]
- Cieslik, S.; Tuovinen, J.P.; Baumgarten, M.; Matyssek, R.; Brito, P.; Wieser, G. Gaseous Exchange between Forests and the Atmosphere, 1st ed.; Elsevier Ltd.: Amsterdam, The Netherlands, 2013; Volume 13, ISBN 978-0-08-098349-3. [Google Scholar]
- Eugster, W.; Haeni, M. Nutrients or pollutants? Nitrogen deposition to European forests. In Climate Change, Air Pollution and Global Challenges; Karnosky, D.F., Percy, K.E., Chappelka, A.H., Simpson, C., Pikkarainen, J., Eds.; Elsevier: Amsterdam, The Netherlands, 2013; pp. 37–56. ISBN 978-0-08-098349-3. [Google Scholar]
- Staelens, J.; De Schrijver, A.; Van Avermaet, P.; Genouw, G.; Verhoest, N. A Comparison of Bulk and Wet-Only Deposition at Two Adjacent Sites in Melle (Belgium). Atmos. Environ. 2005, 39, 7–15. [Google Scholar] [CrossRef]
- Hawksworth, D.L.; Iturriaga, T.; Crespo, A. Lichens as Rapid Bioindicators of Pollution and Habit Disturbance in the Tropics. Rev. Iberoam. Micol. 2005, 22, 71–82. [Google Scholar] [CrossRef]
- Grimm, M.; Grube, M.; Schiefelbein, U.; Zühlke, D.; Bernhardt, J.; Riedel, K. The Lichens’ Microbiota, Still a Mystery? Frontiers Media S.A.: Lausanne, Switzerland, 2021; Volume 12. [Google Scholar]
- Ruisi, S.; Zucconi, L.; Fornasier, F.; Paoli, L.; Frati, L.; Loppi, S. Israel Journal of Plant Sciences Mapping Environmental Effects of Agriculture with Epiphytic Lichens. Isr. J. Plant Sci. 2005, 53, 115–124. [Google Scholar] [CrossRef]
- De Bruyn, U.; Linders, H.W.; Mohr, K. Epiphytische Flechten Im Wandel von Immissionen Und Klima Ergebnisse Einer Vergleichskartierung 1989/2007 in Nordwestdeutschland. Umweltwiss. Schadst. Forsch. 2009, 21, 63–75. [Google Scholar] [CrossRef]
- Rangel-Osornio, V.; Fernández-Salegui, A.B.; Gómez-Reyes, V.M.; Cuevas-Villanueva, R.A.; Lopez-Toledo, L. Effects of Air Pollution on Chlorophyll Content and Morphology of Lichens Transplanted around a Paper Industry (Morelia, Mexico). Bryologist 2021, 124, 52–67. [Google Scholar] [CrossRef]
- Branquinho, C.; Gaio-Oliveira, G.; Augusto, S.; Pinho, P.; Máguas, C.; Correia, O. Biomonitoring Spatial and Temporal Impact of Atmospheric Dust from a Cement Industry. Environ. Pollut. 2008, 151, 292–299. [Google Scholar] [CrossRef] [PubMed]
- Root, H.T.; Jovan, S.; Fenn, M.; Amacher, M.; Hall, J.; Shaw, J.D. Lichen Bioindicators of Nitrogen and Sulfur Deposition in Dry Forests of Utah and New Mexico, USA. Ecol. Indic. 2021, 127, 107727. [Google Scholar] [CrossRef]
- Liu, X.Y.; Koba, K.; Liu, C.Q.; Li, X.D.; Yoh, M. Pitfalls and New Mechanisms in Moss Isotope Biomonitoring of Atmospheric Nitrogen Deposition. Environ. Sci. Technol. 2012, 46, 12557–12566. [Google Scholar] [CrossRef]
- Xiao, H.Y.; Xie, Z.Y.; Tang, C.G.; Wang, Y.L.; Liu, C.Q. Epilithic Moss as a Bio-Monitor of Atmospheric N Deposition in South China. J. Geophys. Res. Atmos. 2011, 116, D24301. [Google Scholar] [CrossRef] [Green Version]
- Zechmeister, H.G.; Richter, A.; Smidt, S.; Hohenwallner, D.; Roder, I.; Maringer, S.; Wanek, W. Total Nitrogen Content and δ15N Signatures in Moss Tissue: Indicative Value for Nitrogen Deposition Patterns and Source Allocation on a Nationwide Scale. Environ. Sci. Technol. 2008, 42, 8661–8667. [Google Scholar] [CrossRef]
- Harmens, H.; Norris, D.A.; Cooper, D.M.; Mills, G.; Steinnes, E.; Kubin, E.; Thöni, L.; Aboal, J.R.; Alber, R.; Carballeira, A.; et al. Nitrogen Concentrations in Mosses Indicate the Spatial Distribution of Atmospheric Nitrogen Deposition in Europe. Environ. Pollut. 2011, 159, 2852–2860. [Google Scholar] [CrossRef]
- Harmens, H.; Norris, D.; Cooper, D.; Hall, J. Spatial Trends in Nitrogen Concentrations in Mosses across Europe in 2005/2006. Report on Nitrogen in European Mosses; NERC/Centre for Ecology & Hydrology: Wallingford, UK, 2008. [Google Scholar]
- De La Barrera, E.; Andrade, J.L. Challenges to Plant Megadiversity: How Environmental Physiology Can Help. New Phytol. 2005, 167, 5–8. [Google Scholar] [CrossRef]
- Benzing, D.H. The Biology of Bromeliads; Mad River Press: Eureka, CA, USA, 1980. [Google Scholar]
- Díaz-Álvarez, E.A.; De La Barrera, E.; Barrios-Hernández, E.Y.; Arróniz-crespo, M.; de la Barrera, E.; Barrios-hernández, E.Y.; Arróniz-crespo, M. Morphophysiological Screening of Potential Organisms for Biomonitoring Nitrogen Deposition. Ecol. Indic. 2020, 108, 105729. [Google Scholar] [CrossRef]
- Stewart, G.R.; Aidar, M.P.M.M.; Joly, C.A.; Schmidt, S. Impact of Point Source Pollution on Nitrogen Isotope Signatures (δ15N) of Vegetation in SE Brazil. Oecologia 2002, 131, 468–472. [Google Scholar] [CrossRef]
- Díaz-Álvarez, E.A.; Lindig-Cisneros, R.; De La Barrera, E. Responses to Simulated Nitrogen Deposition by the Neotropical Epiphytic Orchid Laelia Speciosa. PeerJ 2015, 3, e1021. [Google Scholar] [CrossRef] [PubMed] [Green Version]
- Díaz-Álvarez, E.A.; Felix, J.D.; de la Barrera, E. Elemental and Isotopic Assessment for Colombian Orchids from a Montane Cloud Forest: A Baseline for Global Environmental Change. Acta Physiol. Plant. 2019, 41, 99. [Google Scholar] [CrossRef]
- Díaz-Álvarez, E.A.; Reyes-García, C.; de la Barrera, E. A δ15N Assessment of Nitrogen Deposition for the Endangered Epiphytic Orchid Laelia Speciosa from a City and an Oak Forest in Mexico. J. Plant Res. 2016, 129, 863–872. [Google Scholar] [CrossRef] [PubMed]
- Tegeder, M.; Masclaux-Daubresse, C. Source and Sink Mechanisms of Nitrogen Transport and Use. New Phytol. 2018, 217, 35–53. [Google Scholar] [CrossRef] [Green Version]
- Gebauer, G.; Dietrich, P. Nitrogen Isotope Ratios in Different Compartments of a Mixed Stand of Spruce, Larch and Beech Trees and of Understorey Vegetation Including Fungi. Isot. Environ. Health Stud. 1993, 29, 35–44. [Google Scholar] [CrossRef]
- Wang, W.; Pataki, D.E. Spatial Patterns of Plant Isotope Tracers in the Los Angeles Urban Region. Landsc. Ecol. 2009, 25, 35–52. [Google Scholar] [CrossRef]
- Redling, K.; Elliott, E.; Bain, D.; Sherwell, J. Highway Contributions to Reactive Nitrogen Deposition: Tracing the Fate of Vehicular NOx Using Stable Isotopes and Plant Biomonitors. Biogeochemistry 2013, 116, 261–274. [Google Scholar] [CrossRef]
- Power, S.A.; Collins, C.M. Use of Calluna vulgaris to Detect Signals of Nitrogen Deposition across an Urban-Rural Gradient. Atmos. Environ. 2010, 44, 1772–1780. [Google Scholar] [CrossRef]
- Martínez, D.N.; De la Barrera, E. Physiological Screening of Ruderal Weed Biomonitors of Atmospheric Nitrogen Deposition. Bot. Sci. 2021, 1, 573–587. [Google Scholar] [CrossRef]
- Khalid, N.; Noman, A.; Masood, A.; Tufail, A.; Hadayat, N.; Alnusairi, G.S.H.; Alamri, S.; Hashem, M.; Aqeel, M. Air Pollution on Highways and Motorways Perturbs Carbon and Nitrogen Levels in Roadside Ecosystems. Chem. Ecol. 2020, 36, 868–880. [Google Scholar] [CrossRef]
- Díaz-Álvarez, E.A.; de la Barrera, E. Influence of Land Use on the C and N Status of a C4 Invasive Grass in a Semi-Arid Region: Implications for Biomonitoring. Plants 2021, 10, 942. [Google Scholar] [CrossRef] [PubMed]
- Saurer, M.; Cherubini, P.; Ammann, M.; De Cinti, B.; Siegwolf, R. First Detection of Nitrogen from NOx in Tree Rings: A 15N/14N Study near a Motorway. Atmos. Environ. 2004, 38, 2779–2787. [Google Scholar] [CrossRef]
- Van Der Sleen, P.; Vlam, M.; Groenendijk, P.; Anten, N.P.R.; Bongers, F.; Bunyavejchewin, S.; Hietz, P.; Pons, T.L.; Zuidema, P.A. 15N in Tree Rings as a Bio-Indicator of Changing Nitrogen Cycling in Tropical Forests: An Evaluation at Three Sites Using Two Sampling Methods. Front. Plant Sci. 2015, 6, 229. [Google Scholar] [CrossRef] [PubMed] [Green Version]
- Boltersdorf, S.H.; Pesch, R.; Werner, W. Comparative Use of Lichens, Mosses and Tree Bark to Evaluate Nitrogen Deposition in Germany. Environ. Pollut. 2014, 189, 43–53. [Google Scholar] [CrossRef] [PubMed]
- Cobley, L.A.E.; Pataki, D.E. Vehicle Emissions and Fertilizer Impact the Leaf Chemistry of Urban Trees in Salt Lake Valley, UT. Environ. Pollut. 2019, 254, 112984. [Google Scholar] [CrossRef] [PubMed]
- Padgett, P.E.; Cook, H.; Bytnerowicz, A.; Heath, R.L. Foliar Loading and Metabolic Assimilation of Dry Deposited Nitric Acid Air Pollutants by Trees. J. Environ. Monit. 2009, 11, 75–84. [Google Scholar] [CrossRef] [PubMed]
- Ammann, M.; Siegwolf, R.; Pichlmayer, F.; Suter, M.; Saurer, M.; Brunold, C. Estimating the Uptake of Traffic-Derived NO2 from 15N Abundance in Norway Spruce Needles. Oecologia 1999, 118, 124–131. [Google Scholar] [CrossRef]
- Kenkel, J.A.; Sisk, T.D.; Hultine, K.R.; Sesnie, S.E.; Bowker, M.A.; Johnson, N.C. Indicators of Vehicular Emission Inputs into Semi-Arid Roadside Ecosystems. J. Arid Environ. 2016, 134, 150–159. [Google Scholar] [CrossRef]
- Xu, Y.; Xiao, H.; Guan, H.; Long, C. Monitoring Atmospheric Nitrogen Pollution in Guiyang (SW China) by Contrasting Use of Cinnamomum Camphora Leaves, Branch Bark and Bark as Biomonitors. Environ. Pollut. 2018, 233, 1037–1048. [Google Scholar] [CrossRef]
- Wieder, R.K.; Vile, M.A.; Scott, K.D.; Albright, C.M.; Quinn, J.C.; Vitt, D.H. Bog Plant/Lichen Tissue Nitrogen and Sulfur Concentrations as Indicators of Emissions from Oil Sands Development in Alberta, Canada. Environ. Monit. Assess. 2021, 193, 1–18. [Google Scholar] [CrossRef]
- Pardo, L.H.; Templer, P.H.; Goodale, C.L.; Duke, S.; Groffman, P.M.; Adams, M.B.; Boeckx, P.; Boggs, J.; Campbell, J.; Colman, B.; et al. Regional Assessment of N Saturation Using Foliar and Root Δ15N. Biogeochemistry 2006, 80, 143–171. [Google Scholar] [CrossRef]
- Aber, J.D.; Nadelhoffer, K.J.; Steudler, P.; Melillo, J.M. Nitrogen Saturation in Northern Forest Ecosystems. BioScience 1989, 39, 378–386. [Google Scholar] [CrossRef]
- Aber, J.; McDowell, W.; Nadelhoffer, K.; Magill, A.; Berntson, G.; Kamakea, M.; McNulty, S.; Currie, W.; Rustad, L.; Fernandez, I. Nitrogen Saturation in Temperate Forest Ecosystems. BioScience 1998, 48, 921–934. [Google Scholar] [CrossRef]
- Sommer, S.G. A Simple Biomonitor for Measuring Ammonia Deposition in Rural Areas. Biol. Fertil. Soils 1988, 6, 61–64. [Google Scholar] [CrossRef]
- Hoering, T. The Isotopic Composition of the Ammonia and the Nitrate Ion in Rain. Geochim. Cosmochim. Acta 1957, 12, 97–102. [Google Scholar] [CrossRef]
- Heaton, T.H.E. 15N/14N Ratios of NOx from Vehicle Engines and Coal-fired Power Stations. Tellus 1990, 42B, 304–307. [Google Scholar] [CrossRef]
- Wania, R.; Hietz, P.; Wanek, W. Natural 15N Abundance of Epiphytes Depends on the Position within the Forest Canopy: Source Signals and Isotope Fractionation. Plant Cell Environ. 2002, 25, 581–589. [Google Scholar] [CrossRef]
- Moore, H. The Isotopic Composition of Ammonia, Nitrogen Dioxide and Nitrate in the Atmosphere. Atmospheric Environ. 1977, 11, 1239–1243. [Google Scholar] [CrossRef]
- Felix, J.D.; Avery, G.B.; Mead, R.N.; Kieber, R.J.; Willey, J.D. Nitrogen Content and Isotopic Composition of Spanish Moss (Tillandsia Usneoides L.): Reactive Nitrogen Variations and Source Implications Across an Urban Coastal Air Shed. Environ. Process. 2016, 3, 711–722. [Google Scholar] [CrossRef]
- Arróniz-Crespo, M.; Leake, J.R.; Horton, P.; Phoenix, G.K. Bryophyte Physiological Responses to, and Recovery from, Long-Term Nitrogen Deposition and Phosphorus Fertilisation in Acidic Grassland. New Phytol. 2008, 180, 864–874. [Google Scholar] [CrossRef]
- Lichtenthaler, H.K.; Buschmann, C. Chlorophylls and Carotenoids: Measurement and Characterization by UV-VIS Spectroscopy. Curr. Protoc. Food Anal. Chem. 2001, 8, F4.3.1–F4.3.8. [Google Scholar] [CrossRef]
- Zhang, Y.; He, N.; Zhang, G.; Huang, J.; Han, X. Nitrogen Deposition and Leymus Chinensis Leaf Chlorophyll Content in Inner Mongolian Grassland. Shengtai Xuebao Acta Ecol. Sin. 2013, 33, 6786–6794. [Google Scholar] [CrossRef]
- Ashraf, M.; Harris, P.J.C. Photosynthesis under Stressful Environments: An Overview. Photosynthetica 2013, 51, 163–190. [Google Scholar] [CrossRef]
- Maxwell, K.; Johnson, G.N. Chlorophyll Fluorescence—A Practical Guide. J. Exp. Bot. 2000, 51, 659–668. [Google Scholar] [CrossRef]
- Lambers, H.; Chapin III, F.S.; Pons, T.L. Plant Physiological Ecology, 2nd ed.; Springer: New Jersey, NJ, USA, 2008; ISBN 978-0-387-78340-6. [Google Scholar]
- Woodin, S.J.; Lee, J.A. The Effects of Nitrate, Ammonium and Temperature on Nitrate Reductase Activity in Sphagnum Species. New Phytol. 1987, 105, 103–115. [Google Scholar] [CrossRef] [PubMed]
- Pearce, I.S.K.; Woodin, S.J.; Van Der Wal, R. Physiological and Growth Responses of the Montane Bryophyte Racomitrium Lanuginosum to Atmospheric Nitrogen Deposition. New Phytol. 2003, 160, 145–155. [Google Scholar] [CrossRef] [PubMed] [Green Version]
- Díaz-Álvarez, E.A.; De la Barrera, E.; Arciga-Pedraza, A.; Arróniz-Crespo, M.; de la Barrera, E.; Arciga-Pedraza, A.; Arróniz-Crespo, M.; De la Barrera, E.; Arciga-Pedraza, A.; Arróniz-Crespo, M.; et al. Bryophyte Enzymatic Responses to Atmospheric Nitrogen Deposition: A Field Validation for Potential Biomonitors. Bryologist 2019, 122, 396–403. [Google Scholar] [CrossRef]
- Phoenix, G.K.; Booth, R.E.; Leake, J.R.; Read, D.J.; Grime, J.P.; Lee, J.A. Effects of Enhanced Nitrogen Deposition and Phosphorus Limitation on Nitrogen Budgets of Semi-Natural Grasslands. Glob. Chang. Biol. 2003, 9, 1309–1321. [Google Scholar] [CrossRef]
- Johnson, D.; Leake, J.R.; Lee, J.A. The Effects of Quantity and Duration of Simulated Pollutant Nitrogen Deposition on Root-Surface Phosphatase Activities in Calcareous and Acid Grasslands: A Bioassay Approach. New Phytol. 1999, 141, 433–442. [Google Scholar] [CrossRef]
- PRISMA. Available online: http://www.prisma-statement.org/ (accessed on 27 May 2021).
- Johansson, O.; Nordin, A.; Olofsson, J.; Palmqvist, K. Responses of Epiphytic Lichens to an Experimental Whole-Tree Nitrogen-Deposition Gradient. New Phytol. 2010, 188, 1075–1084. [Google Scholar] [CrossRef] [PubMed]
- Díaz-Alvarez, E.; de la Barrera, E. Mapping Pollution in a Megalopolis: The Case for Atmospheric Biomonitors of Nitrogen Deposition. Sci. Rep. 2017, 11, 11–14. [Google Scholar] [CrossRef]
- Paoli, L.; Munzi, S.; Guttová, A.; Senko, D.; Sardella, G.; Loppi, S. Lichens as Suitable Indicators of the Biological Effects of Atmospheric Pollutants around a Municipal Solid Waste Incinerator (S Italy). Ecol. Indic. 2015, 52, 362–370. [Google Scholar] [CrossRef]
- Raymond, B.A.; Bassingthwaighte, T.; Shaw, D.P. Measuring Nitrogen and Sulphur Deposition in the Georgia Basin, British Columbia, Using Lichens and Moss. J. Limnol. 2010, 69, 22–32. [Google Scholar] [CrossRef] [Green Version]
- Bermejo-Orduna, R.; McBride, J.R.; Shiraishi, K.; Elustondo, D.; Lasheras, E.; Santamaría, J.M. Biomonitoring of Traffic-Related Nitrogen Pollution Using Letharia Vulpina (L.) Hue in the Sierra Nevada, California. Sci. Total Environ. 2014, 490, 205–212. [Google Scholar] [CrossRef] [PubMed]
- Pinho, P.; Martins-Loução, M.-A.; Máguas, C.; Branquinho, C. Calibrating Total Nitrogen Concentration in Lichens with Emissions of Reduced Nitrogen at the Regional Scale. In Nitrogen Deposition, Critical Loads and Biodiversity; Sutton, M.A., Mason, K.E., Sverdrup, L.J.S.H., Haeuber, R., Hicks, W.K., Eds.; Springer: New York, NY, USA, 2014; pp. 217–227. ISBN 978-1-62623-977-7. [Google Scholar]
- Gombert, S.; Asta, J.; Seaward, M.R.D. Lichens and Tobacco Plants as Complementary Biomonitors of Air Pollution in the Grenoble Area (Isère, Southeast France). Ecol. Indic. 2006, 6, 429–443. [Google Scholar] [CrossRef]
- González, C.M.; Orellana, L.C.; Casanovas, S.S.; Pignata, M.L. Environmental Conditions and Chemical Response of a Transplanted Lichen to an Urban Area. J. Environ. Manag. 1998, 53, 73–81. [Google Scholar] [CrossRef]
- Boltersdorf, S.H.; Werner, W. Lichens as a Useful Mapping Tool? An Approach to Assess Atmospheric N Loads in Germany by Total N Content and Stable Isotope Signature. Environ. Monit. Assess. 2014, 186, 4767–4778. [Google Scholar] [CrossRef]
- Meyer, M.; Schröder, W.; Nickel, S.; Leblond, S.; Lindroos, A.-J.; Mohr, K.; Poikolainen, J.; Santamaria, J.M.; Skudnik, M.; Thöni, L.; et al. Relevance of Canopy Drip for the Accumulation of Nitrogen in Moss Used as Biomonitors for Atmospheric Nitrogen Deposition in Europe. Sci. Total Environ. 2015, 538, 600–610. [Google Scholar] [CrossRef] [PubMed]
- Schröder, W.; Holy, M.; Pesch, R.; Harmens, H.; Fagerli, H.; Alber, R.; Coşkun, M.; De Temmerman, L.; Frolova, M.; González-Miqueo, L.; et al. First Europe-Wide Correlation Analysis Identifying Factors Best Explaining the Total Nitrogen Concentration in Mosses. Atmos. Environ. 2010, 44, 3485–3491. [Google Scholar] [CrossRef] [Green Version]
- Bonanno, G. Nitrogen Multitemporal Monitoring through Mosses in Urban Areas Affected by Mud Volcanoes around Mt. Etna, Italy. Environ. Monit. Assess. 2013, 185, 8115–8123. [Google Scholar] [CrossRef] [PubMed]
- Pearson, J.; Wells, D.M.; Seller, K.J.; Bennett, A.; Soares, A.; Woodall, J.; Ingrouille, M.J. Traffic Exposure Increases Natural 15N and Heavy Metal Concentrations in Mosses. New Phytol. 2000, 147, 317–326. [Google Scholar] [CrossRef]
- Gordon, C.; Wynn, J.M.; Woodin, S.J. Impacts of Increased Nitrogen Supply on High Arctic Heath: The Importance of Bryophytes and Phosphorus Availability. New Phytol. 2001, 149, 461–471. [Google Scholar] [CrossRef] [PubMed]
- Delgado, V.; Ederra, A.; Santamaría, J.M. Nitrogen and Carbon Contents and Δ15N and Δ13C Signatures in Six Bryophyte Species: Assessment of Long-Term Deposition Changes (1980–2010) in Spanish Beech Forests. Glob. Chang. Biol. 2013, 19, 2221–2228. [Google Scholar] [CrossRef] [PubMed]
- Harmens, H.; Norris, D.A.; Sharps, K.; Mills, G.; Alber, R.; Aleksiayenak, Y.; Blum, O.; Cucu-Man, S.M.; Dam, M.; De Temmerman, L.; et al. Heavy Metal and Nitrogen Concentrations in Mosses Are Declining across Europe Whilst Some “Hotspots” Remain in 2010. Environ. Pollut. 2015, 200, 93–104. [Google Scholar] [CrossRef] [Green Version]
- Hicks, W.K.; Leith, I.D.; Woodin, S.J.; Fowler, D. Can the Foliar Nitrogen Concentration of Upland Vegetation Be Used for Predicting Atmospheric Nitrogen Deposition? Evidence from Field Surveys. Environ. Pollut. 2000, 107, 367–376. [Google Scholar] [CrossRef]
- González-Miqueo, L.; Elustondo, D.; Lasheras, E.; Bermejo, R.; Santamaría, J.M. Spatial Trends in Heavy Metals and Nitrogen Deposition in Navarra (Northern Spain) Based on Moss Analysis. J. Atmospheric Chem. 2009, 62, 59–72. [Google Scholar] [CrossRef]
- González-Miqueo, L.; Elustondo, D.; Lasheras, E.; Santamaría, J. Use of Native Mosses as Biomonitors of Heavy Metals and Nitrogen Deposition in the Surroundings of Two Steel Works. Chemosphere 2010, 78, 965–971. [Google Scholar] [CrossRef]
- Izquieta-Rojano, S.; Elustondo, D.; Ederra, A.; Lasheras, E.; Santamaría, C.; Santamaría, J.M. Pleurochaete Squarrosa (Brid.) Lindb. as an Alternative Moss Species for Biomonitoring Surveys of Heavy Metal, Nitrogen Deposition and Δ15N Signatures in a Mediterranean Area. Ecol. Indic. 2016, 60, 1221–1228. [Google Scholar] [CrossRef]
- Izquieta-Rojano, S.; López-Aizpún, M.; Irigoyen, J.J.; Santamaría, J.M.; Santamaría, C.; Lasheras, E.; Ochoa-Hueso, R.; Elustondo, D. Eco-Physiological Response of Hypnum Cupressiforme Hedw. to Increased Atmospheric Ammonia Concentrations in a Forest Agrosystem. Sci. Total Environ. 2018, 619–620, 883–895. [Google Scholar] [CrossRef] [PubMed]
- Kosonen, Z.; Thimonier, A.; Schnyder, E.; Thöni, L. Nitrogen Concentration in Moss Compared with N Load in Precipitation and with Total N Deposition in Switzerland. Environ. Pollut. 2018, 239, 169–178. [Google Scholar] [CrossRef]
- Varela, Z.; García-Seoane, R.; Arróniz-Crespo, M.; Carballeira, A.; Fernández, J.A.; Aboal, J.R. Evaluation of the Use of Moss Transplants (Pseudoscleropodium Purum) for Biomonitoring Different Forms of Air Pollutant Nitrogen Compounds. Environ. Pollut. 2016, 213, 841–849. [Google Scholar] [CrossRef] [PubMed]
- Gerdol, R.; Marchesini, R.; Iacumin, P.; Brancaleoni, L. Monitoring Temporal Trends of Air Pollution in an Urban Area Using Mosses and Lichens as Biomonitors. Chemosphere 2014, 108, 388–395. [Google Scholar] [CrossRef] [PubMed]
- Piazzetta, K.D.; Ramsdorf, W.A.; Maranho, L.T. Use of Airplant Tillandsia Recurvata L., Bromeliaceae, as Biomonitor of Urban Air Pollution. Aerobiologia 2019, 35, 125–137. [Google Scholar] [CrossRef]
- Cardoso-Gustavson, P.; Fernandes, F.F.; Alves, E.S.; Victorio, M.P.; Moura, B.B.; Domingos, M.; Rodrigues, C.A.; Ribeiro, A.P.; Nievola, C.C.; Figueiredo, A.M.G. Tillandsia Usneoides: A Successful Alternative for Biomonitoring Changes in Air Quality Due to a New Highway in São Paulo, Brazil. Environ. Sci. Pollut. Res. 2016, 23, 1779–1788. [Google Scholar] [CrossRef]
- Sommer, S.G.; Østerg\aard, H.S.; Løfstrøm, P.; Andersen, H.V.; Jensen, L.S. Validation of Model Calculation of Ammonia Deposition in the Neighbourhood of a Poultry Farm Using Measured NH3 Concentrations and N Deposition. Atmos. Environ. 2009, 43, 915–920. [Google Scholar] [CrossRef]
- Kapoor, C.S.; Bamniya, B.R.; Kapoor, K. Efficient Control of Air Pollution through Plants, a Cost-Effective Alternative: Studies on Dalbergia Sissoo Roxb. Environ. Monit. Assess. 2013, 185, 7565–7580. [Google Scholar] [CrossRef]
- Gebauer, G.; Schulze, E.-D. Oecologia of a Healthy and a Declining Picea Abies Forest in the Fichtelgebirge. Oecologia 1991, 87, 198–207. [Google Scholar] [CrossRef]
- Gebauer, G.; Giesemann, A.; Schulze, E.D.; Jäger, H.J. Isotope Ratios and Concentrations of Sulfur and Nitrogen in Needles and Soils of Picea Abies Stands as Influenced by Atmospheric Deposition of Sulfur and Nitrogen Compounds. Plant Soil 1994, 164, 267–281. [Google Scholar] [CrossRef]
- Thoene, B.; Schröder, P.; Papen, H.; Egger, A.; Rennenberg, H. Absorption of Atmospheric NO2 by Spruce (Picea Abies L. Karst.) Trees: I. NO2 Influx and Its Correlation with Nitrate Reduction. New Phytol. 1991, 117, 575–585. [Google Scholar] [CrossRef] [Green Version]
- Yang, H.I.; Park, H.J.; Lee, K.S.; Lim, S.S.; Kwak, J.H.; Lee, S.I.S.M.S.I.; Chang, S.X.; Lee, S.I.S.M.S.I.; Choi, W.J. Δ13C, Δ15N, N Concentration, C/N, and Ca/Al of Pinus Densiflora Foliage in Korean Cities of Different Precipitation PH and Atmospheric NO2 and SO2 Levels. Ecol. Indic. 2018, 88, 27–36. [Google Scholar] [CrossRef]
- Jung, K.; Gebauer, G.; Gehre, M.; Hofmann, D.; Weißflog, L.; Schüürmann, G. Anthropogenic Impacts on Natural Nitrogen Isotope Variations in Pinus Sylvestris Stands in an Industrially Polluted Area. Environ. Pollut. 1997, 97, 175–181. [Google Scholar] [CrossRef]
- Hietz, P.; Dünisch, O.; Wanek, W. Long-Term Trends in Nitrogen Isotope Composition and Nitrogen Concentration in Brazilian Rainforest Trees Suggest Changes in Nitrogen Cycle. Environ. Sci. Technol. 2010, 44, 1191–1196. [Google Scholar] [CrossRef] [PubMed]


Publisher’s Note: MDPI stays neutral with regard to jurisdictional claims in published maps and institutional affiliations. |
© 2021 by the authors. Licensee MDPI, Basel, Switzerland. This article is an open access article distributed under the terms and conditions of the Creative Commons Attribution (CC BY) license (https://creativecommons.org/licenses/by/4.0/).
Share and Cite
Martínez, D.N.; Díaz-Álvarez, E.A.; de la Barrera, E. Selecting Biomonitors of Atmospheric Nitrogen Deposition: Guidelines for Practitioners and Decision Makers. Nitrogen 2021, 2, 308-320. https://0-doi-org.brum.beds.ac.uk/10.3390/nitrogen2030021
Martínez DN, Díaz-Álvarez EA, de la Barrera E. Selecting Biomonitors of Atmospheric Nitrogen Deposition: Guidelines for Practitioners and Decision Makers. Nitrogen. 2021; 2(3):308-320. https://0-doi-org.brum.beds.ac.uk/10.3390/nitrogen2030021
Chicago/Turabian StyleMartínez, D. Nayeli, Edison A. Díaz-Álvarez, and Erick de la Barrera. 2021. "Selecting Biomonitors of Atmospheric Nitrogen Deposition: Guidelines for Practitioners and Decision Makers" Nitrogen 2, no. 3: 308-320. https://0-doi-org.brum.beds.ac.uk/10.3390/nitrogen2030021