Article

Simulating Increased Permafrost Peatland Plant Productivity in Response to Belowground Fertilisation Using the JULES Land Surface Model

1
Global Systems Institute, University of Exeter, Exeter EX4 4QE, UK
2
Department of Mathematics, University of Exeter, Exeter EX4 4QE, UK
3
BioEcoAgro Joint Research Unit, French National Institute for Agriculture, Food, and Environment (INRAE), F-02000 Barenton-Bugny, France
4
Met Office Hadley Centre, Exeter EX1 3PB, UK
*
Author to whom correspondence should be addressed.
Nitrogen 2022, 3(2), 260-283; https://doi.org/10.3390/nitrogen3020018
Submission received: 8 March 2022 / Revised: 16 April 2022 / Accepted: 22 April 2022 / Published: 5 May 2022
(This article belongs to the Special Issue Nitrogen Cycling in Permafrost Soils)

Abstract

:
Several experimental studies have shown that climate-warming-induced permafrost thaw releases previously unavailable nitrogen which can lower nitrogen limitation, increase plant productivity, and counteract some of the carbon released from thawing permafrost. The net effect of this belowground fertilisation effect remains debated and is yet to be included in Earth System models. Here, we included the impact of thaw-related nitrogen fertilisation on vegetation in the Joint UK Land Environment Simulator (JULES) land surface model for the first time. We evaluated its ability to replicate a three-year belowground fertilisation experiment in which JULES was generally able to simulate belowground fertilisation in accordance with the observations. We also ran simulations under future climate to investigate how belowground nitrogen fertilisation affects the carbon cycle. These simulations indicate an increase in plant-available inorganic nitrogen at the thaw front by the end of the century with only the productivity of deep-rooting plants increasing in response. This suggests that deep-rooting species will have a competitive advantage under future climate warming. Our results also illustrate the capacity to simulate belowground nitrogen fertilisation at the thaw front in a global land surface model, leading towards a more complete representation of coupled carbon and nitrogen dynamics in the northern high latitudes.

1. Introduction

Over recent decades, both the atmosphere and oceans have warmed, sea level has risen, snow cover and ice sheets have diminished, all whilst the atmospheric concentration of greenhouse gases have continued to increase [1]. Although changes have been observed globally, it is mostly agreed that northern high latitude and alpine regions are amongst the most vulnerable to climate change—currently warming at 0.6 °C per decade; over twice as fast as the global average [1,2,3,4]. Such regions hold a large portion of global organic carbon with approximately twice as much carbon being stored in frozen Arctic soil or permafrost as is currently in the atmosphere [5,6,7,8]. There is the potential for this carbon to be released into the atmosphere as greenhouse gases under permafrost thaw, creating a positive feedback loop onto climate [6,9,10,11,12].
There are an increasing number of both modelling and experimental studies which are beginning to explore the impact of an interactive nitrogen (N) cycle on the permafrost carbon feedback (for example, [13,14,15,16]). Generally, Arctic vegetation is strongly nitrogen-limited due to the supply of available soil mineral N being lower than the demands of the plant, reducing net primary productivity (NPP) [17,18,19,20]. However, with rising temperatures, there is increased ‘greenness’ around the circumpolar Arctic [21,22], which is likely a result of increased biomass [21], changes in plant community composition [21,23,24,25,26], and changing plant phenology [21,27,28]. Although there are reports of background increases in tundra vegetation [21,25,29,30,31], Arctic shrub expansion is widely reported throughout the literature [21,22,32], with shrub species, such as birch, willow, and alder increasing in abundance, cover and height across the region [22]. Increases in shrub abundance can be attributed to various processes, such as rising temperatures, permafrost thaw, tundra fires, anthropogenic activity, etc. [22]. Rising temperatures can promote shrub growth either directly through physiological processes or indirectly by enhancing soil microbial activity such as increased nitrogen mineralisation which supplies nutrients for shrub uptake [22]. Arctic amplification of shrubs and other Arctic tundra also varies between species. For example, taller shrub species have been observed to have greater nitrogen availability and faster nitrogen cycling compared to shorter, low shrubs [22,32,33]. Whilst shrubs that are able to grow in cover or height can restrict the growth of other species by limiting light [22,34], suggesting some species may have a competitive advantage under further future warming. The interactions between this enhanced vegetation growth and the availability of mineral nitrogen is uncertain and will impact the magnitude and timing of the permafrost carbon feedback [6,13].
Recent experimental studies at selected sites suggest that nitrogen at depth in the soil (organic and inorganic), previously unavailable to plants due to its frozen state, could be made accessible by warming-induced permafrost thaw and reduce plant nitrogen limitation in the future [13,14,15,35,36,37,38,39,40]. Furthermore, there is evidence that future warming may result in an increased abundance of Arctic plant roots with depth, further increasing plant uptake of previously unavailable nutrients [40,41,42,43,44]. For example, certain shrub species such as the dwarf birch Betula nana is able to take advantage of increased temperatures and subsequent thaw depth, by rapidly elongating its short shoots [22]. This suggests that increased nitrogen availability could reduce or even outpace nitrogen demand of Arctic vegetation and hence nitrogen limitation [36].
In this study, we run a version of the JULES land surface model for an experimental site in Abisko, Sweden, where near-surface and thaw-front nitrogen addition experiments were conducted, to evaluate the ability of JULES to simulate the response of plants to increased mineral nitrogen availability within the soil. In addition, we ran simulations driven by the projected changes in climate in the future to quantify the potential impact of permafrost thawing on the mineral nitrogen and the subsequent response of vegetation carbon in plausible future climates.

2. Methods

2.1. Site Description

The site is situated at the Stordalen ombrotrophic peat mire in northern Sweden (68°21.4280 N, 19°03.1810 E, 351 m.a.s.l.). The site lies within the zone of discontinuous permafrost, but permafrost degradation over recent decades has left the area being more characteristic of the sporadic permafrost zone [45]. At the lower elevations, permafrost typically only occurs in the elevated palsas within the peat mires with wet and non-permafrost depressions covering much of the mire [45,46]. The elevated palsas are usually covered by mosses, lichens, sedges, and dwarf shrub [40,47]. Maximum thaw depth in the palsas is typically 45–50 cm [40] with the volume of soil accessible to plant roots increasing over the course of the growing season. Peat thickness can be up to 3 m. Mean annual temperature has been increasing over recent decades and has fluctuated around 0 °C since the 1990’s [48]. As a result, permafrost thaw and vegetation shifts have occurred in some areas, replacing palsa with bogs or fens [47,49]. For a more detailed description of observations and changes in Abisko, see [46].
We used data from a belowground nitrogen fertilisation experiment that [40] carried out at Stordalen to identify the potential impact of increased nitrogen availability at the permafrost thaw front on subarctic peatland vascular-plant production and species performance. Table 1 summarises the observed characteristics of the two main vegetation types at the site. Table 1 shows that only Rubus chamaemorus (Cloudberry) has roots present at the 45-cm thaw front. Roots of the other species (mainly E. hermaphroditum, or Mountain Crowberry) were confined to the upper 25 cm of the soil.
Slow-release nitrogen fertiliser grains were added at two different depths within the soil (at 10 cm depth denoted near-surface and at 45 cm depth denoted thaw-front) through an aluminium tube in grids of nine points, which was then monitored by [35] over a three-year period. This was done in randomly selected plots of 60 × 60 cm dominated by E. hermaphroditum and R. chamaemorus (78% and 12% of total biomass, respectively, Table 1). Fertiliser grains work through adding nutrients to the soil by naturally breaking down and decomposing due to moisture and temperature at a steady rate. Grains consisted of a nitrogen:phosphorus:potassium ratio of 17:3:11, respectively, with the 17% nitrogen consisting of 8.9% NH 4 -N and 8.1% NO 3 -N. Fertiliser was applied to give four different treatments: near-surface fertilisation ( N N e a r S u r f a c e + ), thaw-front fertilisation ( N T h a w F r o n t + ), both near-surface and thaw-front fertilisation ( N B o t h + ), and a control simulation with no fertilisation ( C o n t r o l ). The authors of [35] found that the three-year fertilisation resulted in increased plant biomass and increased plant nitrogen content. Although all species responded to near-surface fertilisation ( N N e a r S u r f a c e + ), only the deep-rooting species responded to the fertilisation at the thaw-front ( N T h a w F r o n t + ). Here, we evaluate the ability of JULES to represent this response of vegetation to application of nitrogen fertiliser both near the surface, at the thaw front, and at both depths.

2.2. Model Description

JULES forms the land-surface component of the UK Earth System Model (UKESM, [50]) and can be run either in a coupled mode, or offline using observed meteorology, at point, regional or global scales [51,52,53]. The model simulates fluxes of energy, water, carbon, and nitrogen. It has a dynamic vegetation model, namely, the Top-down Representation of Interactive Foliage and Flora Including Dynamics (TRIFFID) where different plant functional types (PFTs) compete for space based on their height [54].
Recent developments within JULES include the addition of a terrestrial nitrogen cycle which has a representation of all of the key terrestrial nitrogen processes. This closely follows the structure of the carbon cycle [53]. Nitrogen inputs to the land surface are via biological fixation, fertilisation, and nitrogen deposition, with losses from the land surface via leaching and gas loss. JULES simulates a nitrogen-limited ecosystem by reducing the NPP if there is insufficient available nitrogen. Any excess carbon is assumed to be lost from the system.
The soil biogeochemistry is represented using the standard four-pool RothC soil carbon model [52] in which the total litter carbon flux (taken as a sum from leaves, roots, and stem) is split into either a decomposable plant material (DPM) pool or resistant plant material (RPM) pool according to an approximated fraction defined for each vegetation type within the model. These pools then feed into microbial biomass (BIO) and humus (HUM) pools via decomposition. For each soil carbon pool, there is an equivalent soil nitrogen pool [53]. Additionally, [55] added a representation of the vertical distribution of soil carbon with each of the pools represented in each of the soil layers. This model was extended by [53] who additionally included a vertical representation of organic and inorganic nitrogen.
Nitrogen is transferred between the organic and inorganic pools depending on the respiration and the carbon-nitrogen ratio (C:N) of the organic pool. For each soil layer, the inorganic nitrogen pool ( N i n ( z ) in kg[N] m 2 ) is the balance of biological nitrogen fixation (first term in Equation (1)), plant nitrogen uptake (second term in Equation (1)), net mineralisation ( M n e t ( z ) in kg[N] m 2 s 1 ), external inputs via deposition and fertilisation ( N a d d ( z ) in kg[N] m 2 s 1 ) transfer of dissolved inorganic N between layers ( N f l u x ( z ) in kg[N] m 2 s 1 ), and gaseous emission ( N g a s I ( z ) in kg[N] m 2 s 1 ). This is represented by the following equation:
d N i n ( z ) d t = i v i B N F i f R , i ( z ) i v i Φ i f I , i ( z ) + M n e t ( z ) + N a d d ( z ) N f l u x ( z ) N g a s I ( z )
where v i is the PFT fraction for PFT i and B N F i is the biological nitrogen fixation for PFT i in kg[N] m 2 s 1 . The inputs from biological nitrogen fixation for PFT i are distributed vertically according to the normalised fraction of roots in each soil layer ( f R , i ( z ) ) described below and shown in Equation (2). Φ i is the plant nitrogen uptake for PFT i in kg[N] m 2 s 1 , f I , i ( z ) is the fraction of available inorganic nitrogen in each soil layer for PFT i. This is dependent on both the rooting depth and the active layer depth of the soil (depth to which the soil is thawed, therefore greater than 0 °C) and described by Equations (3) and (4).
The normalised root distribution ( f R , i ( z ) ) in the first term of Equation (1) is given by:
f R , i ( z ) = f r o o t , i ( z ) 0 z m a x f r o o t , i ( z ) d z
where z m a x is the maximum soil depth.
The plant uptake term in Equation (1) ( i v i Φ i f I , i ( z ) ) limits the ability of the plants to access the inorganic nitrogen. First, we assume that if a soil layer is outside the active layer depth and therefore frozen, then plants cannot uptake any of the inorganic nitrogen in that layer. Secondly, plants can only have direct access to a certain fraction of the soil, according to their root fraction, f r o o t , i ( z ) . Therefore, for each PFT i and for each soil layer, we define an ‘available’ inorganic nitrogen pool which is a fraction of the total inorganic nitrogen pool in that layer ( N i n ( z ) ) that could potentially be extracted by the vegetation. At equilibrium, this is defined by:
N a v a i l , i ( z ) = f r o o t , i ( z ) N i n ( z ) T ( z )
where T ( z ) = 0 when the soil temperature in the layer is less than 0 °C (depth is outside active layer and so no N a v a i l for the soil layer, z) and T ( z ) = 1 otherwise. Nitrogen is taken up from this available pool around the roots, and over time, this available pool will be refilled. Any biological nitrogen fixation goes directly into the available pool, and other fluxes are simply added according to the ratio of the available to total inorganic nitrogen pools at equilibrium (thus, the available pool would always follow Equation (3) were it not for the fixation and uptake by plants). Plant uptake is extracted entirely from the available nitrogen pool. The proportion of available N that is taken up by the plant is given by:
f I , i ( z ) = N a v a i l , i ( z ) 0 z m a x N a v a i l , i ( z ) d z
This is similar to the distribution of roots in the soil (Equation (2)). The prescribed nitrogen addition term, N a d d ( z ) was modified to allow extra inorganic nitrogen to be added either to the surface as deposition or at any given depth within the soil. This enables fertiliser to be added directly into the soil profile.
In this version of JULES, the rooting profiles ( f R , i ) of Arctic shrub PFTs were re-parameterised to be consistent with the specific field site data. The standard root distribution in JULES reduces exponentially with depth (and consequently never reaches zero). The new parameterisation is a linear distribution with a cut-off at the maximum rooting depth ( R m a x , i ) which is a function of PFT (i). This was done in order to ensure that there was an imposed maximum value of the rooting depth and no roots present at depths greater than this:
f r o o t , i ( z ) = 1 z R m a x , i z < R m a x , i 0 z R m a x , i
where f r o o t , i ( z ) (dimensionless) is the volumetric root fraction of PFT i at a given soil level and R m a x , i is a prescribed parameter defining the maximum rooting depth of each PFT i. Consequently, f r o o t , i ( z ) is 1 at the soil surface and zero at R m a x , i .
The consequences of this modelling framework means that any inorganic nitrogen below the maximum summer thaw depth is not available for plant uptake because it is assumed plants cannot access any inorganic nitrogen in frozen soils. In addition, the plants cannot access any inorganic nitrogen below the maximum rooting depth.
Described below is the JULES setup used to simulate the fertilisation experiments conducted by [40] at Abisko and to make projections of the response of the vegetation in a changing climate. This configuration of JULES includes both the vertically resolved soil carbon and nitrogen cycle described above.

2.3. Model Configuration

A high-latitude (or Arctic) shrub C 3 PFT was defined to better represent the vegetation found in the Abisko region (see Table A1 for more details of the modified parameters). In particular, the Arctic C 3 PFT has an optimum temperature range for photosynthesis which makes it more productive in the northern high latitudes. This was the only vegetation type that was allowed to grow in any specific simulation, all of the other PFTs were suppressed to small constant fractions by setting very high disturbance rates. This meant we could analyse the effects of belowground fertilisation on the high-latitude C 3 PFT without complexities such as competition and allowed a more direct comparison to study of [40].
In addition, both the C:N ratio of the vegetation and the maximum rooting depths were changed to more accurately match the observations of the two key species at the site: E. hermaphroditum is a shallow-rooted plant with a high C:N ratio and R. chamaemorus is a deep-rooted plant with a lower C:N ratio (Table 1, [40]). These were parameterised separately in JULES by representing E. hermaphroditum using a shallow rooting depth of 25 cm and modifying the nitrogen concentration in the vegetation to give a whole plant C:N ratio of approximately 60 (see Table A2, column C N h i g h R o o t 25 ). R. chamaemorus was parameterised using a deep rooting depth of 60 cm and modifying the nitrogen concentration in the vegetation. This gives a C:N ratio of approximately 15 (see Table A2, column C N l o w R o o t 60 ). This root depth is slightly deeper than that observed for R. chamaemorus, but our simulations of the maximum summer thaw depth are deeper than that observed by [40]; so, the separation between the maximum root depth and the maximum summer thaw depth is similar in both cases.
Two different sets of JULES runs were carried out where only one type of vegetation was allowed to grow in each set of JULES runs. These simulations evolve their individual soil carbon and nitrogen distributions which are very different between C N h i g h R o o t 25 and C N l o w R o o t 60 . To facilitate comparison with the site observations, an additional set of model runs ( P F T c o m p e t e ) was carried out where both vegetation types were present and allowed to compete for space. In this case, the soil carbon and nitrogen are the same for each vegetation type as would happen in reality.

2.4. Model Setup

The meteorological driving data for the historical period were prepared using observations from the site combined with Water and Global Change forcing data (WFD: [56], 1958–2001) and WATCH-ForcingData-ERA-Interim (WFDEI: [57], 1979–2012) reanalysis data for the grid cell containing the site [45]. The WFDEI data were corrected to match the observations for the overlapping time periods, and then, the WFD was corrected to match the WFDEI. This results in a continuous time series of 3-hourly meteorological data from 1901 to 2016. Meteorological observations from the Abisko Research Station were used for correction. However, the air temperature was reduced by 1 °C to account for the differences between the mire and the Research Station [45]. Calculations from the air temperatures used in the driving data give 525 growing degree days above 5 °C, an index of plant growth. Snowfall is highly uncertain—here, we estimated the observed snowfall from the observed snow depth by treating any increase in depth as a snowfall event with an assumed snow density [45]. The snow depth at the Research Station is only available every 5-days, meaning there could be compaction of the snow between readings. In addition, this site is a relatively warm permafrost site with potential for melt events during winter; therefore, a relatively high density of 240 kg m 3 was assumed. The snow depth at the Research Station differs from that at the mire; so, we included an additional correction by scaling the snowfall according to the ratio of monthly snow depths at the mire compared with the Research Station [45]. All the other meteorological observations were taken directly from the Research Station data.
Vertically resolved soil thermal and hydraulic properties for JULES were derived from the measured profiles of soil carbon and bulk density. Firstly, the volumetric fraction of organic matter in the soil was estimated using carbon content, and secondly, organic and mineral soil properties were combined as described in [58]. The texture of the mineral component of the soil in the mire was assumed to be silt. JULES was set up to have 14 soil layers increasing in thickness from the surface to a maximum soil depth of 3 m (thickness of layer n = 0.05 n 0.75 ).

2.5. Present-Day Fertilisation Experiments

To evaluate the ability of JULES to reproduce belowground fertilisation observations, we replicated the three-year belowground fertilisation experiments conducted by [40]. JULES was initially spun up for 10,000 years by repeating the forcing data from 1901–1921. The model was then run for the period 1901–2016 for a control ( C o n t r o l ) simulation.
During the field experiment, [40] added slow-release nitrogen fertiliser equivalent to 8 g[N] m 2 at a depth of 45 cm in September 2007, to mimic increased nitrogen-availability at the thaw-front as a result of permafrost thaw. This deep fertiliser then froze and became available to the plant roots about half way through the subsequent growing season in mid 2008. A similar amount was added at a depth of 10 cm in June 2008 to represent increased nitrogen mineralisation in response to climate warming. The impact of the slow-release fertiliser on plant biomass was measured after three years. The slow release fertilisation was prescribed as a constant input to JULES of 0.0073 g[N] m 2 day 1 for the three growing seasons. This is equivalent to approximately 2.67 g[N] m 2 year 1 . The N N e a r S u r f a c e + simulation had fertiliser added near the surface at 10 cm, whilst N T h a w D e p t h + had fertiliser added near to the thaw-front at 47.3 cm, and N B o t h + (not shown) had fertiliser added at both 10 cm and 47.3 cm. All fertilisers were added at the same time as during the [40] experiment. In each simulation, including C o n t r o l , nitrogen deposition is also added to the top layer of the soil based on external input taken from an ACCMIP multi-model dataset interpolated to annual fields [53,59]. These present day simulations were used to evaluate the ability of the vegetation in JULES to respond to the nitrogen addition for the C N h i g h R o o t 25 and C N l o w R o o t 60 vegetation types and when both types of vegetation are present ( P F T c o m p e t e ).

2.6. Future Simulations

In order to explore the response of the vegetation to changing inorganic nitrogen availability under future climate change, simulations for the period up to 2100 were carried out under the ‘high emissions’ RCP8.5 scenario. Monthly climate anomalies/scale factors from CCSM4 were applied on top of repeating meteorological data for the period 2001–2010 [58,60]. These provide driving data for one potential future with a change in the mean climatology, but no change in the climate variability which may well further impact the plant response.
The control runs ( C o n t r o l ) were continued until the end of the century for C N h i g h R o o t 25 and C N l o w R o o t 60 and the response of the vegetation quantified. There is growing evidence that permafrost thaw and subsequent new nitrogen additions can cause increased root length and growth deeper into the active layer [43]. Within JULES, roots are unable to grow in simulations; therefore, by running further sets of C o n t r o l simulations with deeper prescribed maximum rooting depths, we were able to explore the impact of these deeper roots on the vegetation growth. It was assumed that the shallow rooting species ( C N h i g h R o o t 25 ) could increase its maximum rooting depth to 60 cm or approximately the depth of the deep-rooting species already present at the site ( C N h i g h R o o t 60 ). It was assumed that the deeper rooting depth ( C N l o w R o o t 60 ) could increase its roots to 90 cm, or about 30 cm above the maximum summer thaw depth at the end of the century ( C N l o w R o o t 90 ). This was done by changing the volumetric fraction of roots in each layer.
The simulations carried out during this study are summarised below in Table 2.

3. Results

3.1. Evaluation of Control Simulations

The model physics has previously been evaluated at Storflaket and Stordalen peat mire by [45,58]. This is also summarised in Figure 1 for the C o n t r o l simulation of P F T c o m p e t e which shows the simulated snow depth, soil temperature, and active layer compared with the observations. The model matches the soil temperature observations well but has a small warm bias in soil temperature during the winter. There is a general agreement between the observed and modelled snow depth. The mean simulated maximum summer thaw depth between 2006 and 2014 is 64 cm which falls well within the range of observational uncertainty at Storflaket. However, this is slightly deeper than the active layer at the experimental site described in [40]. C N h i g h R o o t 25 and C N l o w R o o t 60 simulations (not shown) have some very minor differences in these physical variables mainly caused by differences in the canopy height and evapotranspiration. For example, the mean maximum summer thaw depth ranges from 60 cm for C N l o w R o o t 60 to 65 cm for C N h i g h R o o t 25 .
The most realistic simulation of this specific field site is expected to be the P F T c o m p e t e simulation which allows both the shallow and deep-rooted vegetation to co-exist. The competition in P F T c o m p e t e means that C N l o w R o o t 60 covers about 40% of the grid cell and C N h i g h R o o t 25 covers about 55% of the grid cell with the rest bare soil. This means that the P F T c o m p e t e simulation contains more of C N l o w R o o t 60 vegetation when compared with the observations (12% and 78% observed for C N l o w R o o t 60 and C N h i g h R o o t 25 , respectively, with no bare soil). In addition, there is Sphagnum fuscum moss at the observation site, which is not currently represented in JULES. The C N l o w R o o t 60 and C N h i g h R o o t 25 simulations, with only one type of vegetation present, have approximately 80% vegetation cover and 20% bare soil.
The soil carbon profiles and the gross primary productivity (GPP) are shown in Figure 2 for the three different configurations, i.e., P F T c o m p e t e , C N h i g h R o o t 25 , and C N l o w R o o t 60 . The GPP is compared with the estimate from the FLUXNET2015 [61] dataset for Stordalen Mire and the soil carbon compared with the observational data used by [45]. The GPP for P F T c o m p e t e where both vegetation types are present compares well with these observations. This appears to be a combination of the lower GPP associated with C N h i g h R o o t 25 and the higher GPP associated with C N l o w R o o t 60 . The simulated amount of soil carbon in Figure 2 is too small and the profile of soil carbon is more representative of a mineral soil with some organic matter—high soil carbon at the surface decreasing with depth. However, Stordalen Mire has a peat soil, a representation of which is currently under development for JULES [62]. The soil C:N ratios are significantly impacted by the vegetation type through the quality of the litter with the C N h i g h R o o t 25 having a value of 50 and C N l o w R o o t 60 a value of 24. P F T c o m p e t e has a value of 29 which is very near the value prescribed in JULES for the biomass and hummus pools.
The vertical profile of total inorganic nitrogen for C N l o w R o o t 60 shown in Figure 3 has much less inorganic nitrogen than C N h i g h R o o t 25 with the peak amount nearer the surface of the soil. The shape of the P F T c o m p e t e profile is more similar to C N h i g h R o o t 25 . In all cases, the amount of inorganic nitrogen peaks around or just below the top of the permafrost table, which matches with observations, for example, as seen in [35].
Figure 4a(i),b(i) shows the seasonal cycle of the available inorganic nitrogen for C o n t r o l . As suggested by Figure 3 and by the fact that in C N h i g h R o o t 25 the roots only go down to 25 cm, there is more available inorganic nitrogen in C N l o w R o o t 60 . Interestingly, in the C N h i g h R o o t 25 C o n t r o l simulation, the available inorganic nitrogen gets used up very early during the growing season, and there is very little available later in the summer.

3.2. Impact of Nitrogen Addition on Vegetation

The impact of the nitrogen addition to the soil (either just below the surface; at the thaw front; or at both depths) on the plant-available inorganic nitrogen is shown in Figure 4. Simulations for C N h i g h R o o t 25 with the shallow rooting depths had a large increase in plant-available inorganic nitrogen near the surface of the soil in response to N N e a r S u r f a c e + compared to the C o n t r o l , whilst the soil nitrogen fertilisation at the thaw front had no effect (Figure 4a, top two rows). Simulations with the deep-rooting vegetation ( C N l o w R o o t 60 ) showed an increase in plant-available inorganic nitrogen for all nitrogen fertilisation scenarios when compared to the C o n t r o l . However, this increase continues later in the growing season when fertiliser was applied at the thaw front compared with when fertiliser was applied to the near surface of the soil (Figure 4b, bottom two rows). Furthermore, for both deep- and shallow-rooting species, the simulations with the nitrogen added at both the near surface of the soil and at the thaw front ( N b o t h + ) are approximately the sum of the two corresponding individual experiments.
Figure 5 shows the NPP of the different experiments. The NPP of C o n t r o l (no added nitrogen fertilisation) shows the deep-rooting species are slightly more productive than the shallow-rooting species reaching a maximum of around 2 gm 2 per day as opposed to around 1 gm 2 for the species with shallow roots. The simulated impact of the nitrogen fertiliser addition on NPP is also shown in Figure 5 for C N h i g h R o o t 25 and C N l o w R o o t 60 . N P P p o t represents the potential amount of NPP if there was sufficient plant-available nitrogen. Only shallow-rooting species ( C N h i g h R o o t 25 ), where nitrogen was added near the soil surface, achieve their potential NPP. In fact, they have a higher NPP than the C o n t r o l simulation because the fertilisation has enabled the plants to spread into previously bare soil. Nitrogen addition at the thaw front has no impact on the NPP for C N h i g h R o o t 25 because the maximum rooting depth of these plants is less than the depth at which the thaw-front nitrogen fertiliser is applied. In the case of the deep-rooting species, the near surface addition of nitrogen gives an initial increase in NPP at the start of the growing season, but the additional nitrogen is quickly used up and the NPP returns to the same rate as in the C o n t r o l experiment from June onward. Once the thaw depth of the soil becomes deep enough for the plants to access any nitrogen added to the thaw front, there is also an increase in NPP. This occurs between July and September. In the N B o t h + experiment, both effects occur. This is in line with the observed additive nature in the full-factorial experimental setup by [40], i.e., there were minimal interaction effects.
The degree of nitrogen limitation can be quantified by the response ratio which is the ratio of the potential amount of carbon that can be allocated to growth and spreading of the vegetation ( N P P p o t ) compared with the actual amount achieved in the natural state. A response ratio of greater than 1 means that adding extra nitrogen to the system will enhance the NPP achieved, in other words, the site is nitrogen-limited. The response ratio is shown in Table 3 and as suggested above, there is no nitrogen limitation for the shallow-rooting species when nitrogen is added to the near surface (either N N e a r S u r f a c e + or N B o t h + ). The deep-rooting species has the potential to be over twice as productive but also much more nitrogen-limited (Table 3).
The NPP was not measured by [40], but they presented the impact of the N addition on the vegetation biomass. In the C o n t r o l plots, the aboveground biomass was ∼8 gm 2 for R. chamaemorus and ∼55 gm 2 for E. hermaphroditum. JULES simulated much higher biomass for C N l o w R o o t 60 (the equivalent of R. chamaemorus) at ∼95 gm 2 and fairly similar values (∼77 gm 2 ) for C N h i g h R o o t 25 (the equivalent of E. hermaphroditum). One reason for this difference may be that JULES assumes that the root carbon is the same as the leaf carbon. However, [40] suggested that the root biomass is much higher than the aboveground biomass—between 254 and 403 gm 2 for R. chamaemorus and 53 and 200 gm 2 for E. hermaphroditum.
Figure 6 shows that impact of fertilisation on the aboveground biomass after the nitrogen addition. In all cases, as might be expected, there is an increase in aboveground biomass. Near surface fertilisation (shown in red) causes an increase in biomass for C N h i g h R o o t 25 which is approximately twice that compared with C N l o w R o o t 60 . This is fairly well aligned with the observations, although the observed response of E. hermaphroditum to near-surface fertilisation is smaller than the response of C N h i g h R o o t 25 in JULES. C N h i g h R o o t 25 has a very small response (<1 gm 2 ) to thaw-front fertilisation both in JULES and in its equivalent observations for E. hermaphroditum. C N l o w R o o t 60 responds more to thaw-front fertilisation, increasing by over 9 gm 2 although this response in the model is less than observed for R. chamaemorus and less than that for the equivalent near-surface fertilisation. This is likely because the linearly decreasing profile of the root distribution prescribed in the model is not an accurate representation of the root profile of the deep-rooting species R. chamaemorus which was found to be relatively evenly distributed over the soil profile in [40]. Another possible cause of the differences is that addition of inorganic nitrogen to the thaw front only increased NPP beyond the control for one month (August) in the simulation, whilst, in reality, we would expect to observe longer impacts. Responses of both C N l o w R o o t 60 and C N h i g h R o o t 25 show approximately additive behaviour with both near-surface and thaw-front fertilisation scenario (purple bars Figure 6) very similar to the near-surface and thaw-front fertilisation combined. This is comparable to the response of NPP in Figure 5.

3.3. Future Simulations

Future simulations under an RCP8.5 scenario show an increase in the 1.5-m air temperature of 4.8 °C between 2000–2010 and 2090–2100. This will also lead to an increase in the growing season. The annual mean snow depth reduces from around 3 cm to 1 cm in the same time period. Figure 7 shows the 10-year average seasonal cycle of the thawed soil (outlined in grey). The maximum summer thaw depth increases from around 60 cm in 2000–2010 to over 1.2 m in 2090–2100. There is also an increase in the duration of the thaw with a talik forming at about 1 m depth in the soil, in some simulations.
Figure 7 also shows the plant-available inorganic nitrogen. This does not change very much in the future for C N h i g h R o o t 25 . The roots only access the top 25 cm of the soil, and use most of the available inorganic N at the beginning of the growing season. Therefore, the increase in temperature has a fairly small impact on the plant-available nitrogen. However, if the plants adapt by increasing their rooting depth down to the thaw front, there is much more plant-available nitrogen which is available for the majority of the growing season. The response is qualitatively similar for the deep-rooting species ( C N l o w R o o t 60 ), but there is a lot more plant-available nitrogen in the soil both near the surface and deeper in the soil near the thaw front.
An estimate of the annual mean change (between 2090–2100 and 2000–2010) in plant-available nitrogen in the soil column is shown in Table 4. For the left-hand column, this was calculated outside JULES from the monthly mean profiles of soil temperature (future), total inorganic nitrogen (present), and rooting depth using Equation (4). The table separates the impact of the future changes in thaw depth with the 2 columns on the left derived using the present-day total inorganic nitrogen and the two columns on the right derived using the future total inorganic nitrogen. Results are shown for both the original species and the adapted species with deeper roots. The increased thaw depth has little impact on the plant-available N for the shallow-rooting species irrespective of changes in the nitrogen cycling. The plant-available inorganic nitrogen for the deep-rooting species ( C N l o w R o o t 60 ) increases slightly in the future to around 1.6–1.8 g[N] m 2 year 1 again irrespective of changes in the nitrogen cycling. For comparison purposes, the amount added by [40] at one specific depth was equivalent to 2.7 g[N] m 2 year 1 . However, if the plants increased their rooting depth, they have access to a larger pool of plant-available nitrogen. In particular, the 30-cm-prescribed increase in roots for C N l o w R o o t 60 gives plentiful access to inorganic nitrogen.
Figure 8 shows that plant productivity depends on the depth of the rooting profiles and the C:N ratio of the vegetation. The left-hand column in Figure 8 shows the seasonal cycle of the NPP for the present day compared with the the future and no adaptation of roots. For the deep-rooting species, C N l o w R o o t 60 , there is some increase in NPP in the future but the plants remain nitrogen-limited. However, for the shallow-rooting species, C N h i g h R o o t 25 , there is only a very small increase in NPP in the future although the plants also remain nitrogen-limited. As might be expected with warmer temperatures, the future projections of NPP and potential NPP show that there is a longer growing season. This is particularly visible at the start of the growing season. The right-hand column shows the NPP in the future for plants with the same characteristics but deeper roots. These are compared with the C N l o w R o o t 60 and C N h i g h R o o t 25 present-day simulations. These vegetation types with deeper roots show a marked increase in productivity in the future when the roots can access the mineral nitrogen deeper in the soil, and they are no longer nitrogen-limited. Despite the large amount of extra inorganic nitrogen available in these simulations, C N l o w R o o t 60 is still nitrogen-limited in the future. This is likely because the additional nitrogen becomes available near the end of the growing season (Table 4 and Figure 7).
The increasing temperature, increasing CO 2 concentration, increasing plant-available nitrogen leads to an increase in productivity and therefore in total vegetation carbon. Figure 9 shows the increase in aboveground biomass is ∼22% from present-day to the end of the century for both species. If the vegetation is allowed to adapt in the future and increase its root depth, the increase in aboveground biomass from present is 30% for the low C:N species with the deep roots and 38% for the high C:N species with the shallow roots. Therefore, it is more beneficial for C N h i g h R o o t 25 to increase its roots and create more plant-available inorganic nitrogen, even though it is less nitrogen-limited in the present day than C N l o w R o o t 60 (Table 3). The increase in aboveground biomass will lead to more litter fall and replenish the nutrients at the soil surface. In each of the simulations discussed in this section, there is only one species present. However, if the species co-existed, the nutrients released at the thaw front may well become available to the shallow-rooting species via the increase in litter fall and the deep-rooting species act as a nutrient pump.

4. Discussion

It has been shown that subarctic permafrost peatlands contain large amounts of plant-available nitrogen which may be released upon future thawing [13,35]. Such change in nutrient availability will impact (usually nitrogen-limited) vegetation by altering composition, productivity, and biomass [
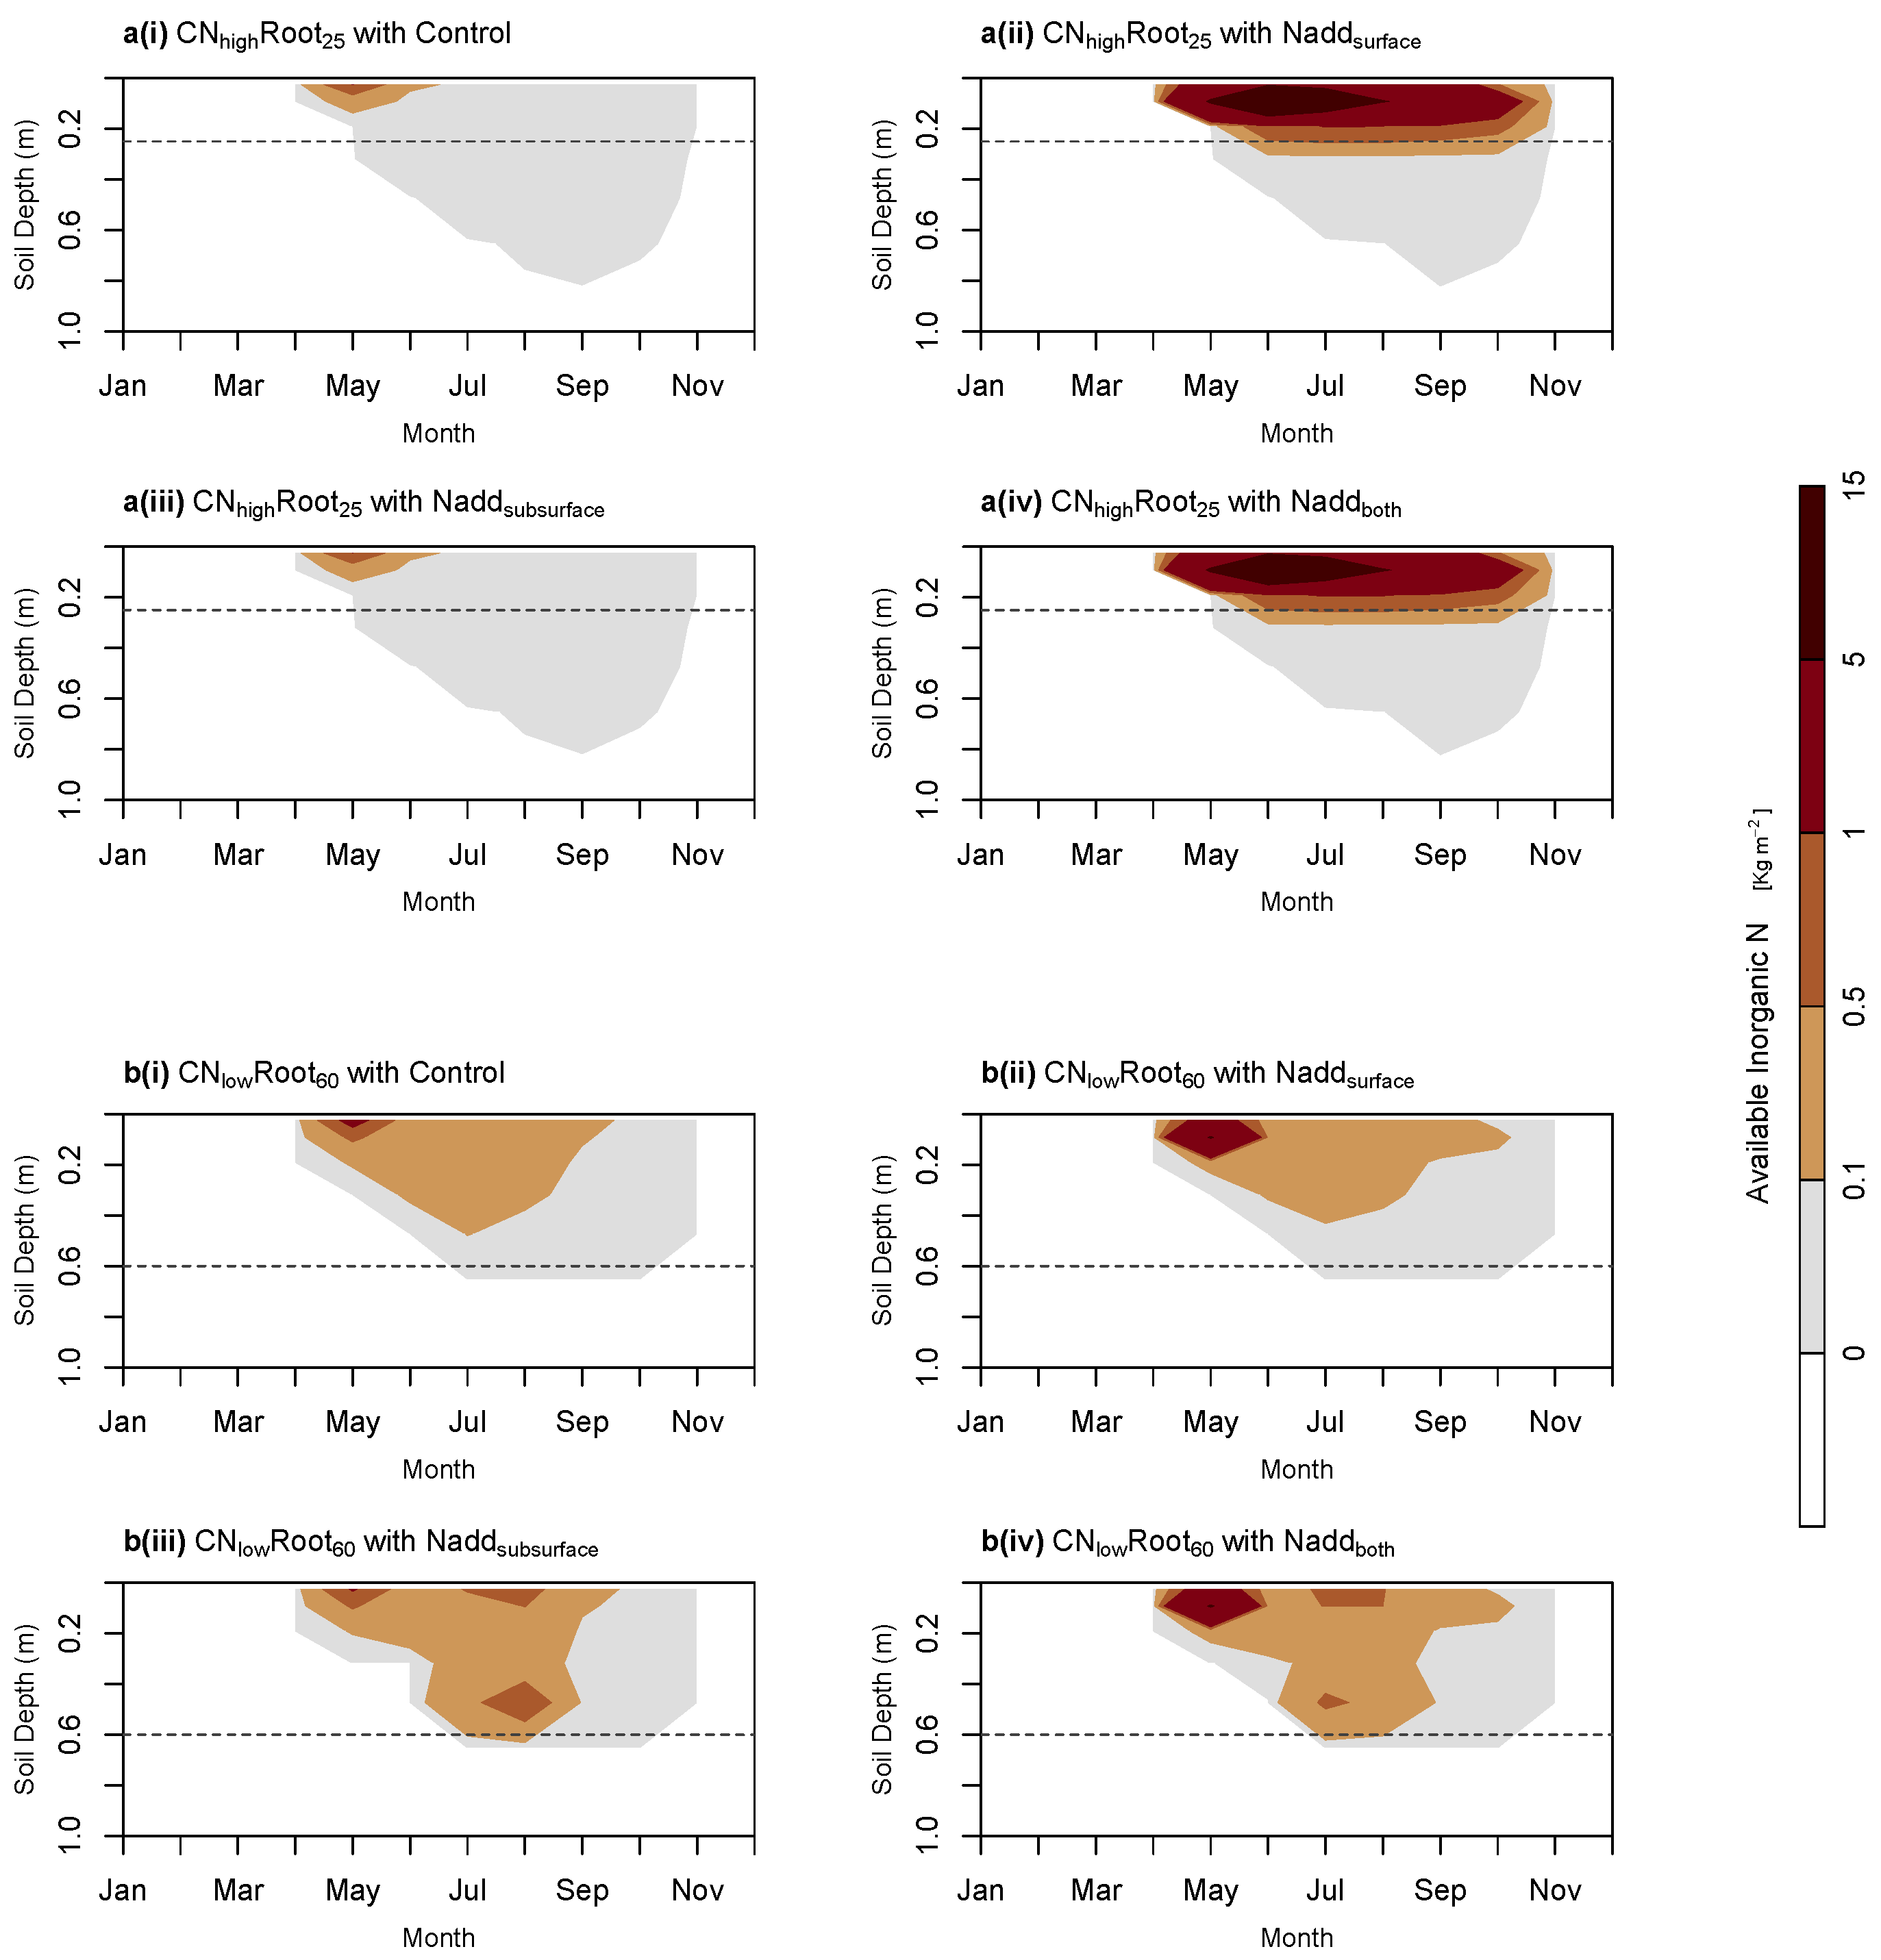
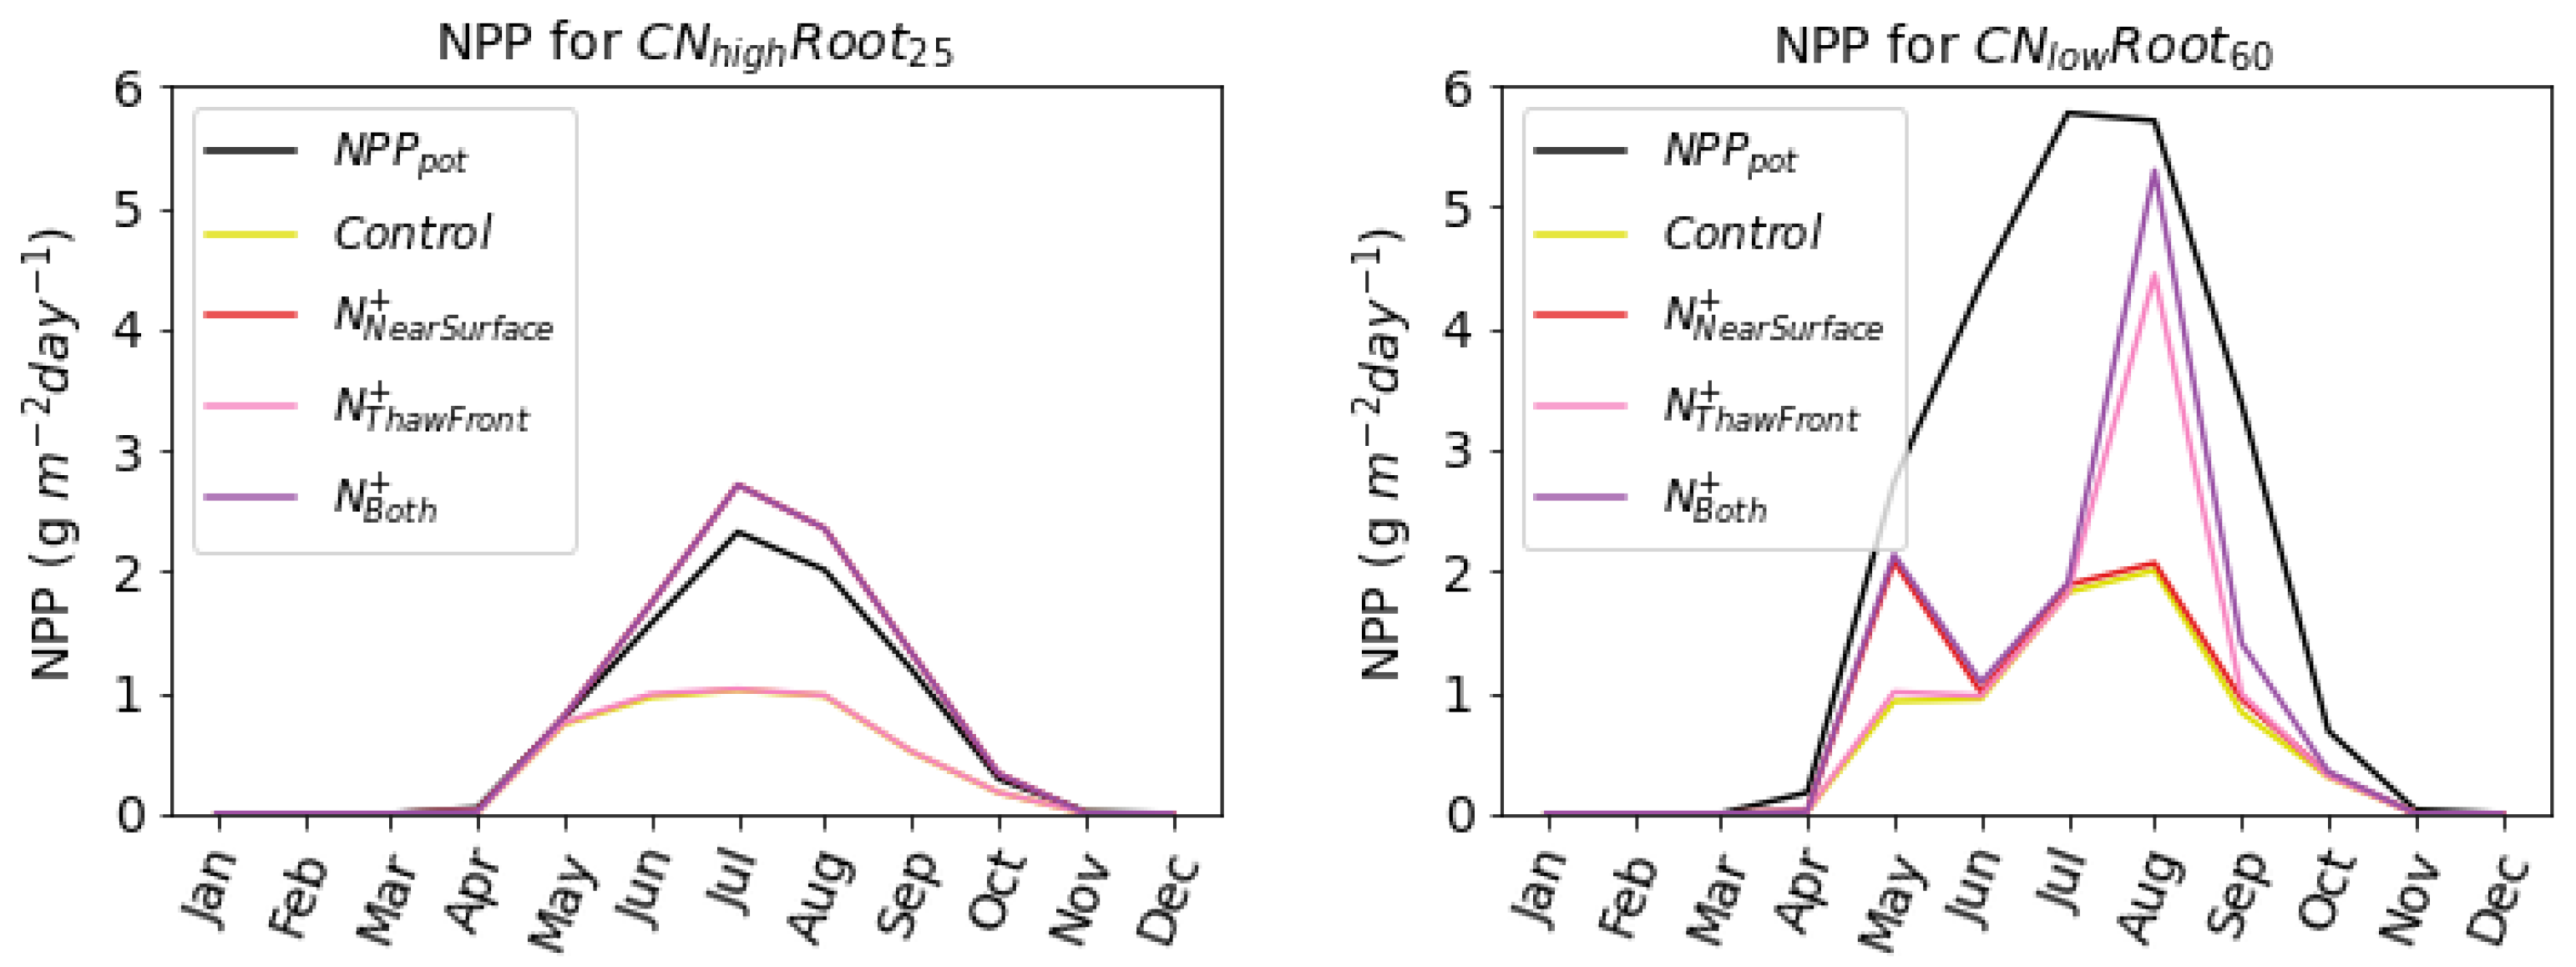
40] and could potentially counteract some of the carbon loss from thawing permafrost. Here, we show that it is possible to simulate belowground fertilisation in JULES by successfully replicating observations seen from previous fertilisation experiments. Our results show that near-surface fertilisation increases nitrogen available to both shallow- and deep-rooting species (Figure 4). However, only the deep-rooting species benefit from nitrogen applied at the permafrost thaw front. This is consistent with the experimental study conducted by [40]. In their study, [40] also found that deep-rooting plants were able to take up nutrients at the end of the growing season at the thaw front. This can be seen in our results by the substantial amount of nitrogen available to the deep-rooting plant species ( C N l o w R o o t 60 ) near the thaw front where subsurface fertiliser has been applied (Figure 4b(iii,iv)) and by the increase in NPP in Figure 5. Since the largest thaw depth is reached at the end of the growing season, this ability to take up nitrogen late in the season is key to whether or not plant species can benefit from the nitrogen released from thawing permafrost in the future. These results contradict the assumption from both [63,64] that seasonal asynchrony between nitrogen-availability at the thaw front and plant nitrogen-demand means that nitrogen released from thawing permafrost will not affect biomass, and our study shows that the impact on biomass can be significant indeed.
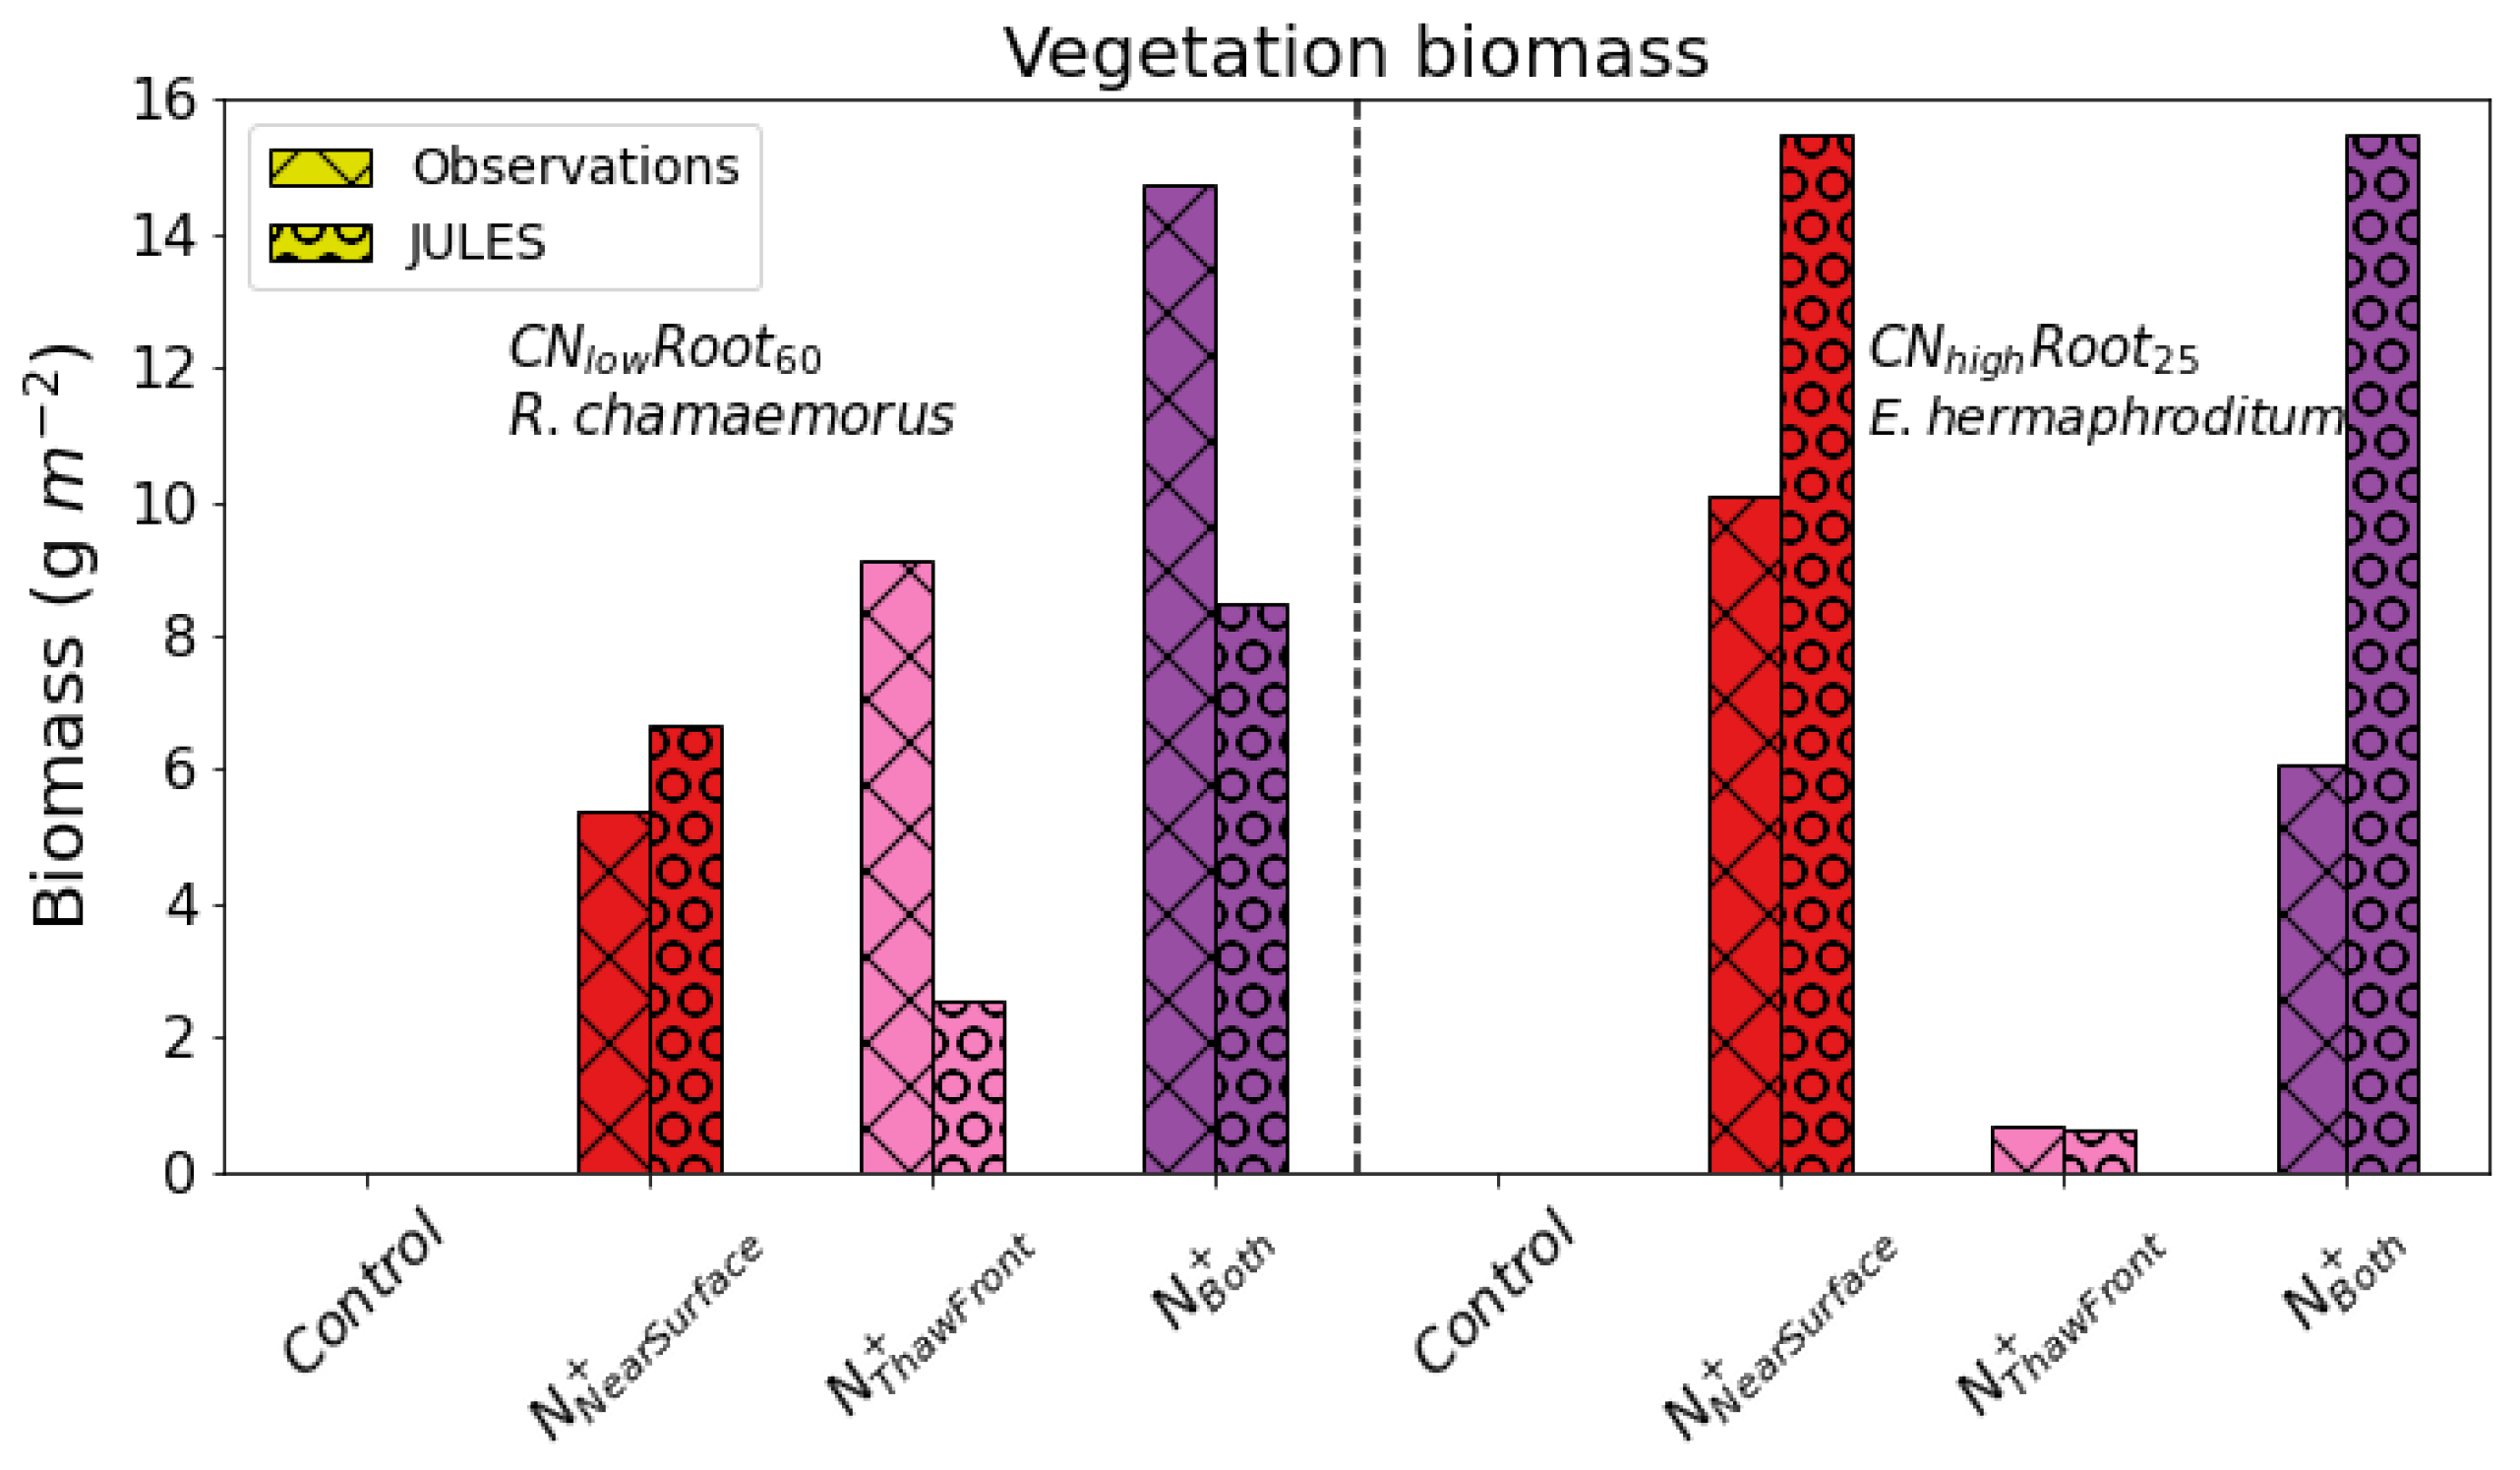
Although broadly our results are similar to [40], the simulated increase in aboveground biomass in response to fertilisation differs from the values found in the [40] study. In particular, [40] showed the fertilisation at the thaw front had a larger affect on the aboveground biomass of the deep-rooting species (R. chamaerorus) than near-surface fertilisation, whereas our C N l o w R o o t 60 saw the opposite response. This difference is likely explained by the relative amounts of roots in the soil profile, where larger a larger abundance of roots is observed at the thaw front for deep-rooting species compared to what is assumed in JULES. In addition, the deep-rooting PFT ( C N l o w R o o t 60 ) has approximately 10 gm 2 more aboveground biomass than our shallow-rooting PFT ( C N h i g h R o o t 25 ), which is contrary to that found by [40]. There is also an approximately double relative increase in aboveground biomass for C N h i g h R o o t 25 compared to C N l o w R o o t 60 when near surface fertiliser was added. This is likely caused by differences in nitrogen-limitation, with shallow-rooting species being more nitrogen-limited near the surface (Figure 5).
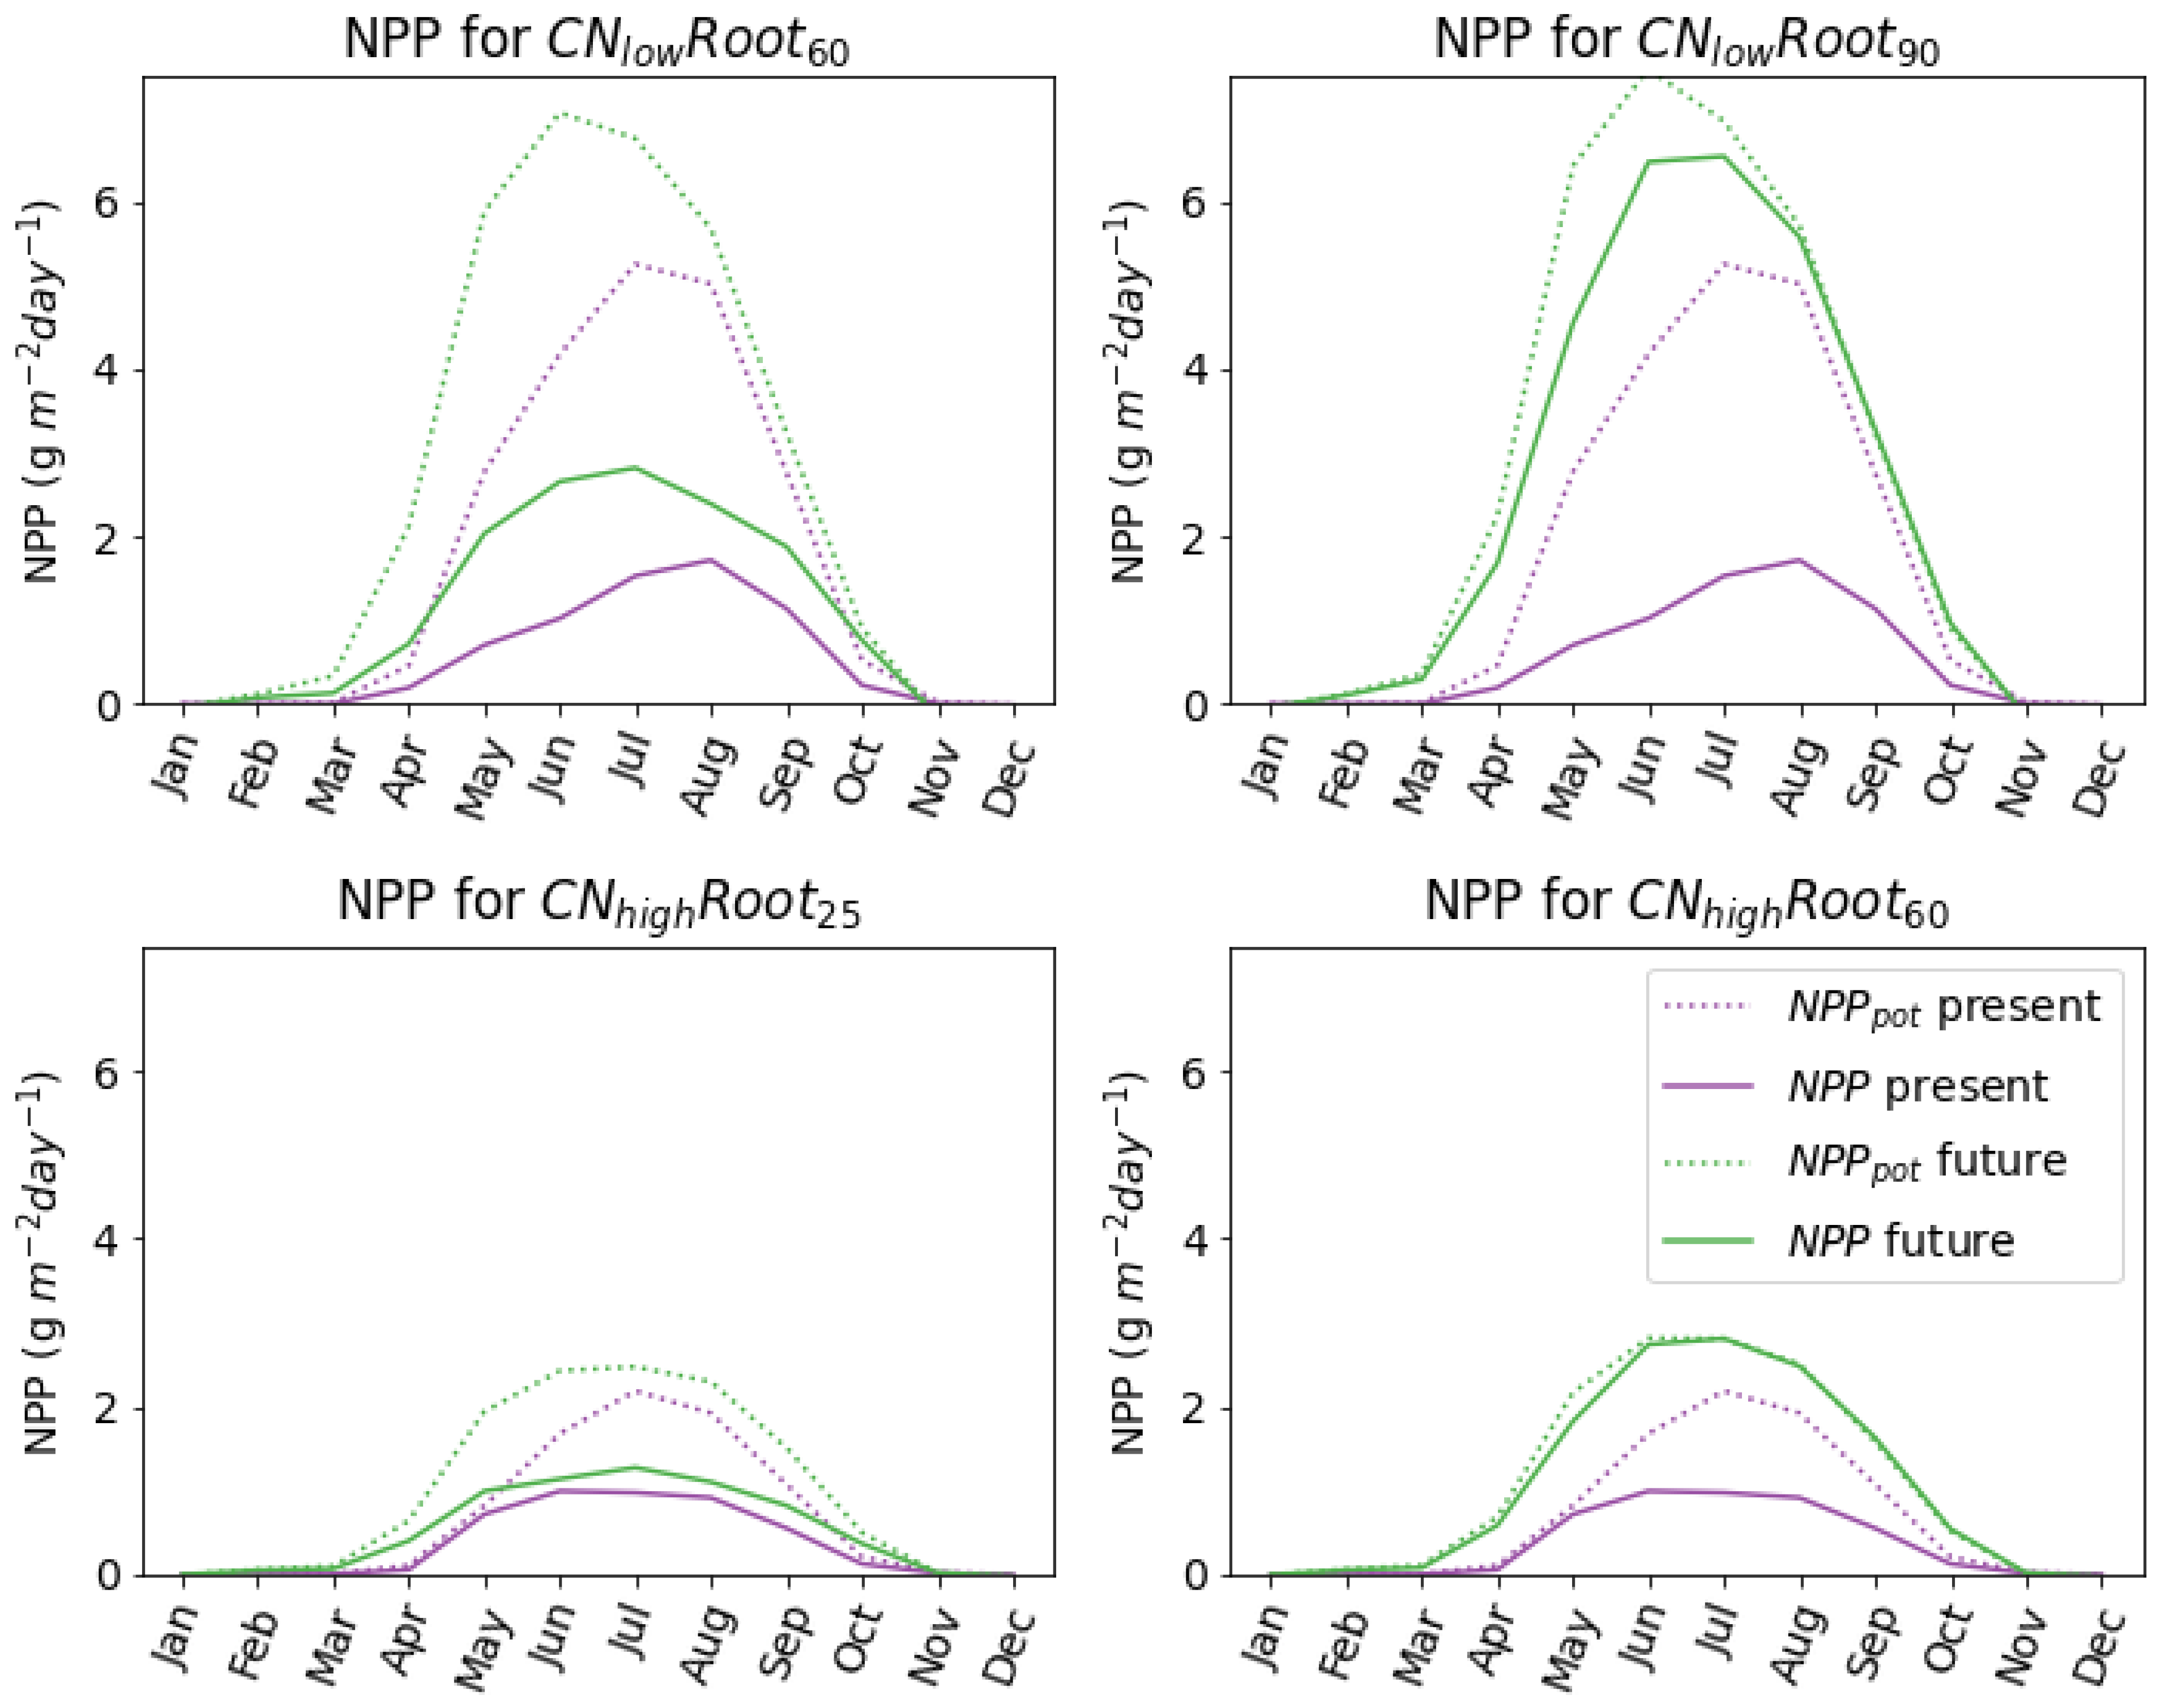
Future projections show that increases in plant-available inorganic nitrogen from present to the end of the century under climate warming are broadly similar to the changes obtained from the fertilisation at the thaw front in the belowground fertilisation simulations (Table 4). This results in increases of productivity and subsequent changes in vegetation. Nitrogen mineralisation is a key process that provides plant-available inorganic nitrogen at depth and is affected by multiple factors, such as hydrology, biochemistry, oxygen availability, and soil temperatures [2,11,65]. Therefore, under future warming, nitrogen mineralisation at the thaw front could be impacted through the response of such factors. Nitrogen mineralisation is known to be highly sensitive to temperature change [35,66,67,68]. In shallow soil layers, plant-available nitrogen is enhanced due to increased mineralisation due to air temperatures [67,68]. Whilst warmer temperatures in deeper layers of permafrost soils can lead to warming-induced increased microbial activity and increased mineralisation rates of organic matter [66]. A study conducted by [35] investigating mineralisation sensitivity to increased temperatures in permafrost soils found a five-fold increase in mineralisation rates over 0.5–11 °C, highlighting the importance that nitrogen mineralisation might play in providing sources of inorganic nitrogen for plant uptake at the thaw front in the future. Thawing permafrost may also provide soil drainage and new oxygen availability which could further enhance mineralisation rates [66]. However, mineralisation rates may respond differently by different thawing scenarios [35]. For example, abrupt permafrost thaw can lead to the formation of permafrost ponds and wetland which, in turn, might limit mineralisation through soil moisture [69].
The effects of increased nitrogen availability and uptake are enhanced when the simulated root depth is allowed to increase with increased summer thaw depth. Previous work suggests that a mismatch in time between nutrient demand and nitrogen availability will result in a negligible impact on plant root dynamics with future permafrost thaw [63,64,70]. However, recent research suggests that plant rooting depth can increase in thawing permafrost ecosystems [40,42,43,44], suggesting that having deep roots could be more advantageous under future warming and could result in vegetation shifts [71,72]. In our simulations, the largest pools of plant-available inorganic nitrogen were seen when species roots were extended to account for future root plasticity (Table 4), resulting in higher uptake and productivity compared to species with no root growth into greater depths. Inorganic nitrogen uptake by the species with no root adaptation increased by the end of the century (54% and 75% for C N h i g h R o o t 25 and C N l o w R o o t 60 , respectively). However, once the roots were allowed to adapt and grow deeper in the soil, the inorganic nitrogen uptake increased substantially—an increase of up to 300% when compared to present (
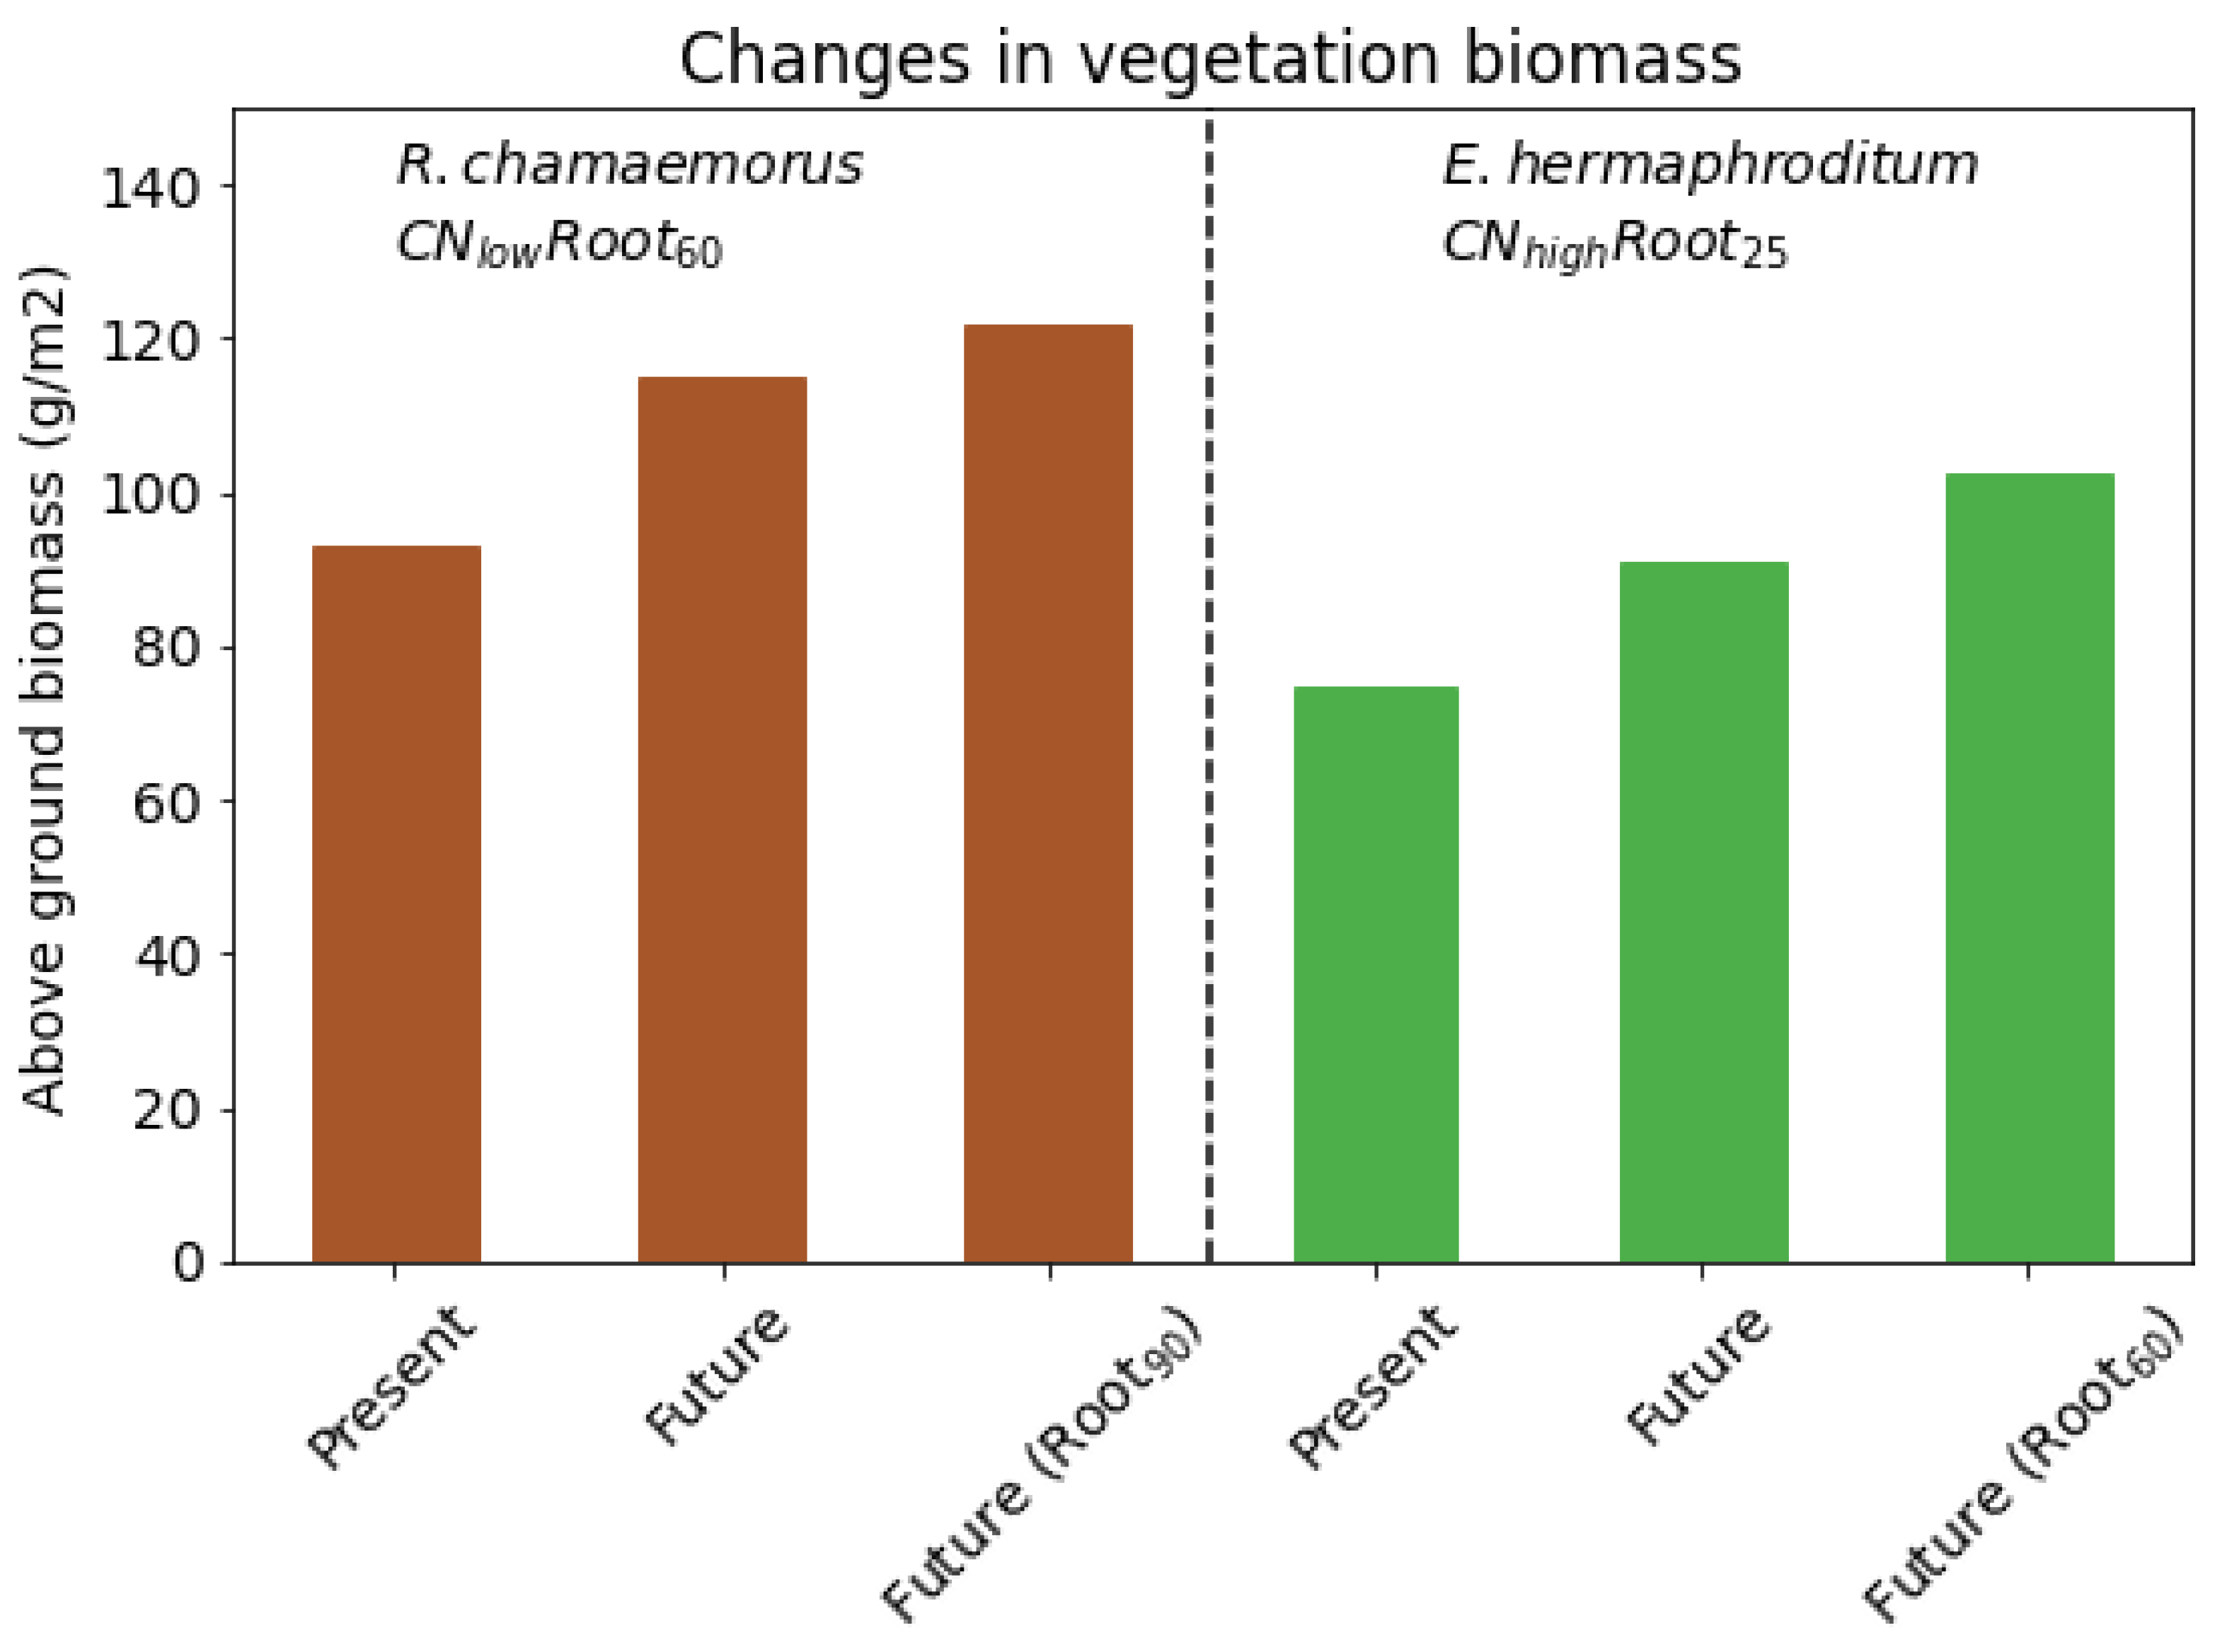
Table A3). Increasing inorganic nitrogen uptake reduces nitrogen-limitation, and consequently, simulations with increased root depths had the largest increases in plant productivity and vegetation biomass (Figure 9). In fact, the C N h i g h R o o t 25 species with adapted roots ( C N h i g h R o o t 60 ) became no longer nitrogen-limited in the future (Figure 8) and had an extra 16% increase in aboveground biomass compared with the C N h i g h R o o t 25 species. This suggests that species that are able to extend roots deep into the soil profile will have a competitive advantage under future warming. This has been observed in Arctic permafrost peatlands. For example, [73] found a change from shrub-dominated hummock sites to graminoid-dominated in Sweden over a 30-year period in response changes in frozen ground.
There are around 1.7 million km 2 of permafrost peatlands [74]. The shallow-rooting species ( C N h i g h R o o t 25 ) has about 90 gm 2 aboveground biomass in the present day, which converts to 0.15 Gt C over the permafrost peatlands. An increase of 22% gives an extra 0.033 Gt C of aboveground biomass for this species over the permafrost peatlands. If this species grows deeper roots, there is an increase of 33% in the aboveground biomass which gives an extra 0.05 Gt C. The extent of the permafrost region is estimated to be 21 million km 2 with approximately 14 million km 2 underlain by permafrost [75]. If the response of the shallow rooting species in JULES is extrapolated to the entire permafrost region, there is an extra 1.2–1.9 Gt C of carbon in the aboveground vegetation. Our results demonstrate an increase in future projections of carbon storage through enhanced biomass when including root adaptation and growth in models. This process has not previously been accounted for in Earth System Models. Therefore, it needs to be quantified for a range of Arctic vegetation types and its impact on climate–carbon feedbacks quantified in future Earth System models.
We assume that the nitrogen cycling represented within JULES has a realistic response to a changing climate. However, it was developed specifically to capture the large-scale interaction of carbon and nitrogen in a simple way [53] and therefore has limitations. In particular, it assumes fixed plant stoichiometry. Recent analyses of field observations have observed changes in leaf nitrogen content in response to increased nitrogen availability [76]. The inclusion of flexible stoichiometry into JULES has the potential to alter the carbon and nitrogen cycling and the impact of climate change on the biogeochemical feedbacks in the future. Competition between species was not included in the simulations in this paper. Here, only Arctic C 3 PFT was allowed to grow. However, there is a high dominance of Sphagnum fuscum moss throughout the site [40]. This is not accounted for in JULES and will impact both the surface water and energy balance and the biogeochemical cycling, including the soil net mineralisation. By only considering one PFT in this way, we are not considering the complete response of Arctic vegetation to future climate change such as plant species change. For example, although shrub expansion is often considered in tundra ecosystems, abrupt permafrost thaw can result in the formations of thaw ponds which can lead to vegetation shifts towards graminoid-dominated wetland [69]. Furthermore, shrub growth can be limited by wet soil conditions and nutrient-limitation whilst deep-rooting graminoid species may have the advantage of accessing newly available nutrients such as inorganic nitrogen under future permafrost thaw [69]. There are also uncertainties surrounding the interactions between Arctic vegetation response to increased nitrogen availability and impacts on nutrient cycling. As an example, as vegetation such as shrubs increase in height and cover as a result of warming, canopy overtopping might reduce the capacity to respond to warming induced changes [22]. However, such increases can also increase litter input to soils and enhance nitrogen mineralisation rates [33,77,78]. Therefore, any projections of vegetation responses in arctic ecosystems contain uncertainties surrounding overall response until these interactions are better understood and represented in models. Similarly, although an increase of root abundance of Arctic species at the thaw front is expected under future warming [43,44], there is relatively little known regarding root distribution with depth. In our simulations, we assumed a linearly decreasing distribution as a function of depth; however, alternatives are suggested and may differ for different species or ecosystems [41]. Although peat processes have recently been added to JULES [62], they are not yet included in this model configuration, and will impact the simulation of the soil carbon and nitrogen distribution and hence the available inorganic nitrogen.
Ultimately JULES is a model and we have tested a single process within that model: response to increased soil nitrogen-availability, both to test whether the representation of this process is realistic and to illustrate its potential role under future climate change. The bigger question is what the future of the Arctic system is as a whole, and to evaluate this, there are many interacting processes that must be considered, such as shifts in vegetation composition, hydrological and biogeochemical processes, some of which are included in JULES and some of which still need to be developed. For instance, most terrestrial nitrogen cycling models assume that plants can only utilise inorganic forms of nitrogen, yet it is known that Arctic vegetation can directly access organic nitrogen [79]. Furthermore, a study by [80] found that modelled organic nitrogen accounted for 36–87% of total nitrogen uptake by plants in tundra ecosystems with others estimating that nearly 60% of the nitrogen uptake by plants is from free amino acids in the arctic tundra [81]. Organic nitrogen may have different controls compared to inorganic nitrogen considered in our study and could play a very important role in plant nutrition under future warming. For example, a study by [35] that measured organic nitrogen (extractable, mineralizable and plant-available) and found consistently higher amounts in deeper layers of the soils. Therefore, future permafrost thaw and vegetation shifts under future climate change could be heavily involved with organic nitrogen; yet, this process is generally not included in land surface models. There are also vegetation processes such as root suberization and re-translocation of nutrients into storage tissues that will affect their response to additional nitrogen availability [35] and these are generally not included in models either. For example, thaw-depth development synchrony with plant nitrogen demand has the potential to be mismatched, whilst some species such as R. chamaemorus as well as deep-rooting graminoid species have been found to take up nitrogen by the time a meaningful change in thaw depth has occurred [35,82].
It is therefore important to recognise the limitations of using a model as presented in this study in presenting the complete picture of the arctic system under future climate change. However, considering the strong nitrogen limitation in the Arctic overall, we expect that the addition of mineralised nitrogen from permafrost has a role to play in the overall response of the Arctic ecosystem to climate change, and our results support this hypothesis, albeit that they illustrate only one aspect of the response. Similarly, by testing a model’s ability in representing one response such as belowground fertilisation, we can get closer to a more complete representation of the Arctic system and thus closer to getting the whole ecosystem response right.

5. Conclusions

We have simulated the response of Arctic vegetation to belowground fertilisation in JULES, which was able to successfully replicate a three-year belowground fertilisation experiment, illustrating the model’s ability to simulate belowground nitrogen dynamics in a permafrost-affected ecosystem. JULES simulations show that both shallow- and deep-rooting vegetation responded positively to increased nutrient availability from fertilisation near the soil surface. Increased plant-available inorganic nitrogen pools allowed an increase of nitrogen uptake and subsequent productivity of for both shallow- and deep-rooting species. In particular, the shallow-rooting species was no longer nitrogen-limited due to enhanced NPP. This increase in productivity then resulted in increasing biomass for both species. However, only deep-rooting species responded to fertilisation at the thaw front, in accordance with the observations.
Future projections indicate that deep-rooting plant species may have a competitive advantage in response to belowground fertilisation in a warming climate. Results for the model runs where plant roots were allowed to extent their foraging to the thaw front show that deep roots respond more positively to increased available inorganic nitrogen than shallow roots, with simulations showing higher productivity and a further increase of 8% biomass for the deepest rooting species. Furthermore, as inorganic nitrogen becomes available and productivity increases, simulations for shallow-rooting species with extended roots at depth ( C N h i g h R o o t 60 ) are able to meet their NPP potential, becoming no longer nitrogen-limited, whilst deep-rooting species with extended roots at depth greatly reduced nitrogen limitation. The research presented here is progress towards a more realistic model representation of nitrogen dynamics in permafrost-affected ecosystems.
This increases potential to better understand the impacts of climate change on the coupled carbon and nitrogen cycle in the Arctic system.

Author Contributions

Conceptualization, R.V., E.J.B., S.E.C., F.K. and A.B.H.; methodology, R.V., E.J.B. and S.E.C.; software, R.V. and E.J.B.; formal analysis, R.V. and E.J.B.; data curation, E.J.B.; writing—original draft preparation, R.V.; writing—review and editing, R.V., E.J.B., S.E.C., F.K. and A.B.H.; visualization, R.V. and E.J.B. All authors have read and agreed to the published version of the manuscript.

Funding

This project has received funding from the European Union’s Horizon 2020 research and innovation programme under Grant Agreement No. 101003536 (ESM2025—Earth System Models for the Future). E.J.B. was supported by the Joint UK BEIS/Defra Met Office Hadley Centre Climate Programme (GA01101). SEC was supported by a Natural Environment Research Council independent research fellowship (grant No. NE/R015791/1).

Institutional Review Board Statement

Not applicable.

Informed Consent Statement

Not applicable.

Data Availability Statement

Abisko meteorological data and snow depth data are available on request from the Abisko Scientific Research Station (https://polar.se/en/research-in-abisko) (last access: 17 April 2022), and the soil temperature data are archived in the GTN-P database (https://gtnp.arcticportal.org/) (last access: 17 April 2022). Soil carbon profiles are available from the following Zenodo repository: https://zenodo.org/record/5818180#.YmmBftrMKUk (last access: 17 April 2022).

Acknowledgments

We thank the Swedish Polar Research Secretariat and SITES for the support of the work done at the Abisko Scientific Research Station.

Conflicts of Interest

The authors declare no conflict of interest.

Appendix A

Table A1. Table of differences between the standard C 3 PFT and an Arctic (higher latitude C 3 ) PFT. * The suggested root depth of the C 3 high latitude PFT is 0.2 m, but in this paper, the root depths were modified to approximately represent the observed vegetation root depths (0.45 m and 0.25 m for deep and shallow roots, respectively).
DescriptionSymbol(Units)C 3 PFTArctic C 3 PFT
Disturbance rate g a r e a ( γ v )( / 360   days)0.1250.15
Lower temp. for carboxylation T l o w ( C)105
Upper temp. for carboxylation T u p p ( C)3218
Rooting depthrootdft(m)0.5variable *
Leaf mass per unit areaLMAkg[leaf] m 2 0.04950.045
Top leaf N content per unit mass N m a s s (kg[N] kg[leaf] 1 )0.0240.026
Quantum efficiency of photosynthesis α mol [CO 2 ]/mol [PAR photons] 0.0480.12
Table A2. Table of modifications for different Carbon-Nitrogen (CN) ratio cases. N m a s s is the top leaf N content per unit mass; N r is root nitrogen concentration (kg[N]/kg[C]) and N s w is stemwood nitrogen concentration (kg[N]/kg[C]). Here, standard indicates the standard JULES model configuration, whilst CN l o w R o o t 60 represents E. hermaphroditum and CN h i g h R o o t 25 represents R. chamaemorus.
ParameterStandard CN low Root 60 CN high Root 25
N m a s s 0.0260.0520.013
N r 0.01620.03240.00784
N s w 0.016040.032080.0083
C:N ratio301560
Max. root depth (cm)-6025
Table A3. Change in plant uptake inorganic N (kg[N] m 2 year 1 ). Taken as 10-year annual averages for present (2000–2010) with standard roots and future (2090–2100) under the RCP8.5 scenario for both standard roots and adapted roots which represent future root growth into deeper depths.
SpeciesPresentFuture
Std RootsDeeper Roots
C N h i g h R o o t 25 1.261.944.70
C N l o w R o o t 60 9.5316.6537.26

References

  1. IPCC. IPCC, 2021: Climate Change 2021: The Physical Science Basis. Contribution of Working Group I to the Sixth Assessment Report of the Intergovernmental Panel on Climate Change; Cambridge University Press: Cambridge, UK; New York, NY, USA, 2021. [Google Scholar]
  2. ACIA. Arctic Climate Impact Assessment. In Avoiding Dangerous Climate Change; Cambridge University Press: Cambridge, UK; New York, NY, USA, 2005. [Google Scholar]
  3. IPCC; Masson-Delmotte, V.; Zhai, P.; Pörtner, H.O.; Roberts, D.; Skea, J.; Shukla, P.R.; Pirani, A.; Moufouma-Okia, W.; Péan, C.; et al. Global Warming of 1.5C. An IPCC Special Report on the Impacts of Global Warming of 1.5C above Pre-Industrial Levels and Related Global Greenhouse Gas Emission Pathways, in the Context of Strengthening the Global Response to the Threat of Climate Change, Sustainable Development, and Efforts to Eradicate Poverty. 2018. Available online: http://pure.iiasa.ac.at/id/eprint/15716/ (accessed on 20 February 2022).
  4. Serreze, M.; Walsh, J.; Chapin, F.S.; Osterkamp, T.; Dyurgerov, M.; Romanovsky, V.; Oechel, W.; Morison, J.; Zhang, T.; Barry, R. Observational evidence of recent change in the northern high-latitude environment. Clim. Chang. 2000, 46, 159–207. [Google Scholar] [CrossRef]
  5. Hugelius, G.; Strauss, J.; Zubrzycki, S.; Harden, J.W.; Schuur, E.; Ping, C.L.; Schirrmeister, L.; Grosse, G.; Michaelson, G.J.; Koven, C.D.; et al. Estimated stocks of circumpolar permafrost carbon with quantified uncertainty ranges and identified data gaps. Biogeosciences 2014, 11, 6573–6593. [Google Scholar] [CrossRef] [Green Version]
  6. Schuur, E.A.; McGuire, A.D.; Schädel, C.; Grosse, G.; Harden, J.; Hayes, D.J.; Hugelius, G.; Koven, C.D.; Kuhry, P.; Lawrence, D.M.; et al. Climate change and the permafrost carbon feedback. Nature 2015, 520, 171–179. [Google Scholar] [CrossRef] [PubMed]
  7. Tarnocai, C.; Canadell, J.; Schuur, E.A.; Kuhry, P.; Mazhitova, G.; Zimov, S. Soil organic carbon pools in the northern circumpolar permafrost region. Glob. Biogeochem. Cycles 2009, 23, GB2023. [Google Scholar] [CrossRef]
  8. Zimov, S.A.; Schuur, E.A.; Chapin III, F.S. Permafrost and the global carbon budget. Science 2006, 312, 1612–1613. [Google Scholar] [CrossRef]
  9. Koven, C.D.; Ringeval, B.; Friedlingstein, P.; Ciais, P.; Cadule, P.; Khvorostyanov, D.; Krinner, G.; Tarnocai, C. Permafrost carbon-climate feedbacks accelerate global warming. Proc. Natl. Acad. Sci. USA 2011, 108, 14769–14774. [Google Scholar] [CrossRef] [Green Version]
  10. MacDougall, A.B.H.; Avis, C.A.; Weaver, A.J. Significant contribution to climate warming from the permafrost carbon feedback. Nat. Geosci. 2012, 5, 719–721. [Google Scholar] [CrossRef]
  11. Schuur, E.A.; Bockheim, J.; Canadell, J.G.; Euskirchen, E.; Field, C.B.; Goryachkin, S.V.; Hagemann, S.; Kuhry, P.; Lafleur, P.M.; Lee, H.; et al. Vulnerability of permafrost carbon to climate change: Implications for the global carbon cycle. BioScience 2008, 58, 701–714. [Google Scholar] [CrossRef]
  12. Burke, E.J.; Ekici, A.; Huang, Y.; Chadburn, S.E.; Huntingford, C.; Ciais, P.; Friedlingstein, P.; Peng, S.; Krinner, G. Quantifying uncertainties of permafrost carbon–climate feedbacks. Biogeosciences 2017, 14, 3051–3066. [Google Scholar] [CrossRef] [Green Version]
  13. Salmon, V.G.; Soucy, P.; Mauritz, M.; Celis, G.; Natali, S.M.; Mack, M.C.; Schuur, E.A. Nitrogen availability increases in a tundra ecosystem during five years of experimental permafrost thaw. Glob. Chang. Biol. 2016, 22, 1927–1941. [Google Scholar] [CrossRef]
  14. Beermann, F.; Langer, M.; Wetterich, S.; Strauss, J.; Boike, J.; Fiencke, C.; Schirrmeister, L.; Pfeiffer, E.M.; Kutzbach, L. Permafrost thaw and release of inorganic nitrogen from polygonal tundra soils in eastern Siberia. Biogeosci. Discuss. 2016, 1–27. [Google Scholar] [CrossRef] [Green Version]
  15. Finger, R.A.; Turetsky, M.R.; Kielland, K.; Ruess, R.W.; Mack, M.C.; Euskirchen, E.S. Effects of permafrost thaw on nitrogen availability and plant–soil interactions in a boreal Alaskan lowland. J. Ecol. 2016, 104, 1542–1554. [Google Scholar] [CrossRef]
  16. Burke, E.J.; Chadburn, S.E.; Huntingford, C. Thawing permafrost as a nitrogen fertiliser: Implications for climate feedbacks. Nitrogen, 2022; submitted. [Google Scholar]
  17. Aerts, R.; Wallen, B.; Malmer, N. Growth-limiting nutrients in Sphagnum-dominated bogs subject to low and high atmospheric nitrogen supply. J. Ecol. 1992, 80, 131–140. [Google Scholar] [CrossRef]
  18. Berendse, F.; Jonasson, S. Nutrient use and nutrient cycling in northern ecosystems. In Arctic Ecosystems in a Changing Climate: An Ecophysiological Perspective; Academic Press Limited: London, UK, 1992; pp. 337–356. [Google Scholar]
  19. Hobbie, S.E.; Nadelhoffer, K.J.; Högberg, P. A synthesis: The role of nutrients as constraints on carbon balances in boreal and arctic regions. Plant Soil 2002, 242, 163–170. [Google Scholar] [CrossRef]
  20. Van Wijk, M.; Clemmensen, K.E.; Shaver, G.; Williams, M.; Callaghan, T.; Chapin, F., III; Cornelissen, J.; Gough, L.; Hobbie, S.E.; Jonasson, S.; et al. Long-term ecosystem level experiments at Toolik Lake, Alaska, and at Abisko, Northern Sweden: Generalizations and differences in ecosystem and plant type responses to global change. Glob. Chang. Biol. 2004, 10, 105–123. [Google Scholar] [CrossRef]
  21. Epstein, H.E.; Myers-Smith, I.; Walker, D.A. Recent dynamics of arctic and sub-arctic vegetation. Environ. Res. Lett. 2013, 8, 015040. [Google Scholar] [CrossRef] [Green Version]
  22. Myers-Smith, I.H.; Forbes, B.C.; Wilmking, M.; Hallinger, M.; Lantz, T.; Blok, D.; Tape, K.D.; Macias-Fauria, M.; Sass-Klaassen, U.; Lévesque, E.; et al. Shrub expansion in tundra ecosystems: Dynamics, impacts and research priorities. Environ. Res. Lett. 2011, 6, 045509. [Google Scholar] [CrossRef] [Green Version]
  23. Blok, D.; Schaepman-Strub, G.; Bartholomeus, H.; Heijmans, M.M.; Maximov, T.C.; Berendse, F. The response of Arctic vegetation to the summer climate: Relation between shrub cover, NDVI, surface albedo and temperature. Environ. Res. Lett. 2011, 6, 035502. [Google Scholar] [CrossRef] [Green Version]
  24. Boelman, N.T.; Gough, L.; McLaren, J.R.; Greaves, H. Does NDVI reflect variation in the structural attributes associated with increasing shrub dominance in arctic tundra? Environ. Res. Lett. 2011, 6, 035501. [Google Scholar] [CrossRef]
  25. Villarreal, S.; Hollister, R.; Johnson, D.; Lara, M.; Webber, P.; Tweedie, C. Tundra vegetation change near Barrow, Alaska (1972–2010). Environ. Res. Lett. 2012, 7, 015508. [Google Scholar] [CrossRef]
  26. Walker, D.; Epstein, H.; Raynolds, M.; Kuss, P.; Kopecky, M.; Frost, G.; Daniëls, F.; Leibman, M.; Moskalenko, N.; Matyshak, G.; et al. Environment, vegetation and greenness (NDVI) along the North America and Eurasia Arctic transects. Environ. Res. Lett. 2012, 7, 015504. [Google Scholar] [CrossRef] [Green Version]
  27. Buizer, B.; Weijers, S.; Van Bodegom, P.M.; Alsos, I.G.; Eidesen, P.B.; van Breda, J.; de Korte, M.; van Rijckevorsel, J.; Rozema, J. Range shifts and global warming: Ecological responses of Empetrum nigrum L. to experimental warming at its northern (high Arctic) and southern (Atlantic) geographical range margin. Environ. Res. Lett. 2012, 7, 025501. [Google Scholar] [CrossRef] [Green Version]
  28. Zeng, H.; Jia, G.; Epstein, H. Recent changes in phenology over the northern high latitudes detected from multi-satellite data. Environ. Res. Lett. 2011, 6, 045508. [Google Scholar] [CrossRef] [Green Version]
  29. Beck, P.S.; Goetz, S.J. Satellite observations of high northern latitude vegetation productivity changes between 1982 and 2008: Ecological variability and regional differences. Environ. Res. Lett. 2011, 6, 045501. [Google Scholar] [CrossRef]
  30. Fraser, R.; Olthof, I.; Carrière, M.; Deschamps, A.; Pouliot, D. Detecting long-term changes to vegetation in northern Canada using the Landsat satellite image archive. Environ. Res. Lett. 2011, 6, 045502. [Google Scholar] [CrossRef] [Green Version]
  31. Lin, D.; Johnson, D.; Andresen, C.; Tweedie, C. High spatial resolution decade-time scale land cover change at multiple locations in the Beringian Arctic (1948–2000s). Environ. Res. Lett. 2012, 7, 025502. [Google Scholar] [CrossRef] [Green Version]
  32. Myers-Smith, I.H.; Elmendorf, S.C.; Beck, P.S.; Wilmking, M.; Hallinger, M.; Blok, D.; Tape, K.D.; Rayback, S.A.; Macias-Fauria, M.; Forbes, B.C.; et al. Climate sensitivity of shrub growth across the tundra biome. Nat. Clim. Chang. 2015, 5, 887–891. [Google Scholar] [CrossRef]
  33. Buckeridge, K.M.; Zufelt, E.; Chu, H.; Grogan, P. Soil nitrogen cycling rates in low arctic shrub tundra are enhanced by litter feedbacks. Plant Soil 2010, 330, 407–421. [Google Scholar] [CrossRef]
  34. Wookey, P.A.; Aerts, R.; Bardgett, R.D.; Baptist, F.; Bråthen, K.A.; Cornelissen, J.H.; Gough, L.; Hartley, I.P.; Hopkins, D.W.; Lavorel, S.; et al. Ecosystem feedbacks and cascade processes: Understanding their role in the responses of Arctic and alpine ecosystems to environmental change. Glob. Chang. Biol. 2009, 15, 1153–1172. [Google Scholar] [CrossRef] [Green Version]
  35. Keuper, F.; Bodegom, P.M.; Dorrepaal, E.; Weedon, J.T.; Hal, J.; Logtestijn, R.S.; Aerts, R. A frozen feast: Thawing permafrost increases plant-available nitrogen in subarctic peatlands. Glob. Chang. Biol. 2012, 18, 1998–2007. [Google Scholar] [CrossRef]
  36. Salmon, V.G.; Schädel, C.; Bracho, R.; Pegoraro, E.; Celis, G.; Mauritz, M.; Mack, M.C.; Schuur, E.A. Adding depth to our understanding of nitrogen dynamics in permafrost soils. J. Geophys. Res. Biogeosciences 2018, 123, 2497–2512. [Google Scholar] [CrossRef]
  37. Sistla, S.A.; Moore, J.C.; Simpson, R.T.; Gough, L.; Shaver, G.R.; Schimel, J.P. Long-term warming restructures Arctic tundra without changing net soil carbon storage. Nature 2013, 497, 615–618. [Google Scholar] [CrossRef] [PubMed]
  38. Wickland, K.P.; Waldrop, M.P.; Aiken, G.R.; Koch, J.C.; Jorgenson, M.T.; Striegl, R.G. Dissolved organic carbon and nitrogen release from boreal Holocene permafrost and seasonally frozen soils of Alaska. Environ. Res. Lett. 2018, 13, 065011. [Google Scholar] [CrossRef]
  39. Wild, B.; Schnecker, J.; Knoltsch, A.; Takriti, M.; Mooshammer, M.; Gentsch, N.; Mikutta, R.; Alves, R.J.E.; Gittel, A.; Lashchinskiy, N.; et al. Microbial nitrogen dynamics in organic and mineral soil horizons along a latitudinal transect in western Siberia. Glob. Biogeochem. Cycles 2015, 29, 567–582. [Google Scholar] [CrossRef] [PubMed] [Green Version]
  40. Keuper, F.; Dorrepaal, E.; van Bodegom, P.M.; van Logtestijn, R.; Venhuizen, G.; van Hal, J.; Aerts, R. Experimentally increased nutrient availability at the permafrost thaw front selectively enhances biomass production of deep-rooting subarctic peatland species. Glob. Chang. Biol. 2017, 23, 4257–4266. [Google Scholar] [CrossRef]
  41. Keuper, F.; Wild, B.; Kummu, M.; Beer, C.; Blume-Werry, G.; Fontaine, S.; Gavazov, K.; Gentsch, N.; Guggenberger, G.; Hugelius, G.; et al. Carbon loss from northern circumpolar permafrost soils amplified by rhizosphere priming. Nat. Geosci. 2020, 13, 560–565. [Google Scholar] [CrossRef]
  42. Blume-Werry, G.; Jansson, R.; Milbau, A. Root phenology unresponsive to earlier snowmelt despite advanced above-ground phenology in two subarctic plant communities. Funct. Ecol. 2017, 31, 1493–1502. [Google Scholar] [CrossRef]
  43. Blume-Werry, G.; Milbau, A.; Teuber, L.M.; Johansson, M.; Dorrepaal, E. Dwelling in the deep–strongly increased root growth and rooting depth enhance plant interactions with thawing permafrost soil. New Phytol. 2019, 223, 1328–1339. [Google Scholar] [CrossRef]
  44. Radville, L.; Post, E.; Eissenstat, D.M. Root phenology in an Arctic shrub-graminoid community: The effects of long-term warming and herbivore exclusion. Clim. Chang. Responses 2016, 3, 4. [Google Scholar] [CrossRef] [Green Version]
  45. Chadburn, S.E.; Krinner, G.; Porada, P.; Bartsch, A.; Beer, C.; Marchesini, L.B.; Boike, J.; Ekici, A.; Elberling, B.; Friborg, T.; et al. Carbon stocks and fluxes in the high latitudes: Using site-level data to evaluate Earth system models. Biogeosciences 2017, 14, 5143. [Google Scholar] [CrossRef] [Green Version]
  46. Johansson, M.; Åkerman, J.; Keuper, F.; Christensen, T.R.; Lantuit, H.; Callaghan, T.V. Past and present permafrost temperatures in the Abisko area: Redrilling of boreholes. AMBIO J. Hum. Environ. 2011, 40, 558–565. [Google Scholar] [CrossRef] [PubMed] [Green Version]
  47. Jammet, M.; Dengel, S.; Kettner, E.; Parmentier, F.J.W.; Wik, M.; Crill, P.; Friborg, T. Year-round CH 4 and CO 2 flux dynamics in two contrasting freshwater ecosystems of the subarctic. Biogeosciences 2017, 14, 5189. [Google Scholar] [CrossRef] [Green Version]
  48. Callaghan, T.V.; Bergholm, F.; Christensen, T.R.; Jonasson, C.; Kokfelt, U.; Johansson, M. A new climate era in the sub-Arctic: Accelerating climate changes and multiple impacts. Geophys. Res. Lett. 2010, 37. [Google Scholar] [CrossRef]
  49. Klaminder, J.; Yoo, K.; Rydberg, J.; Giesler, R. An explorative study of mercury export from a thawing palsa mire. J. Geophys. Res. Biogeosciences 2008, 113. [Google Scholar] [CrossRef]
  50. Sellar, A.A.; Jones, C.G.; Mulcahy, J.P.; Tang, Y.; Yool, A.; Wiltshire, A.; O’Connor, F.M.; Stringer, M.; Hill, R.; Palmieri, J.; et al. UKESM1: Description and Evaluation of the U.K. Earth System Model. J. Adv. Model. Earth Syst. 2019, 11, 4513–4558. [Google Scholar] [CrossRef] [Green Version]
  51. Best, M.; Pryor, M.; Clark, D.; Rooney, G.; Essery, R.; Ménard, C.; Edwards, J.; Hendry, M.; Porson, A.; Gedney, N.; et al. The Joint UK Land Environment Simulator (JULES), model description–Part 1: Energy and water fluxes. Geosci. Model Dev. 2011, 4, 677–699. [Google Scholar] [CrossRef] [Green Version]
  52. Clark, D.; Mercado, L.; Sitch, S.; Jones, C.; Gedney, N.; Best, M.; Pryor, M.; Rooney, G.; Essery, R.; Blyth, E.; et al. The Joint UK Land Environment Simulator (JULES), model description–Part 2: Carbon fluxes and vegetation dynamics. Geosci. Model Dev. 2011, 4, 701–722. [Google Scholar] [CrossRef] [Green Version]
  53. Wiltshire, A.J.; Burke, E.J.; Chadburn, S.E.; Jones, C.D.; Cox, P.M.; Davies-Barnard, T.; Friedlingstein, P.; Harper, A.B.; Liddicoat, S.; Sitch, S.; et al. JULES-CN: A coupled terrestrial carbon–nitrogen scheme (JULES vn5. 1). Geosci. Model Dev. 2021, 14, 2161–2186. [Google Scholar] [CrossRef]
  54. Harper, A.B.; Cox, P.M.; Wiltshire, A.J.; Jones, C.D.; Mercado, L.M.; Atkin, O.K.; Reich, P.B.; Soudzilovskaia, N.A. Improved representation of plant functional types and physiology in the Joint UK Land Environment Simulator (JULES v4. 2) using plant trait information. Geosci. Model Dev. 2016, 9, 2415. [Google Scholar] [CrossRef] [Green Version]
  55. Burke, E.J.; Chadburn, S.E.; Ekici, A. A vertical representation of soil carbon in the JULES land surface scheme (vn4. 3_permafrost) with a focus on permafrost regions. Geosci. Model Dev. 2017, 10, 959. [Google Scholar] [CrossRef] [Green Version]
  56. Weedon, G.P.; Gomes, S.; Viterbo, P.; Shuttleworth, W.J.; Blyth, E.; Österle, H.; Adam, J.C.; Bellouin, N.; Boucher, O.; Best, M. Creation of the WATCH forcing data and its use to assess global and regional reference crop evaporation over land during the twentieth century. J. Hydrometeorol. 2011, 12, 823–847. [Google Scholar] [CrossRef] [Green Version]
  57. Weedon, G.P.; Balsamo, G.; Bellouin, N.; Gomes, S.; Best, M.J.; Viterbo, P. The WFDEI meteorological forcing data set: WATCH Forcing Data methodology applied to ERA-Interim reanalysis data. Water Resour. Res. 2014, 50, 7505–7514. [Google Scholar] [CrossRef] [Green Version]
  58. Chadburn, S.; Burke, E.; Essery, R.; Boike, J.; Langer, M.; Heikenfeld, M.; Cox, P.; Friedlingstein, P. An improved representation of physical permafrost dynamics in the JULES land-surface model. Geosci. Model Dev. 2015, 8, 1493–1508. [Google Scholar] [CrossRef] [Green Version]
  59. Lamarque, J.F.; Shindell, D.T.; Josse, B.; Young, P.; Cionni, I.; Eyring, V.; Bergmann, D.; Cameron-Smith, P.; Collins, W.J.; Doherty, R.; et al. The Atmospheric Chemistry and Climate Model Intercomparison Project (ACCMIP): Overview and description of models, simulations and climate diagnostics. Geosci. Model Dev. 2013, 6, 179–206. [Google Scholar] [CrossRef] [Green Version]
  60. McGuire, A.D.; Lawrence, D.M.; Koven, C.; Clein, J.S.; Burke, E.; Chen, G.; Jafarov, E.; MacDougall, A.B.H.; Marchenko, S.; Nicolsky, D.; et al. Dependence of the evolution of carbon dynamics in the northern permafrost region on the trajectory of climate change. Proc. Natl. Acad. Sci. USA 2018, 115, 3882–3887. [Google Scholar] [CrossRef] [Green Version]
  61. Pastorello, G.; Trotta, C.; Canfora, E.; Chu, H.; Christianson, D.; Cheah, Y.W.; Poindexter, C.; Chen, J.; Elbashandy, A.; Humphrey, M.; et al. The FLUXNET2015 dataset and the ONEFlux processing pipeline for eddy covariance data. Sci. Data 2020, 7, 225. [Google Scholar] [CrossRef]
  62. Chadburn, S.E.; Burke, E.J.; Gallego-Sala, A.V.; Smith, N.D.; Bret-Harte, M.S.; Charman, D.J.; Drewer, J.; Edgar, C.W.; Euskirchen, E.S.; Fortuniak, K.; et al. A new approach to simulate peat accumulation, degradation and stability in a global land surface scheme (JULES vn5.8_accumulate_soil) for northern and temperate peatlands. Geosci. Model Dev. 2022, 15, 1633–1657. [Google Scholar] [CrossRef]
  63. Koven, C.D.; Lawrence, D.M.; Riley, W.J. Permafrost carbon- climate feedback is sensitive to deep soil carbon decomposability but not deep soil nitrogen dynamics. Proc. Natl. Acad. Sci. USA 2015, 112, 3752–3757. [Google Scholar] [CrossRef] [Green Version]
  64. Norby, R.J.; Sloan, V.L.; Iversen, C.M.; Childs, J. Controls on fine-scale spatial and temporal variability of plant-available inorganic nitrogen in a polygonal tundra landscape. Ecosystems 2019, 22, 528–543. [Google Scholar] [CrossRef] [Green Version]
  65. Robinson, C.H. Controls on decomposition and soil nitrogen availability at high latitudes. Plant Soil 2002, 242, 65–81. [Google Scholar] [CrossRef]
  66. Wang, P.; Limpens, J.; Nauta, A.; van Huissteden, C.; Quirina van Rijssel, S.; Mommer, L.; de Kroon, H.; Maximov, T.C.; Heijmans, M.M. Depth-based differentiation in nitrogen uptake between graminoids and shrubs in an Arctic tundra plant community. J. Veg. Sci. 2018, 29, 34–41. [Google Scholar] [CrossRef] [Green Version]
  67. Rustad, L.; Campbell, J.; Marion, G.; Norby, R.; Mitchell, M.; Hartley, A.; Cornelissen, J.; Gurevitch, J. A meta-analysis of the response of soil respiration, net nitrogen mineralization, and aboveground plant growth to experimental ecosystem warming. Oecologia 2001, 126, 543–562. [Google Scholar] [CrossRef] [PubMed]
  68. Weedon, T.J.; Kowalchuk, G.A.; Aerts, R.; van Hal, J.; van Logtestijn, R.; Taş, N.; Roling, W.F.M.; van Bodegom, P.M. Summer warming accelerates sub-arctic peatland nitrogen cycling without changing enzyme pools or microbial community structure. Glob. Chang. Biol. 2012, 18, 138–150. [Google Scholar] [CrossRef]
  69. van der Kolk, H.J.; Heijmans, M.M.; van Huissteden, J.; Pullens, J.W.; Berendse, F. Potential Arctic tundra vegetation shifts in response to changing temperature, precipitation and permafrost thaw. Biogeosciences 2016, 13, 6229–6245. [Google Scholar] [CrossRef] [Green Version]
  70. Wild, B.; Gentsch, N.; Čapek, P.; Diáková, K.; Alves, R.J.E.; Bárta, J.; Gittel, A.; Hugelius, G.; Knoltsch, A.; Kuhry, P.; et al. Plant-derived compounds stimulate the decomposition of organic matter in arctic permafrost soils. Sci. Rep. 2016, 6, 25607. [Google Scholar] [CrossRef]
  71. Lantz, T.C.; Kokelj, S.V.; Gergel, S.E.; Henry, G.H. Relative impacts of disturbance and temperature: Persistent changes in microenvironment and vegetation in retrogressive thaw slumps. Glob. Chang. Biol. 2009, 15, 1664–1675. [Google Scholar] [CrossRef]
  72. Schuur, E.A.; Crummer, K.G.; Vogel, J.G.; Mack, M.C. Plant species composition and productivity following permafrost thaw and thermokarst in Alaskan tundra. Ecosystems 2007, 10, 280–292. [Google Scholar] [CrossRef]
  73. Malmer, N.; Johansson, T.; Olsrud, M.; Christensen, T.R. Vegetation, climatic changes and net carbon sequestration in a North-Scandinavian subarctic mire over 30 years. Glob. Chang. Biol. 2005, 11, 1895–1909. [Google Scholar] [CrossRef]
  74. Hugelius, G.; Loisel, J.; Chadburn, S.; Jackson, R.B.; Jones, M.; MacDonald, G.; Marushchak, M.; Olefeldt, D.; Packalen, M.; Siewert, M.B.; et al. Large stocks of peatland carbon and nitrogen are vulnerable to permafrost thaw. Proc. Natl. Acad. Sci. 2020, 117, 20438–20446. [Google Scholar] [CrossRef]
  75. Obu, J. How Much of the Earth’s Surface is Underlain by Permafrost? J. Geophys. Res. Earth Surf. 2021, 126, e2021JF006123. [Google Scholar] [CrossRef]
  76. Mao, J.; Mao, Q.; Zheng, M.; Mo, J. Responses of Foliar Nutrient Status and Stoichiometry to Nitrogen Addition in Different Ecosystems: A Meta-analysis. J. Geophys. Res. Biogeosci. 2020, 125, e2019JG005347. [Google Scholar] [CrossRef]
  77. Buckeridge, K.M.; Grogan, P. Deepened snow increases late thaw biogeochemical pulses in mesic low arctic tundra. Biogeochemistry 2010, 101, 105–121. [Google Scholar] [CrossRef] [Green Version]
  78. Baptist, F.; Yoccoz, N.G.; Choler, P. Direct and indirect control by snow cover over decomposition in alpine tundra along a snowmelt gradient. Plant Soil 2010, 328, 397–410. [Google Scholar] [CrossRef]
  79. Näsholm, T.; Kielland, K.; Ganeteg, U. Uptake of organic nitrogen by plants. New Phytol. 2009, 182, 31–48. [Google Scholar] [CrossRef] [PubMed]
  80. Zhu, Q.; Zhuang, Q. Modeling the effects of organic nitrogen uptake by plants on the carbon cycling of boreal forest and tundra ecosystems. Biogeosciences 2013, 10, 7943–7955. [Google Scholar] [CrossRef] [Green Version]
  81. Chapin, F.S.; Moilanen, L.; Kielland, K. Preferential use of organic nitrogen for growth by a non-mycorrhizal arctic sedge. Nature 1993, 361, 150–153. [Google Scholar] [CrossRef]
  82. Blume-Werry, G.; Wilson, S.D.; Kreyling, J.; Milbau, A. The hidden season: Growing season is 50% longer below than above ground along an arctic elevation gradient. New Phytol. 2016, 209, 978–986. [Google Scholar] [CrossRef] [Green Version]
Figure 1. Soil temperature in °C at (a) 15 cm depth and (b) 50 cm depth. (c) The monthly mean simulated thaw depth (m) alongside the observed annual mean maximum summer thaw depth and its uncertainties. (d) The time series of the snow depth with the available observations.
Nitrogen 03 00018 g001
Figure 2. (a) Seasonal cycle of gross primary productivity (GPP) and (b) the profile of soil carbon simulated by the C o n t r o l simulation for three configurations: C N h i g h R o o t 25 , C N l o w R o o t 60 , and P F T c o m p e t e .
Nitrogen 03 00018 g002
Figure 3. Vertical profile of inorganic nitrogen as a monthly average between 2007–2014 for C o n t r o l and C N h i g h R o o t 25 (25 cm rooting depth) and C N l o w R o o t 60 (60 cm rooting depth), and P F T c o m p e t e . The mean maximum summer thaw depth is between 60 and 65 cm.
Nitrogen 03 00018 g003
Figure 4. Inorganic nitrogen available to plant species with (a) C N h i g h R o o t 25 (shallow 25 cm roots) and (b) C N l o w R o o t 60 (deep 60 cm roots) throughout the year 2010 for the four different fertilisation simulations: (i) C o n t r o l , (ii) near-surface soil nitrogen fertilisation— N N e a r S u r f a c e + , (iii) fertilisation at the thaw front— N T h a w F r o n t + , and (iv) both near-surface and thaw-front fertilisation— N B o t h + . Dashed lines indicate the maximum depths of the roots. Grey shading indicates the times and depth of the thawed soil.
Nitrogen 03 00018 g004
Figure 5. NPP for C N h i g h R o o t 25 (left) and C N l o w R o o t 60 (right). The impact on the NPP of the different N addition experiments are shown in both cases throughout the year 2010. For C N h i g h R o o t 25 (left) C o n t r o l and N T h a w F r o n t + are the same, so only N T h a w F r o n t + is visible. Similarly, N N e a r S u r f a c e + and N B o t h + are the same.
Nitrogen 03 00018 g005
Figure 6. The increase in vegetation aboveground biomass for the N addition experiments compared to the vegetation aboveground biomass of the C o n t r o l for June 2011. JULES output is the right-hand bar of the pairs and the observations are the left-hand bar. The different colours of the bars represent the different addition experiments: N N e a r S u r f a c e + is red, N T h a w F r o n t + is pink, and N B o t h + is purple.
Nitrogen 03 00018 g006
Figure 7. Inorganic nitrogen available to plant species with (a)i C N h i g h R o o t 25 for 2000–2010 (present) and (a)ii 2090–2100 (future under a RCP8.5 scenario), along with (a)iii C N h i g h R o o t 60 for 2090–2100 (future under a RCP8.5 scenario). The bottom row shows (b)i C N l o w R o o t 60 for 2000–2010 (present) and (b)ii 2090–2100 (future under a RCP8.5 scenario), along with (b)iii C N l o w R o o t 90 for 2090–2100 (future under a RCP8.5 scenario). The horizontal dotted line shows the maximum rooting depth. The grey shaded area represents the thawed soil.
Nitrogen 03 00018 g007
Figure 8. Potential NPP (NPP p o t ) and nitrogen-limited NPP for the period 2000–2010 (present) and the period 2090–2100 (future under RCP8.5 scenario) displayed as a 10-year monthly average. The left-hand column shows the future projections of NPP for the original vegetation types and the right-hand column shows that for a proposed future vegetation type, where the root depths are able to increase because the permafrost has thawed. The present-day NPP is for C N l o w R o o t 60 and C N h i g h R o o t 25 , respectively, for both left and right columns.
Nitrogen 03 00018 g008
Figure 9. Vegetation aboveground biomass for C N l o w R o o t 60 and C N h i g h R o o t 25 and C N l o w R o o t 60 for the present (2001–2010) and future (2090–2099). Also shown are the two future scenarios where the roots have responded to the increase in thaw depth C N l o w R o o t 90 (labelled Future-Root 90 ) and C N h i g h R o o t 60 (labelled Future-Root 90 ).
Nitrogen 03 00018 g009
Table 1. Summary of the observed plant characteristics of the two dominant vegetation types observed in the plots. Root content was evaluated at a top soil layer depth of 15 cm and included all living roots larger than 0.1 mm. * Estimated from Figure 3 in [40].
TypeRubus ChamaemorusEmpetrum Hermaphroditum
Common nameCloudberryMountain Crowberry
Descriptionperennial deciduous herblow-growing evergreen shrub
Biomass (%)1278
Aboveground biomass (gDW m 2 ) *855
Root depth (m)0.450.25
Root density in top layer (gm 2 )35030
Leaf C:N ratio2070
Aboveground C:N ratio *1040
Equivalent JULES simulations C N l o w R o o t 60 C N h i g h R o o t 25
Table 2. Table of simulations discussed in this paper. C represents the control simulation, N S represents fertiliser added near the surface; T F represents fertiliser added near the thaw-front; and N S T F represents fertiliser added both near the surface and deeper in the soil.
NameC:N RatioRoot Depth (m)TreatmentPresent/Future
C N h i g h R o o t 25 higher0.25Cboth
C N h i g h R o o t 25 higher0.25 N S present
C N h i g h R o o t 25 higher0.25 T F present
C N h i g h R o o t 25 higher0.25 N S T F present
C N h i g h R o o t 60 higher0.6Cboth
C N l o w R o o t 60 lower0.6Cboth
C N l o w R o o t 60 lower0.6 N S present
C N l o w R o o t 60 lower0.6 T F present
C N l o w R o o t 60 lower0.6 N S T F present
C N l o w R o o t 90 lower0.9Cboth
Table 3. The response ratio which is defined as the ratio of the potential amount of carbon that can be allocated to growth and spreading of the vegetation ( N P P p o t ) compared with the actual amount achieved in the natural state (dimensionless). A value of 1.0 indicates the vegetation is not nitrogen-limited. The larger the value, the more nitrogen-limited the vegetation.
CN high Root 25 CN low Root 60
C o n t r o l 1.93.3
N N e a r S u r f a c e + 1.02.8
N T h a w F r o n t + 1.92.4
N B o t h + 1.02.0
Table 4. Change in plant-available inorganic nitrogen (g[N] m 2 year 1 ) derived using Equation (4) from monthly JULES output, taken as 10-year annual averages for present (2000–2010) and future (2090–2100). In all cases, the maximum summer thaw depth is defined using the future simulations (i.e., >1.2 m). The left two columns show the change in available inorganic N using the present-day nitrogen cycle; so, they do not include any simulated change in total inorganic nitrogen as a result of a changing climate. The right two columns use the total inorganic nitrogen simulated for the future time period.
SpeciesPresent Total Inorganic NFuture Total Inorganic N
Std RootsDeeper RootsStd RootsDeeper Roots
C N h i g h R o o t 25 0.25.1−0.012.0
C N l o w R o o t 60 1.834.41.629.3
Publisher’s Note: MDPI stays neutral with regard to jurisdictional claims in published maps and institutional affiliations.

