Noise Annoyance in Urban Life: The Citizen as a Key Point of the Directives †


1
GTM-Grup de recerca en Tecnologies Mèdia, La Salle—Universitat Ramon Llull, Barcelona 08022, Spain
2
ISGlobal, 08003 Barcelona, Spain
*
Author to whom correspondence should be addressed.
†
Presented at the 1st International Electronic Conference on Environmental Health Sciences, 15 November–7 December 2018; Available online: https://iecehs-1.sciforum.net/.
Proceedings 2019, 6(1), 1; https://0-doi-org.brum.beds.ac.uk/10.3390/IECEHS-1-05648
Published: 14 November 2018
(This article belongs to the Proceedings of IECEHS 2018)
Abstract
:The improvement of the quality of life in the framework of the smart city paradigm cannot be limited to measuring objective environmental factors, but should also consider the assessment of the citizens’ health. Road traffic noise has been widely studied in terms of citizens’ annoyance and its impact on health, but other types of urban noise are usually outside of those analyses. Each node of a wireless acoustic sensor network can pick up street noise and can even record specific sounds that reach a higher equivalent level for study, but the most important thing for administration is whether certain types of noise annoy the citizen. In this work, we present the analysis and the selection of several audio samples collected by a wireless acoustic sensor network in an urban environment in order to conduct perceptive tests by several users. This a first approximation to the evaluation of the real perception of citizens’ annoyance with respect to the urban noise collected by a low-cost wireless acoustic sensor network.
1. Introduction
Noise is one of the main environmental health concerns [1,2], and its impact on social and economic aspects has been proven [3]. For this reason, during the last few years, many studies have analyzed the causes and consequences of this matter, such as the quantification of healthy life-years lost in Europe due to environmental noise [4], the analysis of health impacts related to urban environments and transport planning [5], and the new environmental noise guidelines in Europe [6]. Besides, several approaches followed by the administration are trying to monitor environmental noise and finding methods to solve this issue at different levels, e.g., in a city such as Barcelona (Catalonia) [7] and in a whole country such as the United States [8].
Most of the studies conducted have focused on defining the relation between objective acoustic measurements and the annoyance they cause [9], without taking into consideration that due to the human characteristics and habits, there might exist other acoustical characteristics that represent human perception, e.g., loudness. To attend to this fact, this work has been defined with the purpose of finding new ways of evaluating the impact of acoustic pollution on people in urban environments, which has been widely attributed to traffic noise by several authors [10,11]. To achieve this goal, a perceptive test will be designed to measure the degree of people’s annoyance with respect to different urban sounds and heir characteristics, using recorded anomalous noise events like sirens, people talking, dogs barking, etc. For this purpose, a first study consisting of both analysis and selection of the audio has been conducted using the LIFE DYNAMAP project (http://www.life-dynamap.eu) data [12,13]. The most relevant anomalous noise events’ acoustic pieces have been selected and their parameters evaluated, maintaining the requirements of recording location and sensor calibration. The final goal of the present study is to evaluate the relationship between measurable metrics of the anomalous noise events and the perception of those by the citizens, in terms of annoyance. To establish which are the best variables under test, a wide literature search was done, and finally, it was decided to focus on two of the baseline parameters defined by Zwicker: loudness and sharpness [14], taking into account the duration of the signal.
The paper is structured as follows. Section 2 describes the procedure followed in this work: the database is described in Section 2.1; the audio characterization and measurements are defined in Section 2.2; and the design of the perceptive tests is explained in Section 2.3. In Section 3, the results obtained by the perceptive tests are presented and discussed.
2. Methods
In this section, an analysis of the audio samples is conducted in order to select those used in the tests. The anomalous noise events that define the database of this project came from a set of recordings obtained by 24 low-cost sensors that the LIFE DYNAMAP project has installed in several locations of District 9 in the city of Milan [12,15]. The information recorded by these sensors has previously been listened to and manually labeled by experts, taking into account the several types of noise identified in each section of the recordings [16]. A summary document is available for each sensor, detailing the number of sounds of each type and the duration.
2.1. Database Definition
The first step in this research is to choose the types of noise under study. Based on the available information about the labels of each sensor, a first selection is applied consisting of deleting all complex sounds, i.e., all those containing a mix of different noise types. The presence of several noise typologies in the same audio does not allow a proper discrimination. The second step consisted of selecting the noise events that have a relevant presence in an urban environment, but taking into account the types of noise with enough representation in the dataset. The final types of noise selected were: horns, people talking, sirens, truck towing sounds, doors, dog barks, roadworkplease check that the correction did not change your meaning , airplanes, birds, and brakes.
The analysis of the data can only be done in an intrasensorial way, that is to say, the sounds were compared to the other sounds collected in the same sensor. This restriction has been applied to maintain the acoustic characteristics of the surroundings of each sensor, which had a clear influence on the final recorded piece of audio. If the comparison were done with audio belonging to different sensors, the results could be conditioned by the acoustics of each particular sensor, and that fact could invalidate the results. Taking this into account and that the number of sensors is quite extensive, a detailed analysis was carried for each type of noise and sensor. The choice of the noise events and sensors to be included in each test has been done based on the total duration of each noise type; thus, the acoustic environment of each sensor location was respected.
After analyzing the recording seconds, four sensors were selected of the twenty-four sensors available, as summarized in Table 1. The events captured in these four recording locations, which have been named hb115, hb124, hb127, and hb133, offer enough samples from each type and the widest variety of loudness measurements. See more details about the distribution of the sensors in District 9 of the city of Milan in [17].
Once the event database has been defined and before analyzing the samples in detail, the files have been shortened in duration to make them suitable for the perceptive tests. Thus, all files presented a duration of four seconds or less, short enough to avoid fatigue in the test users and long enough to identify the sound clearly. In order to perform this operation, a sliding window of four seconds has been applied with steps of one second, in order to increase the number of available audio samples.
2.2. Measurement of Sound Characteristics
Once the database was correctly defined, the next step consisted of calculating the results of the sound attributes mentioned before, loudness and sharpness, apart from other useful measurements, i.e., duration, energy, power, and bandwidth.
According to Zwicker et al. (2013) [14], loudness belongs to the category of intensity sensations, but it is not only a sensation value, it belongs somewhere between sensation and physical values. The unit to measure this loudness sensation is called sone, and it is considered that 1 sone corresponds to a 1-kHz tone with a level of 40 dB. To calculate this parameter, we searched for a MATLAB toolbox that contained the implementation. After an exhaustive search, we decided to calculate the loudness with a toolbox based on a Zwicker’s proposal (http://genesis-acoustics.com/en/loudness_online-32.html). The main function of this toolbox receives as parameters the signal, the sampling frequency, and the type of field; in our case, it will be a free-field. In order to check that the loudness measure obtained from the chosen toolbox was reliable, several reference values were tested. According to Kinsler et al. (1999) [18], a tone of 1 kHz and with a level of intensity of 60 dB has a loudness of 4.7 sone and 60 phon; thus, this tone was created with MATLAB, and the result was 4.12 sone and 60.42 phon, proving it was a reliable code.
Besides, the sharpness is a measure of the high frequency content of a sound; the greater the proportion of high frequencies, the sharper the sound is. It is worth mentioning that sharpness is a sensation that can be considered separately from loudness, so both parameters can be analyzed independently [14]. The unit used for its measurement is called acum, and the reference sound producing 1 acum is a narrow-band noise assuming only one critical-band wide at a center frequency of 1 kHz having a level of 60 dB [14]. To calculate the sharpness of each sound, a MATLAB code has also been used; in this case, it was obtained from the website of the University of Salford (https://www.salford.ac.uk/research/sirc/research-groups/acoustics/psychoacoustics). As in the previous case, in order to verify its reliability, tests were performed to confirm that the code worked correctly. In this case, the function that will allow us to perform the calculation requires as a parameter the specific loudness, a value that is obtained from the function that has been previously used to calculate the loudness; thus, no extra information is needed. With the same tone created before, we obtained its specific loudness by applying the code, and the value returned by the sharpness function was 1020 acum, which is similar to the required value.
2.3. Perceptive Test Design
In order to analyze the existence of a relation between the sharpness and annoyance of the sounds, a perceptive test was designed. In order to achieve this, it was considered that defining binary tests, i.e., with only two possible answers, was the best option. Thus, the users had to answer this question “Indicate which one of these two sounds causes you more annoyance” by selecting Audio A or B.
The decision of which sounds from our database should be used to design this test was conducted so that the other sound features measured remained stable and could not affect the results. That is to say, each pair of audio files that was within the same part of the test would have the same loudness, be the same type of sound, and come from the same sensor, minimizing in this way any external variation. Having this limitation in mind and that this type of test can be done briefly, a total of sixteen questions were designed, that is 32 audio samples were selected from the previously-defined database.
Once the audio samples were selected, the test was designed with a tool that let us implement the type of test defined [19]. This is an open-code tool, so some changes were applied to make the interface as intuitive as possible.
In order to collect the results of the test later, this was uploaded on a server of la Salle-University Ramon Llull and sent to a great variety of contacts from different ages and lifestyles. The results collected from the server showed that a total amount of 79 people had answered the whole test.
3. Results and Discussion
In this section, we will detail a first approach to the perceptive test conducted, paying special attention to the distribution of the loudness and sharpness in each sensor used.
3.1. Loudness and Sharpness Distribution of the Data Used
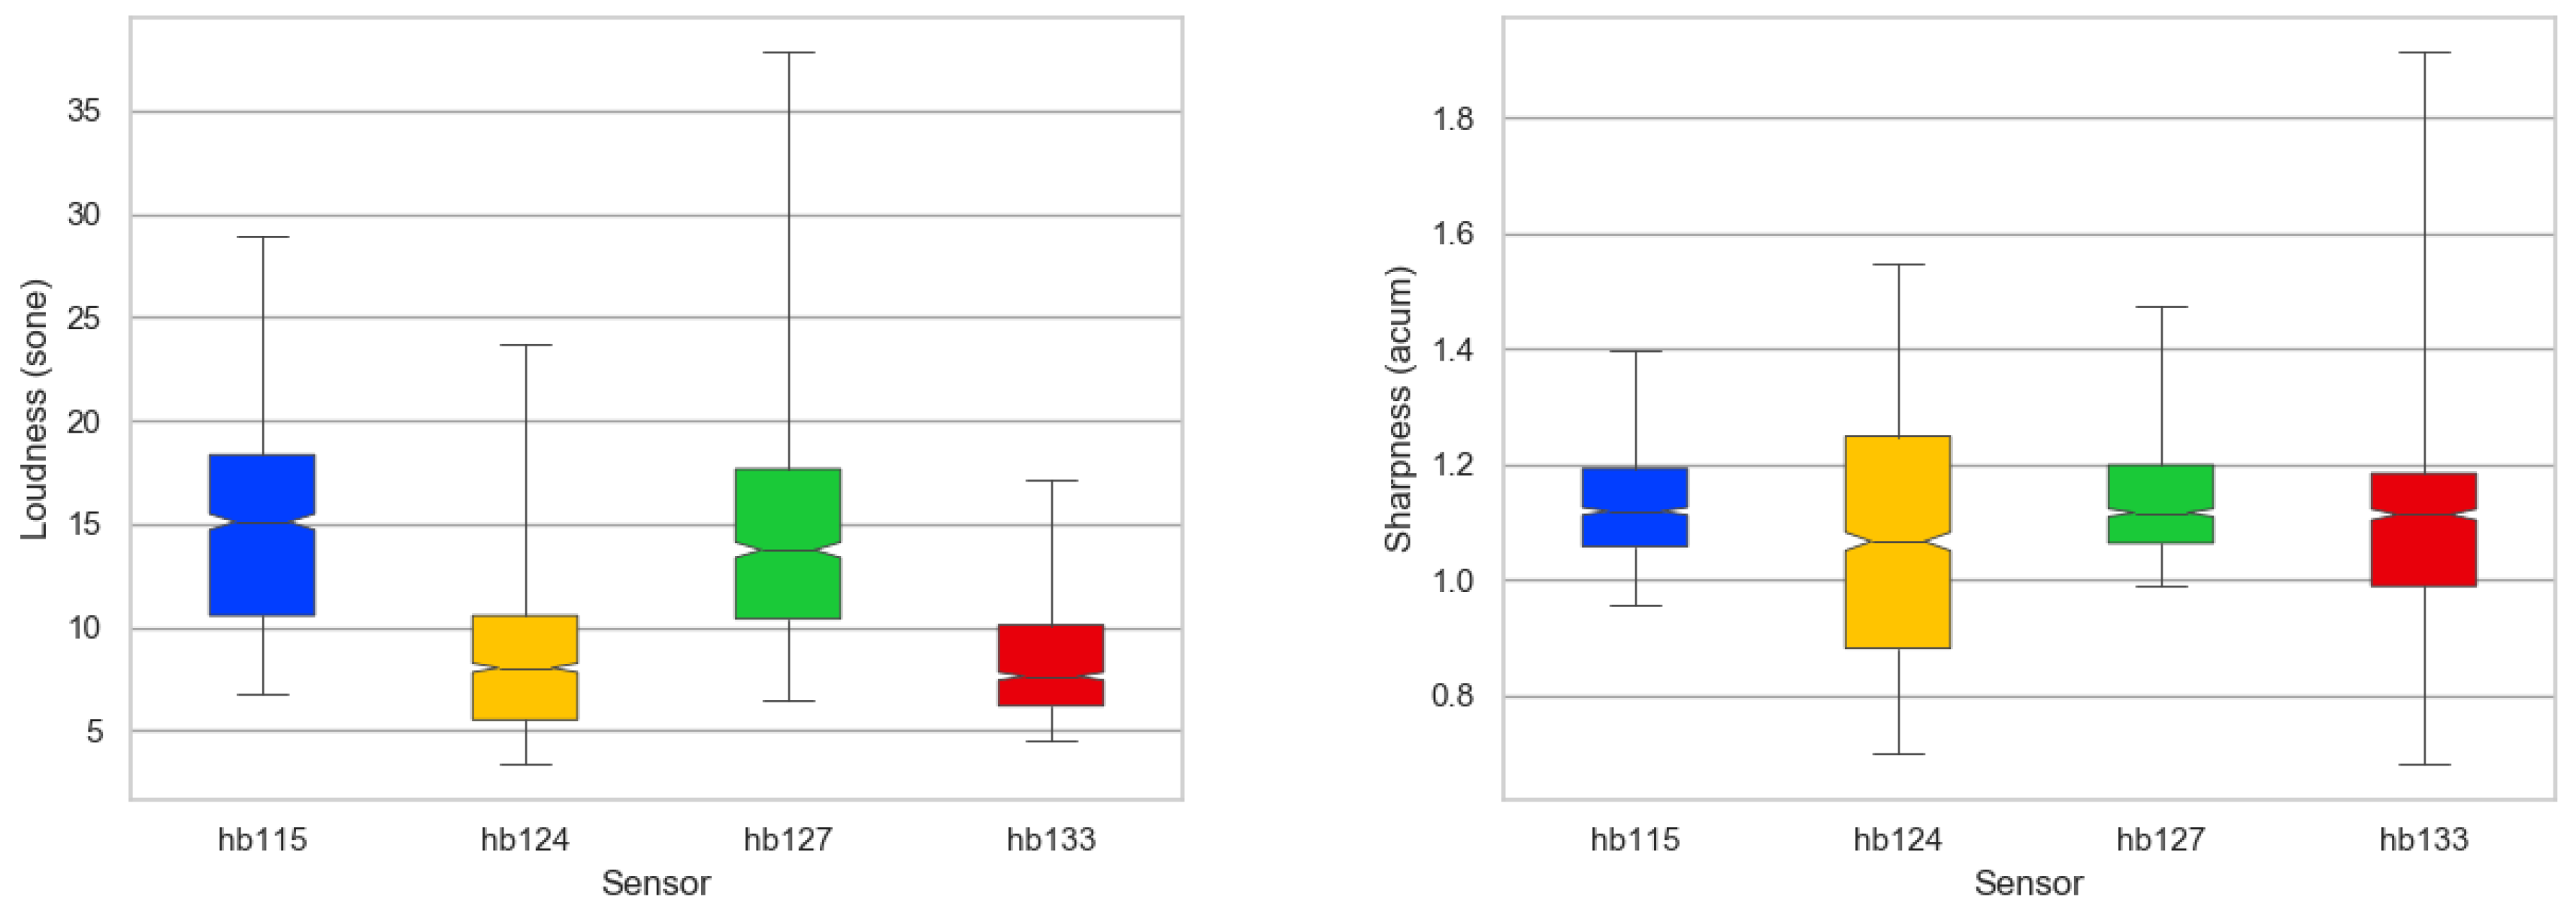
The measurement of sharpness and loudness at the different sensors led to the results displayed in Figure 1. These results show that loudness values oscillate, mainly, between 6 and 18 sone, and sharpness results are not that scattered, the first and second quartile results going from 0.9–1.3 acum.
3.2. Preliminary Sharpness Results
In a first rough analysis of the test results, a set of circular graphs, shown in Figure 2, were made to evaluate the aggregated results. We can observe there a binary comparison, with the results of higher annoyance in blue if they correspond to the higher sharpness, and in orange if they correspond to the lower sharpness. A first conclusion can be drawn about the relationship between sharpness and annoyance, which is that there is not a direct relation since in some cases, the most frequently-selected answer was the one referring to the sound with more sharpness, ad in others, the opposite was observed; there also were cases in which the answers were divided almost equally (around 50% for each answer).
Once having determined the preliminary non-existence of a direct relation between sharpness and annoyance, a second analysis was done. This consisted of studying if the fact that a sound is of a certain typology annoys the user more when it has a higher sharpness or when it is lower. This second analysis would only be made in those sound typologies for which we have at least two different tests, and in order to confirm the theories that will be set, it would be necessary to perform a study focused on this goal. In Figure 2, we can appreciate that for the parts of the test with brakes, birds, and horns, the sound of the pair that had higher sharpness resulted in being more annoying for the test users. On the other side, airplanes and roadwork results tended to be the opposite, i.e., lower sharpness seemed to be more annoying. In the next step, we will analyze the relation between loudness and annoyance in depth.
4. Conclusions
The analysis of the preliminary results gives us a first conclusion: the test answers show that there is not a direct relation between sharpness and annoyance. Nevertheless, it seems that the sound typology can have a relation with the annoyance and sharpness, but to obtain a clear conclusion, it will be necessary to define new tests taking into account the distinct typologies found in the taxonomy. The next step in future studies will consist of analyzing them separately, differentiating them by gender, age, and type of residential zone where the survey respondents live, to evaluate if these variables have an influence on the results. Other studies including both loudness and sharpness may be considered in wider annoyance tests.
Author Contributions
A.L.-T. programmed the code and evaluated the results. R.M.A.-P. is the team leader for the DYNAMAP project, contributed to the data collection, and has also contributed to the design of the experiments. F.O. worked with the data coming from the DYNAMAP project and contributed to the design of the experiments. M.F. contributed to the design of the experiments in terms of health.
Funding
Ferran Orga thanks the support of the European Social Fund and the Secretaria d’Universitats i Recerca del Departament d’Economia i Coneixement of the Catalan Government for the pre-doctoral FIGrant No. 2018FI_B1_00175.
Acknowledgments
The research presented in this work has been partially supported by the LIFE DYNAMAP project (LIFE13 ENV/IT/001254). The authors would also like to thank the support of Marc Freixes in the platform test design.
Conflicts of Interest
The authors declare no conflict of interest.
References
- Guite, H.; Clark, C.; Ackrill, G. The impact of the physical and urban environment on mental well-being. Public Health 2006, 120, 1117–1126. [Google Scholar] [CrossRef] [PubMed]
- Hänninen, O.; Knol, A.B.; Jantunen, M.; Lim, T.A.; Conrad, A.; Rappolder, M.; Carrer, P.; Fanetti, A.C.; Kim, R.; Buekers, J.; et al. Environmental burden of disease in Europe: assessing nine risk factors in six countries. Environ. Health Perspect. 2014, 122, 439. [Google Scholar] [CrossRef] [PubMed]
- Goines, L.; Hagler, L. Noise Pollution: A Modern Plague. South. Med. J. 2007, 100, 287–294. [Google Scholar] [CrossRef] [PubMed]
- WHO Regional Office for Europe. Burden of disease from environmental noise: Quantification of healthy life years lost in Europe. In Burden of Disease from Environmental Noise: Quantification of Healthy Life Years Lost in Europe; WHO Regional Office for Europe: Geneva, Switzerland, 2011; p. 126. [Google Scholar]
- Mueller, N.; Rojas-Rueda, D.; Basagaña, X.; Cirach, M.; Cole-Hunter, T.; Dadvand, P.; Donaire-Gonzalez, D.; Foraster, M.; Gascon, M.; Martínez, D.; et al. Health impacts related to urban and transport planning: A burden of disease assessment. Environ. Int. 2017, 107, 243–257. [Google Scholar] [CrossRef]
- World Health Organization Environmental Noise Guidelines for the European Region; Technical Report; World Health Organization: Geneva, Switzerland, 2018.
- Camps, J. Barcelona noise monitoring network. In Proceedings of the Euronoise, Maastricht, The Netherlands, 31 May–3 June 2015; pp. 218–220. [Google Scholar]
- Hammer, M.S.; Swinburn, T.K.; Neitzel, R.L. Environmental noise pollution in the United States: developing an effective public health response. Environ. Health Perspect. 2014, 122, 115–119. [Google Scholar] [CrossRef] [PubMed]
- Berglund, B.; Lindvall, T.; Schwela, D.H. Guidelines for Community Noise; World Health Organization: Geneva, Switzerland, 1995. [Google Scholar]
- Botteldooren, D.; Dekoninck, L.; Gillis, D. The influence of traffic noise on appreciation of the living quality of a neighborhood. Int. J. Environ. Res. Public health 2011, 8, 777–798. [Google Scholar] [CrossRef] [PubMed]
- Jakovljevic, B.; Paunovic, K.; Belojevic, G. Road-traffic noise and factors influencing noise annoyance in an urban population. Environ. Int. 2009, 35, 552–556. [Google Scholar] [CrossRef] [PubMed]
- Sevillano, X.; Socoró, J.C.; Alías, F.; Bellucci, P.; Peruzzi, L.; Radaelli, S.; Coppi, P.; Nencini, L.; Cerniglia, A.; Bisceglie, A.; et al. DYNAMAP—Development of low cost sensors networks for real time noise mapping. Noise Mapp. 2016, 3, 172–189. [Google Scholar] [CrossRef]
- Orga, F.; Socoró, J.C.; Alías, F.; Alsina-Pagès, R.M.; Zambon, G.; Benocci, R.; Bisceglie, A. Anomalous noise events considerations for the computation of road traffic noise levels: The DYNAMAP’s Milan case study. In Proceedings of the 24th International Congress on Sound and Vibration, London, UK, 23–27 July 2017; pp. 23–27. [Google Scholar]
- Zwicker, E.; Fastl, H. Psychoacoustics: Facts and Models; Springer Science & Business Media: Berlin/Heidelberg, Germany, 2013; Volume 22. [Google Scholar]
- Socoró, J.C.; Alías, F.; Alsina-Pagès, R.M. An Anomalous Noise Events Detector for Dynamic Road Traffic Noise Mapping in Real-Life Urban and Suburban Environments. Sensors 2017, 17, 2323. [Google Scholar] [CrossRef] [PubMed]
- Alías, F.; Socoró, J.C. Description of anomalous noise events for reliable dynamic traffic noise mapping in real-life urban and suburban soundscapes. Appl. Sci. 2017, 7, 146. [Google Scholar] [CrossRef]
- Zambon, G.; Roman, H.E.; Smiraglia, M.; Benocci, R. Monitoring and Prediction of Traffic Noise in Large Urban Areas. App. Sci. 2018, 8, 251. [Google Scholar] [CrossRef]
- Kinsler, L.E.; Frey, A.R.; Coppens, A.B.; Sanders, J.V. Fundamentals of acoustics. Fundamentals of Acoustics, 4th ed.; Kinsler, L.E., Frey, A.R., Coppens, A.B., Sanders, J.V., Eds.; Wiley-VCH: Weinheim, Germany, 1999; p. 560. ISBN 0-471-84789-5. [Google Scholar]
- Jillings, N.; Moffat, D.; De Man, B.; Reiss, J.D. Web Audio Evaluation Tool: A browser-based listening test environment. In Proceedings of the 12th Sound and Music Computing Conference, Maynooth, Ireland, 26 July–1 August 2015. [Google Scholar]
Figure 1.
Boxplot for the loudness distribution (left) and sharpness distribution (right).

Figure 2.
Sharpness distribution.


Table 1.
Recording seconds for each sensor according to the definitions of the DYNAMAP project and classified by sound typology.
Table 1.
Recording seconds for each sensor according to the definitions of the DYNAMAP project and classified by sound typology.
| hb115 | hb124 | hb127 | hb133 | |
|---|---|---|---|---|
| horn | 96.7 | 26.0 | 47.4 | 33.3 |
| people | 323.1 | 670.5 | 755.1 | 407.5 |
| siren | 203.0 | 193.9 | 234.6 | 84.6 |
| door | 282.6 | 165.6 | 182.1 | 128.5 |
| dog | 1.4 | 109.5 | 35.2 | 47.1 |
| roadwork | 658.3 | 0.0 | 261.7 | 360.0 |
| airplane | 17.6 | 765.8 | 21.7 | 400.9 |
| bird | 5.4 | 562.3 | 27.8 | 504.9 |
| braking | 101.9 | 33.9 | 296.8 | 34.8 |
© 2018 by the authors. Licensee MDPI, Basel, Switzerland. This article is an open access article distributed under the terms and conditions of the Creative Commons Attribution (CC BY) license (https://creativecommons.org/licenses/by/4.0/).
Share and Cite
MDPI and ACS Style
Labairu-Trenchs, A.; Alsina-Pagès, R.M.; Orga, F.; Foraster, M. Noise Annoyance in Urban Life: The Citizen as a Key Point of the Directives. Proceedings 2019, 6, 1. https://0-doi-org.brum.beds.ac.uk/10.3390/IECEHS-1-05648
AMA Style
Labairu-Trenchs A, Alsina-Pagès RM, Orga F, Foraster M. Noise Annoyance in Urban Life: The Citizen as a Key Point of the Directives. Proceedings. 2019; 6(1):1. https://0-doi-org.brum.beds.ac.uk/10.3390/IECEHS-1-05648
Chicago/Turabian StyleLabairu-Trenchs, Alexandra, Rosa Ma Alsina-Pagès, Ferran Orga, and Maria Foraster. 2019. "Noise Annoyance in Urban Life: The Citizen as a Key Point of the Directives" Proceedings 6, no. 1: 1. https://0-doi-org.brum.beds.ac.uk/10.3390/IECEHS-1-05648