The Lean Six Sigma Algorithm—A Roadmap for Implementation †

Faculty of Machine Building, Technical University of Cluj-Napoca, 400114 Cluj-Napoca, Romania
*
Author to whom correspondence should be addressed.
†
Presented at the 14th International Conference on Interdisciplinarity in Engineering—INTER-ENG 2020, Târgu Mureș, Romania, 8–9 October 2020.
Proceedings 2020, 63(1), 24; https://0-doi-org.brum.beds.ac.uk/10.3390/proceedings2020063024
Published: 15 December 2020
(This article belongs to the Proceedings of The 14th International Conference on Interdisciplinarity in Engineering—INTER-ENG 2020)
Abstract
:In competitive environments, such as batch manufacturing, Lean and Six Sigma offer the proper tools as a paramount advantage to the companies who choose to adopt their principles. With the main purpose of decreasing the failure rate of continuous improvement projects due to high abandon levels across the globe, a Lean Six Sigma algorithm has been generated, tested and validated in the pharmaceutical industry. The present paper will reveal the core implementation steps regarding the suggested algorithm, the critical tools used and results obtained through implementing the proposed roadmap.
Keywords:
Lean manufacturing; Six Sigma; pharma industry; algorithm; roadmap; project structure; failure1. Introduction
Continuous improvement culture may be referred to as the pillar for enhanced results and superior work ethics over time. Lean Manufacturing and Six Sigma reveal the proper tools to be used for starting and sustaining a continuous improvement culture across an organization. While the Lean Six Sigma tools are already available, a detailed roadmap for applying the most result-oriented ones in batch manufacturing areas is missing, according to our knowledge [1,2]. An algorithm for implementing the Lean Manufacturing and Six Sigma tools in a batch manufacturing environment has been suggested in a separate paper.
The generated algorithm was tested and validated in the pharmaceutical industry at the bottle packaging line of suspensions, a secondary packaging area. The purpose of the current paper is to reveal the methodology used for the implementation and results obtained through the algorithm. With validation taking place in the pharmaceutical industry, the main scope of the algorithm is to decrease the failure rate of continuous improvement projects in several batch manufacturing industries by offering a clear roadmap to solve universally faced issues in these fields. Having an algorithm to follow, the missing dedicated time for projects, the lack of next steps to adhere to and continuous roadblocks will affect a continuous improvement project until failure.
2. Theoretical Background
Lean Manufacturing (LM) and Six Sigma (SS) are continuous improvement methods that seek process improvement in a structured manner, using specific tools to obtain results [3,4]. Many of the continuous improvement projects using Lean Six Sigma tools fail due to a lack of a clear roadmap to apply their tools [1,2]. Process standardization and waste (Muda) removal from the process in order to enhance work efficiency are the main focus areas of Lean Manufacturing and Six Sigma [5,6]. Both LM and SS pursue the same scope, the tools and methodologies for achieving the results being specific for each of them, with a few exceptions such as Pareto charts, Control Charts, and 5Why [6]. Having the same scope of enhancing the status quo of processes through using different tools, the two methods present a potent synergism when combined [7,8,9,10,11,12].
3. Materials and Methods
3.1. A Helicopter View
For the continuous improvement project and validation of its results, the proposed algorithm was implemented in the pharmaceutical industry in the secondary packaging area of suspensions. For obtaining the overall results of the project, the algorithm presented in a separate paper was entirely followed, relying on the DMAIC (Define Measure Analyze Improve Control) structure and following the suggested tools and techniques. Only the highlights of the key project parts are emphasized in the present paper.
3.1.1. Process Mapping and Value-Added Activities
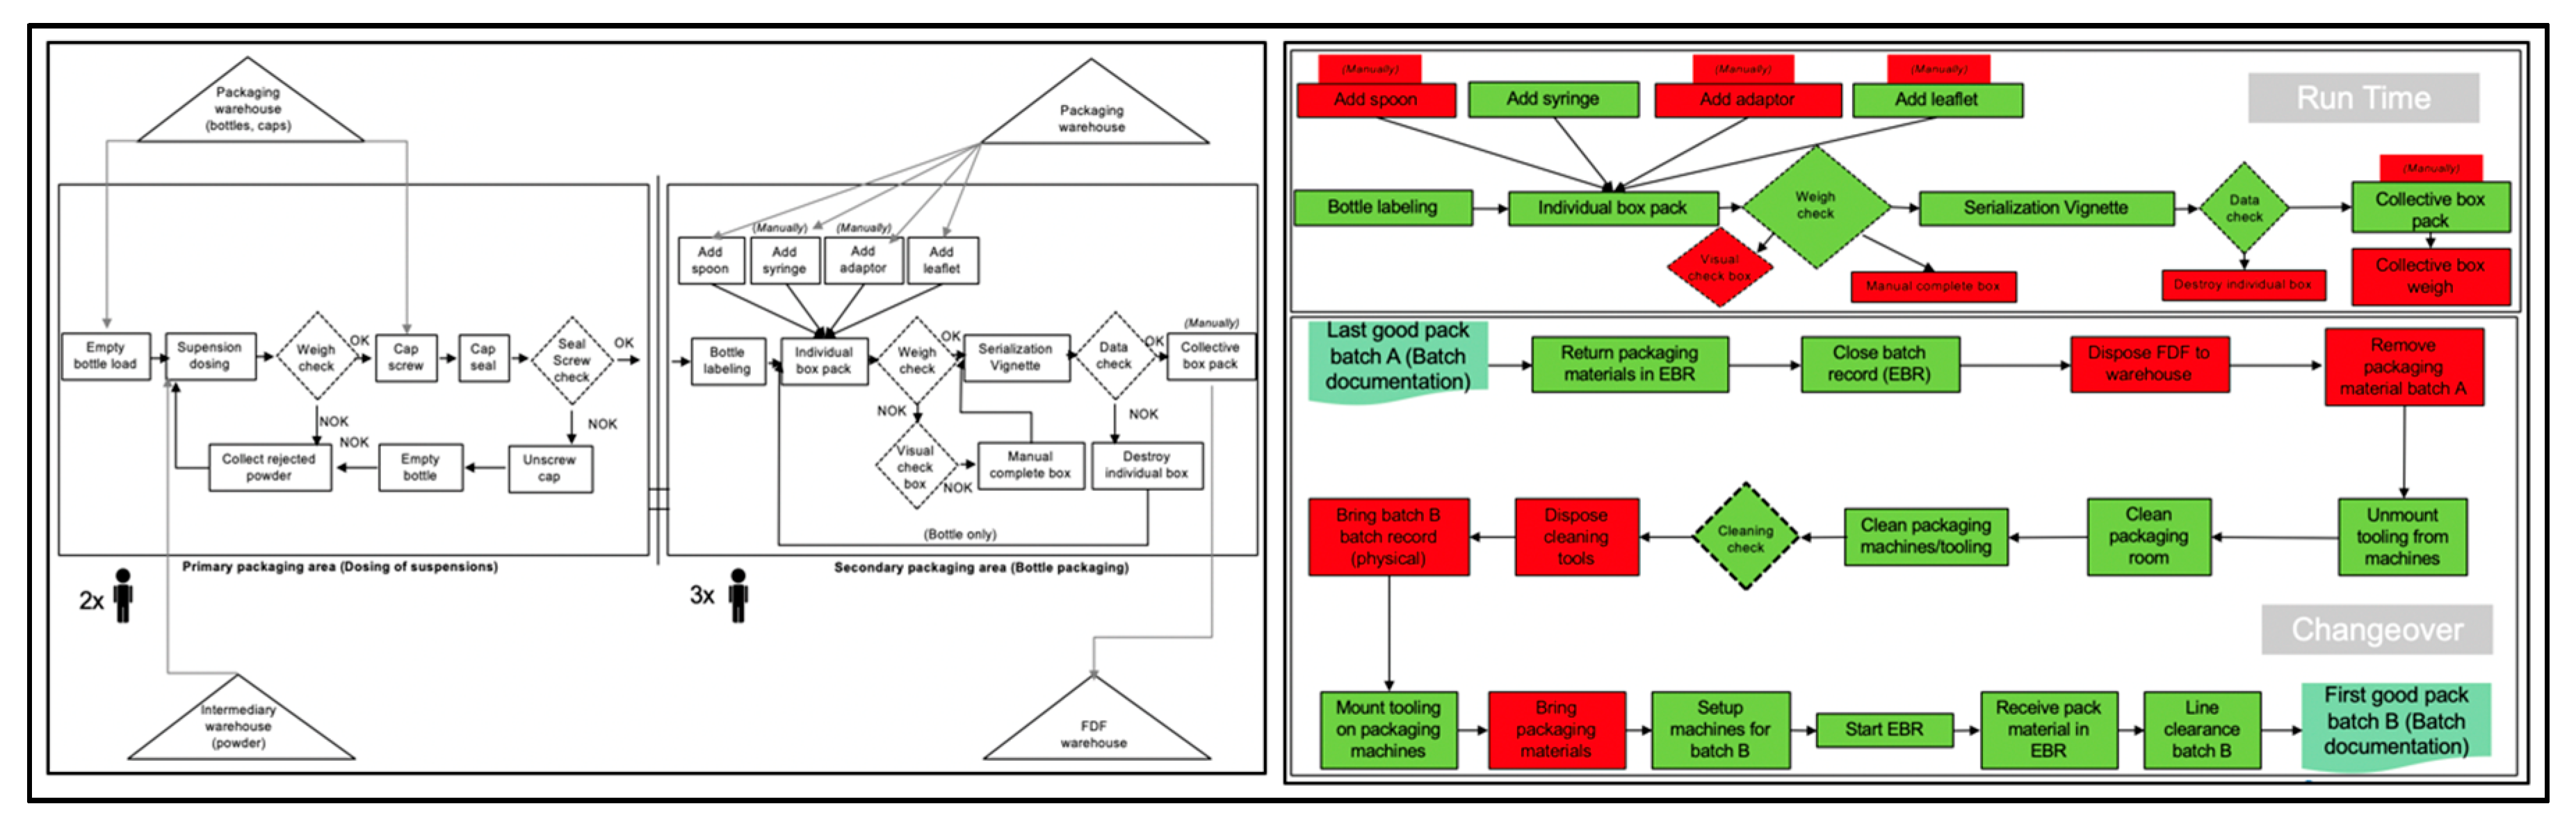
Following the Define phase, where the SMART (Specific Measurable Achievable Realistic Time-Bound) project scope, objectives and benefits are set, the Analyze phase should include, in a compulsory manner, the process of mapping and defining the value-added activities, as represented in Figure 1. By being able to establish the process map, the likely constraints will arise and guide the root cause investigation in the proper direction [13,14,15,16,17,18]. Process mapping is not as accurate or detailed as Value Stream Mapping; nonetheless, it represents a key and straightforward step to identifying the quick wins. Relying on the process map, the value-added activities were effortlessly identifiable, and we could establish the steps that were not adding value to the process and could be tagged or treated as Muda [19].
3.1.2. Changeover Standardization
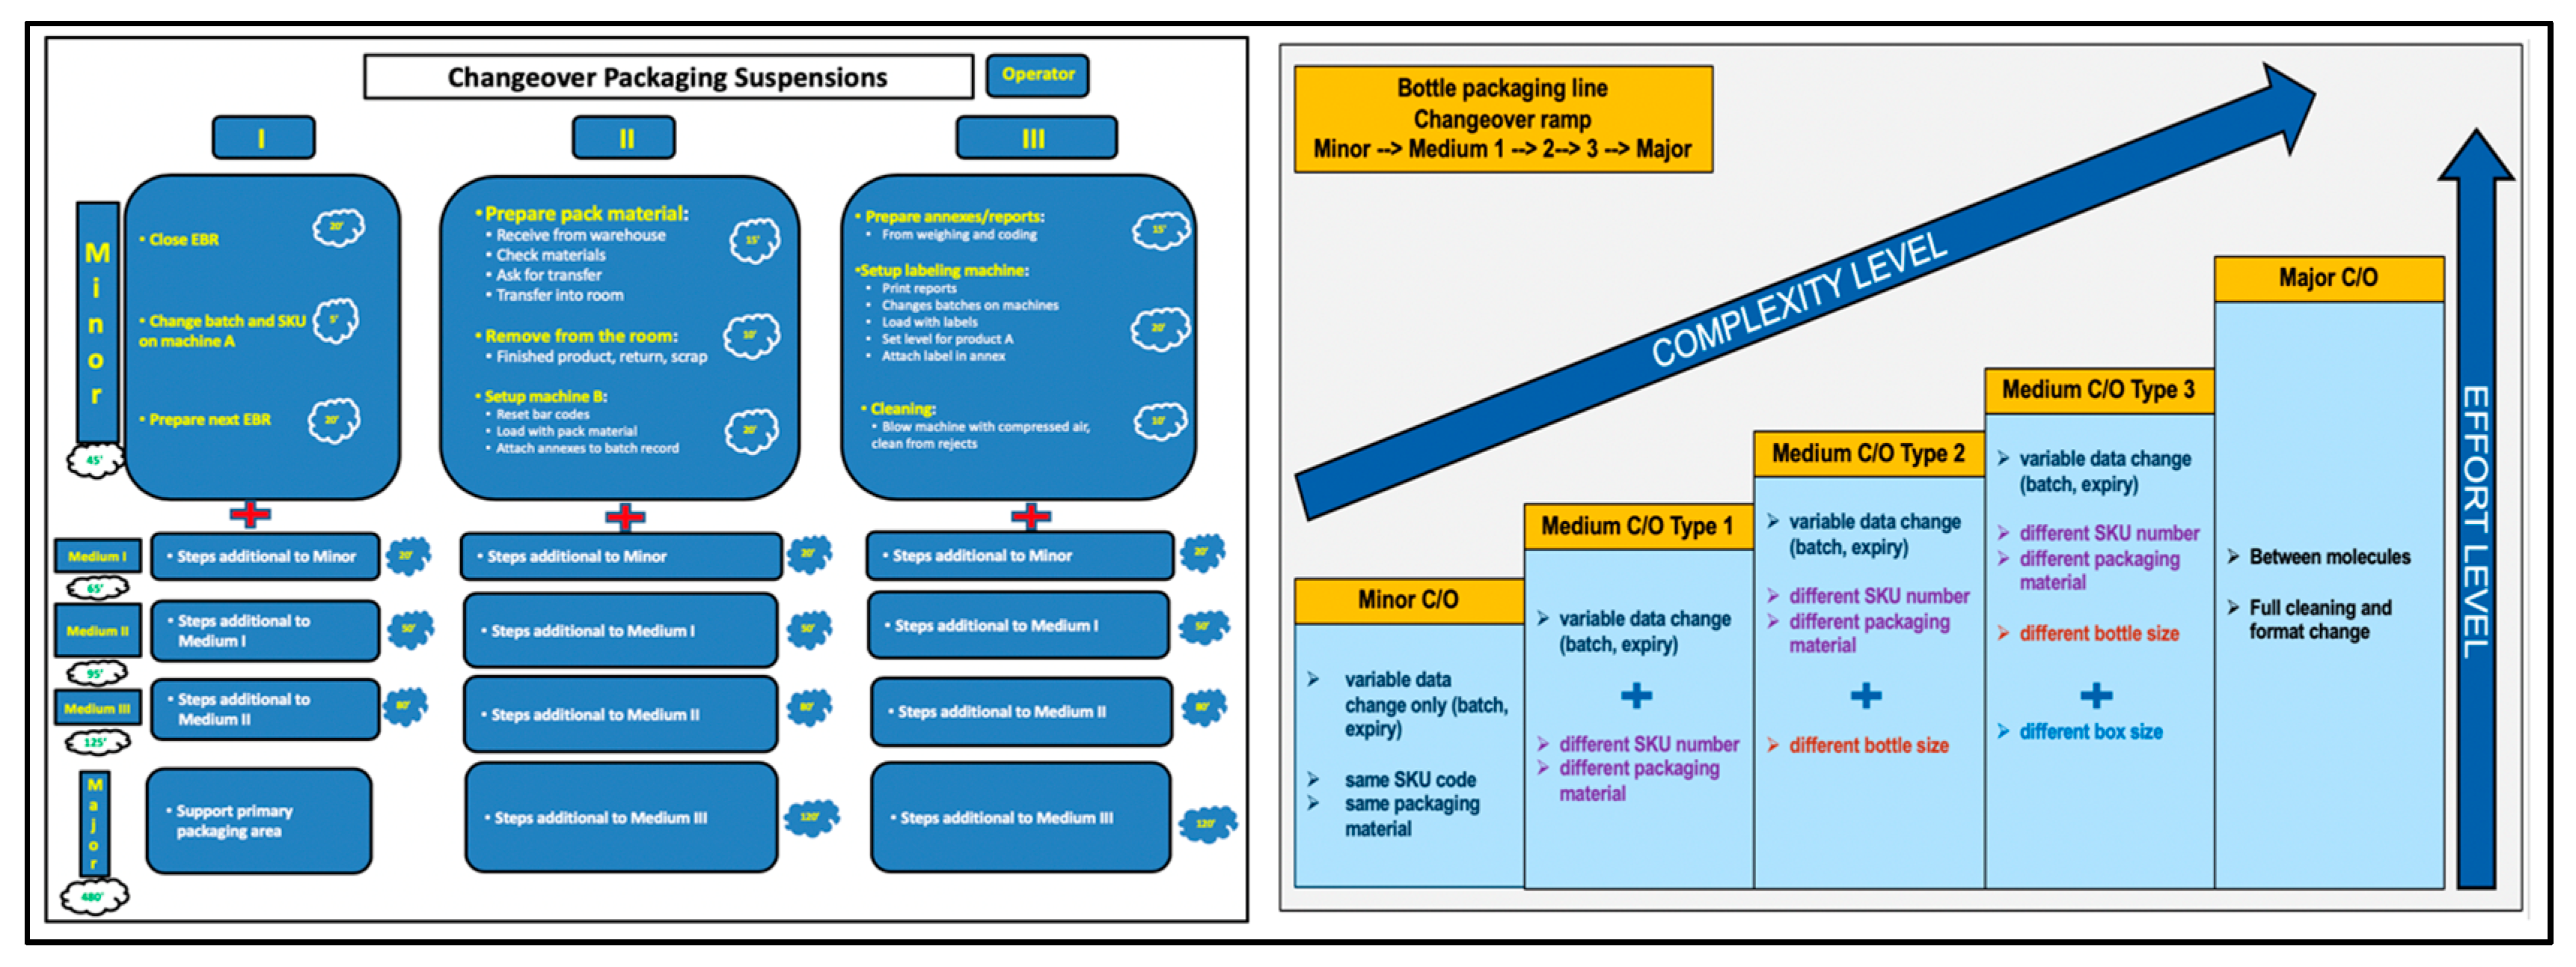
In a batch manufacturing setup, the changeovers absorb a significant part of the planned production time. Any improvement of the changeover times will directly translate into additional uptime for the production asset. In the Analyze and Improvement phases, the changeover types had to be clearly identified and separated for a leaner standardization and improvement process. The establishment of a changeover ramp, such as the one represented in Figure 2, supported the proper understanding of the process. By thoroughly understanding the overall process and its key aspects in the Analyze phase, a detailed task list with target times for each process step (or category) could be defined in the improvement phase, as exemplified in Figure 2. For assuring an optimal acceptance from the directly productive personnel, quickly understandable visual representations were used, which incorporate figures, schemes and target times in a colorful and approachable manner. Any scheme, graph or work instruction should include color-coding in order to enhance the approachability for operators and supervisors, leading to increased openness in adhering to a newly established workflow.
3.1.3. Visual Control
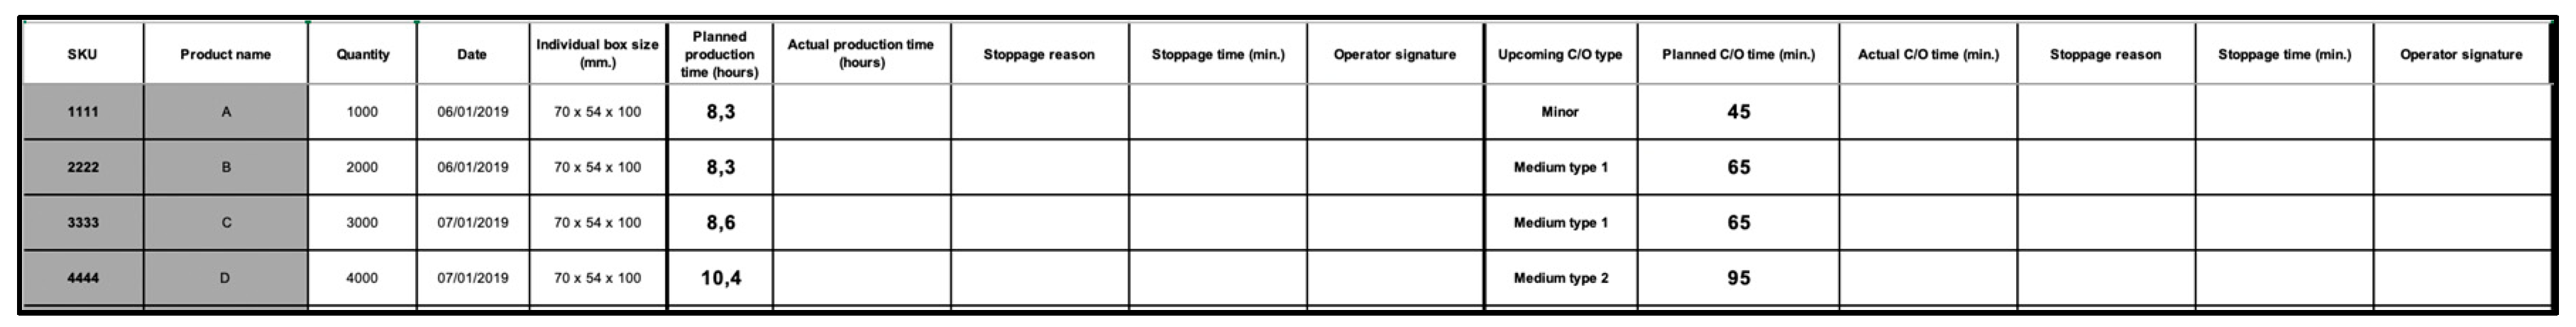
In the Improvement phase of the project, under the umbrella of Visual Management, a dispatch list was generated, see Figure 3, which reflected the production plan for the entire week. The list was displayed weekly in the production area and contained, for each batch, the critical information to be identified: target and actual run and changeover times, upcoming changeover types and issues faced for each batch. The list leveraged the responsibility among operators, traced the manufacturing issues per batch, and displayed the production status on a shift basis. The target values were set by the planner or project responsible and the actual values, shift issues and signatures were filled in by operators.
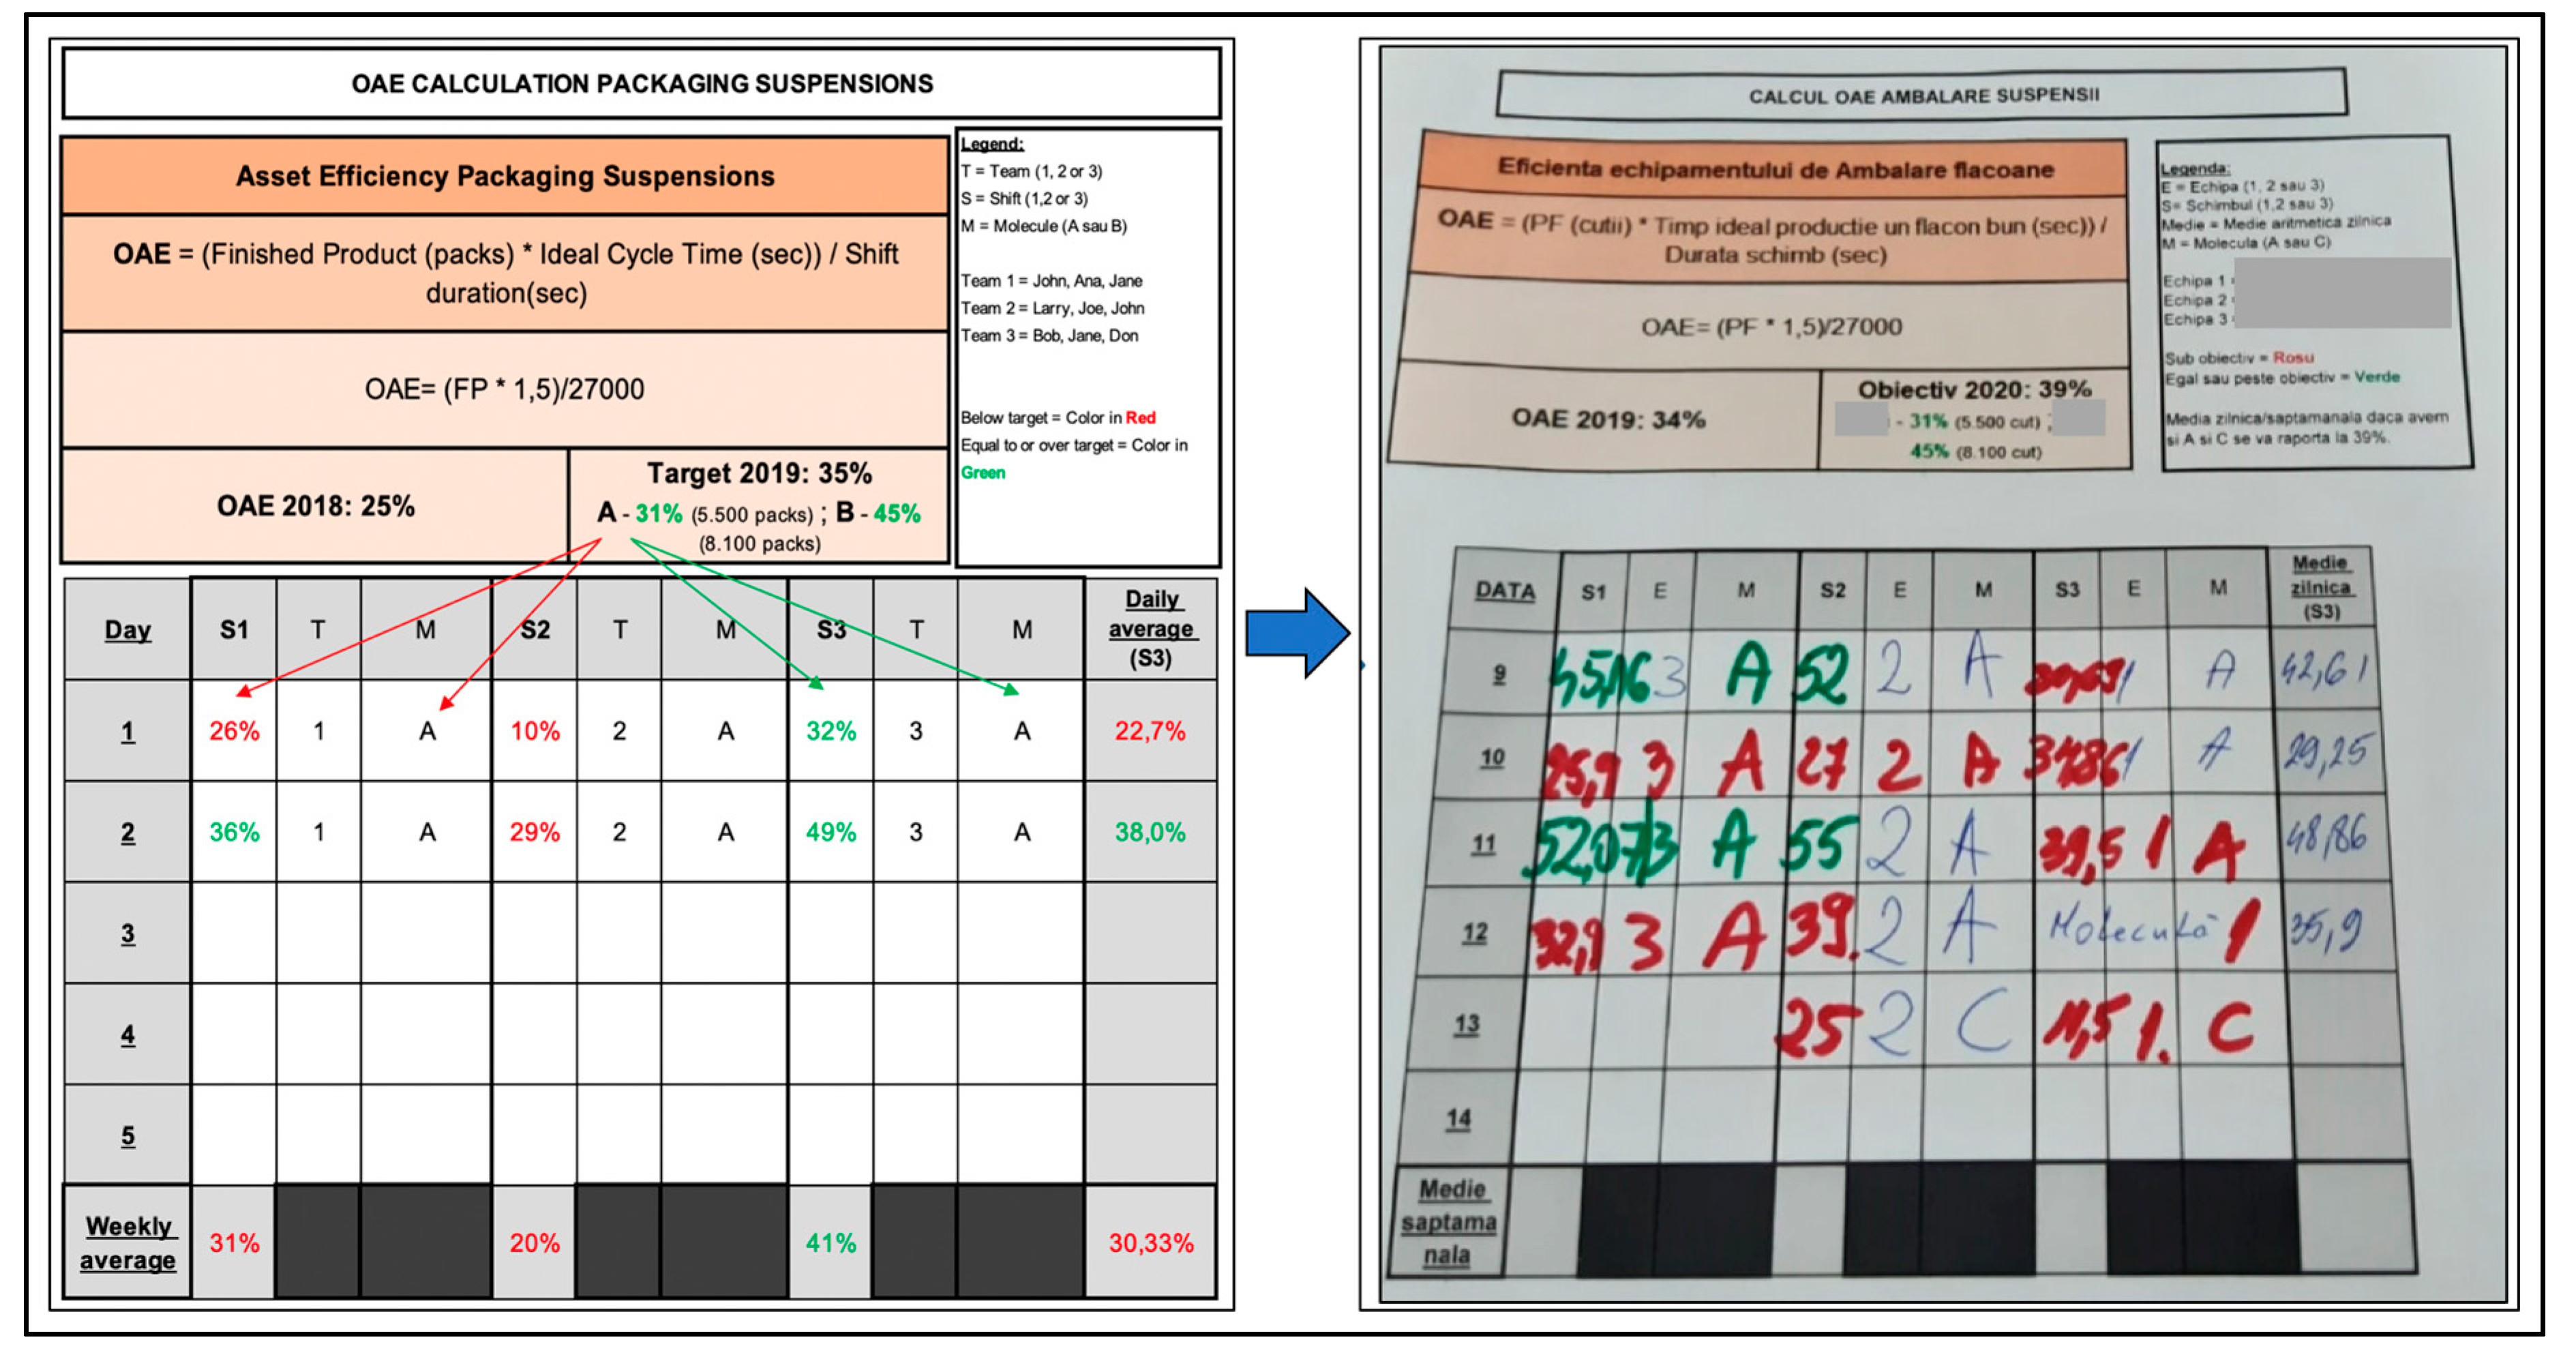
The OAE (Overall Asset Effectiveness) tracking sheet, represented in Figure 4 and displayed on the shop floor, raised the awareness among operators and shift supervisors, color coded each shift’s status and output, increased productive competition between teams and highlighted key issues faced in every shift. For each molecule (A or B) a target OAE was established, which determined the color code (red or green) for the manual input of the operators. For a visual process control purpose, every team of operators manually calculated the OAE value on the shop floor tracking sheet. The weekly and daily averages were discussed at shift handover to identify possible corrective actions.
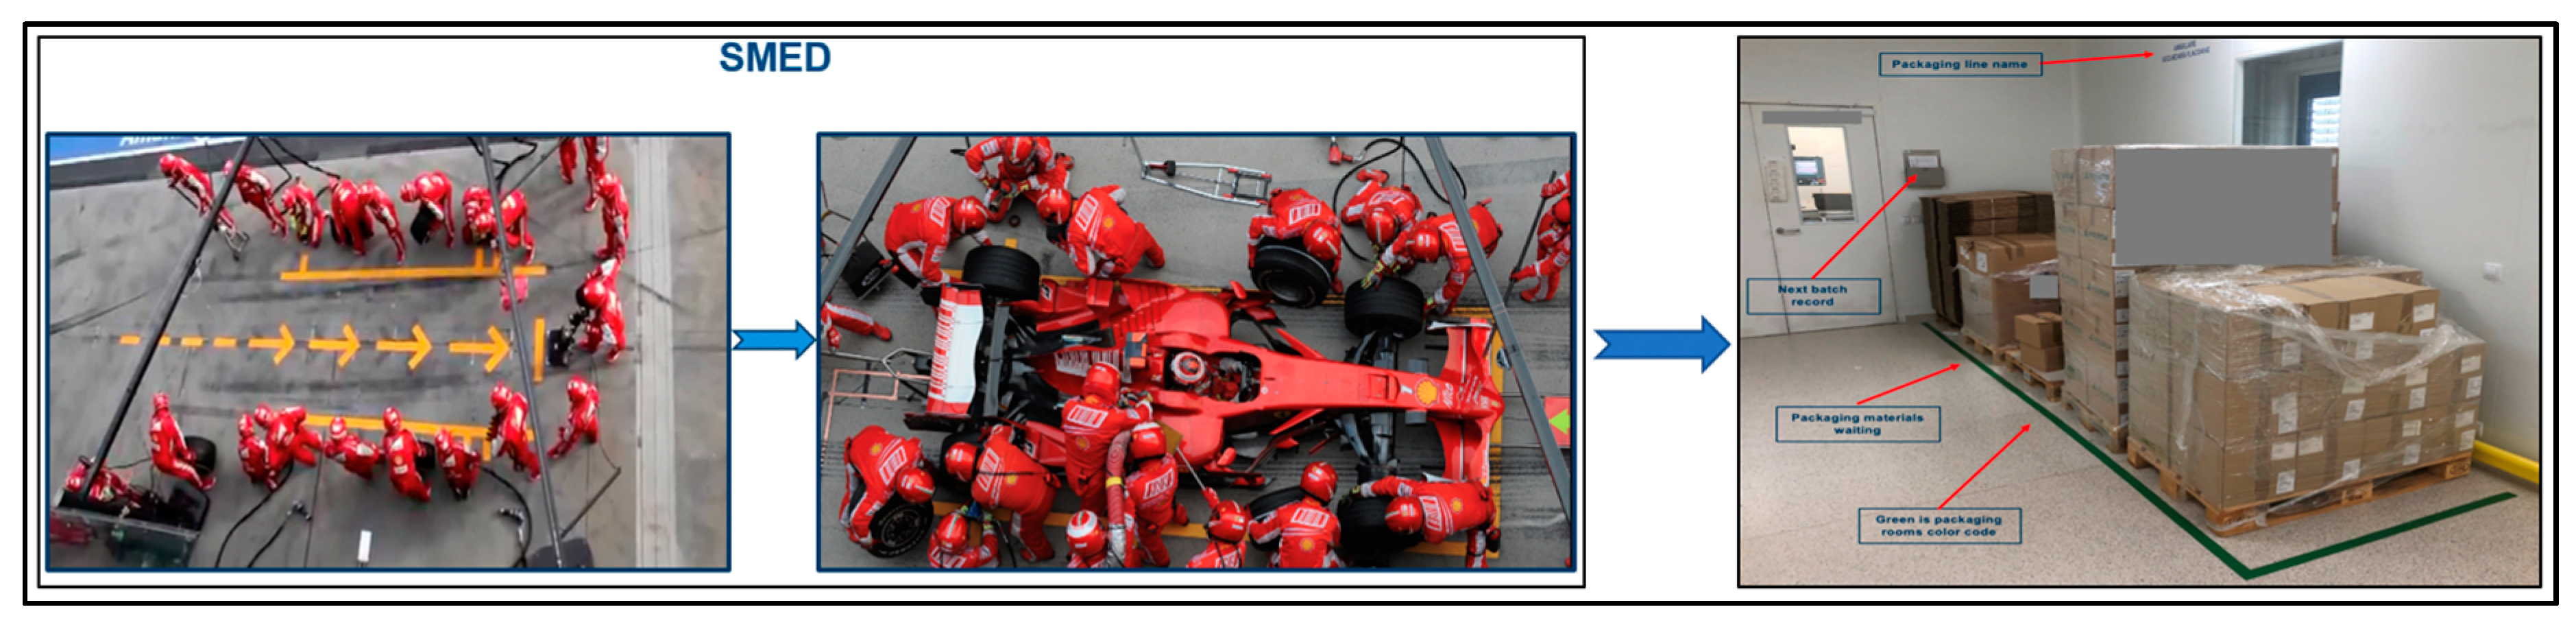
3.1.4. Externalization Process
The SMED (Single Minute Exchange of Dies) technique enforces the use of externalization to execute parallel process steps whenever possible, preferably while the machine is still running to reduce processing time [20,21,22,23,24]. After determining, in a written form, the detailed process steps and assigning standard execution times to each of them, the non-value-added steps have to be identified, marked and removed, in addition to externalizing the non-critical ones. We managed to identify five steps that could be externalized and one that has been removed. As seen in Figure 5, preparing the packaging material near the manufacturing room for the next batch while the current batch is still running is one example of applied step externalization contributing to the overall SMED process.
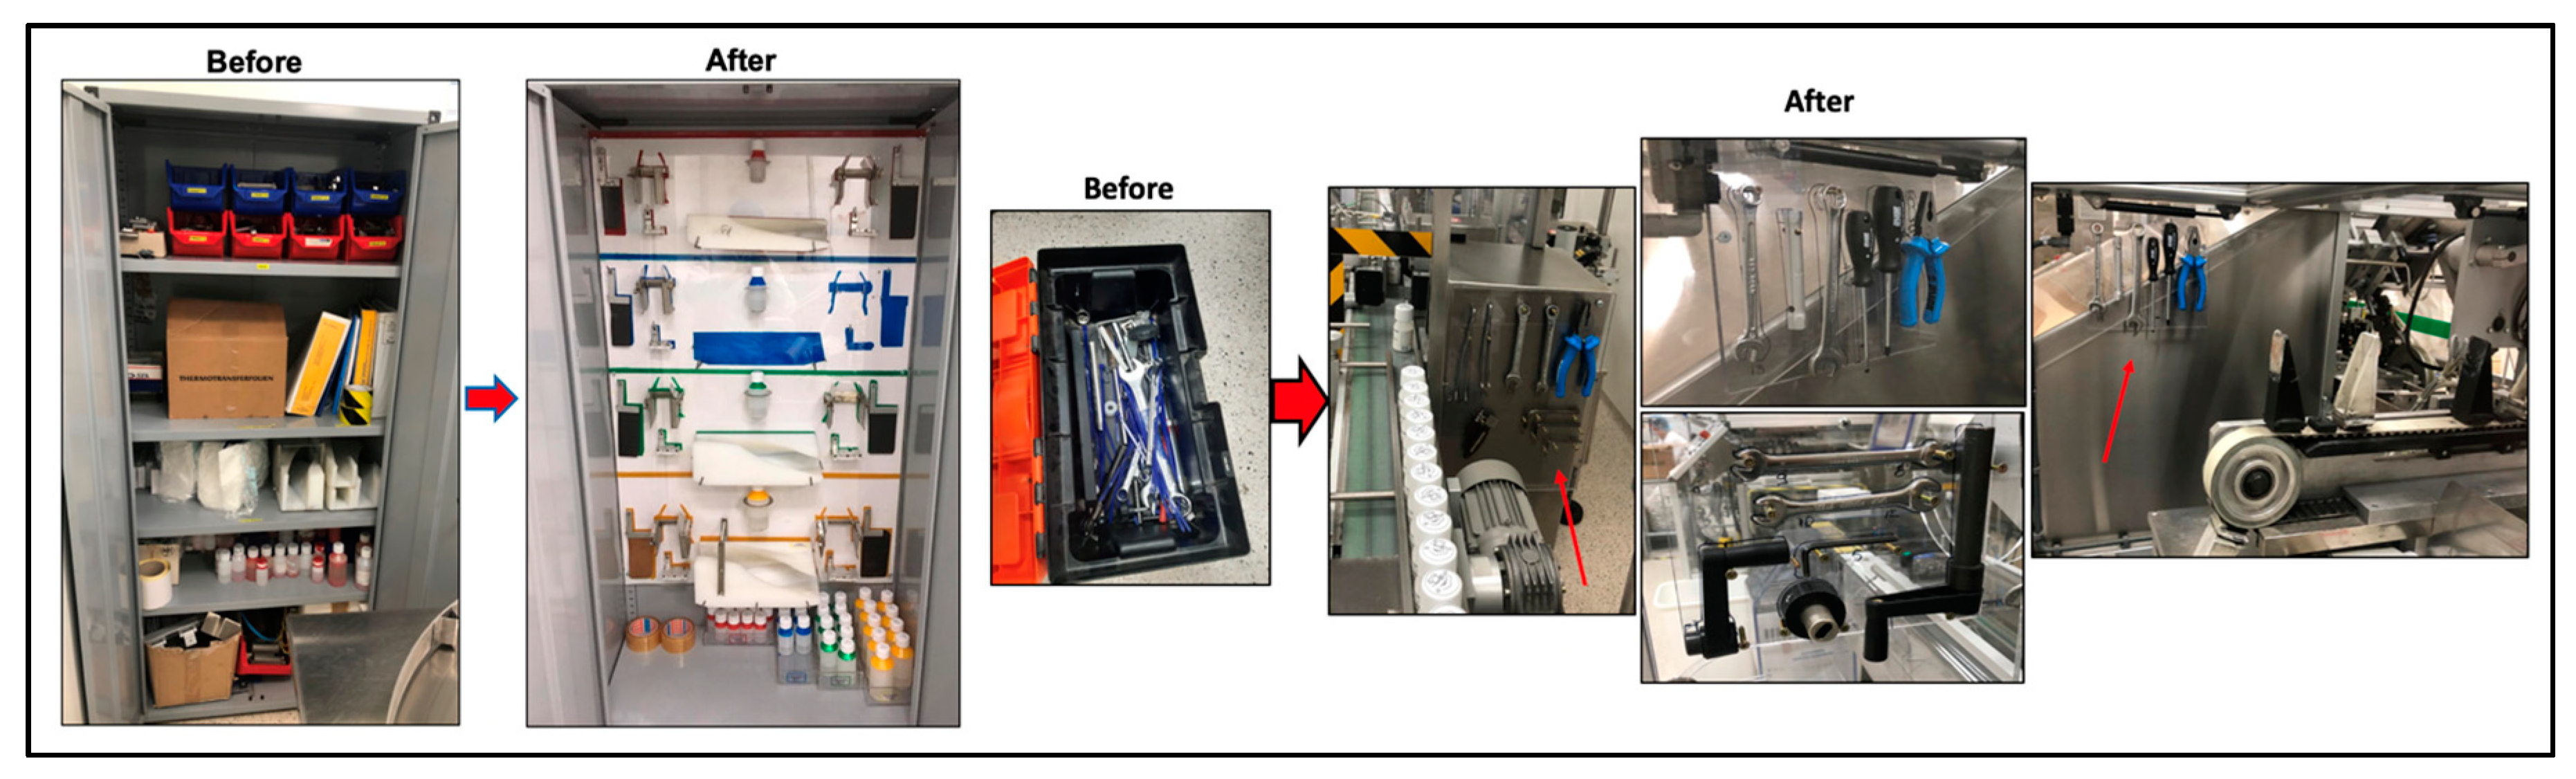
3.1.5. 5S Basics
Basic 5S concepts rely on creating an ergonomic and clean workplace as steps toward standardization and decreasing changeover times. Shadow boards are a common practice to create a clean and organized workplace and improve setup times and tooling stock adherence. In Figure 6, we exemplified some of the practices implemented at the suspension packaging line, where the tooling locker (left) and standard toolbox (right) have been transformed with the use of shadow board principles.
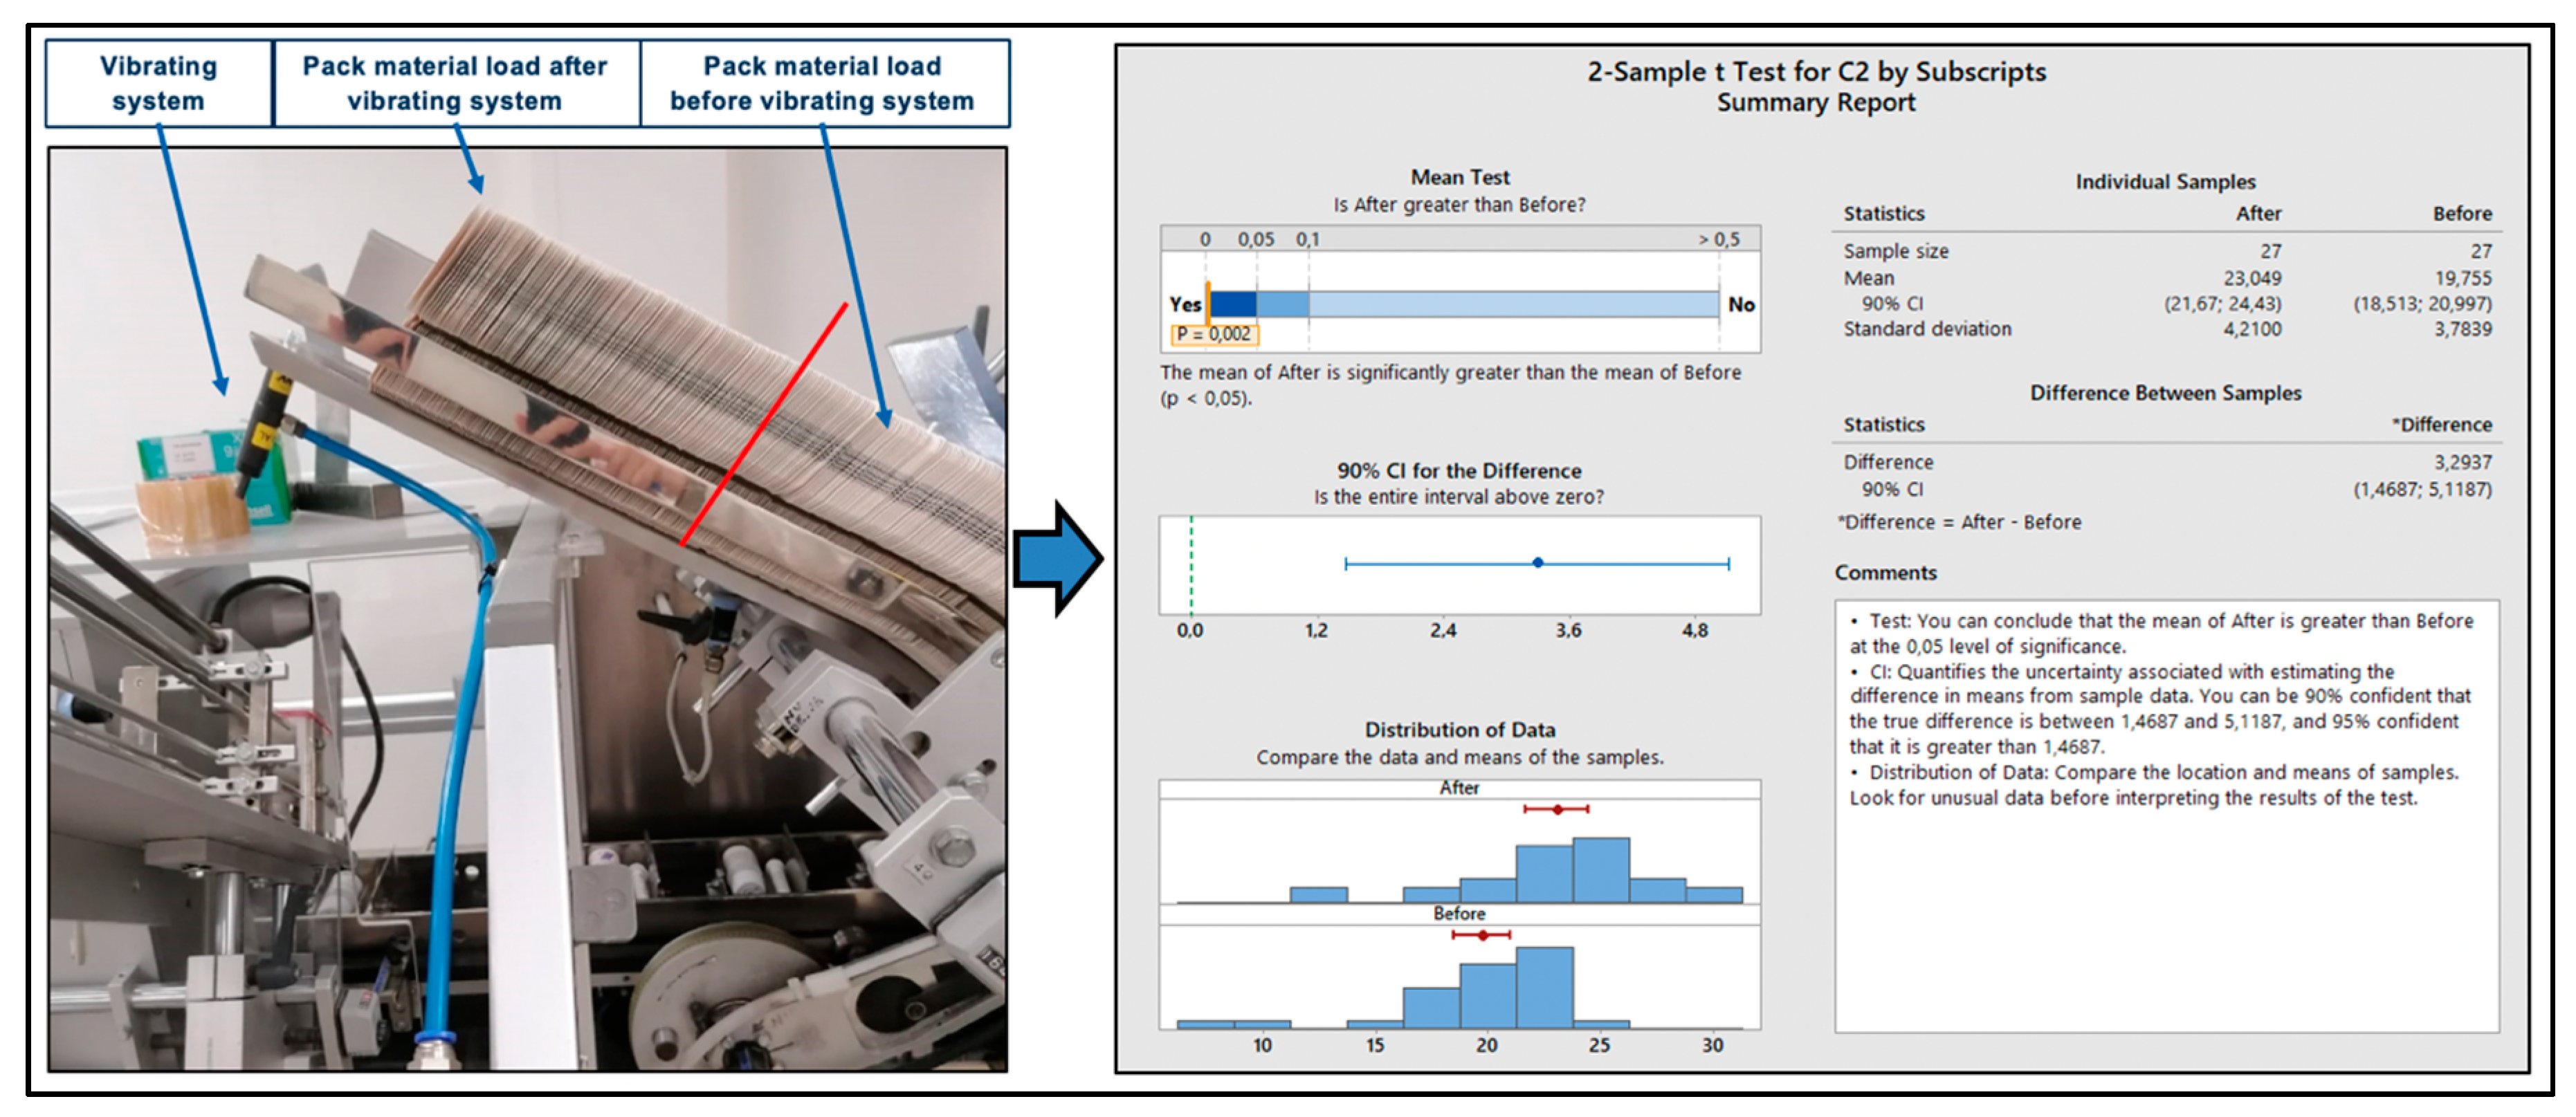
3.1.6. The Power of Brainstorming
Brainstorming sessions were used to generate improvement ideas for the current process. Having material flow issues in the machine feeding system, which cause several small stoppages during the process for one type of the packaging materials, one improvement idea suggested installing a vibrating system on the feeder to mitigate the negative outcome of the packaging material quality (as the supplier could not be changed). A vibrating system was identified in stock and adapted by the technical department to fit the suggested purpose. The 2-sample T-test outcome represented in Figure 7 confirms the process improvement by increased output and average machine running speed (+3 packs/min, +15%) with a p-value of 0.002. Additionally, to improve packaging material flow in the feeding system, an increased number of individual boxes could be loaded in the stacker (almost double), decreasing the operator workload.
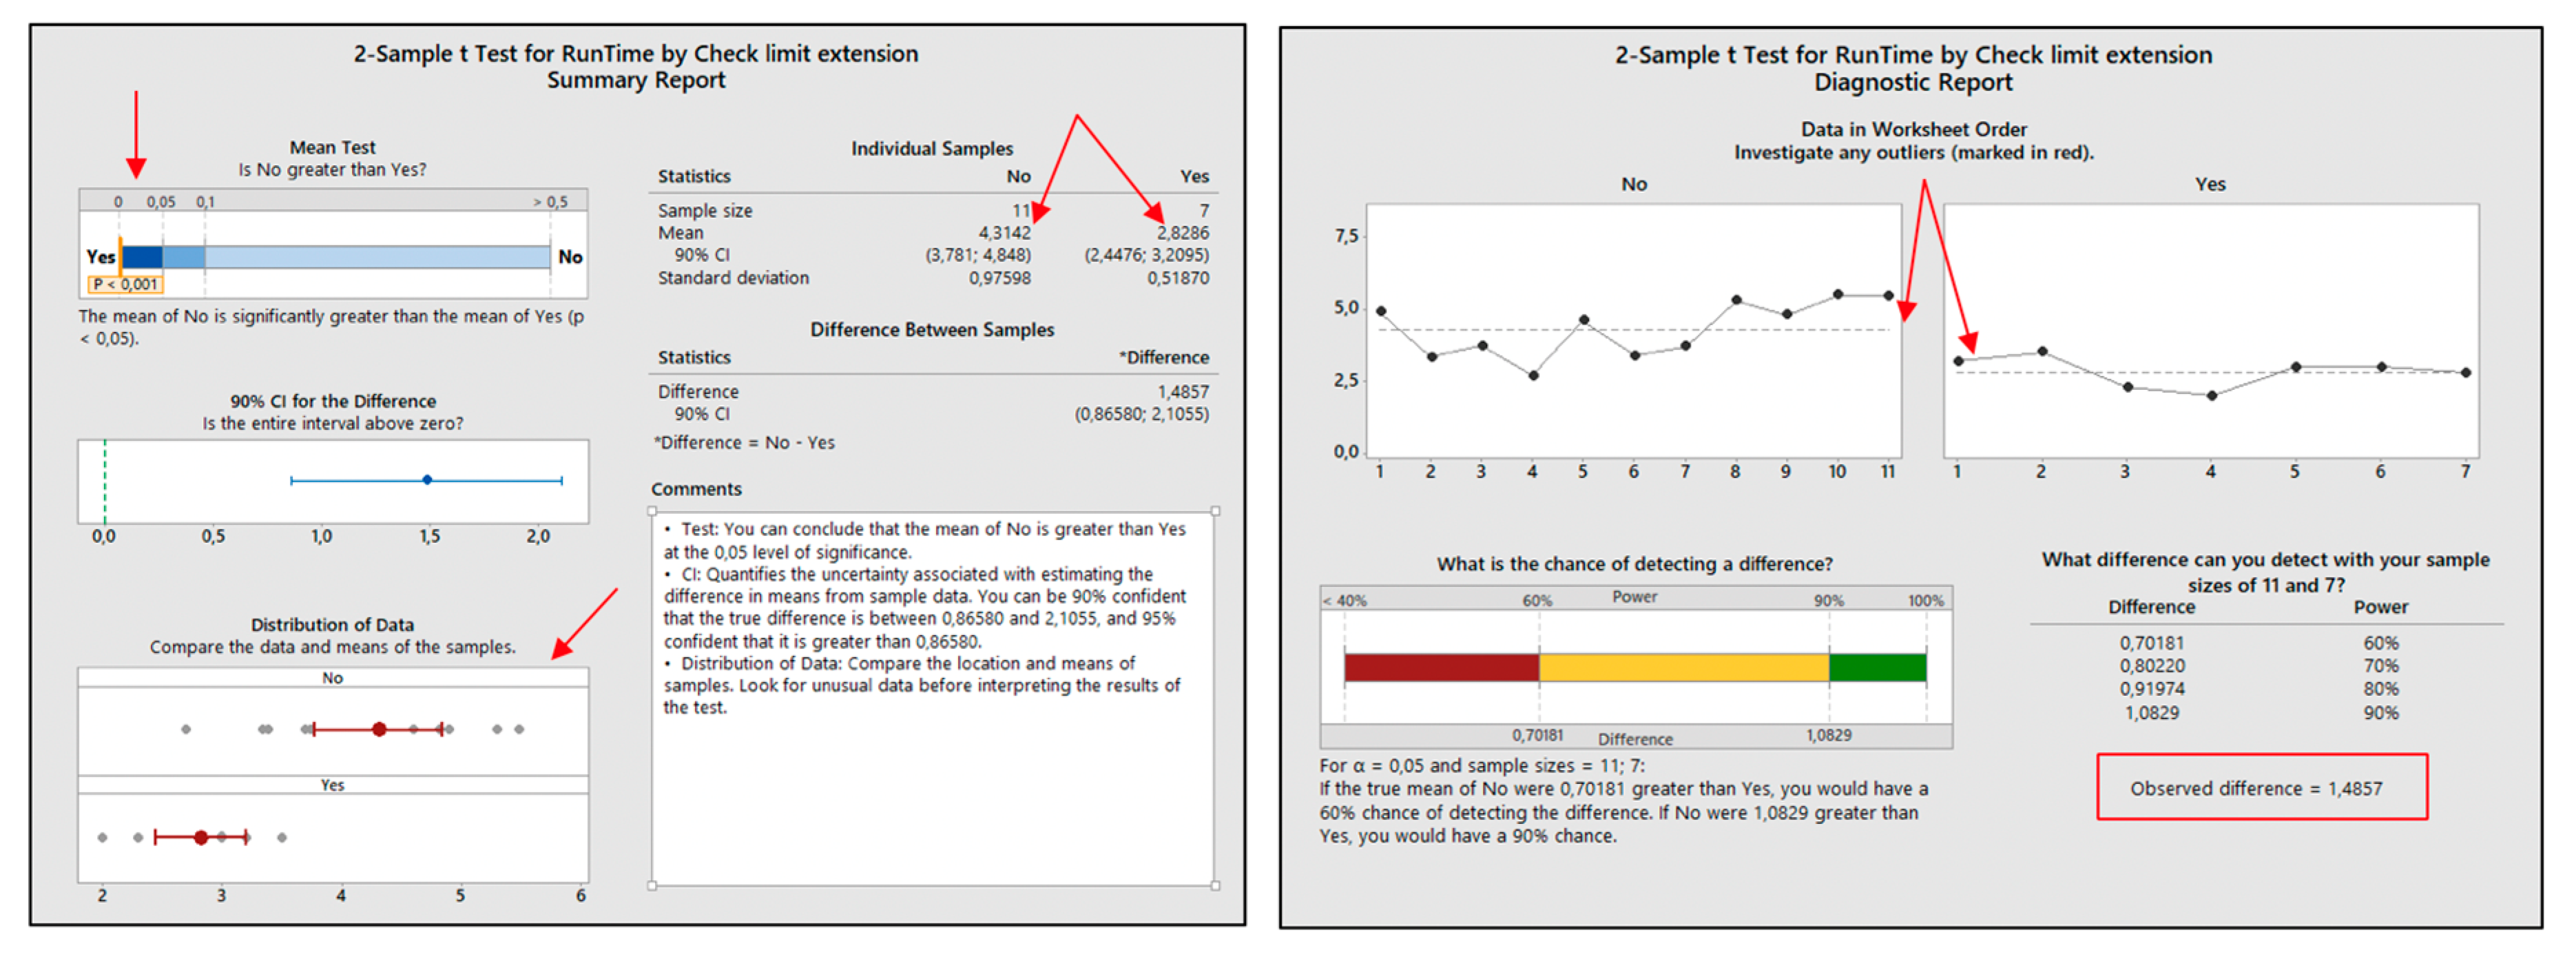
3.1.7. Removing the Muda
By removing a non-value adding component (Muda) previously aligned with the customers from the individual box of product A, which was causing false-positive rejects in the individual box-weighing step, we obtained a 37% packaging time/batch improvement. By cutting the Muda, additional reprocessing steps were removed and the process debottlenecked. The average run time/batch improved by 1.49 h, see Figure 8. In order to validate the results, we used a 2-sample T-test and compared the before and after performances. The p-value of 0.001 confirms the process improvement.
4. Results
All the results presented below have been obtained by following the algorithm. A 9% difference in OAE value, from 25% to 34%, comparing the pre- and post-performances of the process, were considered a significant difference for validating the algorithm. We will focus below on the OAE components that were improved by using the Lean Six Sigma algorithm.
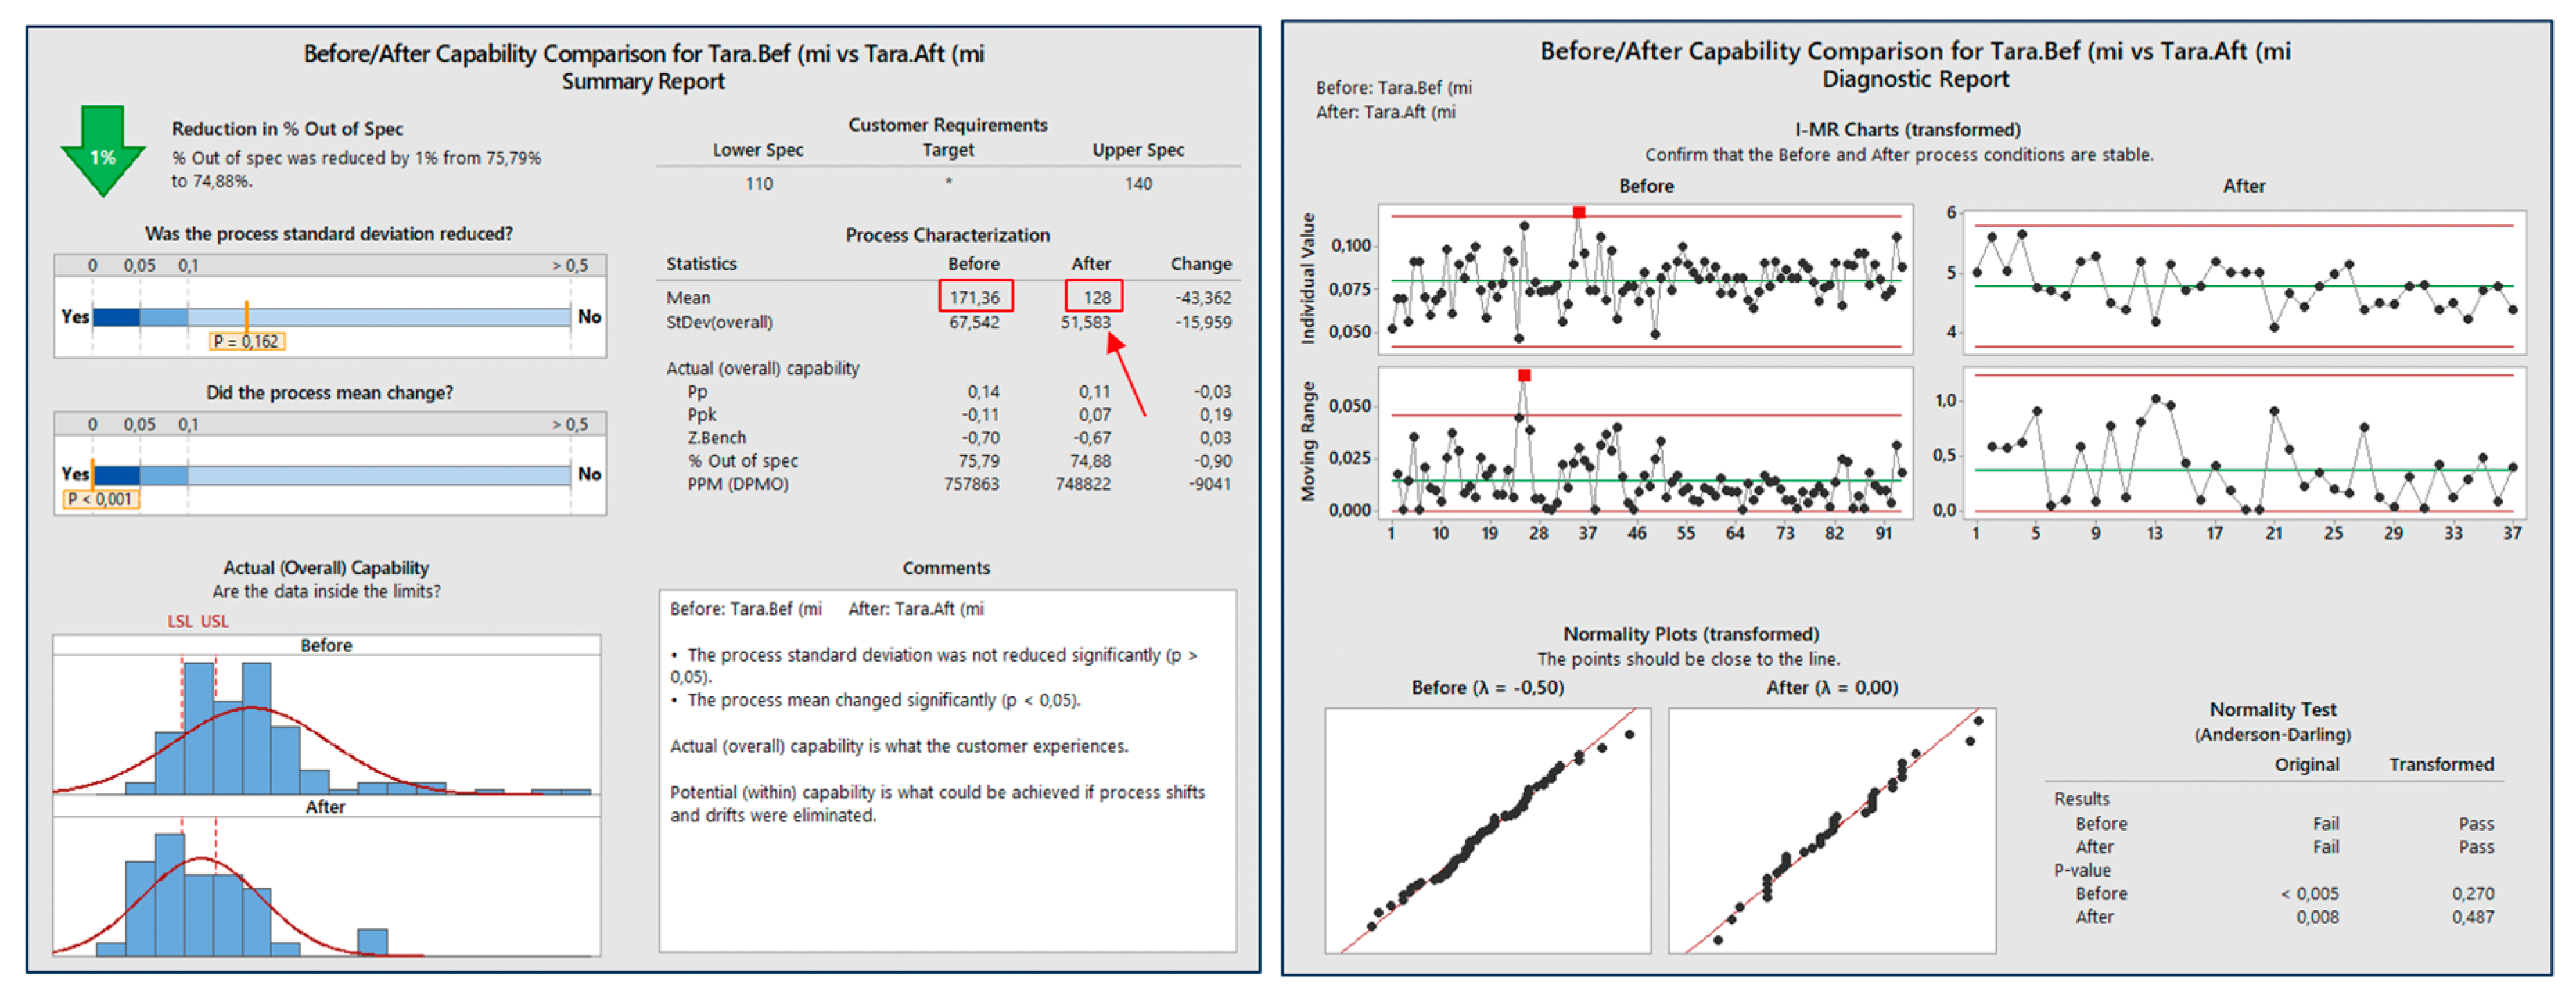
The implementation of SMED and 5S techniques, involving the steps of externalization and shadow board usage, according to the suggested algorithm, managed to decrease all in-scope changeover times. In Figure 9, we represent one type of medium changeover that was decreased by 25%, along with the overall standardization of the process.
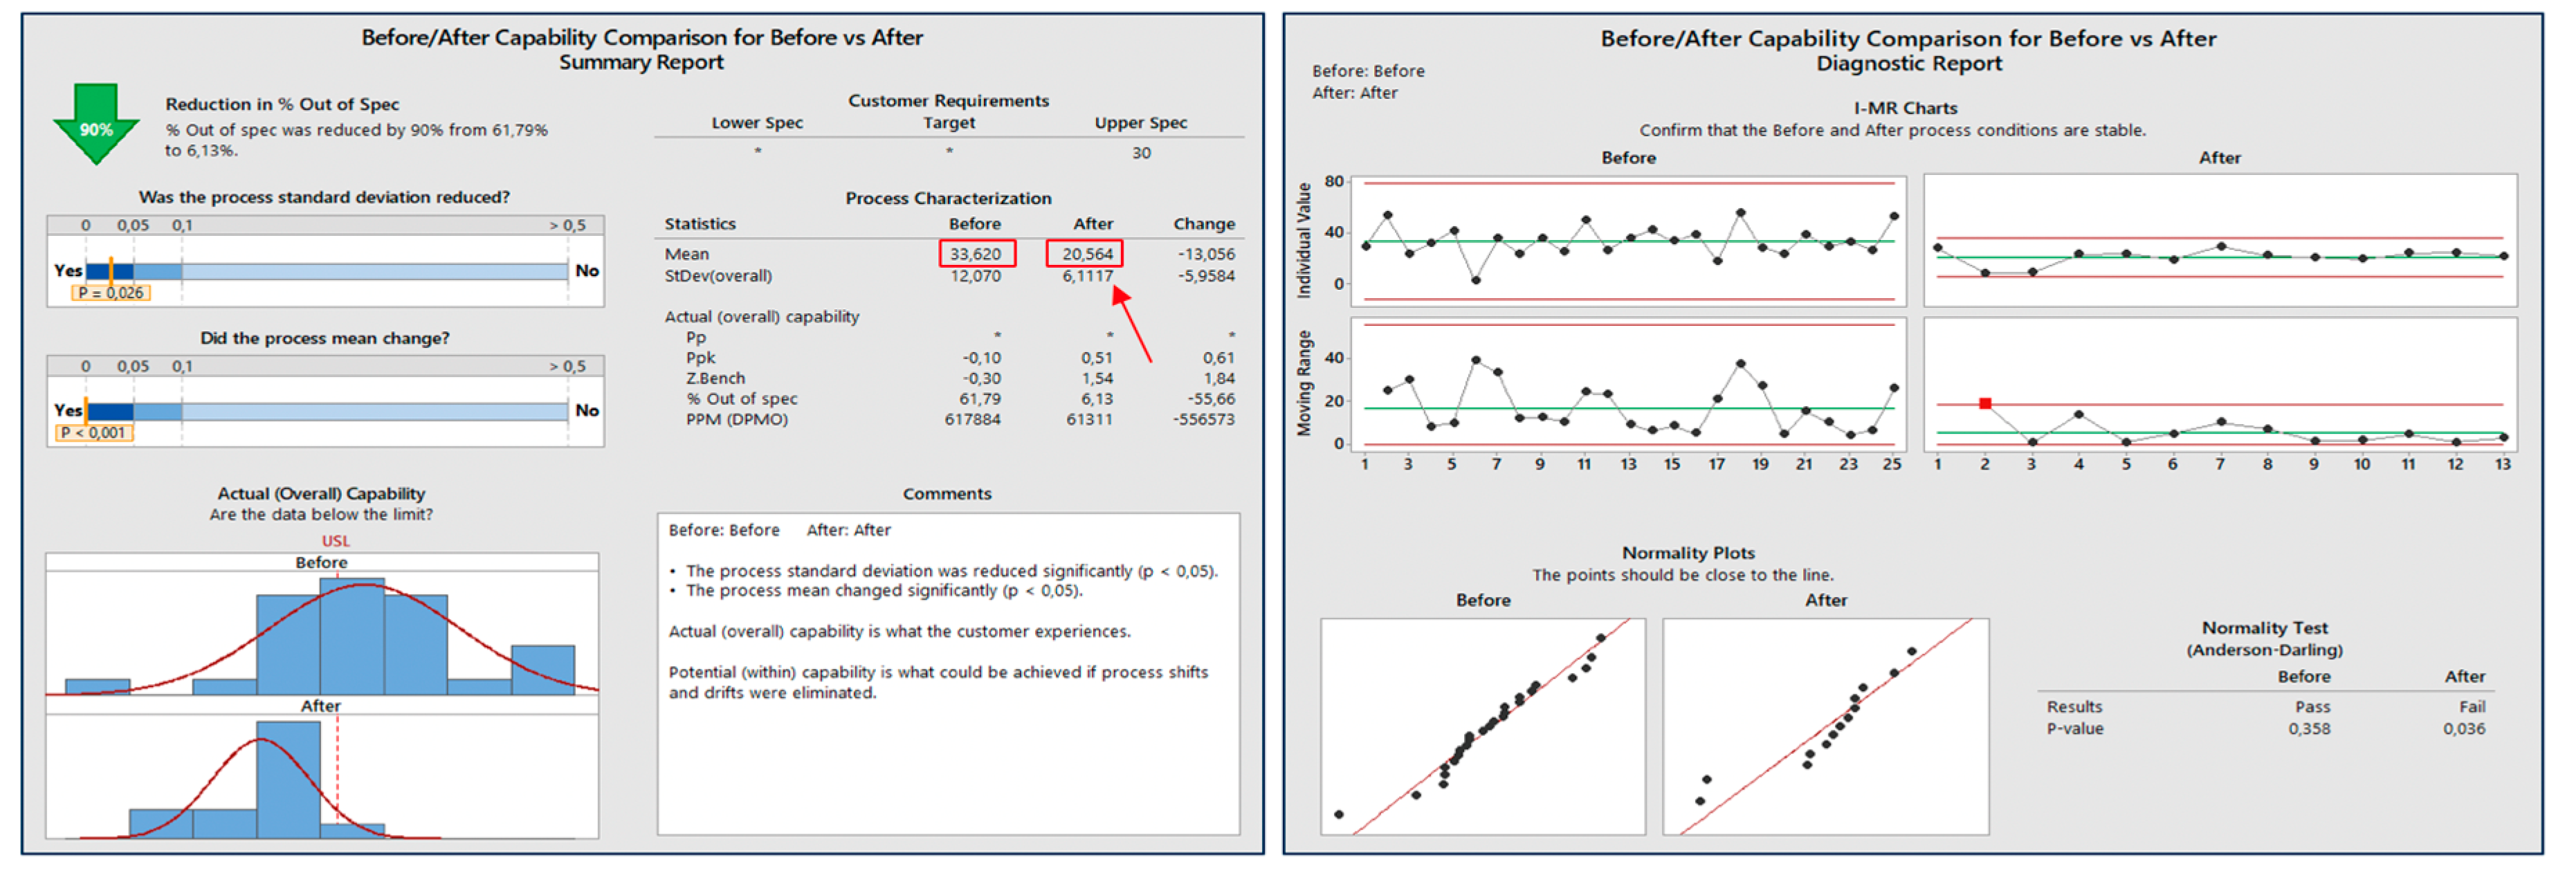
Weekly unscheduled stoppages also decreased from 33.6 h to 20.6 h. By decreasing the unscheduled elements in a certain timeframe, additional volume may be absorbed. Process standardization and awareness increase could be seen in the unscheduled breakdown results, represented in Figure 10, on a weekly basis.
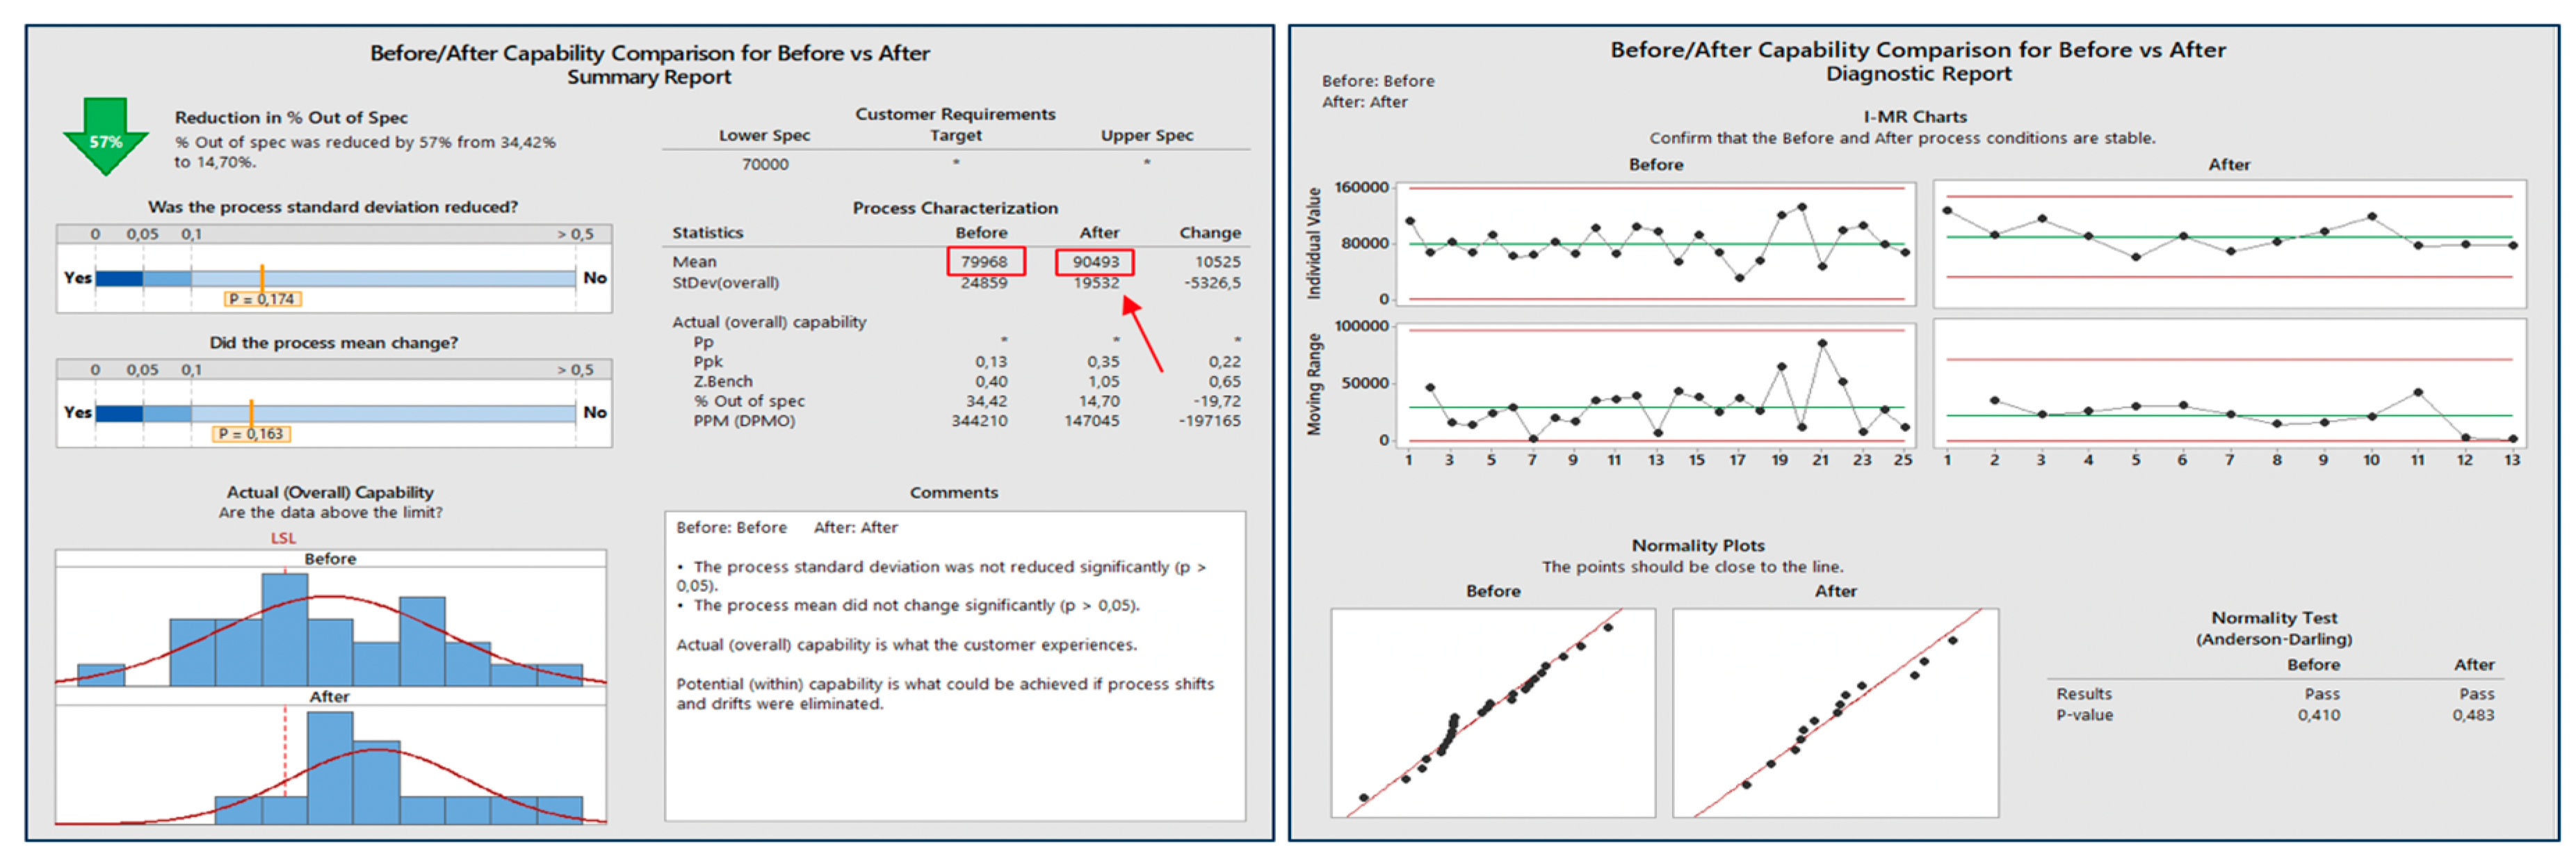
The manufactured output for the involved packaging line increased by a weekly average of 13%, or 10.525 packs, see Figure 11, compared with the initial baseline. The output is the overall result of affecting the previous OAE components, such as changeovers and unscheduled stoppages.
The results obtained and detailed in the above graphical representations by applying the suggested algorithm are summarized in Table 1 for an optimal overview of the Lean Six Sigma implementation influence regarding the packaging process. In order to be able to influence the final CTQ (Critical to Quality), that is, the OAE, we targeted the KPI (Key Performance Indicator) components and implemented the optimal tools in a strategic manner for reaching the best results in the shortest amount of time possible.
5. Discussion
Having the framework structured on a DMAIC principle and following the Define, Measure, Analyze, Improve and Control project phases, each of the above actions were implemented in a batch manufacturing area. The periodic Gemba walks, SMED technique implementation, along with the tools and approaches detailed in the paper, are key aspects for the success of the project. We addressed this universal issue by generating, testing and validating through results an algorithm that improves the manufacturing processes in a controlled manner. The algorithm was applied, tested and validated in the manufacturing area of a pharmaceutical company; nevertheless, it was conceived to enhance improvement project results in multiple batch manufacturing environments. By improving the complex OAE KPI and its components, such as unscheduled stoppages, run time, changeovers and production output, we consider the algorithm to be successful in decreasing the failure rate of continuous improvement projects. By guiding the implementation methodology of the generated algorithm, and using specific tools and techniques, we have dispatched a validated pathway for a general issue that has been unaddressed, until today, in such detail, according to our knowledge.
Funding
This research received no external funding which may be disclosed.
Acknowledgments
The paper would not have been created without the exceptional support of my guide and advisor, Liviu-Onoriu Marian. I would also like to express my deep gratitude to the company that allowed me to implement, test and validate the algorithm in the manufacturing area. Without the kind and knowledgeable support of the entire team, all the efforts would have been increased.
Conflicts of Interest
The funders had no role in the design of the study; in the collection, analysis, or interpretation of data; in the writing of the manuscript, or in the decision to publish the results.
References
- Bhuiyan, N.; Baghel, A. An overview of continuous improvement: From the past to the present. Manag. Decis. 2005, 43, 761–771. [Google Scholar] [CrossRef]
- Gerger, A.; Firuzan, A.R. Reasons of failure in Lean Six Sigma projects. Int. J. Multidiscip. Res. Dev. 2012, 2, 123–130. [Google Scholar]
- Antony, J.; Lizarelli, F.L.; Fernandes, M.M.; Dempsey, M.; Brennan, A.; McFarlane, J. A Study into the Reasons for Process Improvement Project Failures: Results from a Pilot Survey; International Journal of Quality&Reliability Management; Emerald Publishing Limited: Bingley, UK, 2019. [Google Scholar] [CrossRef]
- Womack, J.; Jones, D.; Roos, D. The Machine That Changed the World; MacMillan Publishing: New York, NY, USA, 1990. [Google Scholar]
- Womack, J.; Jones, D. Lean Thinking; Simon and Schuster: New York, NY, USA, 1996. [Google Scholar]
- Asli, Y.A.-B.; Jaideep, M.; Everett, M.S. When Lean and Six Sigma converge: A case study of a successful implementation of Lean Six Sigma at an aerospace company. Int. J. Technol. Manag. 2012, 57, 18–32. [Google Scholar]
- Pepper, M.P.J.; Spedding, T.A. The evolution of lean Six Sigma. Int. J. Qual. Reliab. Manag. 2010, 27, 138–155. [Google Scholar] [CrossRef]
- Jirasukprasert, P.; Garza-Reyes, J.A.; Kumar, V.; Lim, M.K. A Six Sigma and DMAIC application for the reduction of defects in a rubber gloves manufacturing process. Int. J. Lean Six Sigma 2014, 5, 2–21. [Google Scholar] [CrossRef]
- McIntosh, R.I.; Culley, S.J.; Mileham, A.R.; Owen, G.W. A critical evaluation of Shingo’s ‚SMED’ (Single Minute Exchange of Die) methodology. Int. J. Prod. Res. 2010, 38, 2377–2395. [Google Scholar] [CrossRef]
- Ram, K.; Kumar, S.; Singh, D.P. Industrial benefits from a SMED methodology on high speed press in a punching machine: A review. Adv. Appl. Sci. Res. 2015, 6, 38–41. [Google Scholar]
- Rahman, S.; Laosirihongthong, T.; Sohal, A.S. Impact of lean strategy on operational performance: A study of Thai manufacturing companies. J. Manuf. Technol. Manag. 2010, 21, 839–852. [Google Scholar] [CrossRef]
- Haleem, R.M.; Salem, M.Y.; Fatahallah, F.A.; Abdelfattah, L.E. Quality in the pharmaceutical industry—A literature review. Saudi Pharm. J. 2015, 23, 463–469. [Google Scholar] [CrossRef] [PubMed]
- Faccio, M.; Cohen, Y.; Bevilacqua, M.; Ciarapica, F.E.; De Sanctis, I.; Mazzuto, G.; Paciarotti, C. A Changeover Time Reduction through an integration of lean practices: A case study from pharmaceutical sector. Assembly Autom. 2015, 35, 22–34. [Google Scholar]
- Kumar, B.S.; Abuthakeer, S.S. Implementation of lean tools and techniques in an automotive industry. J. Appl. Sci. 2012, 12, 1032–1037. [Google Scholar] [CrossRef]
- Kesterson, R.K. The Intersection of Change Management and Lean Six Sigma; CRC Press: Boca Raton, FL, USA, 2018; pp. 3–50. [Google Scholar]
- Al-Akel, K.; Marian, L.; Harea, C. Analysis of Global Japanese Management Methods. Use and Efficacy. 2018. Available online: http://www.rmee.org/abstracturi/67/11_studii_si_cercetari_Articol_406_Karam%20Al-Akel%20-%20RMEE%202018%20-%20ANALIZAREA%20EFICACITATII%20GLOBALE%20A%20METODELOR%20JAPONEZE%20DE%20MANAGEMENT.pdf (accessed on 1 March 2020).
- Al-Akel, K.; Veres (Harea), C.; Gavrilaș, V. DMAIC importance and effectiveness in continuous improvement mindset. In Proceedings of the RMEE, Review of Management and Economic Engineering, ISI Proceedings, Cluj-Napoca, Romania, 20–22 August 2018. [Google Scholar]
- Karam, A.A.; Liviu, M.; Cristina, V.; Radu, H. The contribution of Lean Manufacturing tools to Changeover time decrease in the pharmaceutical industry. A SMED project. Proc. Manuf. J. 2018, 22, 886–892. [Google Scholar] [CrossRef]
- Shingo, S. A Revolution in Manufacturing: The SMED System; Productivity Press: Stanford, CA, USA, 1985. [Google Scholar]
- Cakmakci, M. Process improvement: Performance analysis of the setup time reduction-SMED in the automobile industry. Int. J. Adv. Manuf. Technol. 2009, 41, 168–179. [Google Scholar] [CrossRef]
- Ulutas, B. An application of SMED Methodology. World Acad. Sci. Eng. Technol. 2011, 79, 101. [Google Scholar]
- Perinić, M.; Ikonić, M.; Maričić, S. Die Casting Process Assessment Using Single Minute Exchange of Dies (SMED) Method. Metalurgija 2009, 48, 199–202. [Google Scholar]
- Dave, Y.; Sohani, N. Single Minute Exchange of Dies: Literature Review. Int. J. Lean Think. 2012, 3, 27–37. [Google Scholar]
- Mali, Y.R.; Inamdar, K.H. Changeover Time Reduction Using Smed Technique of Lean Manufacturing. Int. J. Eng. Res. Appl. 2012, 2, 2441–2445. [Google Scholar]
- Available online: http://www.lowgif.com/view.html (accessed on 1 March 2020).
Figure 1.
Process mapping (left) and Value-added activities (right). Legend: OK (OK, Good process step); NOK (Not OK, Failed process step); FDF (Finished Dosage Form); EBR (Electronic Batch Record).
Figure 1.
Process mapping (left) and Value-added activities (right). Legend: OK (OK, Good process step); NOK (Not OK, Failed process step); FDF (Finished Dosage Form); EBR (Electronic Batch Record).

Figure 2.
Changeover scheme (left) and Changeover ramp (right). Legend: SKU (Stock Keeping Unit); C/O (Changeover).
Figure 2.
Changeover scheme (left) and Changeover ramp (right). Legend: SKU (Stock Keeping Unit); C/O (Changeover).

Figure 3.
Dispatch list.

Figure 4.
OAE tracking sheet. Legend: OAE (Overall Asset Effectiveness); FP (Finished Product).

Figure 5.
Externalization process [25].
Figure 5.
Externalization process [25].

Figure 6.
Shadow board.

Figure 7.
Brainstorming session outcome.

Figure 8.
Run time decrease after Muda removal.

Figure 9.
Medium changeover time improvement. Legend: I-MR (Individual-Moving Range), Pp (Process performance), Ppk (Process performance value), Z. Bench (Benchmark value), PPM (Parts Per Million), DPMO (Deffects Per Million Opportunities), LSL (Lower Specification Limit), USL (Upper Specification Limit).

Figure 10.
Weekly unscheduled breakdowns decrease.

Figure 11.
Weekly output improvement.


Table 1.
LSS (Lean Six Sigma) algorithm implementation results.
| Key Performance Indicator | Baseline | Target | Result |
|---|---|---|---|
| OAE | 25% | 35% | 34% (↑ 9%) |
| Weekly output | 79.968 packs | - | 90.493 (↑ 10.525 packs) |
| Minor changeover | 86 min | - | 66 min. (↓ 20 min) |
| Medium changeover type 1 | 171 min | - | 128 min. (↓ 43 min) |
| Medium changeover type 2 | 240 min | - | 147 min. (↓ 93 min) |
| Medium changeover type 3 | 257 min | - | 198 min. (↓ 59 min) |
| Weekly unscheduled stoppages | 33.6 h | - | 20.6 h (↓ 13 h) |
| Average run speed | 18.3 packs/min | - | 19.9 (↑ 1.6 packs/min) |
| Savings | - | X$ (dollar)/year * | Y$ (dollar)/year * |
* The financial savings figures are non-disclosable.
Publisher’s Note: MDPI stays neutral with regard to jurisdictional claims in published maps and institutional affiliations. |
© 2020 by the authors. Licensee MDPI, Basel, Switzerland. This article is an open access article distributed under the terms and conditions of the Creative Commons Attribution (CC BY) license (http://creativecommons.org/licenses/by/4.0/).
Share and Cite
MDPI and ACS Style
Al-Akel, K.; Marian, L.-O. The Lean Six Sigma Algorithm—A Roadmap for Implementation. Proceedings 2020, 63, 24. https://0-doi-org.brum.beds.ac.uk/10.3390/proceedings2020063024
AMA Style
Al-Akel K, Marian L-O. The Lean Six Sigma Algorithm—A Roadmap for Implementation. Proceedings. 2020; 63(1):24. https://0-doi-org.brum.beds.ac.uk/10.3390/proceedings2020063024
Chicago/Turabian StyleAl-Akel, Karam, and Liviu-Onoriu Marian. 2020. "The Lean Six Sigma Algorithm—A Roadmap for Implementation" Proceedings 63, no. 1: 24. https://0-doi-org.brum.beds.ac.uk/10.3390/proceedings2020063024