Modelling the Implementation of a Sustainable Development Strategy through Process Mapping †


Department of Entrepreneurship and Management (DEM), Faculty of Entrepreneurship, Business Engineering and Management (FAIMA), University POLITEHNICA of Bucharest, 060042 București, Romania
*
Author to whom correspondence should be addressed.
†
Presented at the 14th International Conference on Interdisciplinarity in Engineering—INTER-ENG 2020, Târgu Mureș, Romania, 8–9 October 2020.
Proceedings 2020, 63(1), 6; https://0-doi-org.brum.beds.ac.uk/10.3390/proceedings2020063006
Published: 10 December 2020
(This article belongs to the Proceedings of The 14th International Conference on Interdisciplinarity in Engineering—INTER-ENG 2020)
Abstract
:Industry 4.0 implies sustainable production by providing green products created through environmentally responsible processes. This paper aims to analyze the two main business processes responsible for energy innovation in a telecommunications company: “develop property strategy and long-term vision” and “evaluate environmental impact of products, services, and operations”. The processes will be introduced using an initial set of key-performance indicators (KPIs) and American Productivity & Quality Center (APQC) Process Classification Framework activities. Through value stream analysis, the non-value-added activities will be eliminated. Ultimately, to provide an overview for the stakeholders, a new set of KPIs will be proposed and the processes will be modeled using Event-Driven Process Chain (EPC) and Suppliers-Inputs-Process-Outputs-Customers (SIPOC) methods.
1. Introduction
Sustainability, lean manufacturing, and Industry 4.0 are important concerns nowadays.
The concept of sustainability has been developed as a solution to the ecological crisis caused by the intense exploitation of resources and the continuous degradation of the environment. Sustainable development is defined as “development that meets the needs of the present without compromising the ability of future generations to meet their own needs” [1].
Lean manufacturing implies reducing all activities that do not bring value for end customers. It is an ongoing effort to eliminate or reduce all waste in design, manufacturing, and distribution, ensuring quality improvement, reducing processing time and overall costs [2].
Industry 4.0 implies real-time connectivity between suppliers, departments, machines and products, and it aims to revolutionize all industries in terms of technology, business processing and digitalization [2].
Research shows that Industry 4.0 has made the public aware of the challenges present in the Triple Bottom Line, which covers the three pillars of sustainability: economic, environmental and social [3].
Lean manufacturing will decrease energy consumption of non-renewable energies and industrial waste and increase interest in renewable energy and the collaboration between environmentally responsible companies [3].
Cyber-Physical Systems (CPS) introduced by Industry 4.0 will digitalize the relations between suppliers, producers and consumers, creating a smart manufacturing process. This transformation will lead to an increase in productivity, reducing industrial costs (i.e., production, logistic, quality management), providing better quality of products and reducing errors [3].
Industry 4.0 will lead to a decrease in energy consumption and waste reduction though optimization of logistics and warehousing [3,4].
The Industry 4.0 technological framework consists of the Internet of Things (IoT) and Internet of Services (IoS), which connect the industry through their supply chain network [5].
Research shows that the IoT might have a positive impact on the environment by increasing collaboration with partners that follow good environmental practices and decreasing resource consumption [2].
On the other hand, another research shows that the IoT might increase the demand for massive data centers, which would lead to an increased energy flow. Automation and digitalization might have a negative impact on the environment as it might lead to increased equipment demand, which would increase raw material flow, energy flow and fuel flow in their manufacturing [5]. Digitization and integration would lead to more raw materials and energy required, as well as the disposal or recycling of outdated equipment [6].
The telecommunications industry (i.e., ITC) ensures the communication framework for Industry 4.0, the network and the inter-connection between Internet of Things devices, and therefore their sustainability practices and efforts to create sustainable business processes are objects of concern.
On the European market, the main telecommunications competitors, their revenue, digital programs and climate change actions are explored by the European Telecommunications Network Operation’s Association [7].
In this paper, sustainable development data will be used to measure business processes and give examples of programs and initiatives developed by Vodafone (primarily, as their annual report contains a data sheet with useful information), Telekom and Orange.
Previous research addressed sustainability in supply chain systems and proposed a decisional model for evaluating suppliers, under the following criteria: environmental (green corporate social image, environmental management system), social (work safety and labor health) and economic (cost, quality, service) sustainability [8].
Another study extends the Business Process Management concept, focusing on optimizing costs, quality, time and flexibility of the business process with the Green Business Process Management (BPM) concept, which focuses on the environmental consequences of business processes. Green BPM implies reducing greenhouse gas emissions and energy consumption as optimization objectives for business processes [9].
Although there are a multitude of studies on business process in the literature, they cover either other production industries, lean manufacturing, or are focused on certain types of business processes (Green BPM). The processes that will be analyzed in this study are not addressed in the literature.
In the context of Industry 4.0, this study might be relevant to companies operating in the ITC industry thanks to the provided values stream analysis, which may give valuable insights to the implementation of sustainable development strategies and related processes key-performance indicators (KPIs).
2. Research Methodology and Input Data
2.1. Categories of Business Processes
A first step is to identify the input data, meaning the business processes responsible for the sustainable development strategy. The Process Classification Framework (PCF) from APQC in a telecommunications company will be used as a methodology [10].
Developing sustainable, innovative products and solutions that help customers save energy implies conducting business processes from the C2, C3 and C4 categories. A sustainable office uses renewable energy, has intelligent lighting or heating systems, with business processes from the C9 category being responsible from creating it. To drive energy innovation, environmental, health and safety programs should be put in place, and the business processes responsible for creating them are from the C10 category. A sustainable development strategy cannot be achieved without the support of governments, non-governmental organizations and the mass media, and the responsible processes reside in the C11 category. The C13 category is responsible for the adaptation of technology centers.
2.2. Groups of Business Processes
The next step is to identify programs implemented by the studied organizations that are directly correlated with the APQC groups of business processes [10]. In Table 1, the following notation will be used P(category_number).(process_number) Group of processes. The programs are extracted from the Corporate Social Responsibility (CSR) reports of the targeted companies [11,12,13].
For each group of processes, the authors identified and extracted the data reported in the CSR reports and date sheets [12,13,14].
The table above contains both measurable data, percentages of the impact or progress of the company towards sustainable development objectives and data that cannot be measured. Also, not all processes have substantial and direct action on the sustainable development strategy.
Using the data from the previous table, the most relevant processes are identified as follows:
P1: Develop property strategy and long-term vision
P2: Evaluate environmental impact of products, services, and operations
P3: Develop IoT products in accordance with the sustainable development strategy
P4: Inform employees about the adoption of socially responsible behavior
P5: Manage relations with government, quasi-government bodies, trade or industry groups.
Based on previous authors’ experiences, the following processes has been selected to be analyzed through value stream mapping and modelled, being considered the most relevant for any company operating in the ITC industry and/or other socio-economic sectors:
P1: Develop property strategy and long-term vision
P2: Evaluate environmental impact of products, services, and operations.
3. Mapping the Initial State of Business Processes and Value Stream Analysis
To improve business processes, it is necessary to know the initial state of the performance indicators. Different types of performance can be measured by key-performance indicators (KPIs), for example: energy, raw materials, control, operation [15]. The reason for low performance is waste in different forms, such as transport, inventory, movement, waiting, over processing, overproduction, and defects [16]. Waste does not add value to the product as defined by the customer [17]. From a lean perspective, each activity is classified as an activity that brings value (VA) or activity that brings no value (NVA). However, there are some activities, called ENVA, that are perceived as NVA but may be necessary to the process.
The activities within the processes have been taken from the PCF and divided by their value-added and the justification for their categorization [10].
Table 2 presents the initial state of the P1 process: “develop property strategy and long-term vision”. The responsible units are Procurement department and Financial department.
Table 3 provides the initial state of the P2 process: “evaluate environmental impact of products, services, and operations”. To exemplify, Vodafone reported a 3% emission reduction [11], whereas Telekom reported a 2% emission reduction [13]. Each company can set their own KPI. The responsible unit for the process activities is the CSR department.
4. Mapping the Future State of the Business Processes
To project the future status of the processes, NVA activities will be removed and new KPI values will be proposed. Each company can set their own KPIs. To exemplify, Telekom would like to achieve 100% renewable energy usage by 2021 [13], whereas Vodafone set the same goal for 2025 [11]. Vodafone would like to reduce 50% of their emissions by 2025 [11], and Telekom reported the objective to reduce by 25% from one year to another (2017 to 2018) [13].
Table 4 provides the future state of the P1 process: “develop property strategy and long-term vision”.
Table 5 provides the future state of the P2 process: “evaluate environmental impact of products, services, and operations”.
5. Modelling the Business Processes
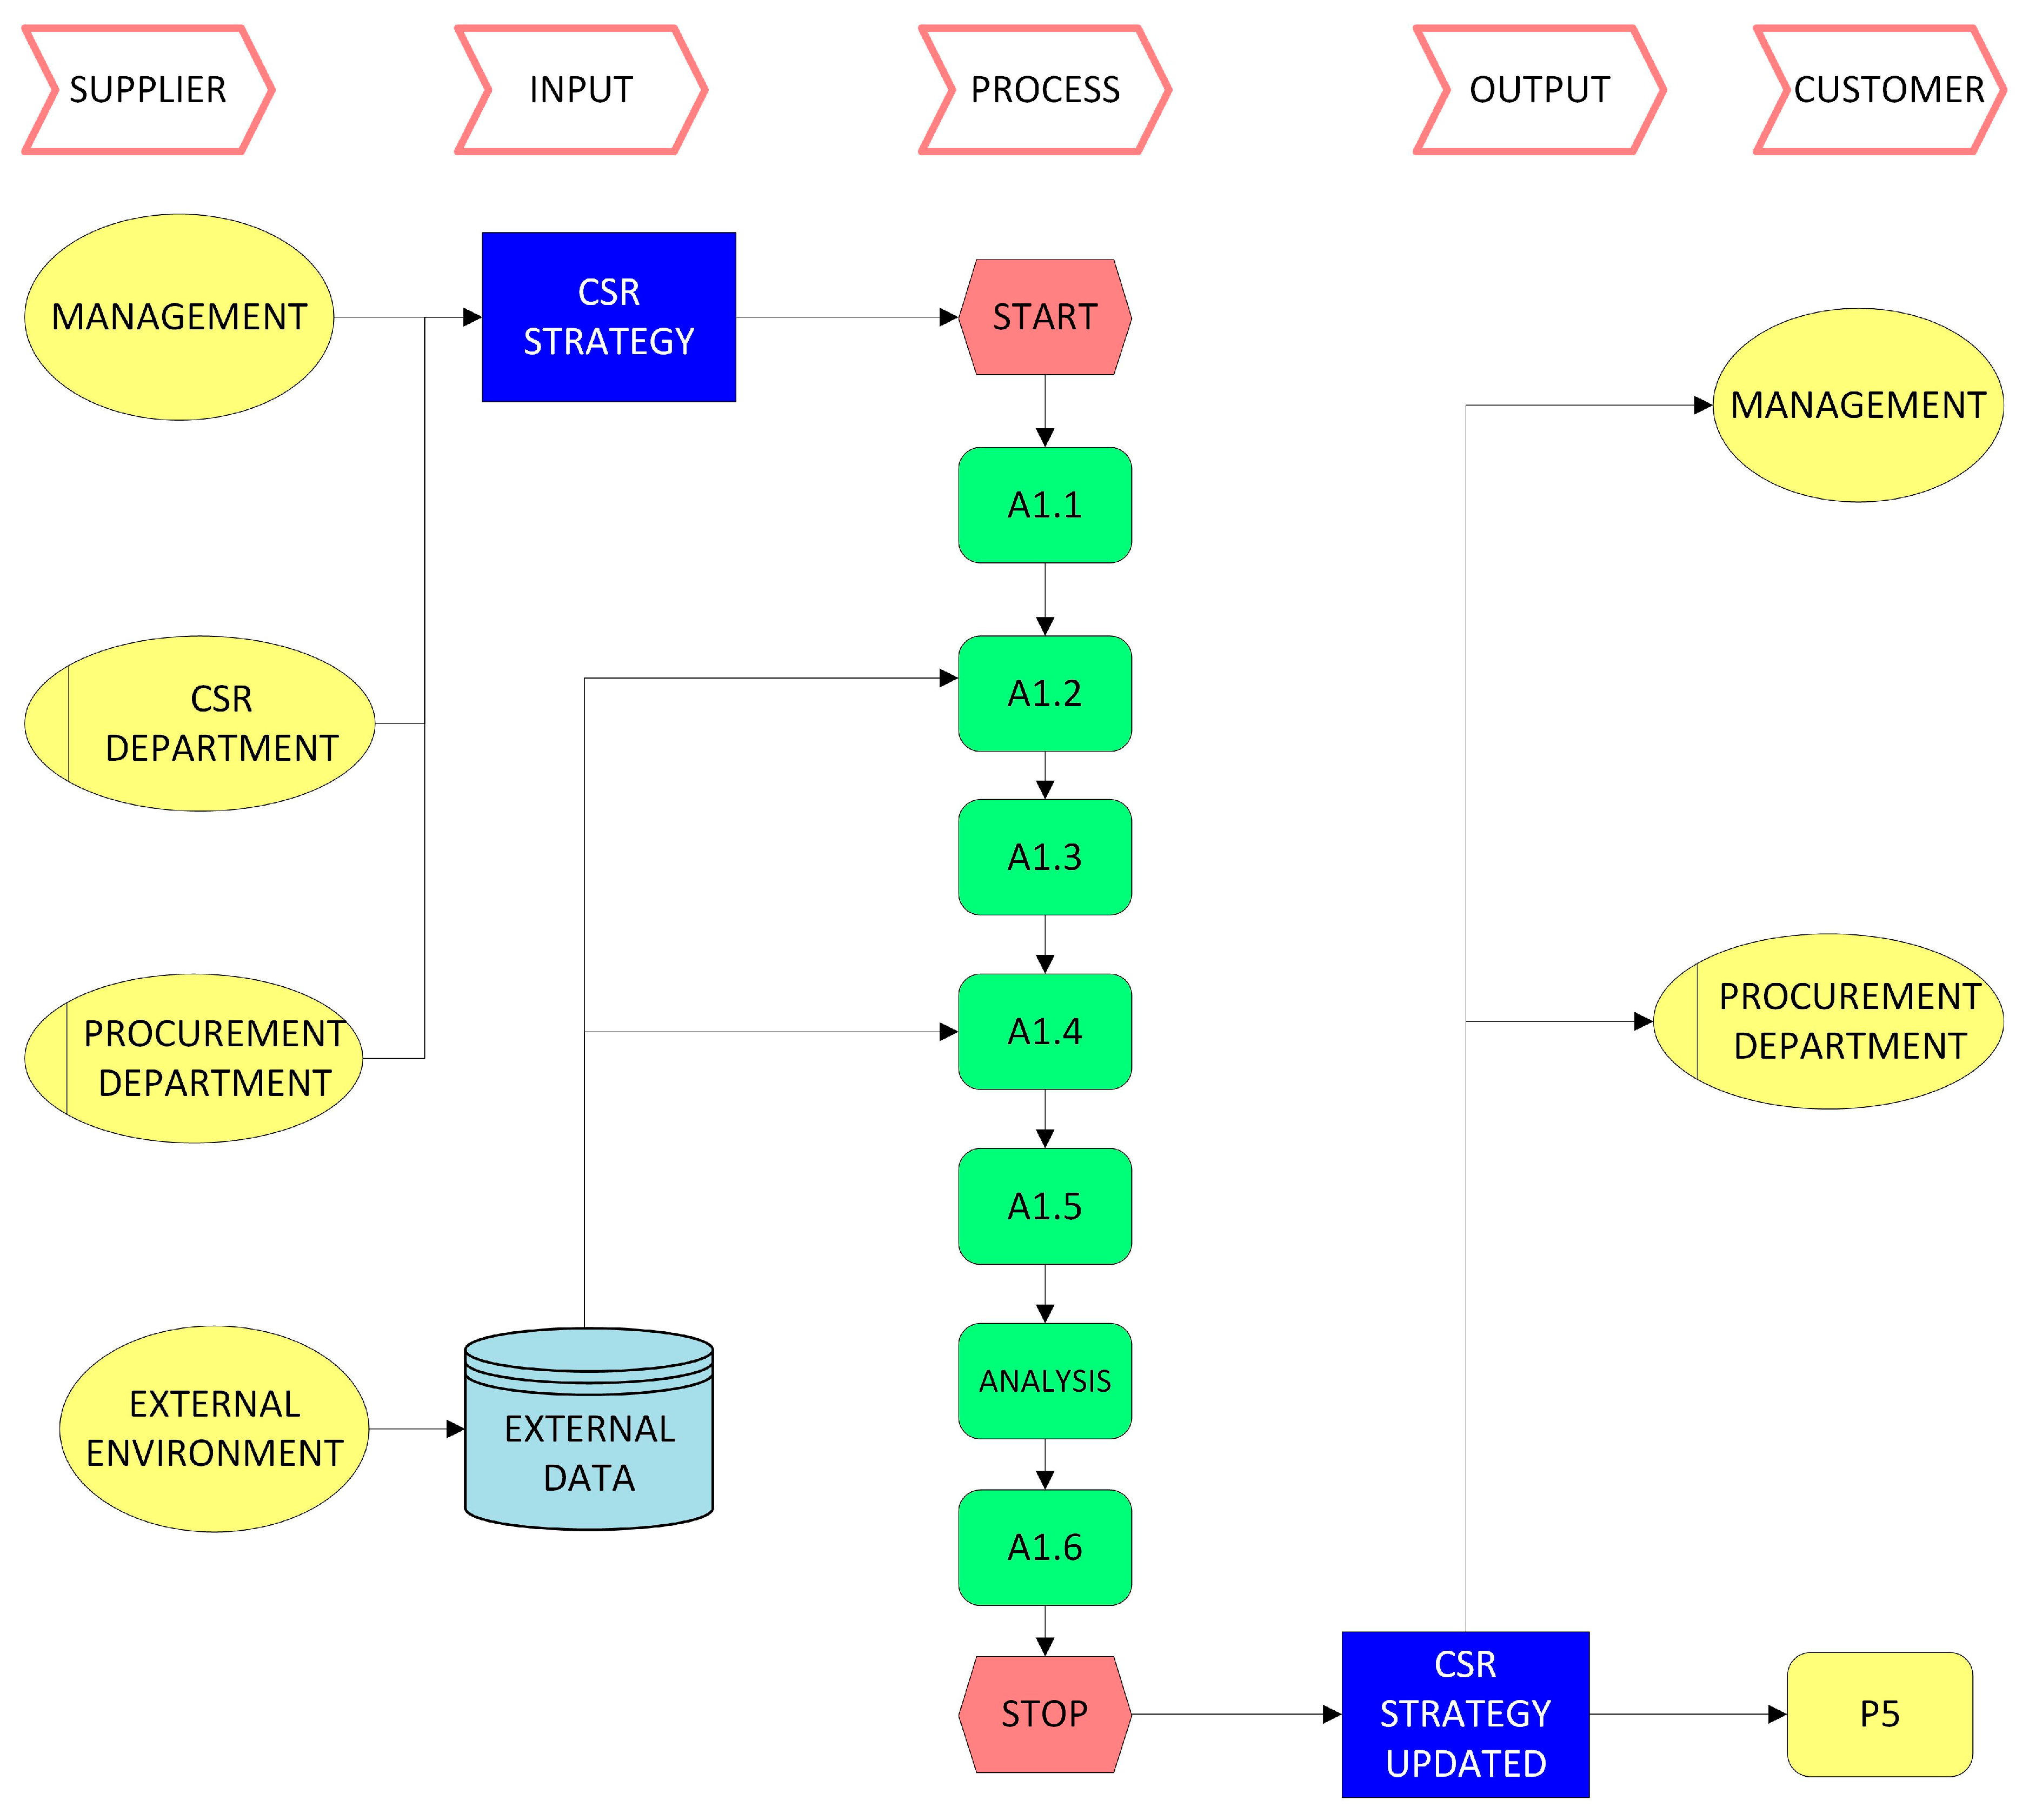
To provide a view of the processes needed to be managed to achieve energy innovation, Suppliers-Inputs-Process-Outputs-Customers (SIPOC) and Event-Driven Process Chain (EPC) methods are used. SIPOC is a graphical process representation method outlining the entities that provide the necessary data for the execution of the organizational process (Supplier), the data needed for process execution (Input data), the sequence of activities (Process), the results of the process execution (Output), and the entities that use the result (Customer) [18,19,20].
To provide a strategical view of organizational processes for stakeholders, the sequence of process activities will be represented using the EPC method [21].
For the “develop property strategy and long-term vision” (P1) process, the input data are:
- The Corporate Social Responsibility (CSR) strategy or the sustainable development strategy, available at management level and in CSR and Procurement departments.
- External data, such as rental offices information and sustainable office tools (cooling/heating devices, intelligent lighting, etc.), available through specialized agencies and market research.
The process execution will generate a corporate social responsibility report, updated with the property strategy and long-term vision, that will be used by Management, Procurement and in the “manage relations with government, quasi-government bodies, trade or industry groups” (P5) process. Figure 1 outlines the “develop property strategy and long-term vision” (P1) process.
For the “Evaluate environmental impact of products, services, and operations” (P2) process, the input data are:
- External requirements—generated through market research and collaboration with specialized agencies. For example, an agency knows how to report social responsibility performance, the applicable rules and how the organization can create a favorable cost–benefit ratio by implementing environmental, health and safety measures.
- CSR impact requirements—measured by the CSR department and known by management.
The process execution will generate the CSR program, the updated CSR database, the cost-benefit report and the CSR report, which will be used by management and the CSR department, as well as being made public in the external environment and the “manage relations with government, quasi-government bodies, trade or industry groups” (P5) process. Figure 2 outlines the “evaluate environmental impact of products, services, and operations” (P2) process.
6. Conclusions
In the context of Industry 4.0, sustainable production implies environmentally responsible business processes. This paper, through problematic, approach and results, models the implementation of a sustainable development strategy through process mapping.
Despite numerous contributions to Industry 4.0, lean manufacturing and sustainability, there are few studies on business process modeling, and the two processes analyzed in this study are not addressed in the literature.
This paper addresses two business processes responsible for energy innovation, namely “develop property strategy and long-term vision" and "evaluate environmental impact of products, services, and operations”.
By mapping their initial state with an initial set of KPIs, the authors discovered that some activities can be eliminated or executed along with another activity. To provide an overview for the stakeholders, a new set of KPIs for the processes has been proposed, and the processes have been modelled using EPC and SIPOC methods.
To create a sustainable business, the management team should improve the two mapped business processes. By developing a sustainable property strategy, the management team ensures that all their properties (offices, plants, factories) are environmentally friendly. Collaboration with specialized agencies and market research is needed to discover the latest trends in sustainability.
All companies should evaluate the environmental impact of their products, services and operational processes to provide an overview for governmental agencies and ensure their progress towards creating a sustainable business.
The study demonstrated that not only the CSR department is responsible for executing the processes and using their outcomes, but also the procurement department and the whole management team. Therefore, sustainability is a joint effort from the key departments in a company.
The study has some limitations. Firstly, the classification of the activities (value-added, non-value added and essential non-value added) is based on the authors’ experience. Secondly, the business model is not executed or tested, it is just a proposal. The next step for the study would be to test the model to validate the feasibility of the proposed solution.
To further develop this research, the study can be further expanded by designing appropriate business process control measures in order to provide a complete Six Sigma cycle.
Author Contributions
All authors contributed to writing and completing the research paper. All authors read and approved the final version of the manuscript.
Funding
This research received no external funding.
Conflicts of Interest
The authors declare no conflict of interest.
References
- Brundtland, G. Report of the World Commission on Environment and Development: Our Common Future. In United Nations General Assembly Document A/42/427; 1987; Available online: https://sustainabledevelopment.un.org/content/documents/5987our-common-future.pdf (accessed on 5 July 2020).
- Varela, L.; Araújo, A.; Ávila, P.; Castro, H.; Putnik, G. Evaluation of the Relation between Lean Manufacturing, Industry 4.0, and Sustainability. Sustainability 2019, 11, 1439. [Google Scholar] [CrossRef]
- Brozzi, R.; Forti, D.; Rauch, E.; Matt, D.T. The Advantages of Industry 4.0 Applications for Sustainability: Results from a Sample of Manufacturing Companies. Sustainability 2020, 12, 3647. [Google Scholar] [CrossRef]
- García-Muiña, F.E.; Medina-Salgado, M.S.; Ferrari, A.M.; Cucchi, M. Sustainability Transition in Industry 4.0 and Smart Manufacturing with the Triple-Layered Business Model Canvas. Sustainability 2020, 12, 2364. [Google Scholar] [CrossRef]
- Bonilla, S.H.; Silva, H.R.O.; Da Silva, M.T.; Gonçalves, R.F.; Sacomano, J.B. Industry 4.0 and Sustainability Implications: A Scenario-Based Analysis of the Impacts and Challenges. Sustainability 2018, 10, 3740. [Google Scholar] [CrossRef]
- Oláh, J.; Aburumman, N.; Popp, J.; Khan, M.A.; Haddad, H.; Kitukutha, N. Impact of Industry 4.0 on Environmental Sustainability. Sustainability 2020, 12, 4674. [Google Scholar]
- European Telecommunications Network Operators’ Association Facts & Figures about European Telecoms Operators. Available online: https://etno.eu/datas/ETNO%20Documents/Facts%20%20Figures_final.pdf (accessed on 26 June 2020).
- Ahmadi, H.B.; Petrudi, S.H.H.; Wang, X. Integrating sustainability into supplier selection with analytical hierarchy process and improved grey relational analysis: A case of telecom industry. Int. J. Adv. Manuf. Technol. 2016, 90, 2413–2427. [Google Scholar] [CrossRef]
- Couckuyt, D.; Van Looy, A. Green BPM as a Business-Oriented Discipline: A Systematic Mapping Study and Research Agenda. Sustainability 2019, 11, 4200. [Google Scholar] [CrossRef]
- APQC Telecommunications Process Classification Framework. Available online: https://ebpm.ir/wp-content/uploads/2018/05/PCF_Telecom_Ver_5.0.2.pdf (accessed on 26 June 2020).
- Vodafone Sustainable Business Report 2019. Available online: https://www.vodafone.com/content/dam/vodcom/sustainability/pdfs/sustainablebusiness2019.pdf (accessed on 26 June 2020).
- Orange Raport de Sustenabilitate 2016–2017. Available online: https://www.orange.ro/responsabilitate-sociala/rapoarte-csr/2016-2017-raport-csr.pdf (accessed on 26 June 2020).
- Deutsche Telekom Corporate Responsibility Report 2018. Available online: https://www.cr-report.telekom.com/site19/sites/default/files/pdf/cr_en_2018_dt_final.pdf (accessed on 26 June 2020).
- Vodafone Sustainable Business Report 2019-Data Supplement. Available online: https://www.vodafone.com/content/dam/vodcom/sustainability/pdfs/data-supplement-2019.pdf (accessed on 26 June 2020).
- Lindberg, C.-F.; Tan, S.; Yan, J.; Starfelt, F. Key Performance Indicators Improve Industrial Performance. Energy Procedia 2015, 75, 1785–1790. [Google Scholar] [CrossRef]
- Value Stream Mapping: Definition, Steps, and Examples. Available online: https://tallyfy.com/value-stream-mapping/ (accessed on 26 June 2020).
- Womack, J.P.; Jones, D.T. Lean Thinking; Free Press: New York, NY, USA, 2003. [Google Scholar]
- Furterer, S. Lean Six Sigma in Service: Applications and Case Studies; CRC Press: Boca Raton, FL, USA, 2009. [Google Scholar]
- Michael, L.G. Lean Six Sigma for Service: How to Use Lean Speed and Six Sigma Quality to Improve Services and Transactions; McGraw-Hill: New York, NY, USA, 2003. [Google Scholar]
- Fleacă, E.; Fleacă, B.; Maiduc, S. Aligning Strategy with Sustainable Development Goals (SDGs): Process Scoping Diagram for Entrepreneurial Higher Education Institutions (HEIs). Sustainability 2018, 10, 1032. [Google Scholar] [CrossRef]
- ARIS Community Event-Driven Process Chain (EPC). Available online: https://www.ariscommunity.com/event-driven-process-chain (accessed on 26 June 2020).
Figure 1.
Future state for P1 process.

Figure 2.
Future state for P2 process.


Table 1.
Groups of business processes.
| Programs Claimed in CSR Reports | APQC Process | Process Data | APQC Category Number |
|---|---|---|---|
| Smart City Alba Iulia (Orange), Smart City Piatra Neamt (Telekom) | P2.2: Develop products and services | Purchased goods and services: 4.000.000 tonnes CO2 (Vodafone) | C2 |
| Supplier Performance Management Program (Vodafone), Supplier Code of Conduct (Telekom) | P4.8: Develop and manage supply chain | - | C4 |
| Code of Ethical Purchasing (Vodafone), Certification in responsible purchasing (Orange) | P9.1: Design and construct/acquire non-productive assets | Energy consumed (GWh): 5582 (Vodafone) Energy consumed (GWh): 9928 (Orange) | C9 |
| Regular company audits (PwC audits for Telekom, JAC audits for Vodafone) | P10.1: Determine health, safety, and environment impacts | 3% reduction (Vodafone) 2% emission (Telekom) | C10 |
| P10.5: Ensure compliance with regulations | JAC audits for suppliers: 79, Vodafone audits for suppliers: 6, Number of stations evaluated using employee questionnaires: 12 (Vodafone) | ||
| #RedLovesGreen, thrive (Vodafone) Certification OHSAS 18001:2007, Employees Forum, Plaza Hobbies Community (Orange), HSE Management System (Telekom) | P10.2: Develop and execute health, safety, and environmental program | 90% of employees completed the Code of Conduct training (Vodafone) | |
| P10.3: Train and educate employees | |||
| P10.4: Monitor and manage health, safety, and environmental management program | |||
| Regular company audits | P10.6: Manage remediation efforts | Quarterly verification by JAC (Vodafone) | |
| GRI G4 Reporting | P11.2: Manage government and industry relationships | GRI Reports (Vodafone, Orange) | C11 |
| Conflict Materials Report (Vodafone), Ethical code (Orange) | P11.4: Manage legal and ethical issues | 90% of employees completed the Code of Conduct training (Vodafone) |
Table 2.
P1 process-initial state.
| No. | Activity | KPI | Value | Justification |
|---|---|---|---|---|
| A1.1 | Confirm alignment of property requirements with business strategy | Requirements list completed 70% | VA | Prevents repetition of next activities |
| A1.2 | Assess the external environment | External environment analysis completed 70% | VA | Necessary for the smooth process execution |
| A1.3 | Analyze the budget for acquiring/renting properties | Financial analysis completed 70% | NVA | Can be carried out along with the decision-making activity |
| A1.4 | Determine build or buy decision for properties | Decision document completed 100% | VA | Decision to take |
| A1.5 | Analyze requirements for workspace assets | Requirements list completed 70% | ENVA | To learn how to create “an environmentally responsible business” |
| A1.6 | Analyze the budget for acquiring/renting workspace assets | Financial analysis document completed 70% | NVA | Can be carried out along with the decision-making activity |
| A1.7 | Determine build or buy decision for assets | Decision document completed 100% | VA | Decision to take |
| A1.8 | Analysis and evaluation | Lists analyzed and completed 90% | ENVA | Alignment and prevents repetition of next activities |
| A1.9 | Improve the organization’s sustainable development strategy | Sustainable development strategy completed 90% | ENVA | To include the property strategy |
Table 3.
P2 process-initial state.
| No. | Activity | KPI | Value | Justification |
|---|---|---|---|---|
| A2.1 | Evaluate environmental impact of products, services, and operations | Emission reduction by 3% | VA | Prevents repetition of next activities |
| A2.2 | Conduct health and safety and environmental audits | Renewable energy use 15% | NVA | To identify the regulations |
| A2.3 | Identify regulatory and stakeholder requirements | Regulatory document completed 80% | NVA | To avoid repetition of activities |
| A2.4 | Assess future risks and opportunities | List of risks completed 80% | VA | Necessary for the next activity |
| A2.5 | Create emergency response program | Emergency plan completed 80% | VA | The result is the basis for the CSR plan |
| A2.6 | Create pollution prevention program | Prevention plan completed 80% | VA | The result is the basis for the CSR plan |
| A2.7 | Create health, safety, and environmental (EHS) program | EHS plan completed 80% | VA | The result is the social responsibility program-the purpose of this process |
| A2.8 | Implement EHS program | Success rate 80% | VA | To implement the CSR program |
| A2.9 | Record and manage EHS events | Database completed 80% | VA | To report CSR results |
| A2.10 | Analyze EHS information | Analysis document completed 90% | NVA | The data can be analyzed in relation to the cost and benefit of implementing the program |
| A2.11 | Perform cost-benefit analysis | Favorable cost-benefit ratio 70% | VA | To evaluate the progress |
| A2.12 | Monitor compliance with regulations | Compliance rate 90% | VA | To ensure compliance with regulations |
| A2.13 | Manage remediation efforts | Corrections applied 90% | VA | Activity required only if the company is not compliant |
| A2.14 | Report social responsibility performance | Annual report delivered 100% | VA | To evaluate the progress from year to year |
Table 4.
P1 process-future state.
| No. | Activity | KPI (Name) | KPI (Unit of Measurement) |
|---|---|---|---|
| A1.1 | Confirm alignment of property requirements with business strategy | Requirements list completed | 100% |
| A1.2 | Assess the external environment | External environment analysis document completed | 100% |
| A1.3 | Determine decision for properties | Decision document completed | 100% |
| A1.4 | Analyze requirements for assets | Requirements list completed | 100% |
| A1.5 | Determine decision for assets | Decision document completed | 100% |
| A1.6 | Analysis and evaluation | Lists analyzed and completed | 100% |
| A1.7 | Improve the organization’s sustainable development strategy | Sustainable development strategy completed | 100% |
Table 5.
P2 process-future state.
| No. | Activity | KPI (Name) | KPI (Unit of Measurement) |
|---|---|---|---|
| A2.1 | Evaluate environmental impact of products, services, and operations | Emission reduction | 50% |
| A2.2 | Conduct health and safety and environmental audits | Renewable energy use | 100% |
| A2.3 | Identify regulatory and stakeholder requirements | Regulatory document completed | 100% |
| A2.4 | Assess future risks and opportunities | List of risks completed | 100% |
| A2.5 | Create emergency response program | Prevention plan completed | 100% |
| A2.6 | Create pollution prevention program | Prevention plan completed | 100% |
| A2.7 | Create health, safety, and environmental (EHS) program | EHS plan completed | 100% |
| A2.8 | Implement EHS program | Success rate | 100% |
| A2.9 | Record and manage EHS events | Database completed | 100% |
| A2.10 | Perform cost-benefit analysis | Cost-benefit ratio | 100% |
| A2.11 | Monitor compliance with regulations | Compliance rate | 100% |
| A2.12 | Manage remediation efforts | Corrections applied | 100% |
| A2.13 | Report social responsibility performance | Annual report delivered | 100% |
Publisher’s Note: MDPI stays neutral with regard to jurisdictional claims in published maps and institutional affiliations. |
© 2020 by the authors. Licensee MDPI, Basel, Switzerland. This article is an open access article distributed under the terms and conditions of the Creative Commons Attribution (CC BY) license (http://creativecommons.org/licenses/by/4.0/).
Share and Cite
MDPI and ACS Style
Tătaru, I.M.; Fleacă, E.; Fleacă, B.; Stanciu, R.D. Modelling the Implementation of a Sustainable Development Strategy through Process Mapping. Proceedings 2020, 63, 6. https://0-doi-org.brum.beds.ac.uk/10.3390/proceedings2020063006
AMA Style
Tătaru IM, Fleacă E, Fleacă B, Stanciu RD. Modelling the Implementation of a Sustainable Development Strategy through Process Mapping. Proceedings. 2020; 63(1):6. https://0-doi-org.brum.beds.ac.uk/10.3390/proceedings2020063006
Chicago/Turabian StyleTătaru, Ioana Miruna, Elena Fleacă, Bogdan Fleacă, and Radu D. Stanciu. 2020. "Modelling the Implementation of a Sustainable Development Strategy through Process Mapping" Proceedings 63, no. 1: 6. https://0-doi-org.brum.beds.ac.uk/10.3390/proceedings2020063006