1. Introduction
Marine litter is a global problem affecting the world’s oceans, with millions of plastic items ending up in the sea and affecting marine ecosystems [
1,
2,
3]. There has been a rapid escalation in plastic pollution in the marine environment over the last few decades, posing a severe environmental risk to many habitats globally.
Coastal zones are among the most populated and most productive areas globally, having a variety of habitats and ecosystems. They are close to land-based pollution sources, such as ports, cities, and rivers; thus, marine litter is present in high quantities [
4,
5,
6,
7]. Several initiatives have been planned by global and local players towards detection, monitoring, and cleaning [
1,
8,
9,
10,
11,
12,
13,
14,
15].
Monitoring programs have been implemented to map, spatially and temporally, the load and type of marine litter on beaches worldwide [
2,
16,
17,
18,
19,
20]. State-of-the-art techniques were examined to detect and quantify floating marine litter [
21,
22,
23,
24,
25,
26,
27,
28].
Already, the scientific community is working towards the specification of sensors detecting and quantifying marine litter. Scientists, stakeholders, and policymakers have shown a rising interest in remote sensing technologies’ prospective applications in generating complementary benchmark data about marine litter [
9,
15,
21,
28,
29]. All these entities have expressed a dire need for core end-products/descriptors from remote sensing technologies that are relevant to the (i) detection, (ii) identification, (iii) quantification, and (iv) mapping of ML.
Unmanned aerial systems (UAS) can be used in this direction [
21,
22,
30,
31,
32,
33,
34]. UAS can provide high-quality monitoring information and products about the coastal environment at the local scale [
35,
36,
37,
38,
39,
40]. This information can equip policymakers, stakeholders, and citizens with a better understanding of marine litter pollution and how to manage and mitigate the ML problem. UAS can bridge the gap from local observations to regional mapping using earth observation (EO) data [
41]. Recent works have demonstrated the feasibility of UAS for mapping stranded marine macro-litter >2.5 cm [
42] on the orthomosaic produced from drone flight [
22,
23,
24,
26,
43,
44]. Automatic detection and reporting are essential for such a procedure; thus, several attempts are using artificial intelligence (AI) approaches for fast and accurate responses. Recent works have explored the viability of an UAS-based approach to detect, identify, and classify marine litter in coastal areas by applying automated detection using machine learning methods or deep learning techniques [
22,
34,
45,
46,
47,
48].
Fallati et al. proposed an ad-hoc methodology for monitoring and automatically quantifying anthropogenic marine debris (AMD) on the basis of the combined use of a commercial UAS (equipped with an RGB high-resolution camera) and a deep-learning-based software [
45]. The high-resolution images acquired from UAS allowed for the visual detection of a percentage of the objects on the shores higher than 87.8%, thus providing suitable images to populate training and testing datasets. The PlasticFinder software was used, reaching a sensitivity of 67%, with a positive predictive value of 94%, in the automatic detection of AMD. Their study confirmed the efficiency of commercial UAVs as tools for AMD monitoring and the potential use of deep learning methods to automatically detect and quantify AMD.
An attempt to automate the process of marine litter recognition in beach dune systems using UAV images and machine learning methods is presented in Martin et al. [
34]. In their study, the use of the random forest (RF) classifier was examined for beach litter detection from orthomosaics. To increase the performance of their automatic detection process, the authors proposed three different RF classifiers. The first two classifiers aim to classify positive (beach litter) and negative (sand, vegetation, etc.) samples and the third classifier is responsible for distinguishing beach litter into three categories: (a) drink containers, (b) bottle caps, and (c) plastic bags. The third classifier’s training and validation image-sets were clipped in 64 by 64 pixel tile images from orthomosaics. The authors interfered in the test sample by selecting images containing more litters into less complicated backgrounds. The results of the multi-class classifier were compared with a manual/visual screening survey. The results were compared to a visual survey providing significantly low accuracy and detection rates of 44% for drink containers, 5% for bottle caps, and 3.7% for plastic bags.
Gonçalves et al. [
46] explored the use of machine learning methods to automate marine litter detection from UAV orthomosaics. Along with the RGB orthomosaics, they convert color representations in the following color spaces HEX, CIE-Lab, and YCbCr. Their color-based approach relies on the argument that marine litter exists under several color and shape variations in contrast with the beach’s background. An RF classifier was used along with the pixel-by-pixel classification technique. A visual survey was conducted that identified 311 litter objects, which were digitized and used as training and validation image-sets with a split ratio of 60%/40%, respectively. Orthomosaics were clipped in 320 × 320 pixel blocks and further resampled in 64 × 64 pixels using the bicubic interpolation method to increase the computational performance. The results of this approach achieved an f-score of 75%.
The comparison between manual screening and two types of machine learning methods for marine litter detection was examined in Gonçalves et al. [
22]. In this work, the authors extended their previous research, training a convolutional neural network (CNN) to compare manual screening results. DenseNet architecture was used on behalf of CNNs trained on 48 × 48 image tiles obtained by the RGB orthomosaic and their additional color conversions. On the basis of the manual survey, the authors annotated tiled images in litter and no litter images and used this to train the CNN. This study showed better results in the RF classifier approach with an f-score of 70%, while the CNN f-score was significantly lower (60%).
The above studies focused on small-scale applications on which typical machine learning models such as RF and support vector machines (SVMs) performed quite well in detecting litter. Large image-sets may benefit machine learning model performance, and therefore architectures with larger learning capacity are required. Image-sets such as ImageNet and the technological advances in parallel computing through GPUs make CNNs very successful for computer vision applications [
49]. CNNs may be a potentially useful tool in marine litter recognition.
Kylili et al. [
48] investigated the use of deep learning techniques to identify floating marine debris from on-vessel camera systems. They used a pre-trained VGG16 architecture on the ImageNet dataset realizing the transfer learning approach and bottleneck method to classify images into three categories: (a) plastic bottles, (b) plastic buckets, and (c) plastic straws. Using geometric transformations, the authors created a total image-set of 12,000 samples to form training and validation datasets with a split ratio of 80% (9600 images) and 20% (2400 images), respectively. The test dataset consisted of 165 images and achieved an overall accuracy of 86%. Kylili et al. [
47] attempted to improve their previous approach by extending the number of classes from three to eight, which increased the training and validation image-sets. In order to evaluate CNN performance, the authors used a testing image-set of 400 samples, giving an overall accuracy of 90%, which improved their previous result by 4%.
Although research has been done using UAS machine learning approaches for monitoring ML in the coastal zone, to date, no efforts have been made to broaden the application of UAS to use citizen science for data acquisition. Furthermore, recent works have demonstrated the feasibility of UAS for mapping marine litter on the orthophoto map produced from drone flights for the ML mapping. As the automatic detection of ML in the coastal zone becomes a necessity, the UAS machine learning approach is employed in this direction. Thus, the creation of a massive training dataset with ML is required for the training of machine learning algorithms, for which citizen science/crowdsourcing approaches could be successfully applied.
In this context, we foresee many opportunities to use citizen science for both data acquisition and data annotation for ML automatic detection in the coastal zone. Therefore, we propose a citizen science UAS data acquisition protocol to enhance the data collection and apply machine learning detection in the aerial images to quantify ML load in the coastal zone. This study aimed to explore the use of citizen science drone data in an integrated approach for automatic marine litter detection. We created “marine litter density maps” on the beach and nearshore through citizen science/crowdsourcing approaches combined with deep learning algorithms. Furthermore, this study investigated the performance of five convolutional neural network (CNN) architectures for the recognition and mapping of marine litter from high-resolution UAS-derived images acquired from complex beach backgrounds, including the results of a first experimental application in Xabelia Beach, Mytilene Lesvos. The Xabelia dataset was not used to train the deep learning models; thus, our approach’s generalization ability was evaluated in a new unknown beach. This approach contributes to the geographical transferability of the method to new and unknown beaches.
2. Materials and Methods
Guidelines and protocols have been designed to standardize monitoring strategy performance on the coastal zone, defining the survey methods [
42,
50,
51,
52]. To date, the most common method for monitoring marine litter involves in situ visual surveys on the beach [
33,
53,
54].
In this context, this study proposes a methodology that involves the combination of state-of-the-art deep learning models with drone technologies to provide quantification results on marine litter concentrations through density maps. More specifically, this study implements concrete methodological steps for the appropriate citizen science use of popular commercial off the shelf drones as close remote sensing data acquisition platforms to acquire data for ML mapping in the coastal zone. We propose a crowdsource-based classification scheme for data annotation and their combination with deep learning models to map and quantify ML accumulation. Mapping methods were studied to provide the best geo-visualization results that illustrate the automated ML quantification results. The AI-extracted results were illustrated as density maps depicting ML concentrations, showcasing their overall distribution and concentration trends.
For the completion of each objective, we implemented robust methodological steps. More specifically, our framework is based on the combination of protocols to (i) provide data acquisition standards to non-experienced citizens using commercial UAS for ML detection, (ii) annotate commercial drone images using citizen science platforms, (iii) train deep-learning models for ML visual recognition and evaluate their performance, and (iv) create specific geo-visualizations and maps illustrating the ML geographic clustering.
The majority of commercial of-the-shelf drones are equipped with optical imagers having true-color RGB sensors. RGB data were acquired and inserted into the AI algorithmic process to detect and quantify marine in the coastal zone to attain litter density.
Our work conceptualizes the best practices for applying state-of-the-art deep learning models to automate marine litter detection and quantification on the coastal zone using RGB raw UAS aerial images.
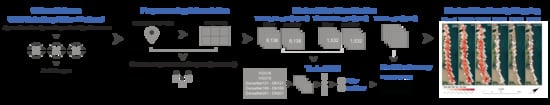
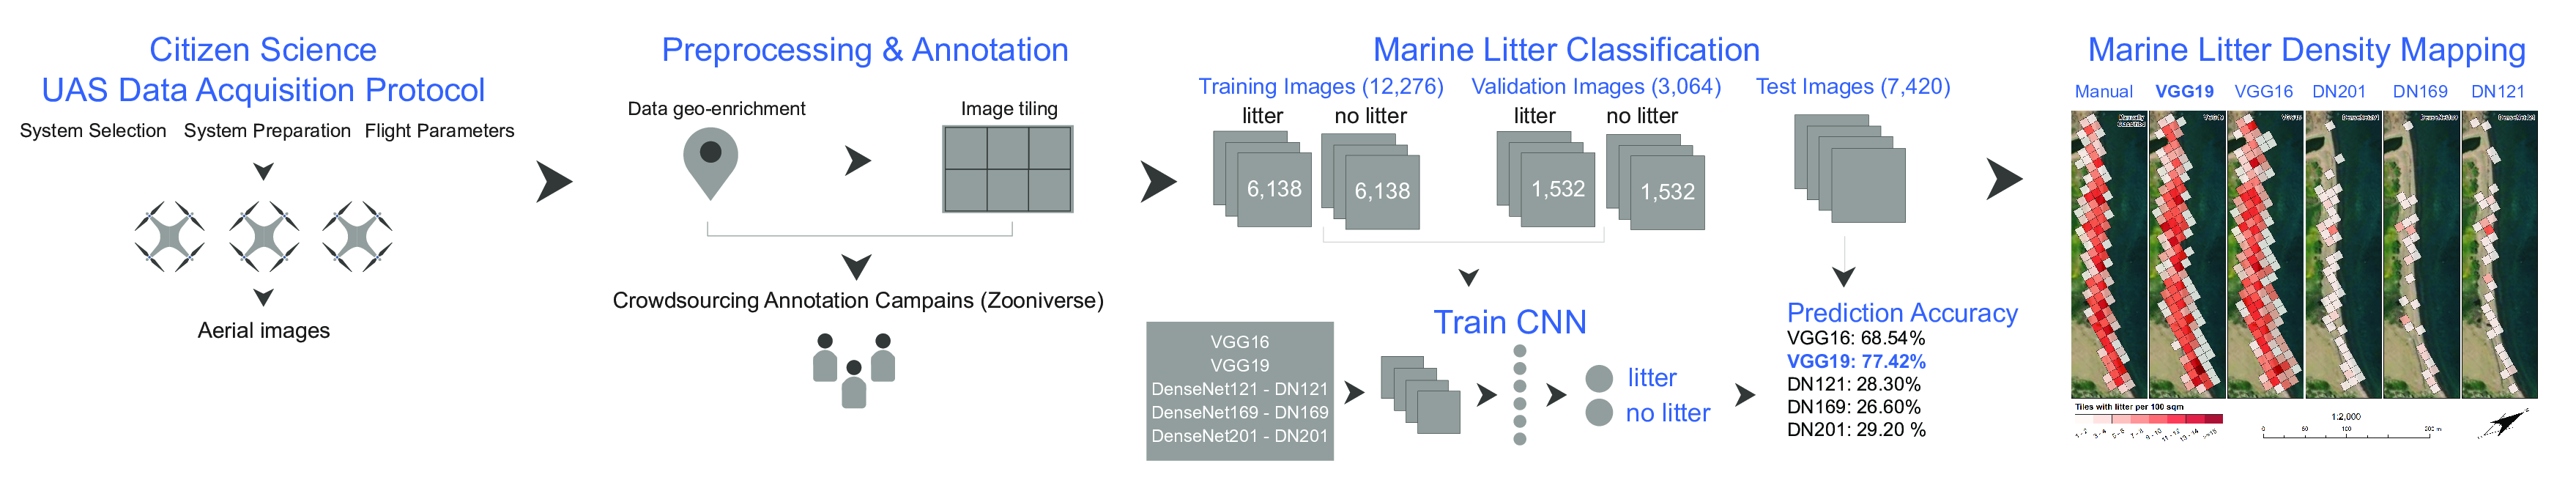
The proposed methodology consists of 4 pillars. The first pillar is the data acquisition protocol that enables the system selection, system preparation, mission programming, and the data acquisition flight. The second pillar consists of the (a) preprocessing step, where automatic image segmentation into tiles and geo-enrichment takes place, and (b) the annotation process through citizen science annotation campaigns. The third pillar is the automatic ML recognition and mapping steps using the annotated data to predict the ML existence in all tile dataset. Finally, an ML density map for the study area is produced. The following flowchart (
Figure 1) illustrates the methodological steps and the overall structure of the approach proposed by this study.
2.1. UAS Data Acquisition Protocol
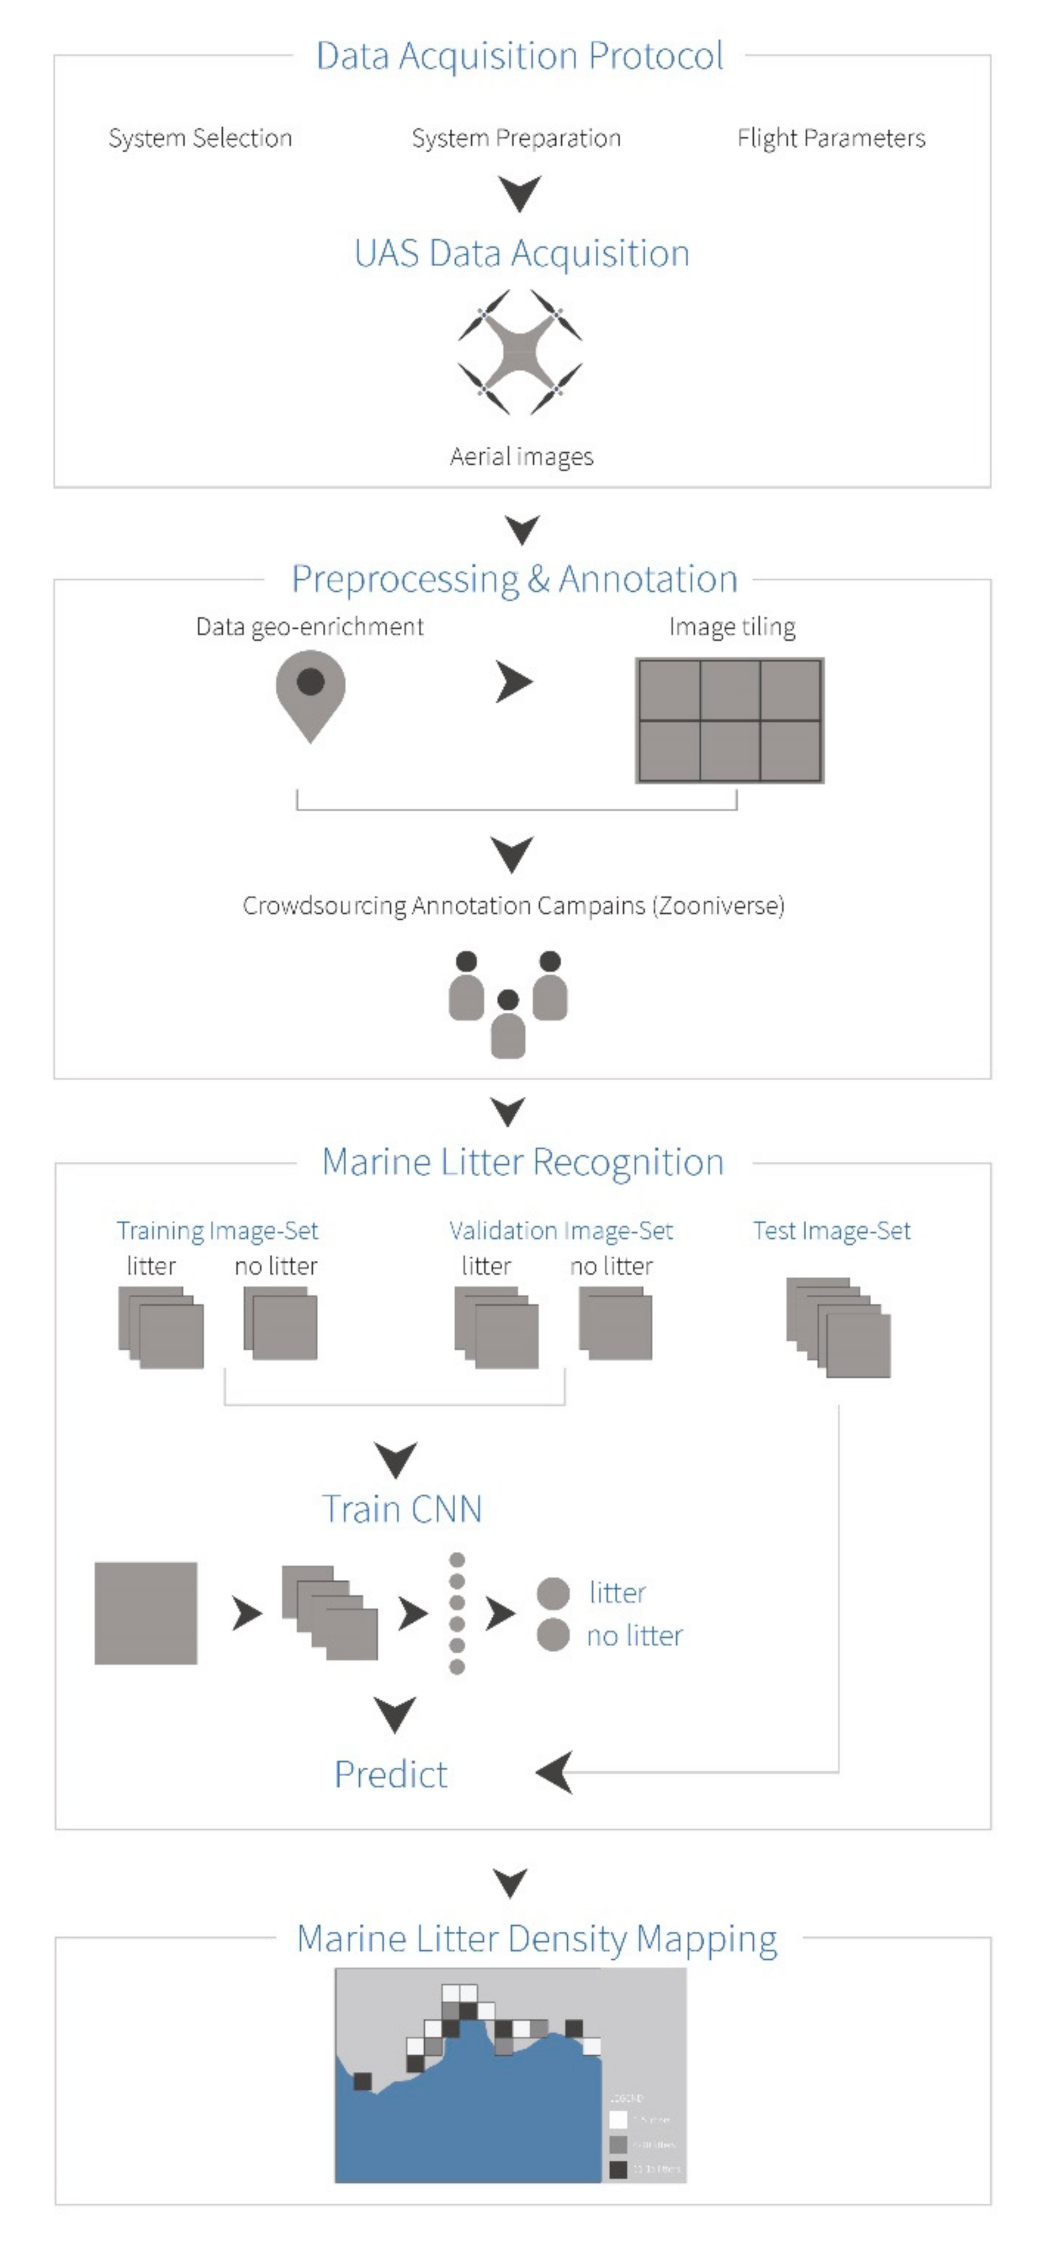
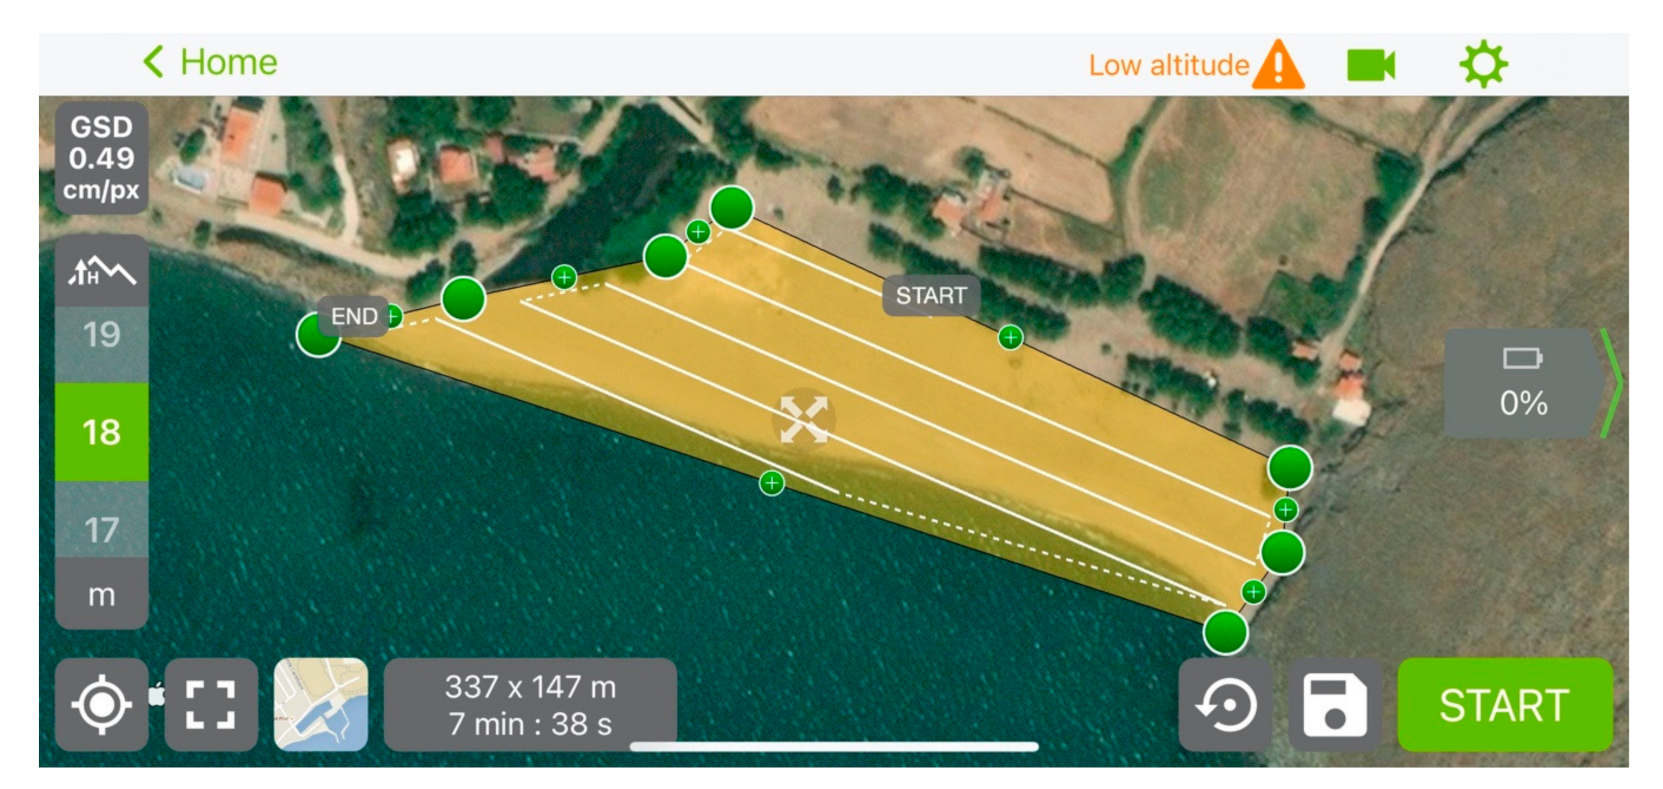
A UAS data acquisition framework was created and validated for citizen science data acquisition using off-the-shelf commercial drones. The idea was to create a protocol that will empower drone owners to act as stewards of the environment by providing survey data to enhance the data acquisition process, thus providing new and valuable data with minimum cost to the scientists mapping ML in the coastal zone. This framework was based on simple defined drone and flight parametrization steps to form an easy-to-follow data collection protocol for non-experienced commercial drone owners. The Pix4Dcapture (
Figure 2) drone flight planning mobile application was selected to accomplish accurate citizen science data acquisition for ML mapping in the coastal zone [
55].
This application is freely available from Pix4D to all drone owners that want to plan UAS flights for optimal mapping. An additional important factor for this selection was the compatibility of the application with the two most common mobile operating systems (iOS and Android) that provide protocol interoperability and use by a broader range of citizen scientists (individuals, non-governmental organizations, institutions, public organizations, etc.). Moreover, the application is “flexible”, as it supports drones from 3 of the biggest drone manufacturers on the market: DJI, Parrot, and Yuneec [
55]. Through an easy-to-parameterize interface, the users can create flight missions and select flight details to acquire data in a consistent way. Thus, non-experienced citizen scientists can easily define the size of a mission to map areas of all sizes in order to customize mapping parameters such as the image overlap, camera angle, and flight altitude according to ML acquisition needs. The application provides an easy start and fly fully automatic data acquisition process where the drone sensor is automatically triggered according to the optimal acquisition parameters.
A collection protocol that is easy to follow for non-experienced commercial drone owners was created, relying on simple defined drone and flight parametrization steps using the selected mobile application. The proposed data acquisition protocol’s basic parameters were defined through considering and investigating the best operating condition for a commercial aerial drone to maximize the data acquisition for ML identification. Factors investigated included the (i) operating altitude of the drone above ground level (AGL), (ii) time of day (noon, afternoon between 12 p.m. and 3 p.m.), (iii) weather condition (sunny, cloudy), and (iv) substrate homogeneity of the beach (with high or low density of gravels and pebbles, etc.). We hypothesized that these factors would affect the quality of the photos taken, and hence the accuracy in marine litter identification. Data acquisition protocol’s efficacy was checked using two of the most popular mid-range commercial drone DJI Drones: Mavic Mini Enterprise and Phantom 4 Pro v2 [
56,
57].
The drones were controlled using Pix4Dcapture in Android and iOS mobile devices, allowing an automatic flight realization to map a specific preselected area. A series of photos were taken from both drones under different operating conditions, as mentioned above. After the test flights and checking the images acquired, we ended up with the following desirable parameters for mapping ML in the coastal zone.
The camera should be pointed at nadir (90° to the ground) with automatic settings to allow for good marine litter shape and size detection without the need for image rectification during post-processing. The maximum light sensitivity (ISO) should be set at 1000 to ensure that the photos will be taken at a shutter speed fast enough (usually 1/400 s–1/1000 s, depending on the time of the day and weather condition) to avoid blurry images. The photos must have a ground sample distance (GSD) of 0.5 centimeters, sufficient to capture a standard plastic bottle cap into 4 pixels. The desirable image frontal and lateral overlap is 20% between the photos, ensuring that all the coastal area will be covered, and no unnecessary images will be taken. The small proposed front and lateral overlap were guided from the deep learning algorithm quantification process resulting in denser ML approximation. Increasing both side and front overlap values lead to ML identification numerous times on the overlapped images. Thus, the image front and side overlap were both reduced to 20%. This value is the minimum required to ensure sufficient full beach coverage. Finally, the desirable UAS data acquisition speed was set to 5 m/s (18 Km/h), ensuring that during data acquisition, all citizen scientists can take control of their drone if something unexpected occurs when flying.
Finally, for selecting the appropriate drone’s altitude above ground level (AGL), we considered the GSD of 5mm. While flying at an altitude of 18m (AGL), most commonly used off-the-shelf commercial drones can take images with a 2 to 4 px/cm pixel density. These pixel densities allow for integration with available machine learning-based object detection algorithms [
58,
59] and provide sufficient visual information for small marine litter detection and classification by the human eye [
32].
2.2. Data Acquisition and UAS Survey
The UAV-borne measurements were taken using an off-the-shelf UAV and processed using an online annotation tool. The UAS data acquisition was conducted on the 29 September 2020 at 12:00 on a sunny day. As a study area, the Xabelia beach in Lesvos, Greece, was selected. The beach is located to the northeast of Lesvos island, having a complex background where organic and inorganic debris are deposited by wave action. The aerial survey was performed using a DJI Phantom 4 Pro v2 quadcopter equipped with a 20-megapixel camera with a mechanical shutter mounted to a three-axis gimbal. The three-axis brushless gimbal smooths the camera’s angular movements, dampens vibrations, and maintains the camera at a predefined level. The camera sensor has a lens of 24 mm (35 mm format equivalent) focal length with 84 degrees field of view and a 1-inch CMOS (complementary metal oxide semiconductor) sensor. The UAS has a hover accuracy of ±0.5 m vertically and ±1.5 m horizontally as is using the GPS/GLONASS positioning system in combination with a barometer and inertial measurement unit (IMU). Finally, the drone is equipped with an intelligent flight battery that provides approximately 23 min of flight time under normal conditions [
57].
Concerning the data acquisition, a non-experienced UAS pilot collected the data following the acquisition protocol proposed. The mission planning was implemented using the Pix4Dcapture and included all the parameters that allow the UAS to perform the flight autonomously. On the basis of the parameters proposed, the flight mission software computed—for the given camera model—the expected ground sampling distance (GSD) and the flight path to follow (
Figure 3). The drone was set to fly at an altitude of 18 m, with the camera gimbal set to −90◦ for capturing photos perpendicular to the flight’s direction. The images with a resolution of 5472 × 3648 pixels (aspect ratio 3:2) were overlapped with 20% front and lateral overlap, having 0.49 cm image nominal spatial resolution (GSD). The flight plan was executed autonomously from the UAS and lasted 7 minutes and 38 seconds, collecting 106 aerial images.
2.3. Data Preprocessing
Every image acquired from the drone saves valuable metadata in exchangeable image file format (EXIF), which can be accessed during post-processing. The EXIF metadata stored in the raw image files contains specific DJI flight metadata such as GPS location, flight speed, GPS altitude, all three gimbal rotations (yaw, pitch, and roll), image dimensions, as well as the timestamp and camera specifications.
Python code was implemented for the automatic segmentation of raw aerial images to 512 × 512 image tiles suitable for mapping ML densities in the coastal zone due to their small footprint in the ground (6.55 square meters). Furthermore, the code was used to geo-enrich all the final produced tiles reading the EXIF information from the raw images for the following parameters: (a) GPS coordinates (latitude and longitude), (b) image dimensions, (c) image rotation relative to the true north, (d) UAS flight azimuth relative to the true north, and (e) the flight altitude. Finally, to overcome duplicates in ML detection and mapping due to the overlap of raw images, we designed an automated selection process for image tiles on the basis of the overlapping percentage translated into tile pixel overlap. Thus, all pixels corresponding to the 20% overlap were discarded from the right and bottom for each acquired raw image.
2.4. Data Sources
In this study, a total image-set of 1975 ultra-high-definition UAS raw images were used as a training dataset. These data were acquired from previous surveys of the marine remote sensing group team of the Aegean University, which were realized for ML mapping research. The image-set was acquired from beaches with complex backgrounds, differing from the Xabelia beach ground pattern and background. Furthermore, the data acquisition was realized using different UAS and sensors. According to this study’s objectives, it was essential to divide all raw images into 512 × 512 tiles suitable for mapping ML densities in the coastal zone and geo-enrichment of all the final produced tiles. As a result, from the initial image-set of 1975 raw images, we produced a training set of more than 30,000 image tiles, as shown in
Table 1.
Applying the data acquisition protocol in the study area (Xabelia Beach), we collected 106 raw images. After the selection process, all raw images were segmented and georeferenced in the WGS84 system, producing 7420 georeferenced tiles. An annotation campaign took place to classify the dataset to litter and no litter tiles manually. The annotation process of all tiles was implemented through the Zooniverse platform (
www.zooniverse.org). In the following subchapter, the citizen science data annotation is presented.
2.5. Data Annotation
In the last decade, several developments and innovations in online citizen science have come up to handle the classification of increasing quantities of digital data. Various online platforms were created to distribute data analysis—a type of citizen science [
60]. The crowdsourcing of significant numbers of people in the scientific process has proven to be a technique capable of making a valuable contribution to this problem. In this context, the Zooniverse platform (
www.zooniverse.org) grew out from the Galaxy Zoo project launched in 2007 [
60]. It is a web platform containing a cluster of projects that use volunteer contributors to distribute data analysis and interpretation of large datasets [
61]. The data analysis that volunteers are asked to complete is simple enough that members of the public can engage in the process without having special knowledge or background of the dataset or the problem behind it [
60,
61]. Zooniverse platform aims to solve specific scientific problems by serving as a reduction tool for data- and labor-intensive science. The non-expert citizen science engagement transforms raw data into a product to use in research [
62].
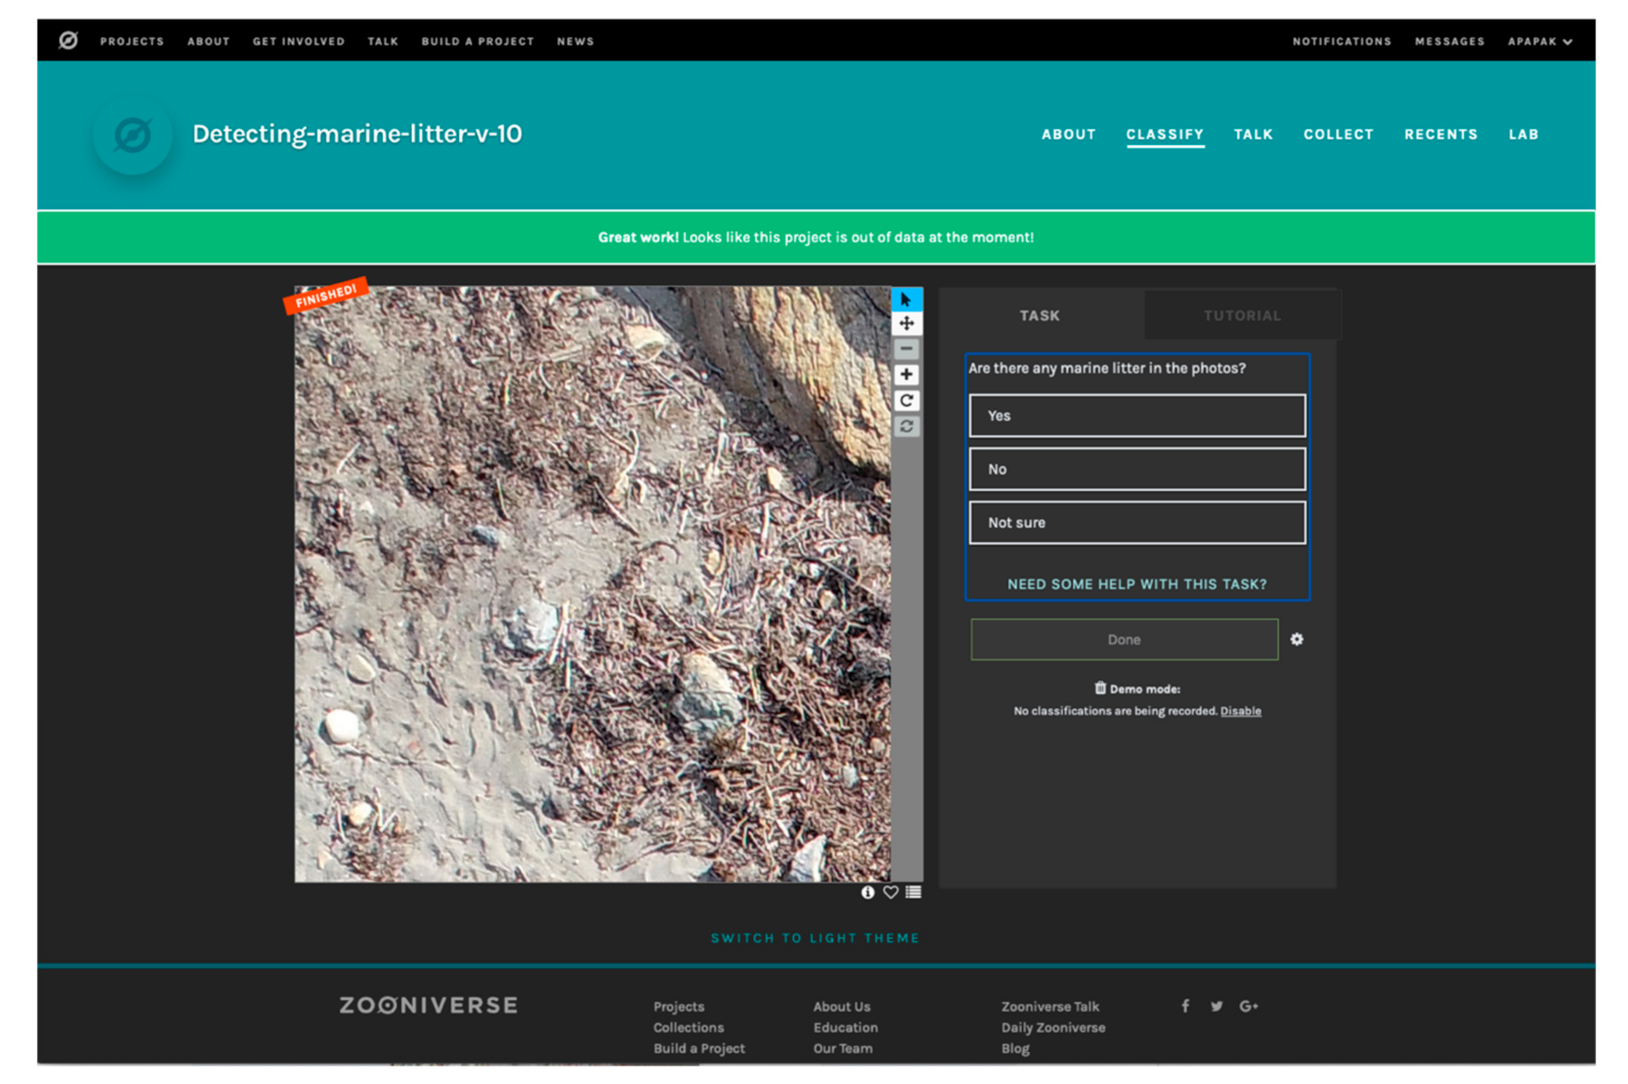
Using the annotation tool of the online platform Zooniverse Project Builder (Citizen Science Alliance, Oxford, England;
www.zooniverse.org), a group of 27 volunteers classified all 30,793 tiles (
Figure 4). The volunteers participated in a 1-hour training and discussion to ensure that all understand the research scope and can distinguish the 2 classes correctly.
The Zooniverse Project Builder platform during annotation showed the tiles in random order. From the manual annotation process, 2 categories of tiles were distinguished: (i) “litter” and (ii) “no litter”, tiles that contain or are clear from any ML, respectively. Any artificial garbage such as metals, tires, and parts from wooden anthropogenic structures was tagged as “litter”. An expert screened all annotated tiles to correct misclassifications performed by the operators (volunteers). Additionally, tiles for which their class was uncertain and tagged as “not sure” from the annotation process were revised and placed in the appropriate class. Thus, all tiles produced in the segmentation preprocess step were used to form the final dataset. As can be seen in
Table 2, from the annotation process, 7670 and 23,123 tiles were classified as litter and no litter, respectively.
2.6. Deep Learning for ML Recognition
In this study, we utilized the valuable knowledge acquired by several CNNs on the classification task of the ImageNet Large-Scale Visual Recognition Challenge (ILSVRC) [
63] through the transfer learning approach to re-purpose them towards ML recognition from UAS aerial images. Regarding their performance on the ILSVRC classification task, their pioneering improvements, and their use in ML detection [
22,
47,
48], we selected 5 CNN architectures from previous studies: (a) 2 plain architectures [
49] (VGG-16 and VGG-19) and (b) 3 densely connected variations [
64] (DenseNet-121, DenseNet-169, DenseNet-201).
The depth of the CNN architectures is a rather important matter for visual recognition tasks. VGG is one of the very first attempts to increase the performance of AlexNet, 2012 ILSVRC winner [
65] by increasing the number of layers along with smaller convolutional filters (3 × 3) to make it possible [
49]. One of the main limitations of very deep CNNs is the vanish of input information as it goes through the network. For this purpose, densely connected networks (DenseNet) attempt to increase the information flow between layers by introducing a new connectivity pattern that connects each layer with all the subsequent layers and all the preceding layers by concatenating them [
64].
2.6.1. Training and Validation Image-Sets
Given the annotation process results, the image-set was divided into training and validation datasets with a split ratio of 80%/20%, accordingly. Training and validation datasets were generated on the basis of the number of litter images. To avoid the negative impact of the imbalanced class problem, we adopted the under-sampling method [
66,
67] to ensure that an equal number of samples was distributed between the 2 classes. Hence, “no litter” samples were randomly excluded to reach the number of litter samples. As a result, the training and validation image sets ended up with 12,276 and 3064 images, respectively, as shown in
Table 3.
2.6.2. CNN Training
The abovementioned CNNs were trained using the transfer learning approach. We replaced the last layer of the classification stage to predict the classes defined in this study (litter, no litter) using the fine-tuning method. Due to GPU limitations, we chose a batch size of 64 samples, a stable learning rate of 0.000001 using Adam optimizer [
68], and a dropout ratio of 0.5, and we reduced the input size to 224 × 224 pixels and, finally, trained for 40 epochs. Additionally, image augmentation was also applied (rotation, shear, horizontal and vertical flip).
Experiments were conducted through the programming environment of Python 3.7 using Tensorflow, an open-source, end-to-end machine learning framework [
69] and the Keras high-level API [
70]. The training and inference processes took place on an intel i7 8700 (3.2GHz) PC with a CUDA [
71]-enabled NVIDIA GeForce RTX 2070 GPU equipped with 8GM of memory suitable for parallel computing.
2.7. Metrics Performance
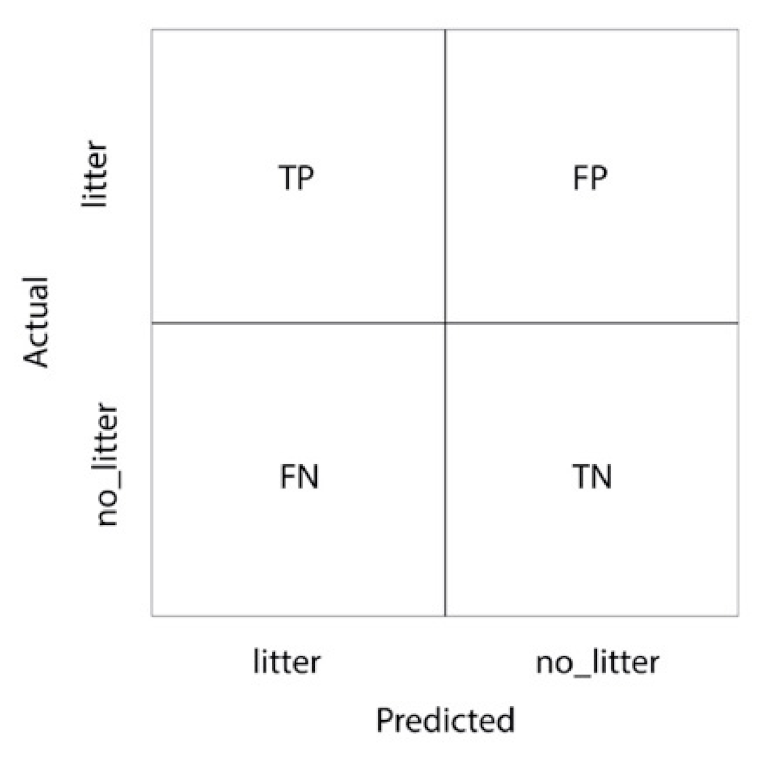
The performance of the examined CNN architectures was evaluated using the f-score statistical analysis. Given the actual values of the testing images and a set of predictions, we generated a confusion matrix, as shown in
Figure 5. The confusion matrix is the basis for assessing the model’s ability to generalize new and unseen images.
The actual image classes are on the
y-axis, while the predicted ones are on the
x-axis of the confusion matrix illustration. In addition, TP (true positive) stands for the correctly classified images as litter, while the FP (false positive) is the number of actual litter tiles that were predicted as no litter. Moreover, TN (true negative) is the number of the predicted no litter tiles that are no litter. The FN (false negative) is the number of no litter tiles wrongly classified as litter. Using these values, several statistical measurements such as precision, recall, f-score, and accuracy, may be calculated to evaluate the models’ performance. Precision (1) is the ratio of the correctly predicted litter images over the actual number of litter tiles.
While recall (2) is the proportion of correctly classified tiles from the total litter predictions.
However, both fail to capture the whole picture of the models’ performance, especially in imbalanced datasets. Therefore, we need to combine them into a single statistical measurement named f-score, the harmonic mean value (3).
Last but not least, the overall accuracy is also calculated. Accuracy is a metric of the model’s overall performance and considers the correctly classified tiles over the whole set of (4). Accuracy depends on the balance between classes.
3. Results and Discussion
Our proposed detection methodology’s experimental implementation was performed using a dataset consisting of two sub-datasets (train and validation dataset and test dataset). The training and validation dataset included a total set of 15,340 512 × 512 image tiles, created and annotated with the methodology described. The five selected models are trained on this dataset. Additionally, we performed data augmentation by flipping images left–right and up–down, rotating, and shearing to enhance the dataset.
Finally, to evaluate the selected deep learning models’ generalization ability on the ML classification task in new, unseen images, we used the Xabelia dataset. Thus, the test dataset comprised 7420 512 × 512 tiles, created from Xabelia beach raw images collected following the proposed data acquisition protocol. Additionally, all Xabelia tiles were annotated through the Zooniverse platform to evaluate the proposed models’ generalization ability. According to the manual classification results, 3411 tiles were identified containing litter, while 4009 tiles were classified as no litter.
3.1. Training
The deep learning models were re-purposed in order to identify ML from UAS images. The results of the training and validation accuracy and loss are depicted in
Figure 6. During the training and validation process, a significant slack between validation and training accuracy occurred in DenseNet models. This slack is a sign of overfitting, which indicates that the models fit very well on the training samples while the new entry samples’ generalization ability remains relatively low. The VGG models failed to fit the training samples, while generalization remained high until the 30th epoch. Then, the two curves indicated a comparatively acceptable fit on both training and validation image-sets. Moreover, noisy accuracy and loss curves may indicate misrepresentative training and validation samples. The best fit on both training and validation image-sets occurred on the VGG19 architecture, as shown below.
3.2. Generalization Ability
In order to demonstrate the performance of the trained models, we used the Xabelia beach dataset. The Xabelia dataset used to evaluate the deep learning models’ generalization ability was unknown to the deep learning models. The use of an unseen image set showcases the geographical transferability of our approach to new and unknown beaches.
Table 3 presents the statistical measurements calculated to evaluate the models’ performance on a new unseen dataset. DenseNet variations fail to successfully predict the input images, as shown by the differences between precision, recall, and the f-score in
Table 4. The results indicate that most of the models failed to predict no litter samples successfully. VGG16 and VGG19 provided slightly better results in predicting both litter and no litter classes. The VGG19 architecture obtained the best prediction with an overall accuracy of 77.60%, while precision, recall, and f-score values were also acceptable.
Even though the experimental implementation was successfully conducted and obtained acceptable results, FP and FN values remained relatively high. ML in the coastal zone exists under numerous variations of colors, shapes, and sizes, and therefore it is very challenging to achieve higher overall accuracy and f-score.
3.3. Density Maps
For the creation of ML density maps, we used the deep learning results. The best in ML detection performance network (VGG19) was used to create two vector files. The first was a point vector file that contained all the 512 × 512 tile centroids. The coordinates for all centroids were calculated in the tilling process using the GPS tags in each image’s EXIF info. During this process, all metadata of the raw image were transferred to the corresponding tile centroids. Additionally, each centroid was tagged with ML detection information, and thus were tagged to those that contained and those that did not contain ML accordingly. A second vector file of a 10x10m grid in the study area was created on the basis of the European Union reference grid for geospatial data [
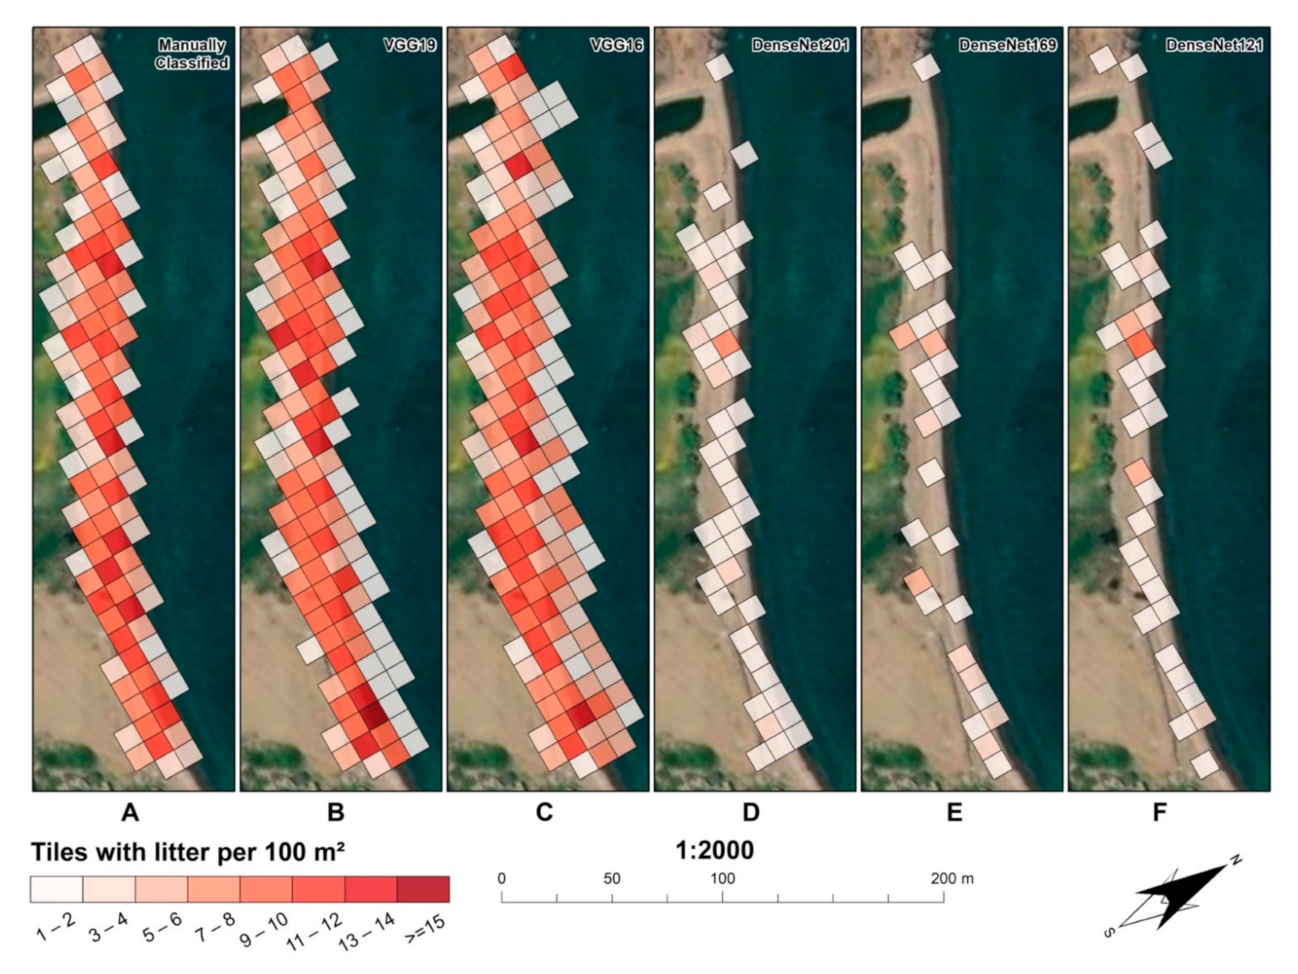
72]. These two files were stored in a postgres database while the final density map was dynamically created using the Structure Query Language, calculating the number of litter points inside each 100 square meter grid cell. These results were used to create density maps depicting the accumulation of ML (
Figure 7).
To evaluate all CNN performance to map ML abundance in Xabelia beach, we annotated the tiles using the Zooniverse web platform. Furthermore, the citizen science annotation results were manually screened by an experienced operator to produce a reference tile dataset of the ML present at the beach. This dataset was used to generate the centroid dataset and produce an ML reference density map. The map was employed to evaluate, visually and quantitatively, the performance of all CNNs used.
Figure 7 depicts the ML density maps produced using the reference tile dataset and those automatically created using all CNN models’ results. The best-performing model, VGG19, returned ML accumulation patterns visually consistent with the manual method, identifying the main ML clusters located along the beach area center.
The statistical comparison of the density results was conducted with the use of two error metrics, mean absolute square error (MAE) and the root mean square error (RMSE) (
Table 5). The manually classified dataset acted as the reference map for their calculation, and all errors were computed on the basis of. The results show that the best performing model was VGG19, which presented the lower errors in both MAE and RMSE, with values of 1.39 and 1.92, respectively. VGG16 produced errors at approximately 1.9 to 2.7 tiles per 100 m
2, and all DenseNet variations were steadily off by more than 4 tiles.
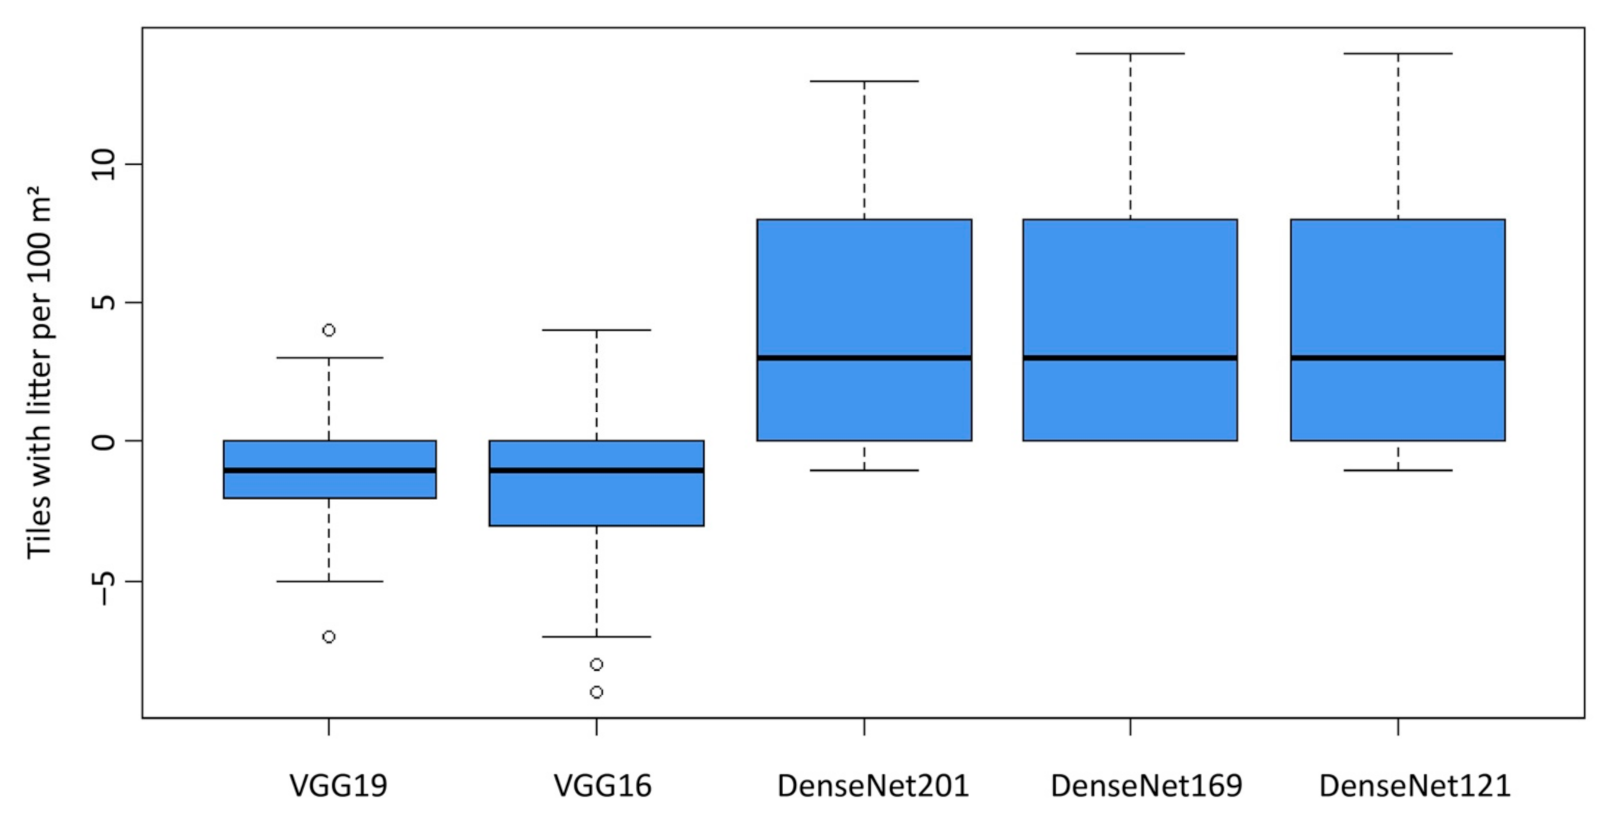
To determine the overestimation or underestimation of the directional errors, we created boxplots depicting the individual density differences between the manual classification and the model results (
Figure 8). The difference was calculated by subtracting each model’s results from the manual classification dataset. The mean error for both VGG models was negative, showing that they generally overestimated litter density, whereas all three DenseNet models underestimated their classification. The 50% of VGG19 errors were concentrated to the range between −2 to 0, presenting only two outliers, one underestimating litter density by four tiles and another overestimating by seven. Similar results were produced from the VGG16 model, but the 19 version performed consistently better, presenting smaller directional error variations. The DenseNet models had a mean underestimation error of three tiles per 100 m
2, but the overall error range was high between −1 to 14.
3.4. Discussion
To date, the most common method for monitoring marine litter involves in situ visual surveys on the beach [
33,
53,
54]. In this method, people are required to walk along transect lines of 100m long from strandline and vertical to coastline [
33,
73]. The survey typically requires three to five persons for about 3 hours to survey a small beach. Although these manual surveys can be achieved at low cost, with minimal equipment, and by inexperienced surveyors under instruction [
54], they are labor-intensive and time-consuming [
74], require high-demanding human work, and are spatially limited [
4,
75,
76]. Furthermore, ML classification relies upon the participants’ judgment; hence, it depends on their skills and experience. Accessibility of the beach to be mapped is another concern for surveyors as sometimes it is difficult or dangerous to conduct surveys in inaccessible or steep areas. As the marine litter problem is escalating, new monitoring and mapping survey approaches that use minimal labor need to offer fast spatiotemporal repetition, cost-effectiveness, and efficiency. In this context, we propose concrete methodological steps for the appropriate citizen science use of popular commercial-grade drones as close remote sensing data acquisition platforms to acquire data for ML mapping in the coastal zone. This study is the first that introduces a citizen science UAS data acquisition protocol for mapping of ML concentrations in the coastal zone. The proposed methodology allows the realization of citizen science data acquisition using off-the-shelf commercial drones that leads to broader area coverage. This framework supports the idea of empowering drone owners to act as stewards of the environment providing new and valuable data to enhance the data acquisition process for mapping ML accumulation in the coastal zone.
In this study, we should note that we were interested in mapping only two beach classes (litter, no litter) using datasets on a beach consisting of various and complex beach backgrounds. Compared with previous works [
22,
34,
46], the method presented here calculates densities using the raw data acquired from the UAS; thus, it does not rely on the orthomosaic. This approach has a significant advantage in mapping coverage as there is no need for high values of front and lateral overlap, which decreases the area covered per UAS mission. As a result, a more significant amount of data (aerial images) can be collected per data acquisition. Furthermore, the method is more straightforward as it is not dependent on the complex and demanding structure from the motion and multi-view stereo (SfM-MVS) processing step. The lack of this step reduces the in situ data acquisition effort concerning the ground control point (GCP) deployment on the study area. The GCPs are needed for georeferencing an orthomosaic in a specific cartographic coordinate system.
In contrast with most previous publications [
22,
34,
46,
47,
48], this study used a significantly larger training and validation dataset acquired from five different beach environments with complex background characteristics and litter concentrations. Additionally, the evaluation of the deep learning models’ generalization ability in a completely new beach environment expands the geographical transferability of our approach to new and unknown beaches.
4. Conclusions
The presented framework combines drone technology and developments in artificial intelligence for computer vision applications to create a protocol that citizens can use to monitor shorelines for marine litter. This approach has great potential to be applied for routine monitoring by both citizens and regulatory bodies, especially for monitoring inaccessible locations or sensitive areas.
In the present work, very high resolution aerial images were acquired from a beach with a complex background using an off-the-self customer-grade drone. These images were used as input data in deep learning models to identify ML in the coastal zone and create ML density maps. The Zooniverse citizen science tool was used to annotate the input data into the litter and no litter classes. The annotation process was implemented in a short time with the help of volunteers, making the annotation more efficient and effective.
Five deep learning models were examined and trained to allow marine litter items to be distinguished from UAS very high resolution images collected from beaches with complex backgrounds. The proposed framework can detect marine litter in the coastal environment with an overall accuracy of 77.6%. We performed a comprehensive evaluation of our method, showing that it generalizes well to unseen images, even when applied to the completely new data acquired from Xabelia beach. The evaluation of the results provides significant evidence of our method’s potential applicability on several ML and background variations, but nonetheless, generalization to more complex coastal environments will require re-training using more data. The results of this study are encouraging. However, in the present study, the number of training and validation images was relatively small, resulting in a small stimulus from the networks for shaping the weights. Our approach’s limitations are that (i) it is not scale-invariant, (ii) it can be computationally prohibitive for real-time applications, (iii) it was trained on a relatively small dataset, and (iv) it requires a high number of samples to produce high recall. We believe that these limitations can be addressed in future work using a larger number of training and validation datasets. Additionally, augmentation techniques will be used to enhance the training and validation dataset.
Today, mapping ML in the coastal zone is carried out using conventional on-site sampling surveys. Existing data collection systems are limited and, therefore, unable to answer fundamental questions for ML concentrations and their spatial and temporal dynamics. Since UAS are nowadays very affordable, widely used, and versatile for environmental studies, this work intends to sustain and give an impulse to the use of citizen science data UAS imagery for quantifying and monitoring the spatiotemporal distribution of marine litter in the coastal zone. The proposed UAS deep learning approach results are encouraging as this combination could offer an instrumental tool for sustainable coastal zone environmental management. To achieve large-scale reproducibility of this framework, further research is needed in the direction of the critical limitations that influence data acquisition, such as sunlight conditions and the associated terrain-shading effects, as well as parameters of the automatic ML detection process.

 ,
, 


