1. Introduction
The rise of new technologies, such as drones, and the improvement of their capabilities, nowadays allows to potentially design and develop useful detection and sampling systems that may be aimed at limiting the exposure to hazardous agents of the workforce and of the population following a chemical, biological, radiological, nuclear, and explosive (CBRNe) event. Factors such as early detection and alarms are primary requirements to consider when designing and deploying new technologies in the field of CBRNe events’ management [
1,
2,
3,
4].
CBRNe events may belong to either the hostile or accidental dimensions. Intervention by responder teams is quite complex and needs to be structured in many phases. When approaching a dangerous scenario, the first and most critical phase is usually considered “situational awareness”; indeed, the right perception of the potential hazards is the basis for the future decision-making process. Being able to characterize a CBRNe event in terms of time, space, required actions, and operations is a fundamental step to successfully protect the public, the workforce, and the environment. Such an approach is commonly the best suited to ensure a fast and effective operative response when facing a wide range of dangerous situations. A good situational awareness could mean the difference between life and death of both rescuers and responders; in order to protect themselves and others against a CBRNe event, responders must assess as soon as possible the nature and proportion of the threat/hazard for subsequent life-saving and decontamination operations. In order to possess the right situational awareness, first responders not only need to be very well prepared, but they shall use whatever tool or technology available to them to enhance their response capabilities [
5].
Mobile robot olfaction (MRO), the field of robotics where intelligent mobile platforms are equipped with a mixture of chemical sensors, has made tremendous progress in the last few years. Monitoring of environmental gases for risk assessment both indoors and outdoors usually requires a complex sensor system and a long operational time. A typical application field is gas pipelines’ monitoring, where MRO equipped drones are used to monitor and localize a dangerous dispersion along the pipeline. The idea of installing a portable gas detector in a mobile robotic platform was first described in [
6] for the localization of gas dispersion in nuclear power plants with the aim to minimize workforce exposure to dangerous environments. From the advancement of autonomous robots, different application results from the integration of specific sensor, to different kinds of mobile platforms [
7], such as for firefighting, demining, environmental monitoring, and search and rescue [
8,
9,
10,
11]. Mobile robots are effective tools for replacing the workforce in repetitive tasks, such as continuous monitoring; they can work in a hostile environment (e.g., chemical and radioactive dispersion, oxygen-deficient, or hostile environment) and explore impervious areas that cannot be easily reached by human operators. Moreover, the use of this kind of system is twofold: support and monitoring application of the chemical dispersion, whereas it could be used even for direct response to the event [
12]. Such aspects make drones a suitable platform in the context of CBRNe events’ management [
13,
14,
15,
16].
MRO systems need on one hand to satisfy the requirements of early disaster response, where a high degree of mobility, fast operation, and highly efficient collaboration with human operators and decision makers are crucial; on the other end, MRO systems also need to satisfy the needs of long-term monitoring when less critical events affecting permanent infrastructures may exist.
Recent advances in mobile robot platforms, specifically in drones’ technology, together with the improvements in the performance of chemical detectors, nowadays present a great prospect to deploy an integrated platform in a wide range of applications. Furthermore, recent advances in the miniaturization of chemical instrumentation as well as data processing algorithms and methodologies allow to better understand the nature and the origin of the chemical dispersion event [
17,
18,
19]. For example, micro aerial vehicles (MAVs) equipped with gas detection systems and/or sampling devices have already been used in the field of environmental monitoring [
11,
12,
13,
14,
15,
16,
17,
18,
19,
20,
21,
22,
23,
24,
25,
26,
27], volcanic gas sampling [
28,
29,
30,
31,
32], localization of gas dispersion [
33,
34], early fire detection [
35,
36], precision agriculture [
37,
38,
39] landfill monitoring [
40,
41,
42], disaster response [
43,
44], demining [
45], and others [
46,
47,
48].
The use of inexpensive, low complexity sensors mounted on small commercial drones for the detection of specific substances could respond to the requisites of rapid response to a threat and allow to satisfy the safety requirements for the operators involved in a chemical release event. However, a potential problem in the accuracy of the acquired data arises when low-cost chemical sensors are used on board a drone because of the vortexes generated by the propellers mainly during the approaching phase, thus preventing the sensor from correctly detecting the presence of hazard substances or misreading the real concentration of the substance. Several works indicate that the problem of the turbulence generated by drone propellers may strongly affect the chemical sensor signals. In the work of Rossi et al. [
26] and Burgues [
22], the applicability of nano-drones for gas sensing tasks is explored: preliminary indoor experiments using nano-drones equipped with metal-oxide semiconductor (MOX) gas sensors showed that the air drawn around the airframe strongly affects the sensor response, basically resulting in useless signals.
To reduce the interferences of the drone propellers on the behavior of the chemical sensors, this work is aimed at optimizing the position of the detectors on the drone platform in order to maximize the effectiveness of sensor detection. A series of fluid dynamic simulations have been performed, aimed at improving the capability and the proficiency of such mobile systems to correctly collect data during the drone approaching phase by optimizing the position of the sensors on the drone body.
2. Materials and Methods
In this section, the authors describe the methodology to evaluate and improve the performances of metal oxide chemical sensors when used on board a drone, taking into account the fluid-dynamics interaction through the software COMSOL Multiphysics
® (COMSOL Inc., Stockholm, Sweden [
49]). The authors provide an explanation of the advantages of using numerical simulation versus experiments followed by the case study analyzed in this work. The last two parts of these sections are devoted to explaining the models and the designed geometry, respectively.
The design of a mobile system, such as a drone platform for the detection, identification, and monitoring of a chemical substance release, requires a deep analysis of the interference that the propulsion of the drone itself produces owing to the volatile nature of the chemical substances that the system needs to analyze. In order to understand if a specific design of a drone equipped with chemical sensors will be able to correctly detect the target substance/particles during different phases of flying, such as approaching and hovering, studies on the fluid-dynamics of the vortexes generated by the propellers need to be performed.
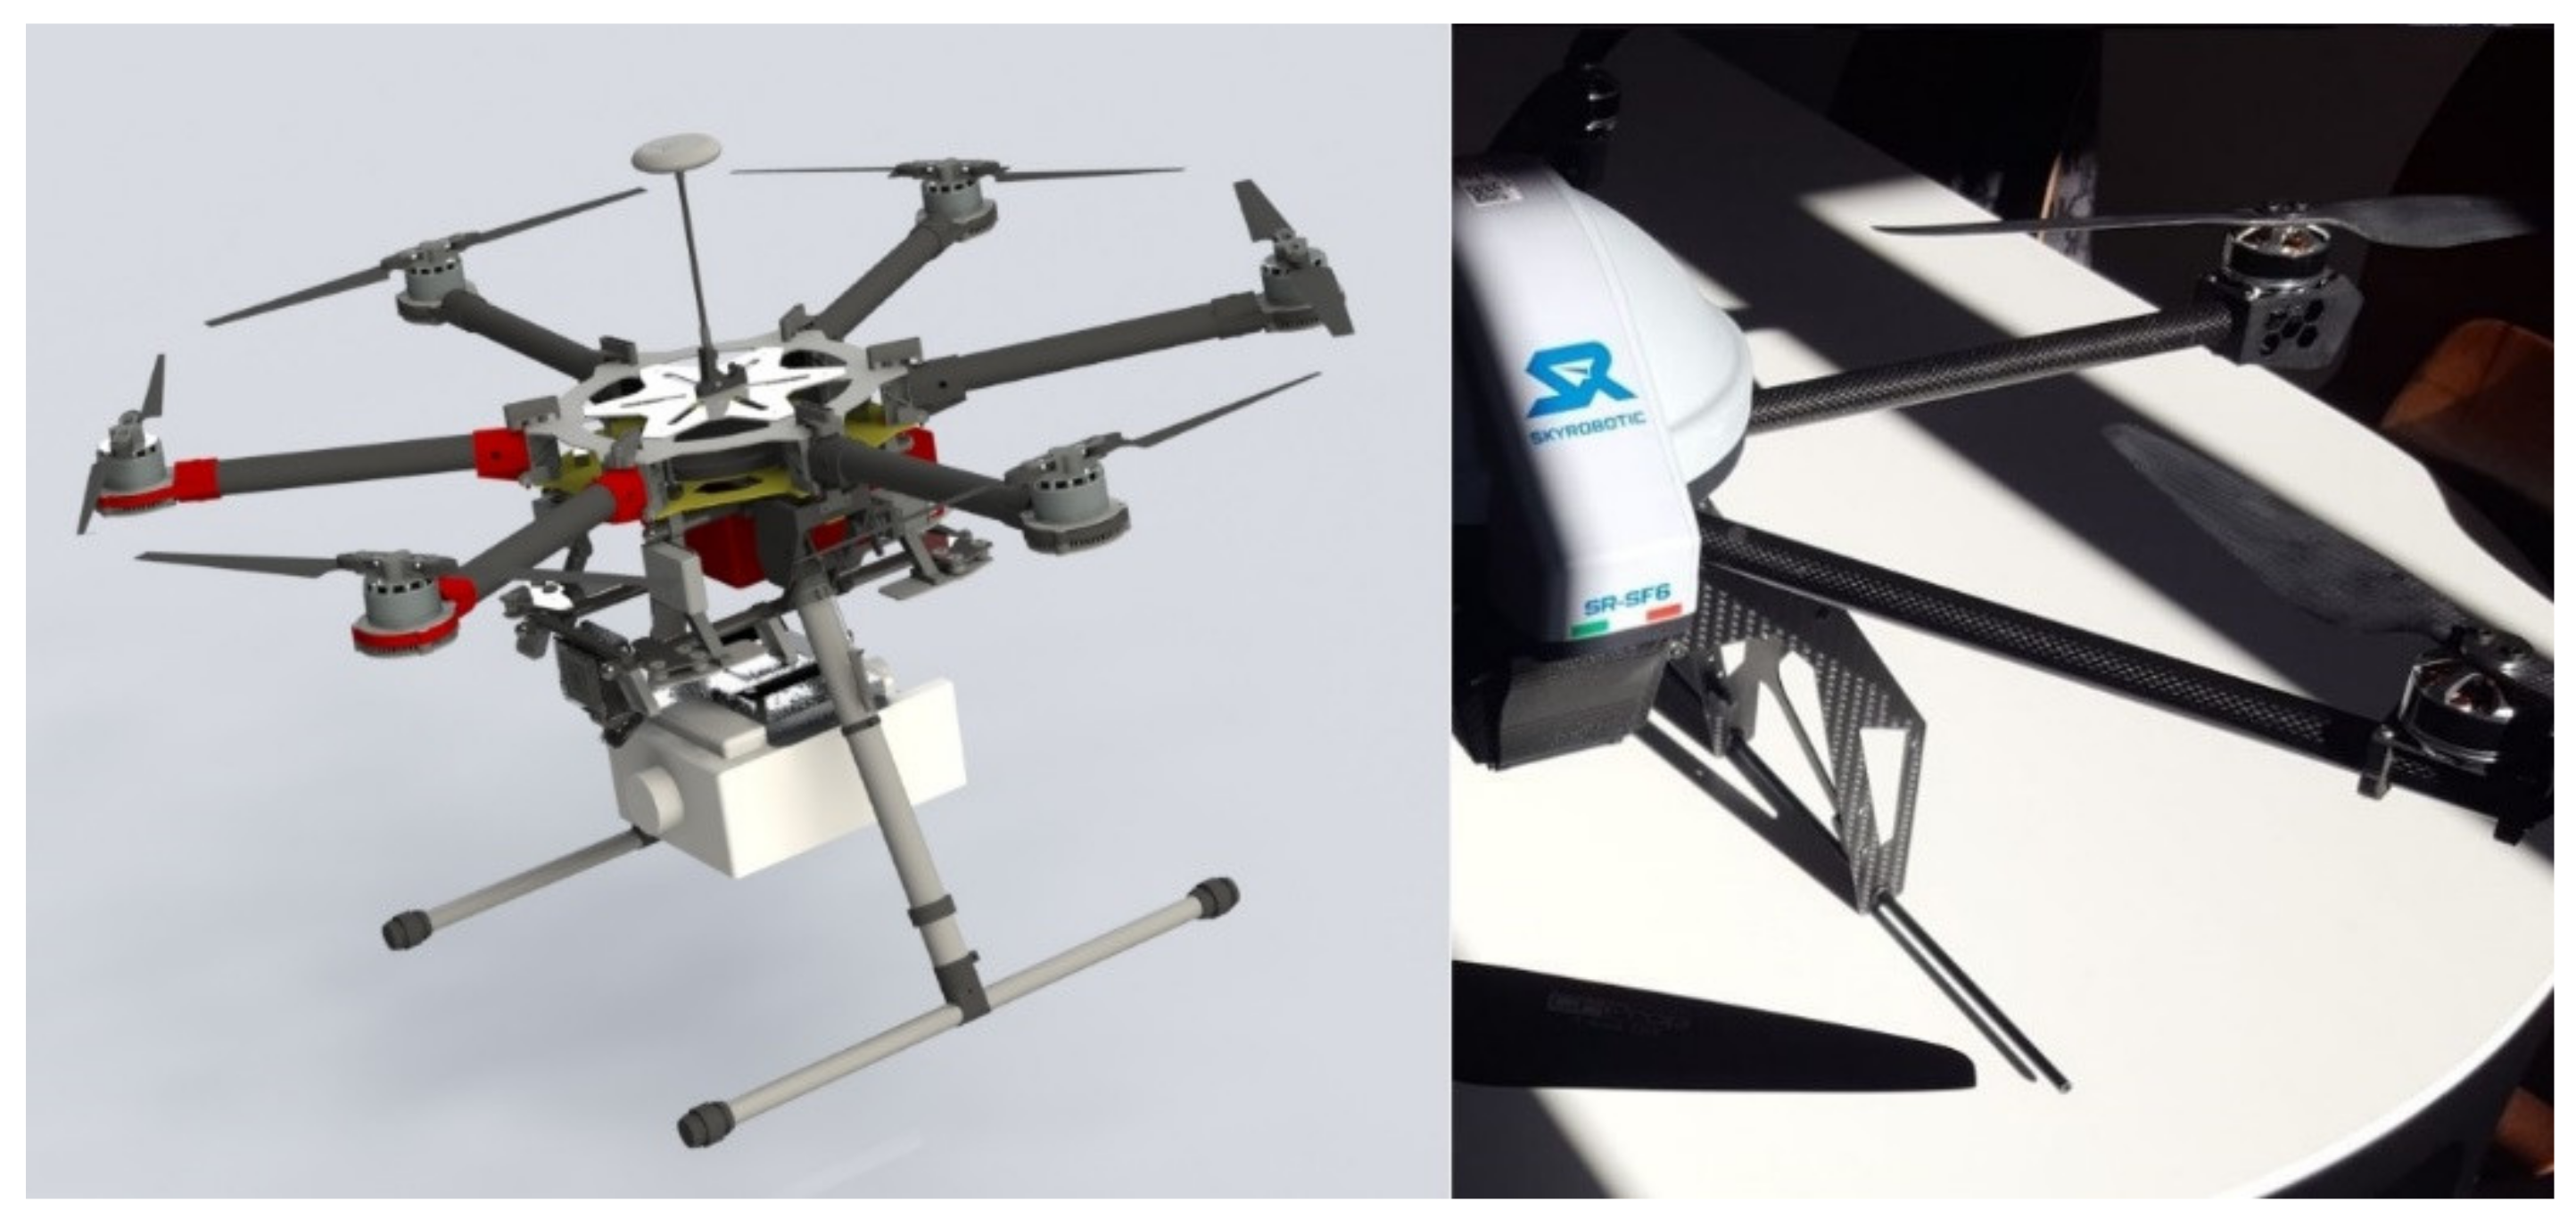
Drones come in different shapes, sizes, and configurations. Among the most used configurations are the quadcopter and hexa-copter. While the first is more commercially and widely available for hobbyist, the hexa-copter configurations are usually aimed at professional and specialized applications. To carry out a simulation of a realistic drone platform, a 3D drone was modelled based on an existing prototype. A specific commercial drone that has already been the object of trials in the CBRNe domain is the SR-SF6 (
Figure 1). It is a hexa-drone created by Skyrobotics, which has shown good performance when applied in a wide range of applications. For example, it has been modified to host a bio-chemical aerosol detector and sampler system with the goal of being used as a tool in the management of CBRNe scenarios. In this work, the hexa-drone was chosen as the reference drone to be modelled in the simulation thanks to its relatively simple structure and good performance balance in terms of speed, stability, and aerodynamic control compared with commercially available quad-copters and octa-copters.
Because of the volatile nature of the substances, experimental tests could lead to unpredictable results and require a strong effort to define an experimental set. Moreover, the repeatability of the experimental set between different cycle makes it hard to achieve particularly in the particle dispersion flow. Fluid-dynamic simulations, mainly carried out to optimize the positioning of the chemical sensors on a drone platform to minimize the fluid dynamics interference of the propeller, could lead to an optimal system able to correctly acquire the data from the chemical sensors used. In computational fluid dynamics (CFD), finite volume algorithms subdivide the fluid domain into several little volumes in which, once the boundary conditions are imposed, the Navier–Stokes equations solve the problem using an iterative method [
50]. Each fluid is then characterized by its macroscopic properties such as density, viscosity, pressure, and so on. The CFD equations can predict with a reasonable degree of approximation the behavior of fluid flow with a mathematical model and numerical methods. A set of pre- and post-processing algorithms are usually applied to visually correct the error in the resolution of the system and to help perform the virtual simulations. To correctly set up the variables in the CFD simulation, attention should be paid to the following properties:
At the end, the CFD simulation provides a solution for complex flow problems that may be expensive and not reliable in real experimentation.
2.1. Aim of the Investigation
The present study addresses the problem of the optimization of the chemical sensor location on the drone to avoid the interference on the sensors owing to the propulsion used in the drones. Specifically, the flow from the propellers could cause the loss or corruption of the data collected from the sensors owing to the turbulence area and the dispersion of the concentration around the propeller.
2.2. Fluid Dynamics Models
In this work, the dispersion of ammonia due to an accidental release is being simulated, and the sensitivity of sensors placed in different areas of the drone is analysed. As ammonia is a common by-product of several chemical industrial processes, and as it is an irritant, toxic, and uncoloured gas, it was chosen as the representative chemical substance of choice in this study. Because of its molecular characteristics, ammonia is more dangerous compared with more volatile substances, and its stagnation could create a dangerous area. Moreover, the use of ammonia in low concentrations does not represent a large threat to human life; therefore, it represents a good candidate to perform an experimental campaign aimed at characterizing the detecting capabilities of different kinds of chemical sensors, such as MOXs. It has to be highlighted that such an approach should be avoided for concentrations larger than the lower explosion limit (LEL).
The numerical model is a multiphase mixture model, where two phases are considered: air and ammonia. The first equation used to simulate the event is the continuity equation, which describes the conservation of the mass:
where
is the velocity vector and
is the density of the mixture. The momentum conservation is taken into account by a set of three equations:
where
is the pressure and
where
is the dynamic viscosity,
is the turbulent viscosity,
is the identity matrix, and
is the turbulent energy. The turbulent variables are calculated by the
k-
ε turbulent model, which describes, using a two equations approach, the turbulent kinetic energy (
) and the turbulent dissipation ratio
:
where
The turbulent model constants are = 0.09, = 1.44, = 1.92, = 1, and = 1.3.
The mixture properties are calculated by the mixture flux equation:
where
is the mass fraction of the i-th phase and
is the mass flux vector, calculated taking into account both diffusion and convection.
2.3. Settings of COMSOL Multiphysics Parameters
To run a CFD simulation, the software needs to process the data modelling the drone and the volume where the simulation is going to be carried out with well-defined boundaries. For this simulation, it was decided to consider a cube of air with a linear length of 50 m (
L) (
Figure 2), assuming the drone position is at the centre of the volume.
Transforming partial differential equations (PDEs) into algebraical equations while working on the entire model might introduce significant errors into the results. To avoid this problem, the surface is divided into a number of sub-elements of geometrical simple shapes (tetrahedrons) to be studied one by one in order to increase the goodness of the approximation and remove the final errors. The mesh settings determine the resolution of the finite element mesh used to discretize the model. The mesh used in a fluid flow simulation depends on the fluid flow model and on the accuracy required in the simulation. Generally, a fluid flow model requires a fine resolution to converge. The finer the resolution (number of sub cells), the better the goodness of the approximation and the lower the error of the final result.
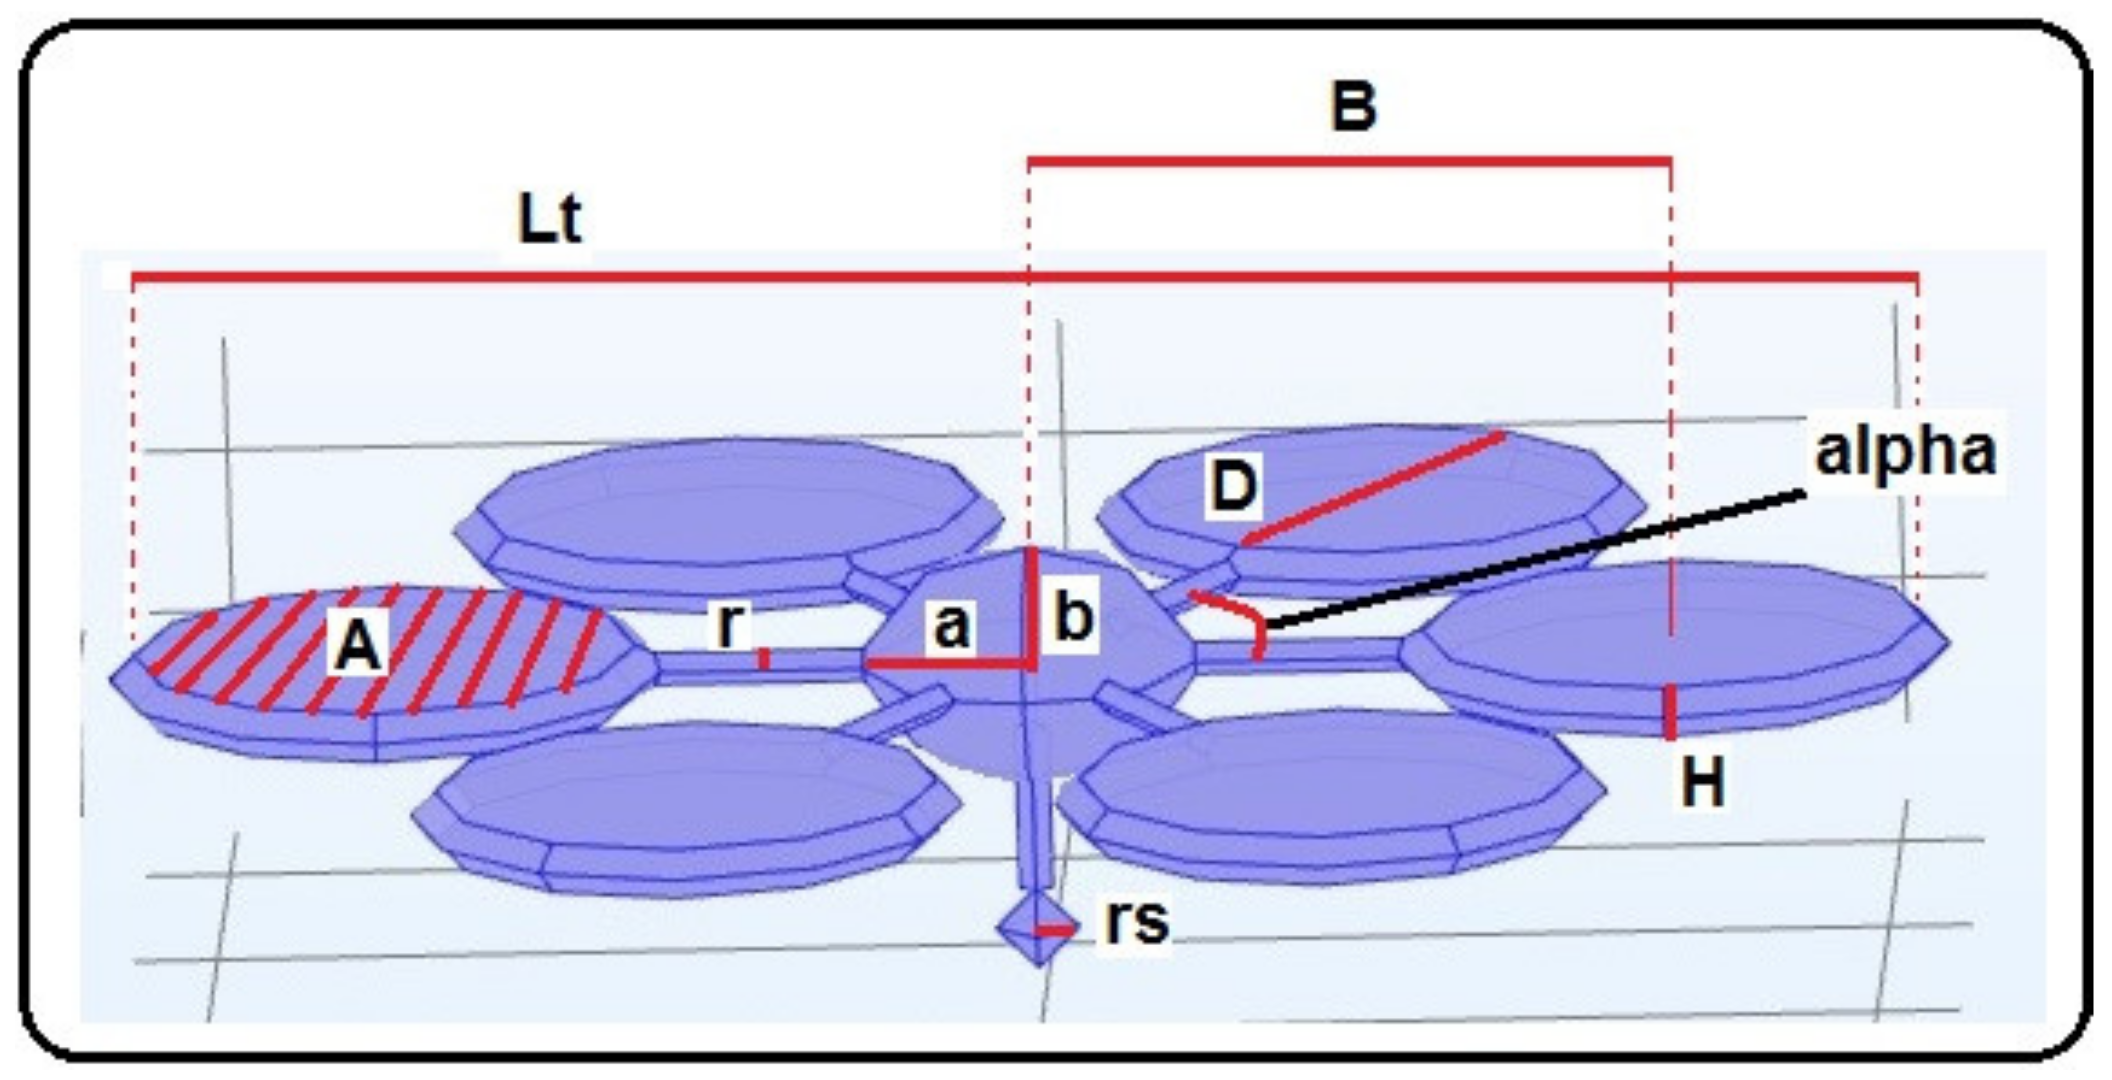
Two different meshes are used for the simulation: a first one for the reference volume, characterized by larger sub-elements; and a second one for the drone, whose dimensions require the sub-elements to be much smaller. Once an assessment about the virtual environment is completed, with the fundamental boundary conditions, the geometry of the drone can be created by choosing a simplified geometric shape and by providing the spatial information to the system. The geometry of the drone was created starting from a three-element shaped body using an ellipsoid for the central body, while cylindrical shapes were used to model the rotor and the ducted propeller. The cylindrical shape is an approximation of the propeller area for simulating the inlet and outlet surface in the simulation of the flow, whereas the ducting effects are not taken into account. These components are joined by the arm connecting the rotor shape with the central body, respectively. The union of these three separate parts was then used to define the final ensemble shape into a single body. Finally, the drone was completed, with the exception of the sensors, by maintaining the center of the ellipsoid as a fulcrum and applying a rotation on the XY plane by an alpha angle equal to 60 degrees five times and gluing all the parts together (
Figure 3).
In order to validate the CFD simulation results by comparing them with experimental data, a fundamental step involves the choice of the model of the chemical sensors, which needs to take into account both the availability of the sensor in the market and the volatile substance to analyze. The aim of the simulations is the analysis of a specific area contaminated with ammonia, thus an MQ137 chemical sensor was selected as the detector to be modeled in the simulation thanks to its low cost, commercial availability, and ease of use in a real environment. Moreover, MOX technology is today one of the most used in the context of MRO thanks to the relative rapid prototyping requirements. MOX sensors in the simulation are modelled as a sphere with radius of 5 cm to better approximate the shape and simplify the fluid dynamics computation. To simulate a release of ammonia in the environment for the bi-component simulation, a solid sphere releasing the particles in all directions at a speed of 0.5 m/s was configured. In the first set of simulations, aimed at evaluating the propeller interference, the releasing source was located at 5 meters on the X-axis, at 15 meters form the ZX plane along the Y-axis, and at 25 meters from the ZY plane along the X-axis. Wind was introduced as a parameter, blowing along the Y-axis direction at a speed of 3 m/s.
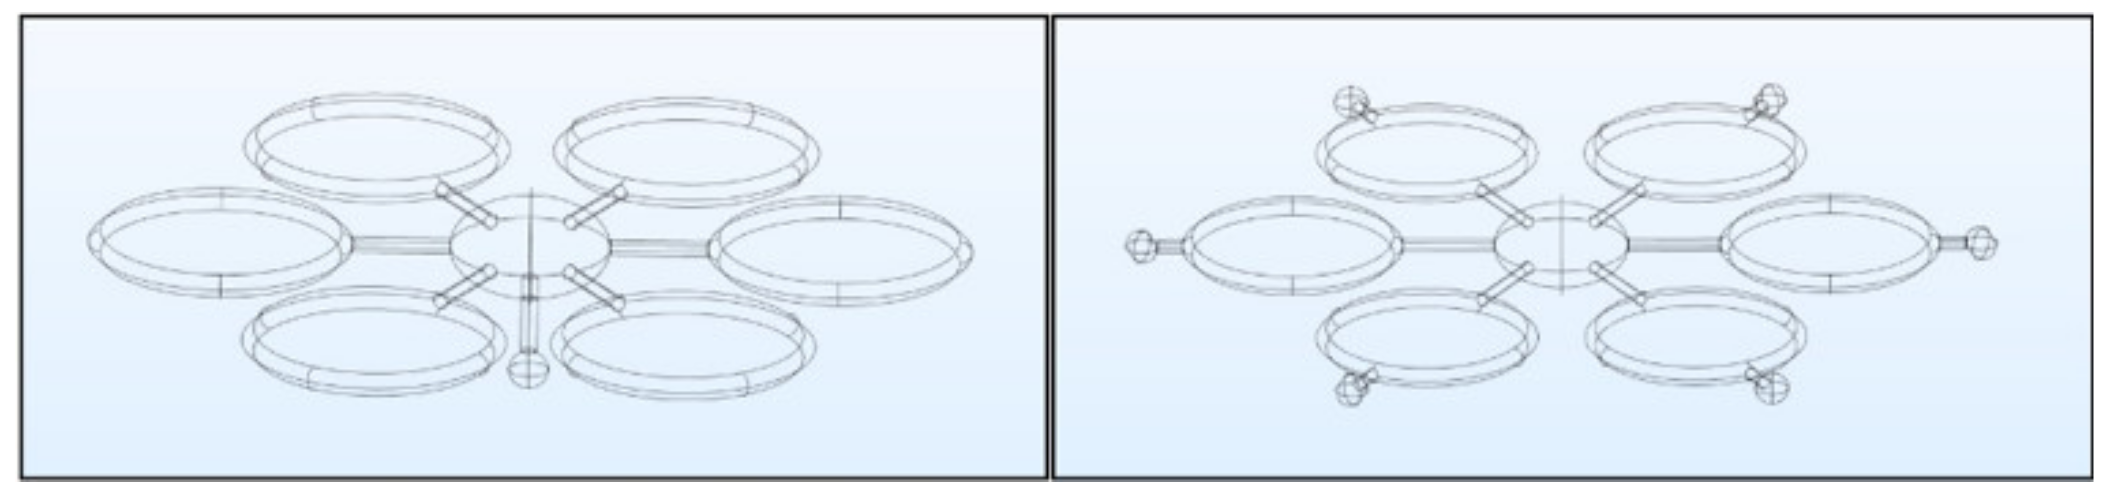
The simulation will run with configurations having two different locations of the sensors positioned on the drone. The first configuration considered is the nadir position (underneath the central body ellipsoid) of the drone hosting a single sensor, whereas the radial configuration of the sensors hosted six sensors radially displaced around the outer edge of each propeller (
Figure 4).
The study of the flow and the interference of the propeller were carried out for two different virtual environment settings: the first setting considers only the presence of the air as a unique fluid flow, namely mono-component CFD simulation, whereas the other setting takes into account the presence of the dispersion source (inlet) of ammonia that spreads the volatile substance into the air at a specific height, namely bi-component CFD (owing to the mixing of ammonia with the surrounding air). Regarding the latter configuration, the simulation of fluid flow is more complex compared with the single fluid because the different properties of the molecules give rise to different behaviors when mixed together.
The last groups of settings required to define the simulation, taking into account the prototype of the drone with the sensors and the releasing point (modelled as a sphere) had to be positioned inside the reference volume.
3. Results and Discussion
To test the optimal positioning of the detectors, two simulations were carried out, each characterized by different displacement of chemical sensors on the drone body. A first check of the goodness of the simulations could be performed during the run of the simulation itself. The convergence of the velocity, pressure, volume fraction of the dispersion, and turbulence variables can always be observed on the run. Therefore, it was observed that the errors of the solutions just stabilized to a constant value as the number of iterations was increasing. The difference of a 10−3 factor between the error values was assumed to be dictated by the numerical model used and the computational algorithms.
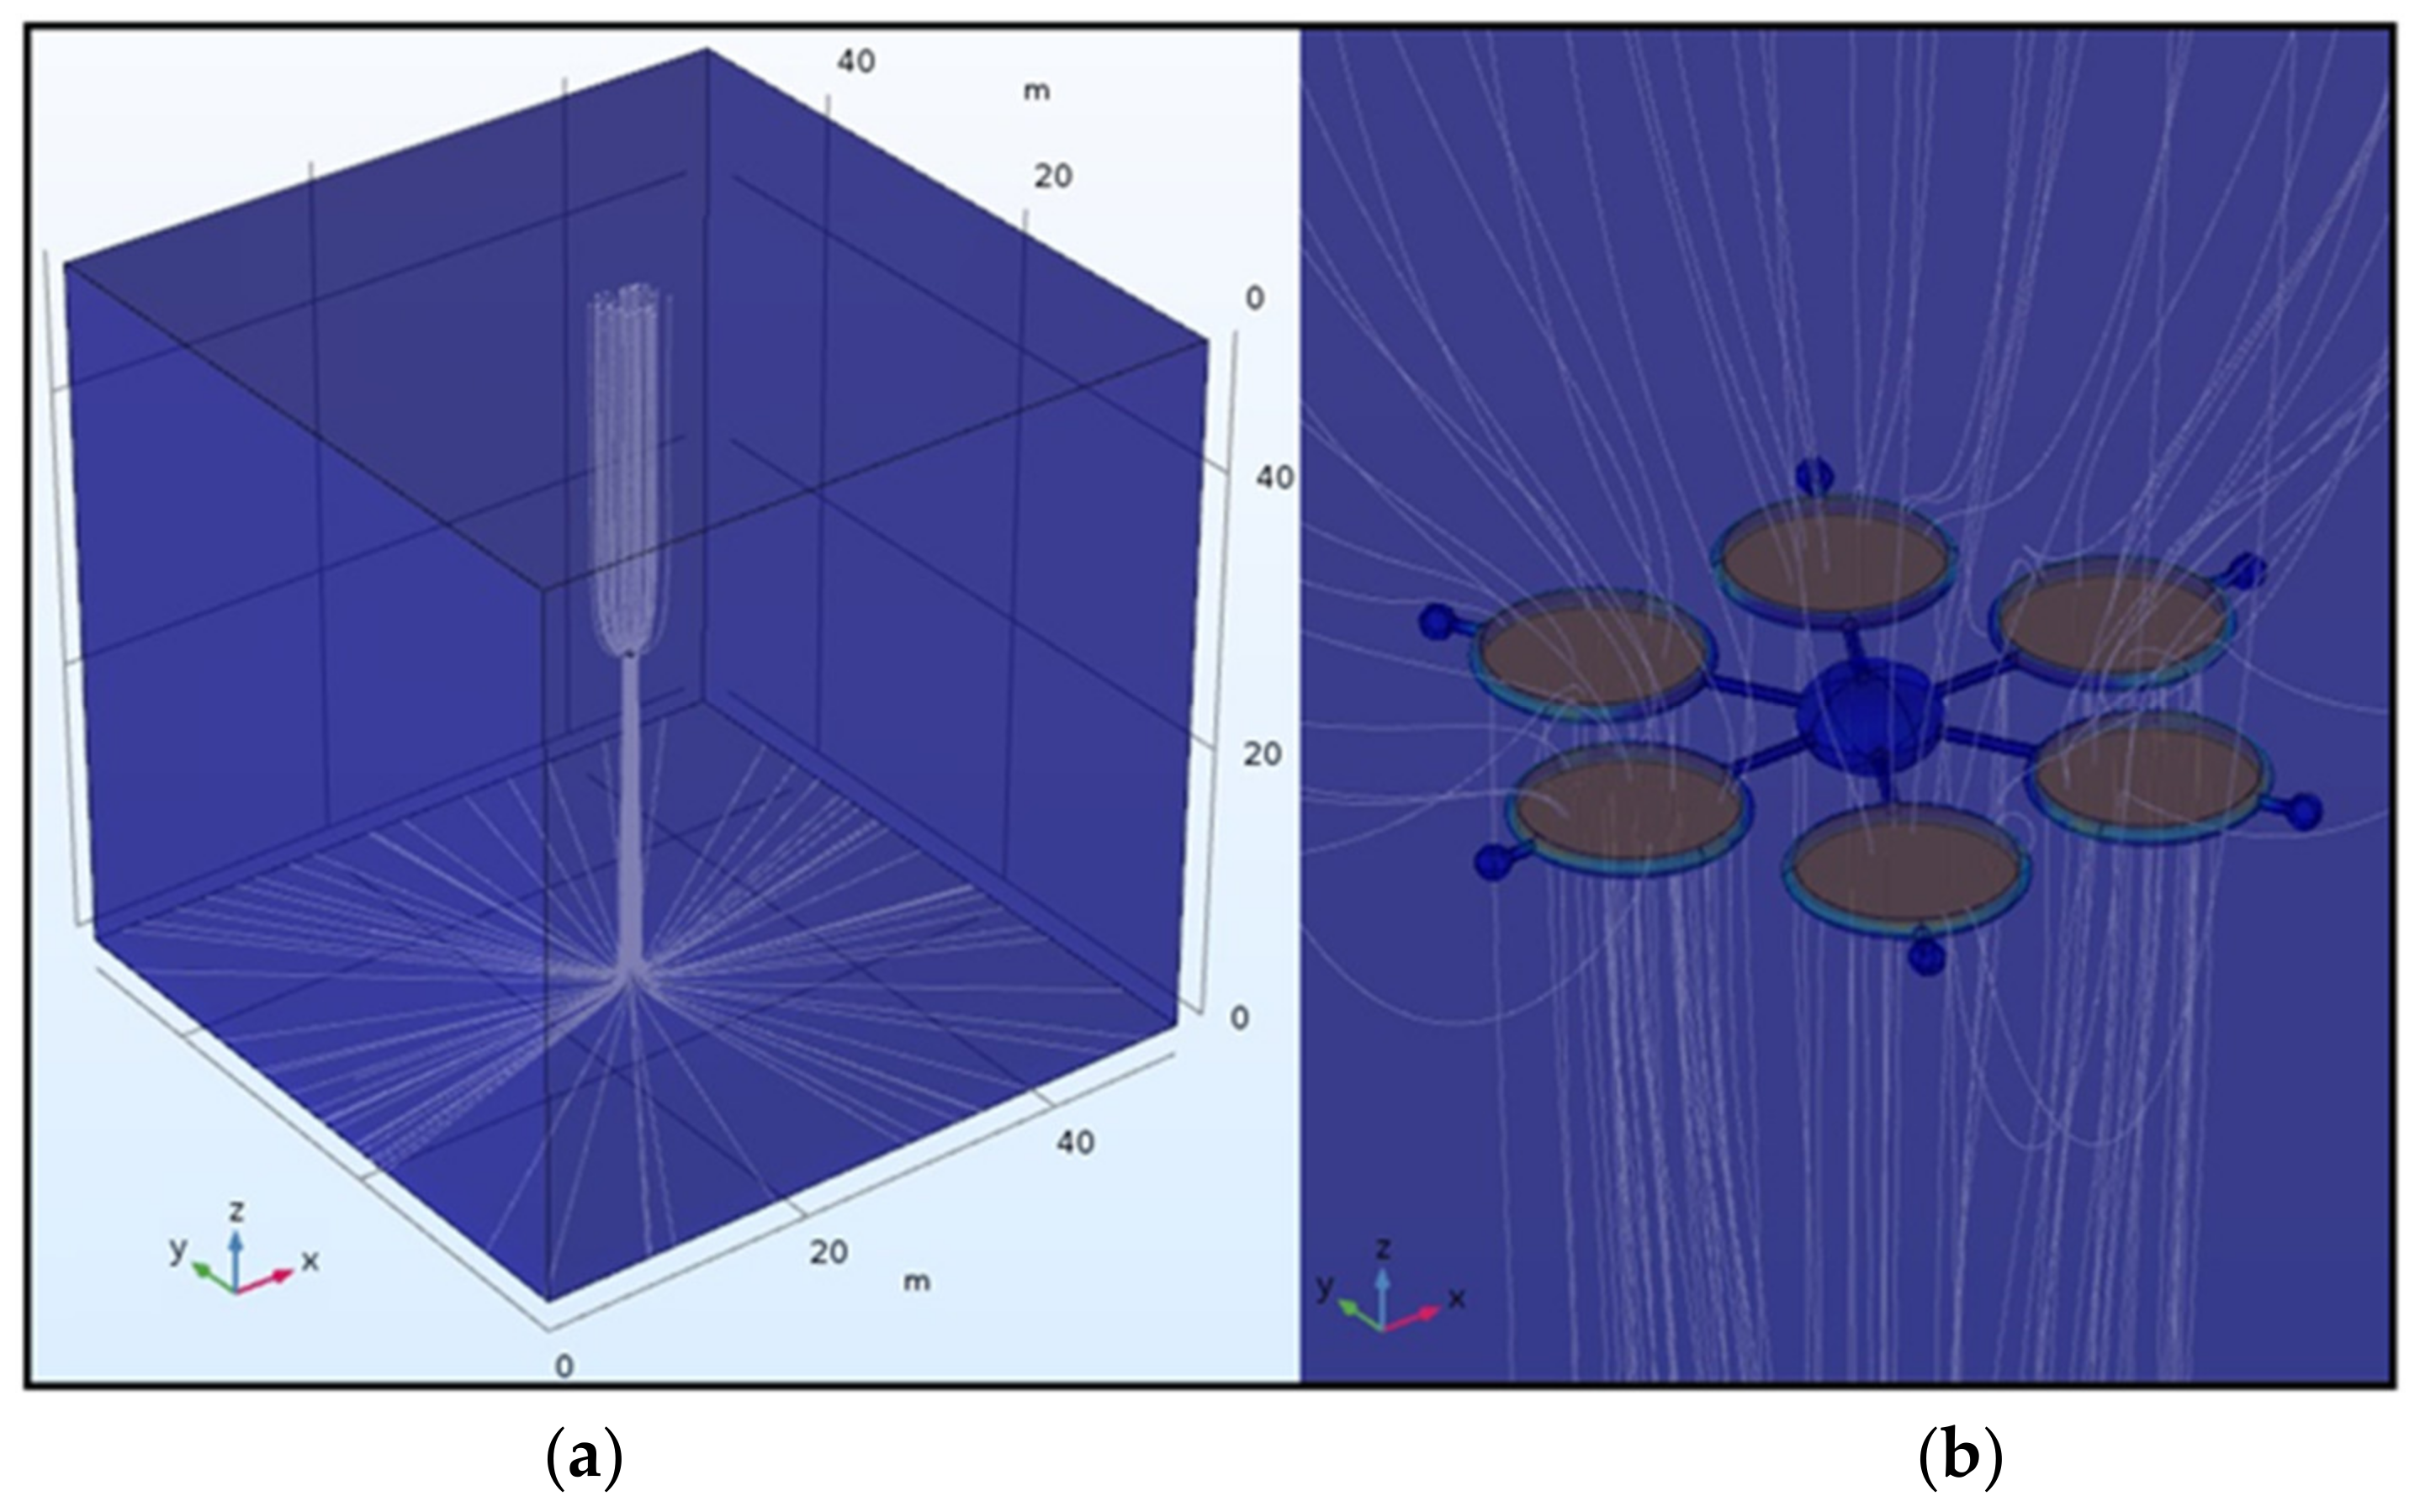
By examining the flow lines in the simulation, the air flow follows the expected path; that is, it exits from the reference volume into the upper side of the ducted propeller and re-enters the reference volume from the lower side (
Figure 5a). It is important to note that the flow re-entering into the volume is accelerated and concentrated in a coherent downwash until the ground interference dissipates it radially (
Figure 5b). Moreover, it is important to consider that the air flow that enters into the propeller duct not only is directly influenced by the propeller action on the vertical space, but also derives from the outer boundaries of the ducts; in fact, the fluid starts its acceleration downward, and the mass flow claimed from the propeller increases with the propeller velocity.
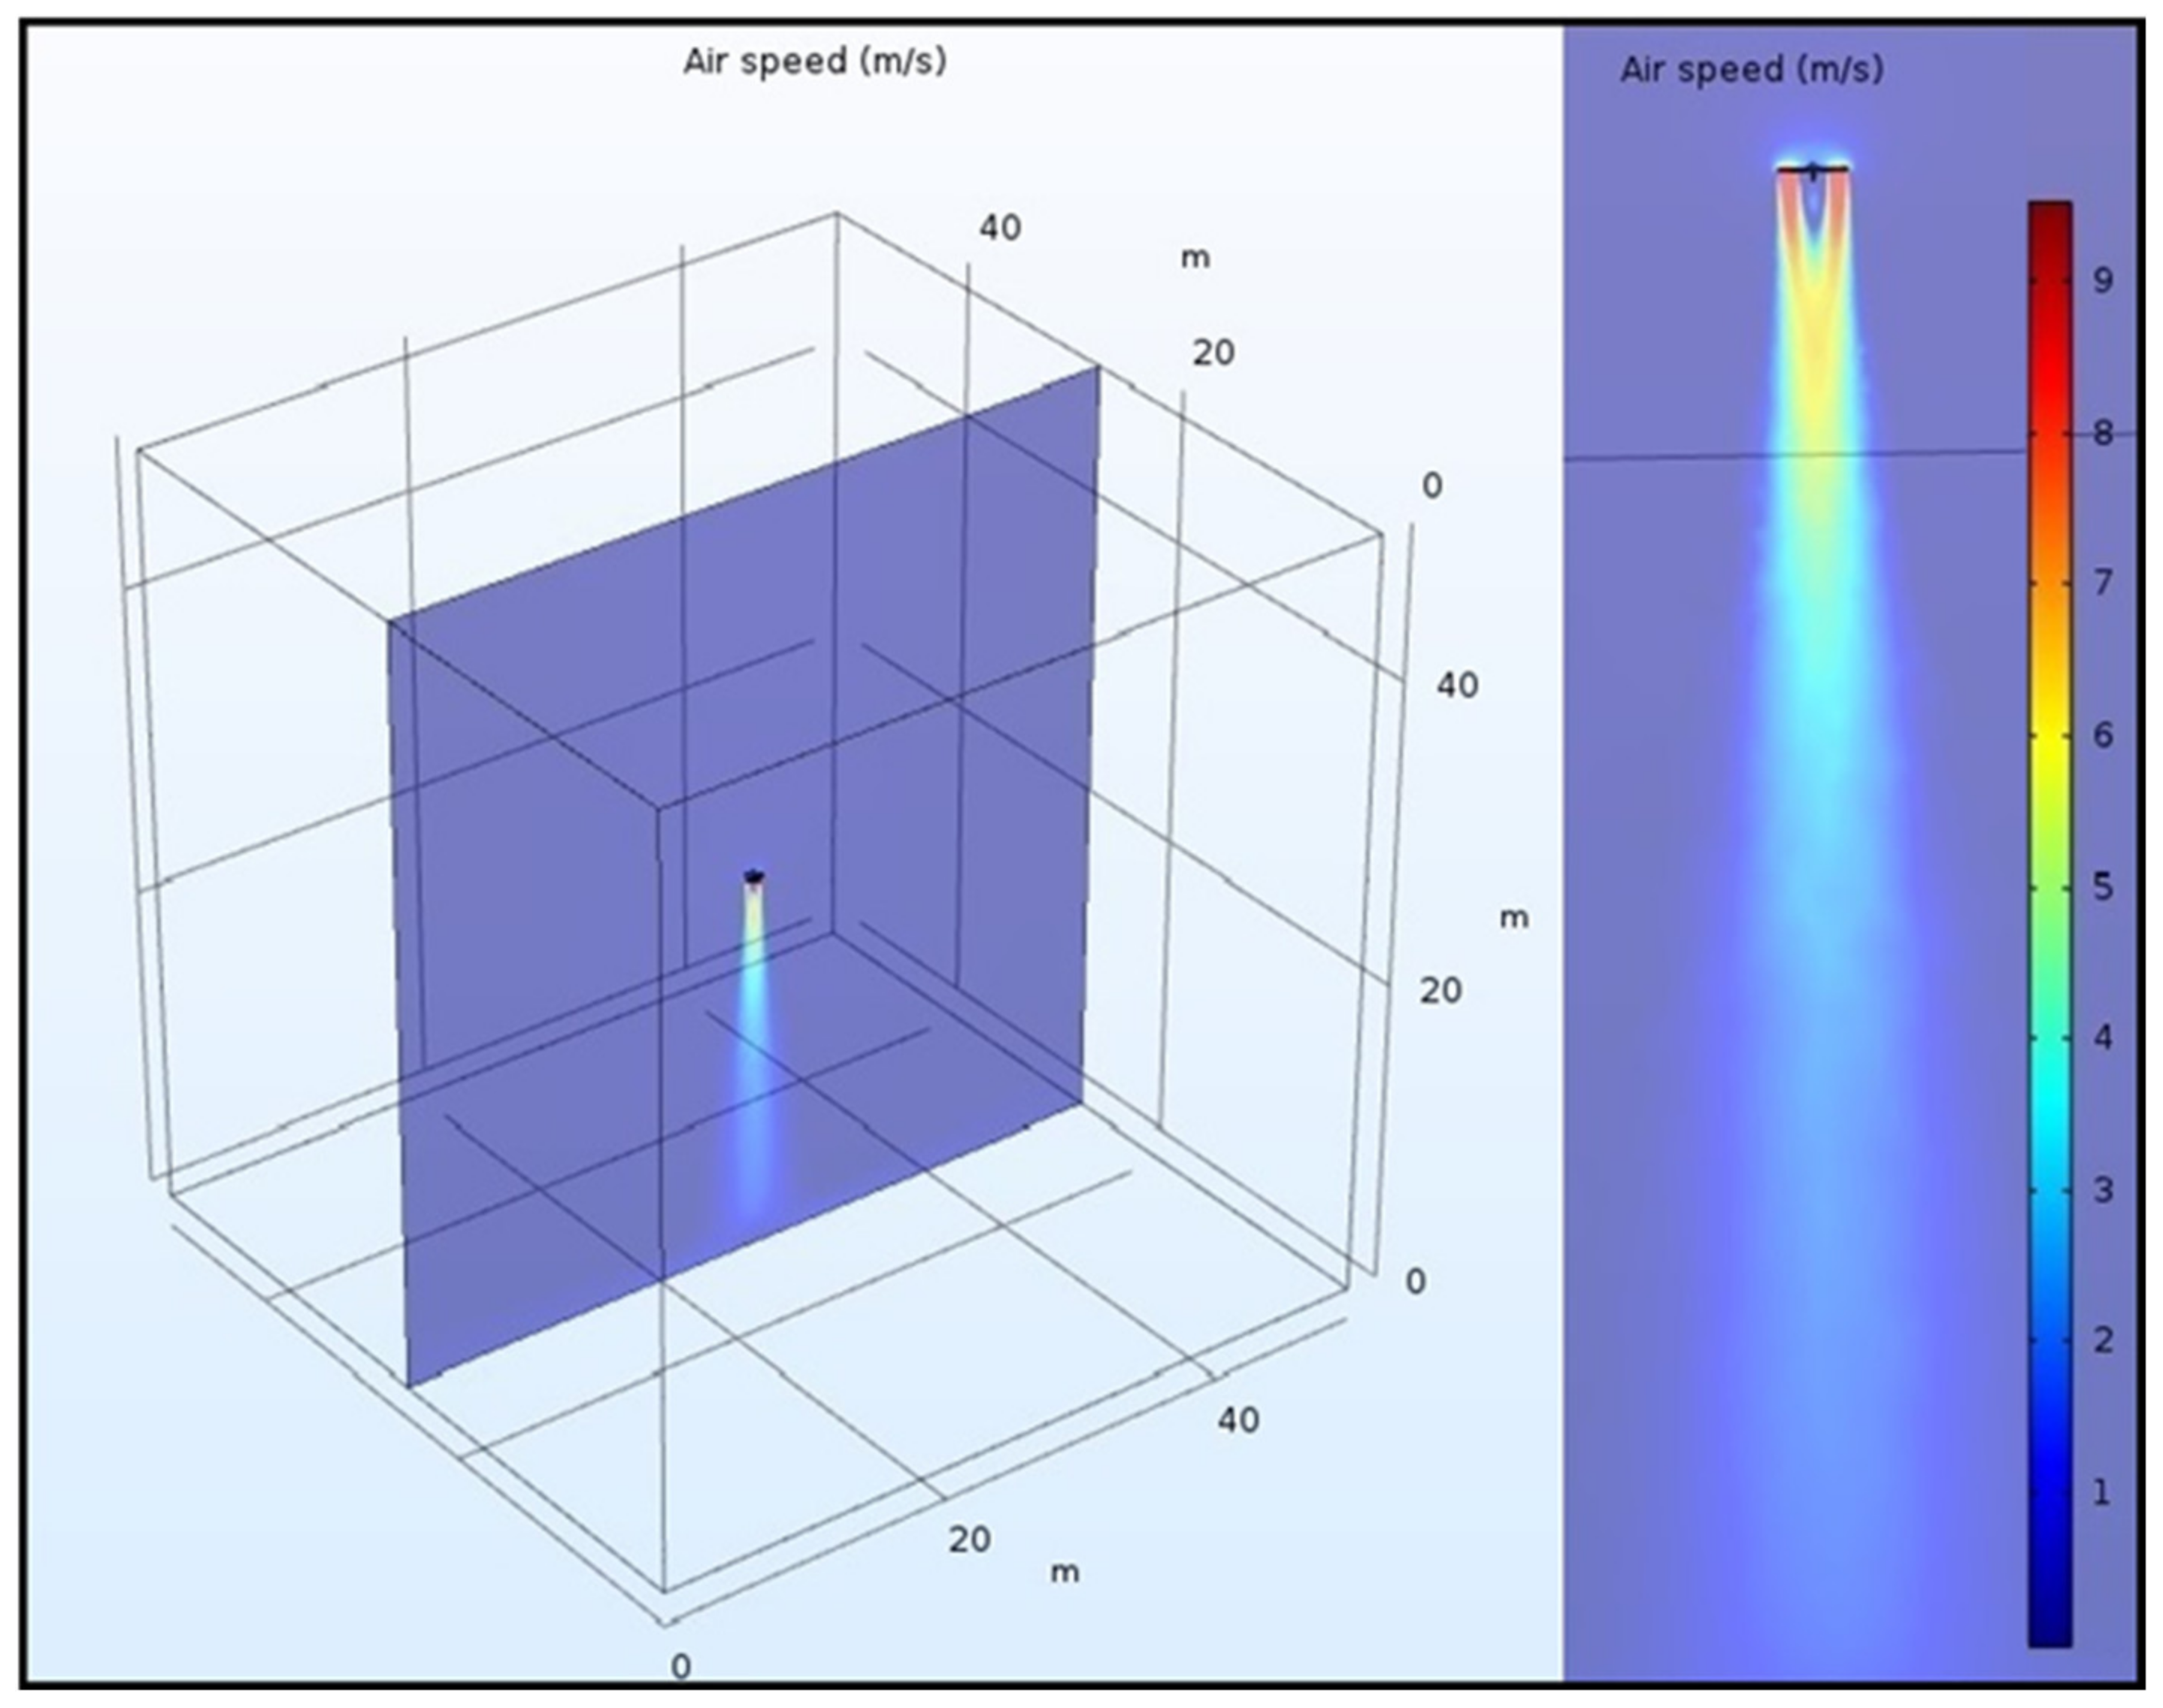
By analyzing the air speed and fluid flow, we can instead observe that the air is being accelerated on top of the ducted propeller with a speed close to 8–9 m/s, and the same value is maintained for almost 2 meters downward, where it starts to slow down at 5–6 m/s (
Figure 6). The speed of air is still effective as the air flow hits the ground at 25 m with a speed of 1–3 m/s. Furthermore, the air flow assumes a larger radial angle as it leaves the drone such that the flow cross section at ground level is almost double with respect to the cross section below the drone.
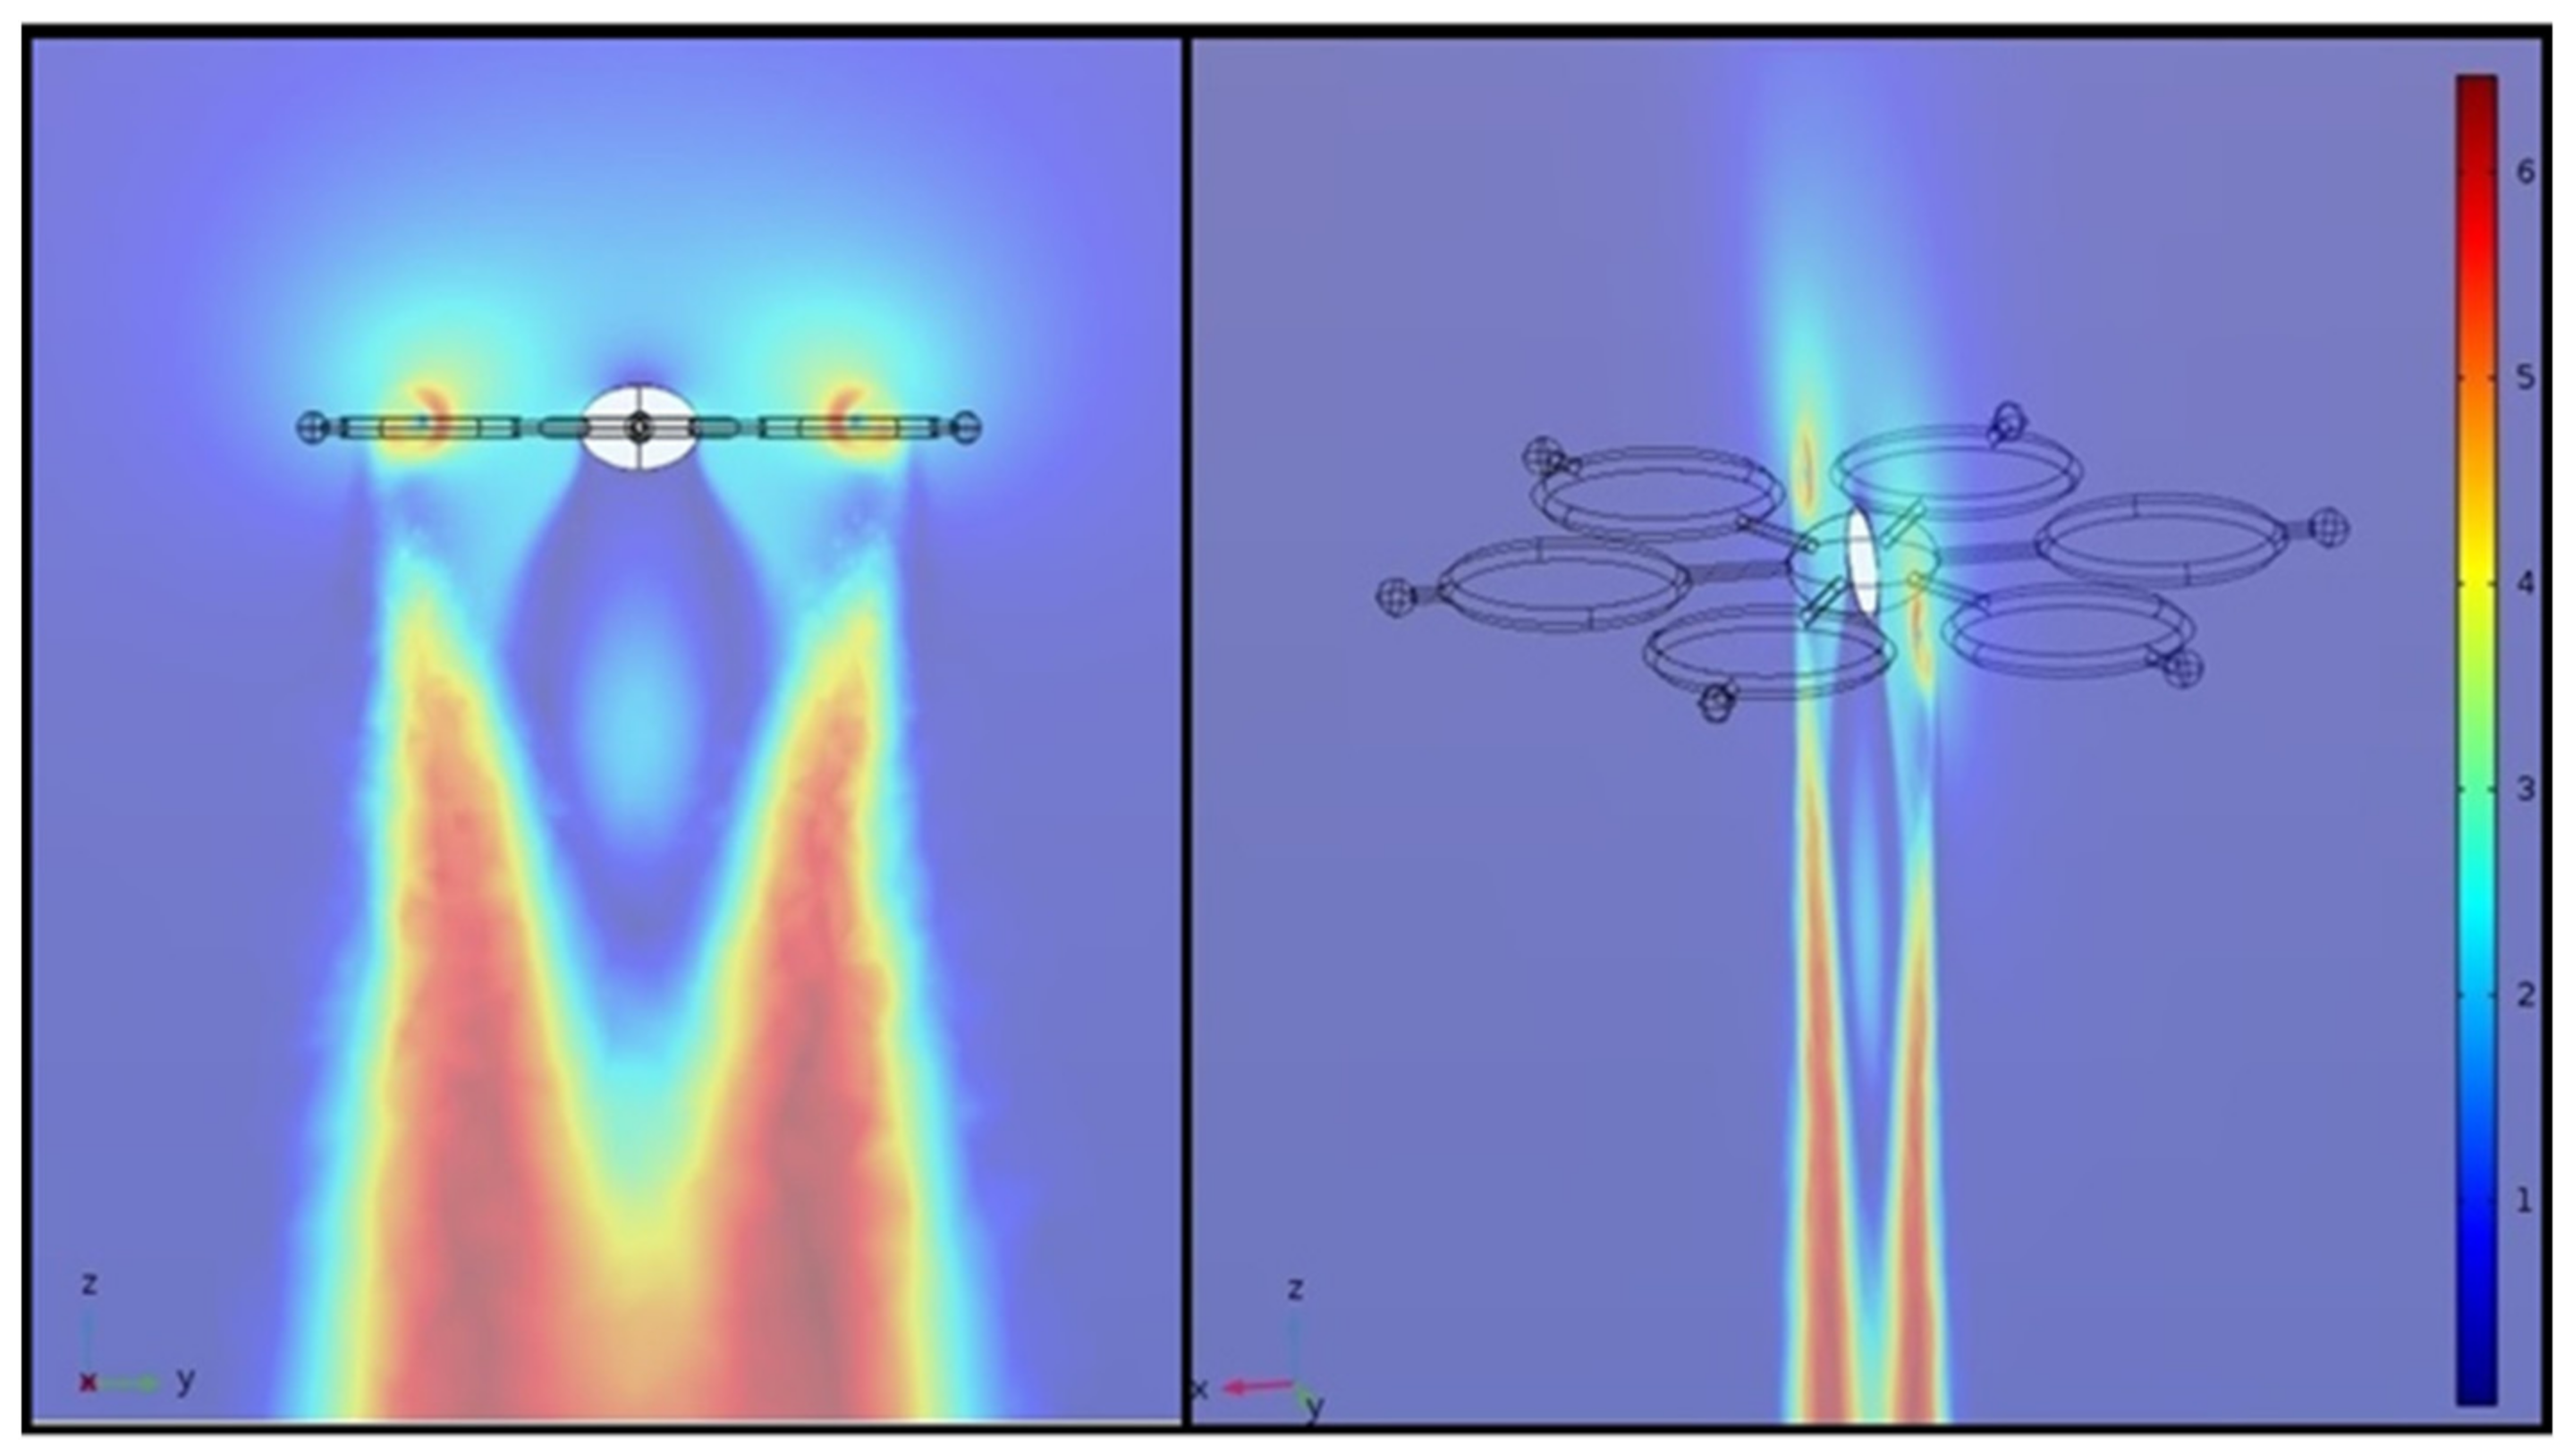
The air flow section underneath the central ellipsoid shows an interesting feature: the air flow has an acceleration between 2 and 4 m/s. As the air flow downstream expands below the propeller, it merges down at 2 meters with another air flow. This phenomenon creates a vortex (a local vorticity generated by the drone propeller) that redirects upward the flow under the nadir area and finally forces it to re-join the mainstream downward from the propeller (
Figure 7). The toroidal recirculation under the nadir made by the six propellers creates the increment in speed toward the sensor located under the centre of the drone. This implies that, in order to detect chemical substances under the drone, the aerosol/particles first need to be attracted by the propeller, then pushed downward, and finally reach the sensor after being recirculated upward in the toroidal pattern.
Given the strength of the downstream, which creates a virtual wall around the sensor, it may be difficult for the drone to detect anything when flying at medium to high altitudes unless the plume is higher than the propellers. Flying at low altitudes will instead facilitate the detection as the downstream of the air flow will increase the terrain turbulence by impacting with the ground at a high speed. Furthermore, once the chemical substance is accelerated through the ducted propeller and reaches the sensor, its concentration could change enough to be detectable during a measurement.
In the other setting, namely the radial configuration, the sensors are displaced in the outer ring of the propeller; here, the presence of several other surfaces gives rise to a fluctuating error affecting the convergence of the variables considered in the simulation.
Most of the considerations and analysis for the nadir configuration are applicable for the radial configuration as well, where the sensors are placed in the outer ring of the propellers. The pressure velocity values as well as the turbulent variables need to converge to a constant value as the number of iterations increases. Given the presence of several other aerodynamic surfaces, in this configuration, the pressure and velocity values will converge too, but they will maintain a fluctuating error range with an average value of 10
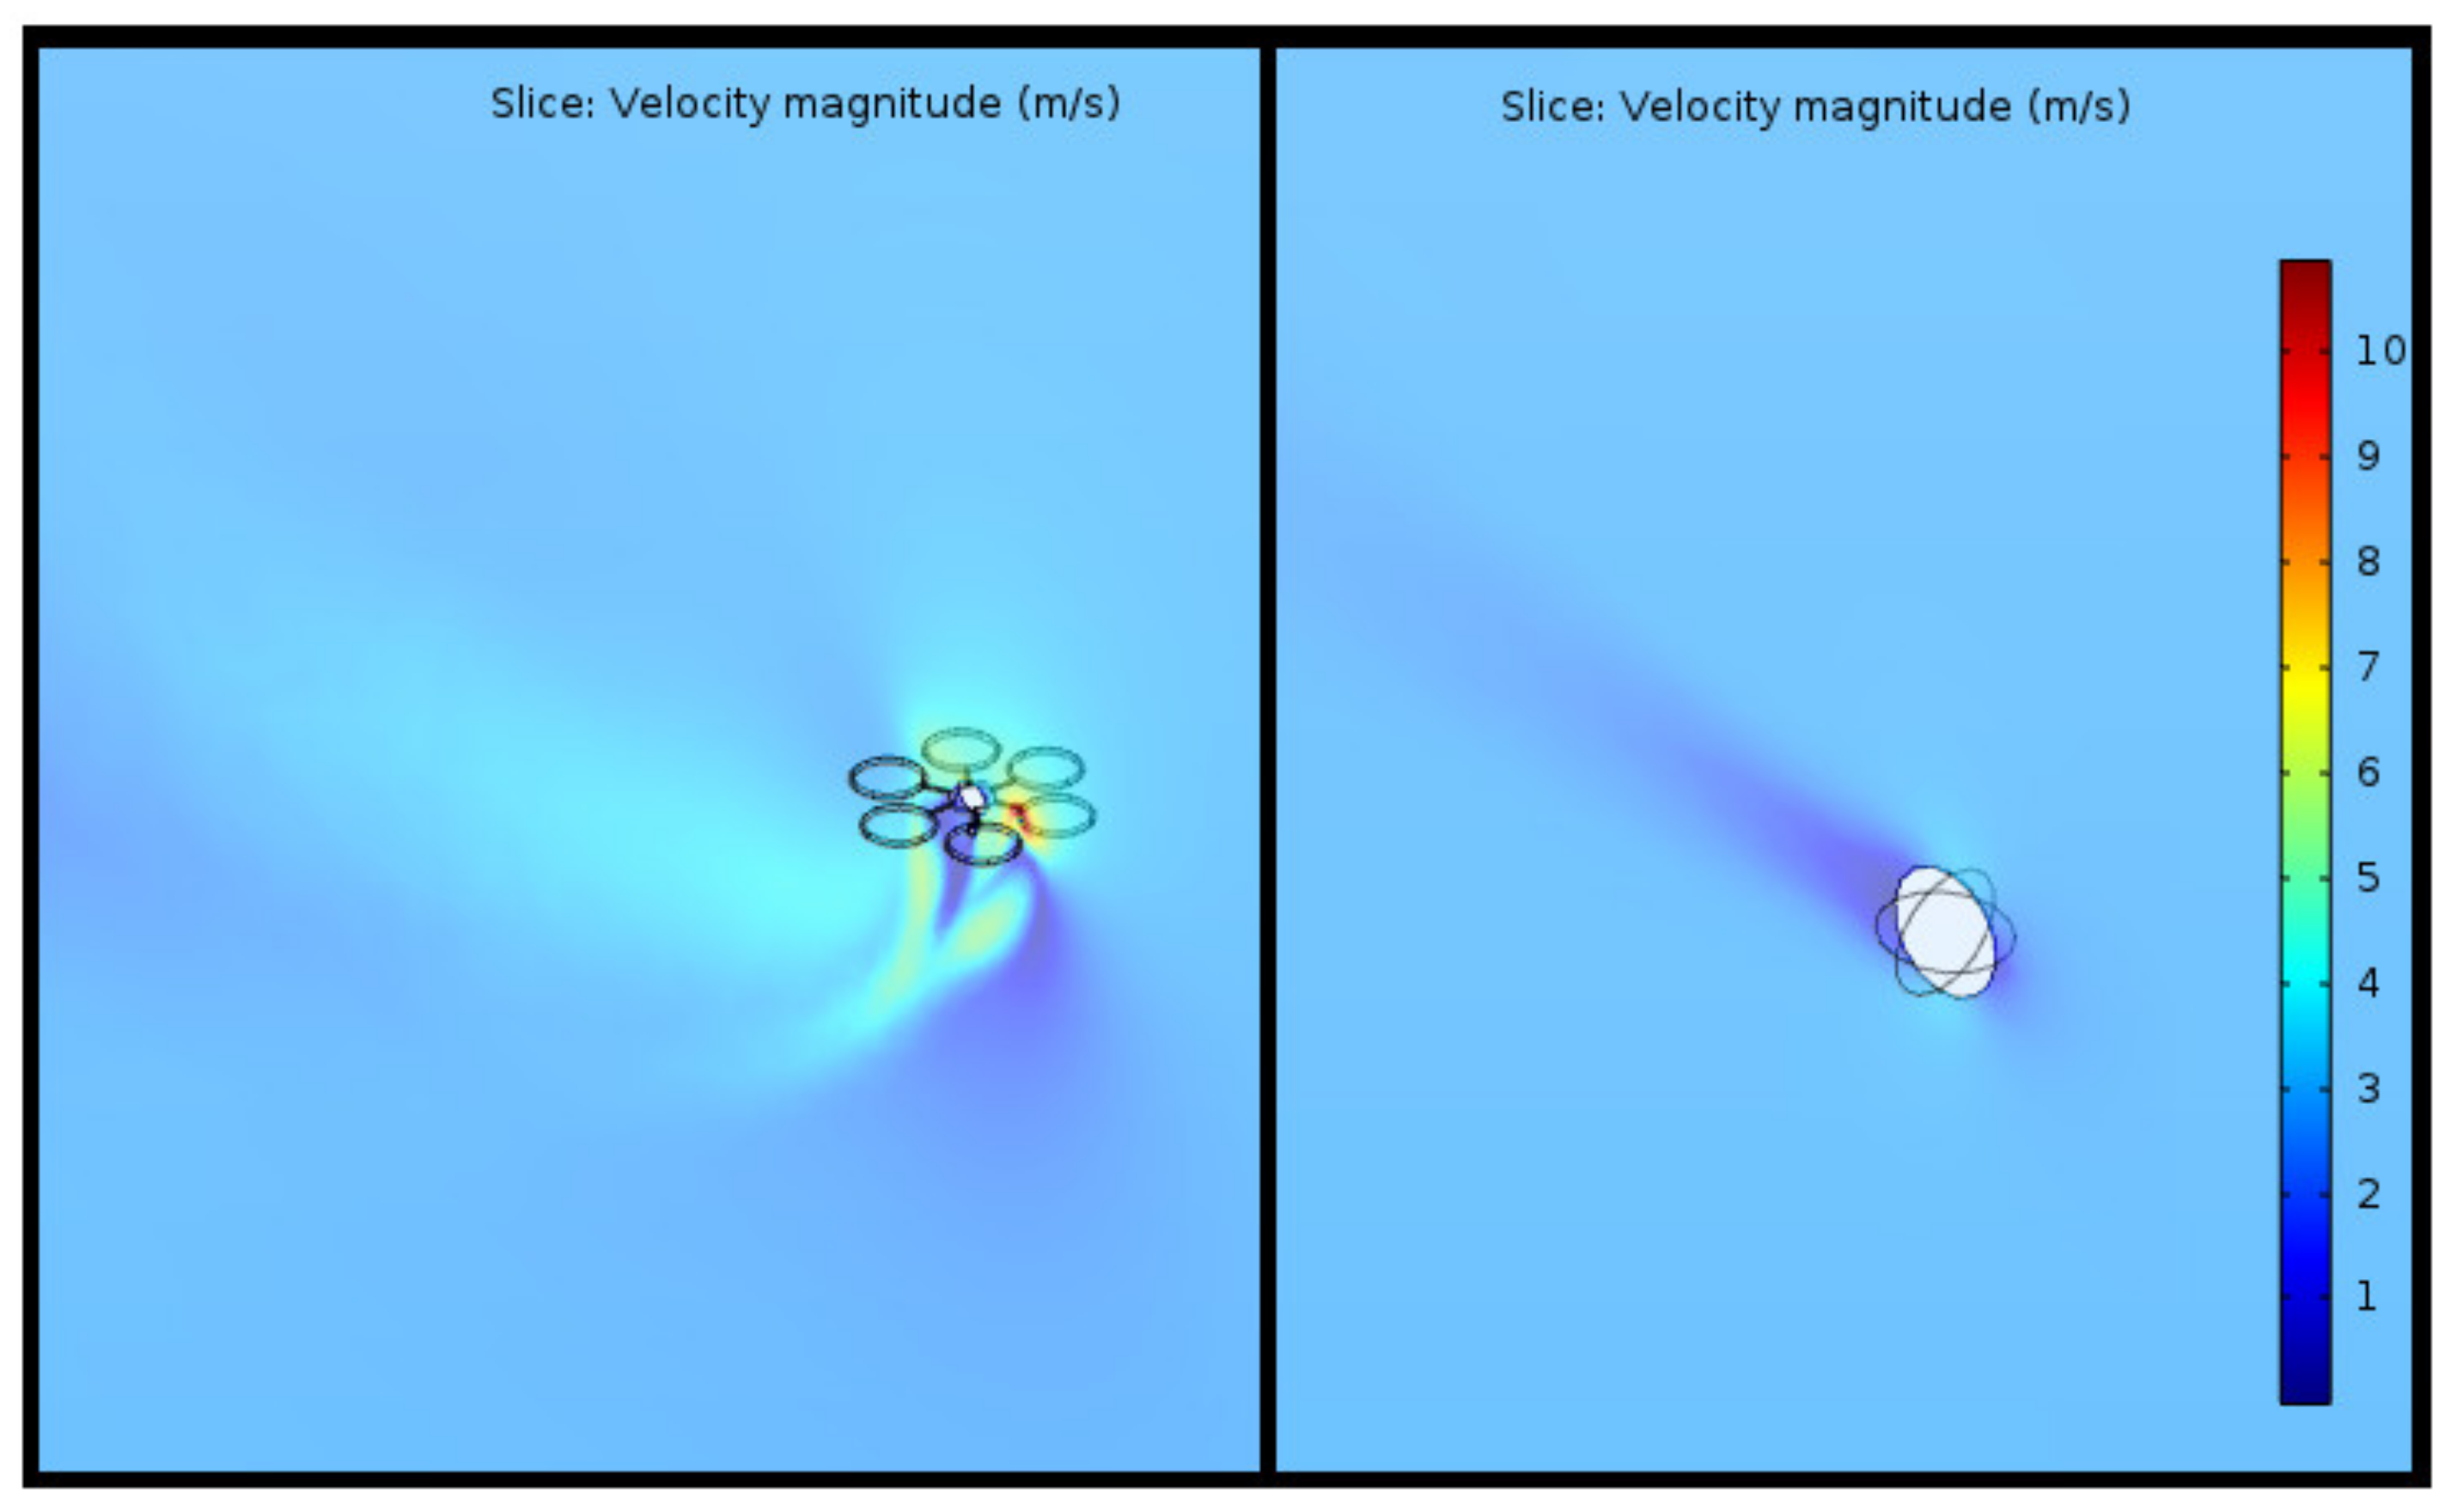
−9. Despite this fluctuation error in the convergence of the values of the variables, the radial setting seems to offer an interesting solution for enhancing the detection compared with the nadir sensor location. Whereas the nadir sensor is limited to sampling the particles that arise from the below vortex that redirect the flow upward, sensors in the radial configuration appear not to be influenced by the acceleration of the air flow (
Figure 8). As the drone hovers on a stationary plane and is reached by a chemical plume, none of its rotors downstream flows should affect it before it detects the chemical presence from a lower altitude. Moreover, if the chemical plume flows at the same altitude of the drone, then the upper rotor air-need would accelerate the air radially from outside, forcing the mixture to impact the sensors before it is sucked into the ducted propeller rotors.
Bi-Component Simulation
In the bi-component (ammonia and air) simulation, where the ammonia source is introduced into the environment, the influence of the wind direction and intensity (3 m/s) results in a turbulence both in proximity to the drone air flow and in proximity to the release point (
Figure 9). As the wind velocity is higher than the normal air flow in the reference volume above the drone, the flow lines coming from the propeller described by the simulation are dominated by the wind direction and intensity. After entering the rotors, they are twisted and accelerated downwards, but are still affected by the external wind direction.
In the final simulation, the reference volume was resized to become a parallelepiped (50 m × 50 m × 300 m) with the drone positioned at 225 meters from the ammonia source and lowered to be 5 meters higher than the source. The nadir drone bi-component simulation in the new reference volume shows the same results for both velocity magnitude and flow lines behavior graphs as for the previous reference volume (cube). It should be noted that the different speed in the volume around the drone is not related to the reference plane (ZX) including two ducted propeller rotors (as for the first mono component simulation), but it is related to the reference plane (ZY) passing for the ammonia sphere and crossing the drone between its rotors. The nadir drone bi-component simulation in the new reference volume shows the same results for both the velocity magnitude and flow lines behavior graphs found for the previous reference volume (cube). It should be noted that the different speed areas around the drone in the section view are not related to the reference plane (ZX) including two ducted propeller rotors (as for the first mono component simulation), but they are necessarily connected to the reference plane (ZY) passing for the ammonia sphere and crossing the drone between its rotors.
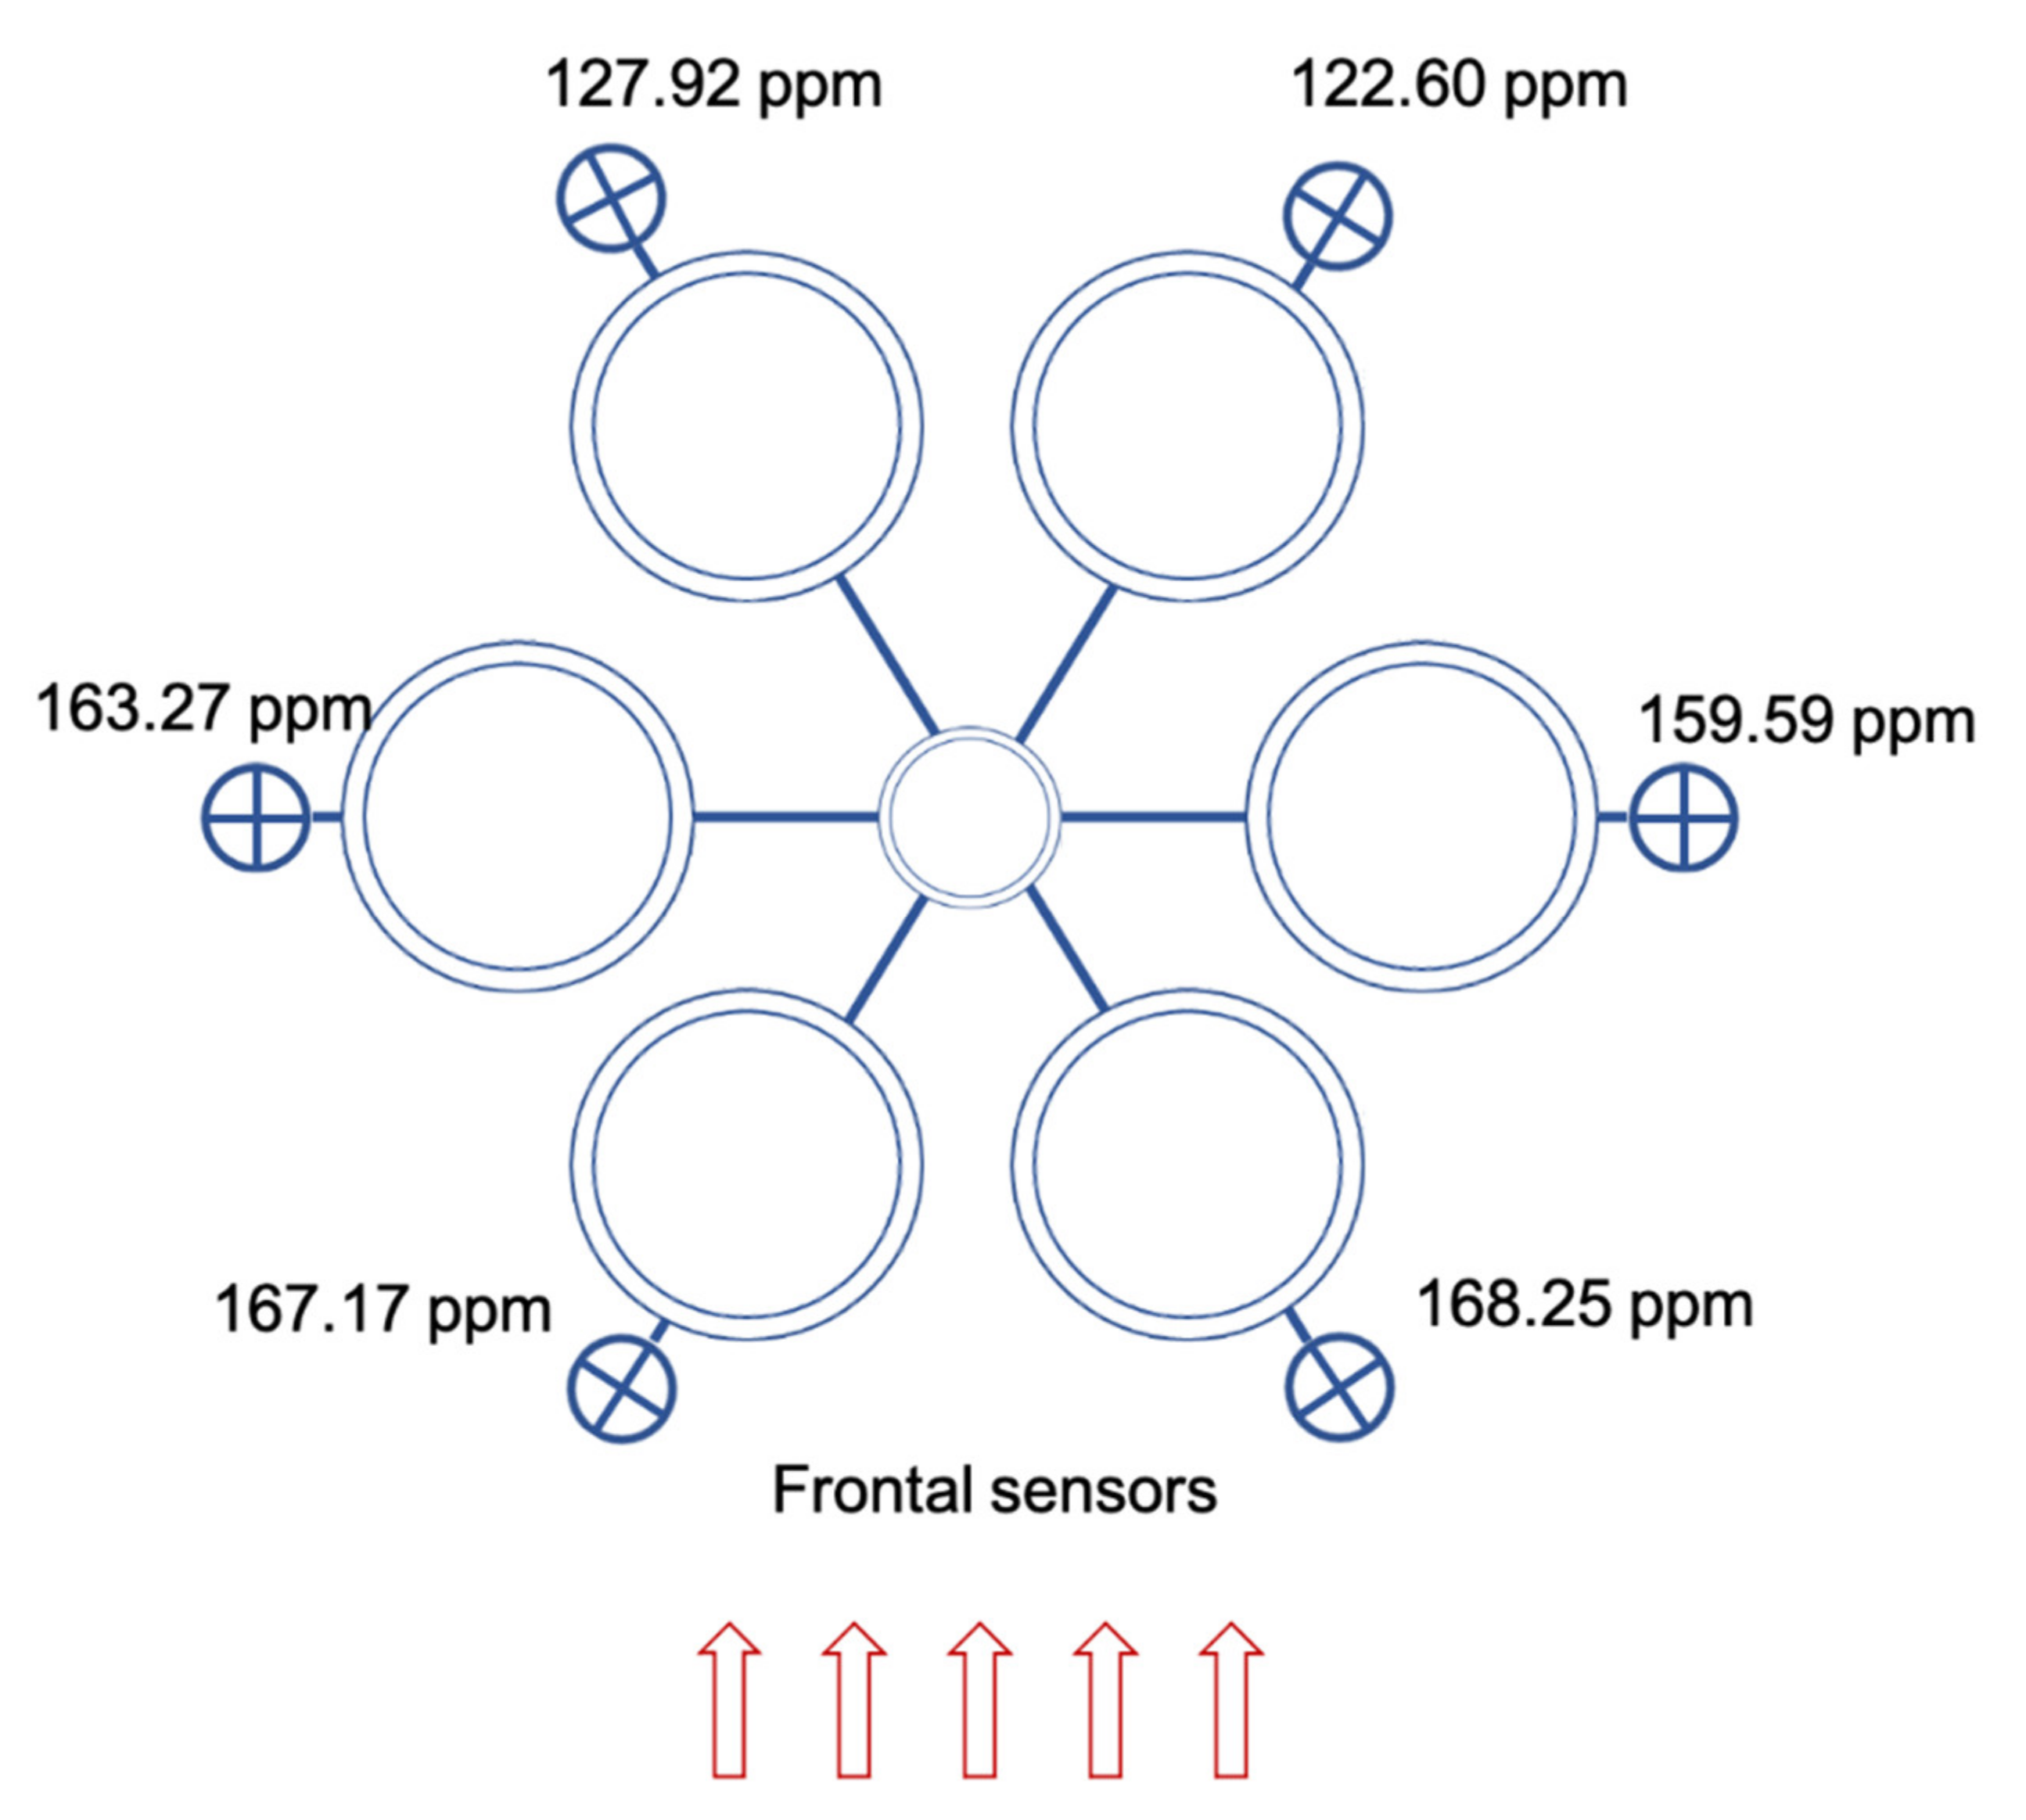
The nadir drone simulation provides interesting results when analyzing the mass fraction and, more specifically, to understand if the sensor detects a certain concentration of ammonia particles. Mass fraction is defined as the mass of one chemical species in a set volume divided by the total mass of species in the same volume. It is normally calculated in parts per million (ppm). With COMSOL software, it is possible to calculate the concentration of ammonia at any specific point, thus it is possible to assess if any sensor in a specific location on the drone will be able to detect the presence of the contaminant. By focusing on the mass fraction of the contaminants around the drone, different concentration may result owing to propeller flow. In front of the drone, such as the radial position, the mass fraction appears uninterrupted, whereas under the drone, it decreases. By comparing the mass fraction in front of the forward rotor ducts (where the sensors are located on the radial position) and below the nadir of the central body of the drone, the difference in the concentration sampling of the two configurations is evident (
Figure 10). Ranging from a minimum of 122.60 ppm to a maximum of 169.17 ppm with an average value of 151.8 ppm, the radial design shows a detection capability 5.8 times higher than the nadir configuration, where the average sensor value is 26.089 ppm.
When considering an inexpensive commercial portable detector for industrial and domestic uses and sensitivity to ammonia such as the MQ137, and by comparing its mass fraction detecting threshold against the values for both the nadir sensor and the radial ones, the advantage of the radial configuration is evident. When a dispersed concentration changes (for example, by changing the relative distance to the emission source), and considering a reduction of 1/10 of the concertation, the limit of detection (LoD) of a real sensors could make the sensor unable to detect the dispersion itself. In the case of MQ137, with an LoD of 5 ppm, a relative detection of 1/10 of the mass fraction implies that, in the nadir position, the possible detected concentration drops to 2.6 ppm, thus under the LoD of the sensor, whereas for the radial configuration, it drops to a 12.26 ppm. This implies that the nadir detection is under the threshold, whereas the radial sensor is still able to detect a useful level of concentration.
4. Conclusions and Prospects
Both CBRNe threats and hazards have evolved significantly over the last decades. Know-how and dangerous elements have become more accessible; consequently, the probability of a chemical or biological attack or casualty has grown significantly all over the world. It is obvious that every country in the world should be prepared to respond to a CBRNe event. Such a response is provided by the intervention of first responder teams, whose main task is focused on acquiring the correct situational awareness in order to save lives, rescue people, and decontaminate the hazardous area. A good situational awareness could mean the difference between life and death of both rescues and responders. In order to possess the right situational awareness, first responders not only need to be very well prepared, but they need to use whatever tool or technology available to enhance their capabilities. By providing all first responder teams with commercial drones equipped with inexpensive, low complexity sensors, capable of detecting a wide range of substances, the risk assessment process could be improved, ensuring the safety and security of the operators through a fast and effective response to the threat.
The main problem to be solved when sensors for chemical and biological detection are used on board of a drone is related to the vortexes generated by the drone propellers. Two different sets of computational fluid-dynamics simulations, using COMSOL software and starting from a drone specific design, were carried out to demonstrate the effectiveness and advantage of correct positioning of the sensors.
In this work, the simulation of the fluid-dynamics variables in proximity to the drone and the sensors on two different configurations helped to identify the optimal positioning of the detectors in the case of a chemical release/dispersion scenario. The distribution of the concentrations of the particles around the drone with and without the wind interference allowed to identify a radial configuration as an optimal solution for the detection of the chemical particles’ release. The results of the simulation emphasized how radial positioned sensors would be less affected by the rotors downstream of the drone compared with the one placed on the central belly. Moreover, as the virtual drone is a hexa-copter able to carry up to six radial sensors, a similar model could be considered a recommendation for further simulations and experimentations; for example, it may be equipped with six different low-cost and selective sensors among those to detect nerve agents, blister agents, chocking agents, blood agents, and riot control agents. If such a low-cost device will prove effective, it could determine an improvement in the detection of hazardous agents following a CBRNe event. By providing first responder teams of any organization in the world with such a kind of platform, a fast and full situational awareness and risk assessment could be easily achieved in order to face any challenge in different hostile environments.
Author Contributions
Conceptualization, J.-F.C., F.M., D.D.G. and L.M.; methodology, J.-F.C. and F.M.; validation, J.-F.C., A.M., F.d. and L.M.; formal analysis, A.M.; investigation, F.M., J.-F.C., L.M. and A.C.; data curation, F.M., J.-F.C., F.d. and L.M.; writing—original draft preparation, L.M. and A.C.; writing—review and editing, L.M., F.d. and A.C.; visualization, F.M.; supervision, P.G. and A.M.; project administration, A.M. and P.G. All authors have read and agreed to the published version of the manuscript.
Funding
This research received no external funding.
Data Availability Statement
The data presented in this study are available on request from the corresponding author.
Acknowledgments
Authors are grateful to International Master Courses in “Protection against CBRNe event” for material used and interaction with students and experts in this field. For any other information please visit
http://www.cbrngate.com, accessed on 1 March 2017.
Conflicts of Interest
The authors declare no conflict of interest.
References
- Singh, V.K.; Garcia, M.; Wise, S.Y.; Seed, T.M. Medical countermeasures for unwanted CBRN exposures: Part I chemical and biological threats with review of recent countermeasure patents. Expert Opin. Ther. Patents 2016, 26, 1431–1447. [Google Scholar] [CrossRef]
- Bruno, F.; Carestia, M.; Civica, M.; Gaudio, P.; Malizia, A.; Troiani, F.; Sciacqua, R.; Spezia, U. CBRN Risk Scenarios. In Nanomaterials for Security; Springer: Dordrecht, The Netherlands, 2018; pp. 309–317. [Google Scholar] [CrossRef]
- Fumian, F.; Di Giovanni, D.; Martellucci, L.; Rossi, R.; Gaudio, P. Application of Miniaturized Sensors to Unmanned Aerial Systems, A New Pathway for the Survey of Polluted Areas: Preliminary Results. Atmosphere 2020, 11, 471. [Google Scholar] [CrossRef]
- Rossi, R.; Gelfusa, M.; Malizia, A.; Gaudio, P. Adaptive Quasi-Unsupervised Detection of Smoke Plume by LiDAR. Sensors 2020, 20, 6602. [Google Scholar] [CrossRef]
- Carestia, M.; Troiani, F.; Caldari, R.; Civica, M.; Bruno, F.; Vicini, C.; Di Giovanni, D.; Iannotti, A.; Russo, C.; Thornton, M.; et al. CBRNe as Conceptual Frame of an All Hazards Approach of Safety and Security: The Creation of Organic Networks of Military, Civil, Academic/Research and Private Entities at National and International Level to Generate Solutions for Risk Reduction—A European and Italian Perspective. In Nanomaterials for Security; Springer: Dordrecht, The Netherlands, 2020; pp. 307–315. [Google Scholar] [CrossRef]
- Larcombe, M.H.E. Robotics in Nuclear Engineering: Computer Assisted Teleoperation in Hazardous Environments with Particular Reference to Radiation Fields; Graham and Trotman, Inc.: Gaithersburg, MD, USA, 1984. [Google Scholar]
- Peng, C.-C.; Hsu, C.-Y.; Chao-Chung, P. Integration of an unmanned vehicle and its application to real-time gas detection and monitoring. In Proceedings of the 2015 IEEE International Conference on Consumer Electronics-Taiwan, Taipei, Taiwan, 6–8 June 2015; pp. 320–321. [Google Scholar] [CrossRef]
- Siegel, M.W. Olfaction Metal Oxide Semiconductor Gas Sensors and Neural Networks. In Traditional and Non-Traditional Robotic Sensors; Springer: Berlin/Heidelberg, Germany, 1990; pp. 143–157. [Google Scholar] [CrossRef]
- Genovese, V.; Dario, P.; Magni, R.; Odetti, L. Self-organizing behaviour and swarm intelligence in a pack of mobile miniature robots in search of pollutants. In Proceedings of the IEEE/RSJ International Conference on Intelligent Robots and Systems, Raleigh, NC, USA, 7–10 July 1992; Volume 3, pp. 1575–1582. [Google Scholar] [CrossRef]
- Mächler, P. Detection technologies for anti-personnel mines. In Proceedings of the Autonomous Vehicles in Mine Countermeasures Symposium, Monterey, CA, USA, 4–6 April 1995; pp. 6–150. [Google Scholar]
- Trevelyan, J.P.; Kang, S.-C.; Hamel, W.R. Robotics in Hazardous Applications. In Springer Handbook of Robotics; Springer: Berlin/Heidelberg, Germany, 2008; pp. 1101–1126. [Google Scholar] [CrossRef]
- Restas, A. Drone applications for preventing and responding HAZMAT disaster. World J. Eng. Technol. 2016, 4, 76–84. [Google Scholar] [CrossRef] [Green Version]
- Gardner, C.W.; Wentworth, R.; Treado, P.J.; Batavia, P.; Gilbert, G. Remote chemical biological and explosive agent detection using a robot-based Raman detector. In Unmanned Systems Technology X; International Society for Optics and Photonics: Orlando, FL, USA, 2008; Volume 6962, p. 69620T. [Google Scholar] [CrossRef]
- Humphrey, C.M.; Adams, J.A. Robotic tasks for cbrne incident response. Adv. Robot. 2009, 23, 1217–1232. [Google Scholar] [CrossRef]
- Chierici, A.; Malizia, A.; di Giovanni, D.; Fumian, F.; Martellucci, L.; Gaudio, P.; D’Errico, F. A low-cost radiation detection system to monitor radioactive environments by unmanned vehicles. Eur. Phys. J. Plus 2021, 136, 1–18. [Google Scholar] [CrossRef]
- Marturano, F.; Ciparisse, J.F.; Chierici, A.; d’Errico, F.; Di Giovanni, D.; Fumian, F.; Malizia, A. Enhancing Radiation Detection by Drones through Numerical Fluid Dynamics Simulations. Sensors 2020, 20, 1770. [Google Scholar] [CrossRef] [Green Version]
- Asad, M.; Al Aidaros, O.; Beg, R.; Al Dhahri, M.; Al Neyadi, S.; Hussein, M. Development of autonomous drone for gas sensing application. In Proceedings of the 2017 International Conference on Electrical and Computing Technologies and Applications, Ras Al Khaimah, United Arab Emirates, 21–23 November 2017; pp. 1–6. [Google Scholar] [CrossRef]
- Rossi, M.; Brunelli, D.; Adami, A.; Lorenzelli, L.; Menna, F.; Remondino, F. Gas-Drone: Portable gas sensing system on UAVs for gas leakage localization. In Proceedings of the IEEE SENSORS 2014, Valencia, Spain, 2–5 November 2014; pp. 1431–1434. [Google Scholar] [CrossRef]
- Tosato, P.; Facinelli, D.; Prada, M.; Gemma, L.; Rossi, M.; Brunelli, D. An Autonomous Swarm of Drones for Industrial Gas Sensing Applications. In Proceedings of the 2019 IEEE 20th International Symposium on “A World of Wireless, Mobile and Multimedia Networks” (WoWMoM), Washington, DC, USA, 10–12 June 2019; pp. 1–6. [Google Scholar] [CrossRef]
- Khan, A.; Schaefer, D.; Tao, L.; Miller, D.J.; Sun, K.; Zondlo, M.A.; Harrison, W.A.; Roscoe, B.; Lary, D.J. Low Power Greenhouse Gas Sensors for Unmanned Aerial Vehicles. Remote Sens. 2012, 4, 1355–1368. [Google Scholar] [CrossRef] [Green Version]
- Berman, E.S.; Fladeland, M.; Liem, J.; Kolyer, R.; Gupta, M. Greenhouse gas analyzer for measurements of carbon dioxide, methane, and water vapor aboard an unmanned aerial vehicle. Sensors Actuators B Chem. 2012, 169, 128–135. [Google Scholar] [CrossRef]
- Burgués, J.; Hernández, V.; Lilienthal, A.J.; Marco, S. Smelling Nano Aerial Vehicle for Gas Source Localization and Mapping. Sensors 2019, 19, 478. [Google Scholar] [CrossRef] [Green Version]
- Carrozzo, M.; De Vito, S.; Esposito, E.; Salvato, M.; Formisano, F.; Massera, E.; Mennella, A. UAV intelligent chemical multisensor payload for networked and impromptu gas monitoring tasks. In Proceedings of the 2018 5th IEEE International Workshop on Metrology for AeroSpace (MetroAeroSpace), Rome, Italy, 20–22 June 2018; pp. 112–116. [Google Scholar] [CrossRef]
- Chang, C.-C.; Wang, J.-L.; Liang, M.-C.; Lin, M.-R. Development of a multicopter-carried whole air sampling apparatus and its applications in environmental studies. Chemosphere 2016, 144, 484–492. [Google Scholar] [CrossRef] [Green Version]
- Xie, T.; Liu, R.; Hai, R.; Hu, Q.; Lu, Q. UAV Platform Based Atmospheric Environmental Emergency Monitoring System Design. J. Appl. Sci. 2013, 13, 1289–1296. [Google Scholar] [CrossRef] [Green Version]
- Rossi, M.; Brunelli, D. Autonomous Gas Detection and Mapping with Unmanned Aerial Vehicles. IEEE Trans. Instrum. Meas. 2015, 65, 765–775. [Google Scholar] [CrossRef]
- Rossi, M.; Brunelli, D. Gas Sensing on Unmanned Vehicles: Challenges and Opportunities. In Proceedings of the 2017 New Generation of CAS (NGCAS), Genova, Italy, 6–9 September 2017; pp. 117–120. [Google Scholar] [CrossRef]
- Mcgonigle, A.J.S.; Aiuppa, A.; Giudice, G.; Tamburello, G.; Hodson, A.; Gurrieri, S. Unmanned aerial vehicle measurements of volcanic carbon dioxide fluxes. Geophys. Res. Lett. 2008, 35. [Google Scholar] [CrossRef] [Green Version]
- Shinohara, H. Composition of volcanic gases emitted during repeating Vulcanian eruption stage of Shinmoedake, Kirishima volcano, Japan. Earth Planets Space 2013, 65, 667–675. [Google Scholar] [CrossRef] [Green Version]
- Rudiger, J.; Tirpitz, J.L.; Moor, J.; Bobrowski, N.; Gutmann, A.; Liuzzo, M.; Hoffmann, T. Implementation of electrochemical, optical and denuder-based sensors and sampling techniques on UAV for volcanic gas measurements: Examples from Masaya, Turrialba and Stromboli volcanoes. Atmos. Meas. Tech. 2018, 11, 2441–2457. [Google Scholar] [CrossRef] [Green Version]
- Mori, T.; Hashimoto, T.; Terada, A.; Yoshimoto, M.; Kazahaya, R.; Shinohara, H.; Tanaka, R. Volcanic plume measurements using a UAV for the 2014 Mt. Ontake eruption. Earth Planets Space 2016, 68, 1. [Google Scholar] [CrossRef] [Green Version]
- Astuti, G.; Giudice, G.; Longo, D.; Melita, C.D.; Muscato, G.; Orlando, A. An Overview of the “Volcan Project”: An UAS for Exploration of Volcanic Environments. J. Intell. Robot. Syst. 2008, 54, 471–494. [Google Scholar] [CrossRef]
- Neumann, P.P.; Kohlhoff, H.; Hullmann, D.; Lilienthal, A.J.; Kluge, M. Bringing Mobile Robot Olfaction to the next dimension —UAV-based remote sensing of gas clouds and source localization. In Proceedings of the 2017 IEEE International Conference on Robotics and Automation (ICRA), Singapore, 29 May–3 June 2017; pp. 3910–3916. [Google Scholar] [CrossRef]
- Golston, L.M.; Aubut, N.F.; Frish, M.B.; Yang, S.; Talbot, R.W.; Gretencord, C.; Zondlo, M.A. Natural gas fugitive leak detection using an unmanned aerial vehicle: Localization and quantification of emission rate. Atmosphere 2018, 9, 333. [Google Scholar] [CrossRef] [Green Version]
- Krüll, W.; Tobera, R.; Willms, I.; Essen, H.; von Wahl, N. Early Forest Fire Detection and Verification using Optical Smoke, Gas and Microwave Sensors. Procedia Eng. 2012, 45, 584–594. [Google Scholar] [CrossRef]
- Merino, L.; Caballero, F.; de Dios, J.R.M.; Ferruz, J.; Ollero, A. A cooperative perception system for multiple UAVs: Application to automatic detection of forest fires. J. Field Robot. 2006, 23, 165–184. [Google Scholar] [CrossRef]
- Pfeifer, J.; Khanna, R.; Constantin, D.; Popovic, M.; Galceran, E.; Walter, A.; Siegwart, R.; Liebisch, F. Towards automatic UAV data interpretation. In Proceedings of the International Conference of Agricultural Engineering 2016, Aahus, Denmark, 26–29 June 2016. [Google Scholar]
- Roldán, J.J.; Joossen, G.; Sanz, D.; Del Cerro, J.; Barrientos, A. Mini-UAV Based Sensory System for Measuring Environmental Variables in Greenhouses. Sensors 2015, 15, 3334–3350. [Google Scholar] [CrossRef] [Green Version]
- Pobkrut, T.; Eamsa-Ard, T.; Kerdcharoen, T. Sensor drone for aerial odor mapping for agriculture and security services. In Proceedings of the 2016 13th International Conference on Electrical Engineering/Electronics, Computer, Telecommunications and Information Technology (ECTI-CON), Chiang Mai, Thailand, 28 June–1 July 2016; pp. 1–5. [Google Scholar] [CrossRef]
- Lega, M.; Napoli, R.M.A. A new approach to solid waste landfills aerial monitoring. Waste Manag. Environ. IV 2008, 109, 193–199. [Google Scholar] [CrossRef] [Green Version]
- Allen, G.; Hollingsworth, P.; Kabbabe, K.; Pitt, J.; Mead, M.; Illingworth, S.; Roberts, G.; Bourn, M.; Shallcross, D.E.; Percival, C.J. The development and trial of an unmanned aerial system for the measurement of methane flux from landfill and greenhouse gas emission hotspots. Waste Manag. 2019, 87, 883–892. [Google Scholar] [CrossRef]
- Emran, B.J.; Tannant, D.D.; Najjaran, H. Low-Altitude Aerial Methane Concentration Mapping. Remote Sens. 2017, 9, 823. [Google Scholar] [CrossRef] [Green Version]
- Daniel, K.; Dusza, B.; Lewandowski, A.; Wietfeld, C. AirShield: A system-of-systems MUAV remote sensing architecture for disaster response. In Proceedings of the 2009 3rd Annual IEEE Systems Conference, Vancouver, BC, Canada, 23–26 March 2009; pp. 196–200. [Google Scholar] [CrossRef]
- Murphy, R.R.; Tadokoro, S.; Kleiner, A. Disaster Robotics. In Springer Handbook of Robotics; Springer: Cham, Switzerland, 2016; pp. 1577–1604. [Google Scholar]
- Alvarado, M.; Gonzalez, F.; Fletcher, A.; Doshi, A. Towards the development of a low-cost airborne sensing system to mon-itor dust particles after blasting at open-pit mine sites. Sensors 2015, 15, 19667–19687. [Google Scholar] [CrossRef] [Green Version]
- Villa, T.F.; Gonzalez, F.; Miljievic, B.; Ristovski, Z.D.; Morawska, L. An Overview of Small Unmanned Aerial Vehicles for Air Quality Measurements: Present Applications and Future Prospectives. Sensors 2016, 16, 1072. [Google Scholar] [CrossRef] [PubMed] [Green Version]
- Pajares, G. Overview and Current Status of Remote Sensing Applications Based on Unmanned Aerial Vehicles (UAVs). Photogramm. Eng. Remote. Sens. 2015, 81, 281–330. [Google Scholar] [CrossRef] [Green Version]
- Siciliano, B.; Khatib, O. Handbook of Robotics; Springer: Cham, Switzerland, 2016. [Google Scholar]
- COMSOL. Available online: https://www.comsol.com/ (accessed on 22 July 2021).
- Wendt, J.; Bourzutschky, M.; Mallinckrodt, A.J.; McKay, S. Computational Fluid Dynamics: An Introduction. Comput. Phys. 1993, 7, 542. [Google Scholar] [CrossRef] [Green Version]
| Publisher’s Note: MDPI stays neutral with regard to jurisdictional claims in published maps and institutional affiliations. |
© 2021 by the authors. Licensee MDPI, Basel, Switzerland. This article is an open access article distributed under the terms and conditions of the Creative Commons Attribution (CC BY) license (https://creativecommons.org/licenses/by/4.0/).


 ,
, 


