Article

Detection and Characterization of Stressed Sweet Cherry Tissues Using Machine Learning

by
Christos Chaschatzis
1,
Chrysoula Karaiskou
1,
Efstathios G. Mouratidis
2,
Evangelos Karagiannis
3 and
Panagiotis G. Sarigiannidis
1,*
1
Department of Electrical and Computer Engineering, University of Western Macedonia Kozani, 50100 Kozani, Greece
2
Department of Horticulture, Aristotle University of Thessaloniki Laboratory of Pomology, 54006 Thessaloniki, Greece
3
Department of Agriculture, University of Western Macedonia, 50100 Florina, Greece
*
Author to whom correspondence should be addressed.
Submission received: 29 October 2021 / Revised: 14 December 2021 / Accepted: 16 December 2021 / Published: 22 December 2021
(This article belongs to the Section Drones in Agriculture and Forestry)

Abstract

:
Recent technological developments in the primary sector and machine learning algorithms allow the combined application of many promising solutions in precision agriculture. For example, the YOLOv5 (You Only Look Once) and ResNet Deep Learning architecture provide high-precision real-time identifications of objects. The advent of datasets from different perspectives provides multiple benefits, such as spheric view of objects, increased information, and inference results from multiple objects detection per image. However, it also raises crucial obstacles such as total identifications (ground truths) and processing concerns that can lead to devastating consequences, including false-positive detections with other erroneous conclusions or even the inability to extract results. This paper introduces experimental results from the machine learning algorithm (Yolov5) on a novel dataset based on perennial fruit crops, such as sweet cherries, aiming to enhance precision agriculture resiliency. Detection is oriented on two points of interest: (a) Infected leaves and (b) Infected branches. It is noteworthy that infected leaves or branches indicate stress, which may be due to either a stress/disease (e.g., Armillaria for sweet cherries trees, etc.) or other factors (e.g., water shortage, etc). Correspondingly, the foliage of a tree shows symptoms, while this indicates the stages of the disease.

1. Introduction

In the modern industrial era, the primary production sectors have made a tremendous leap in automating and optimizing their subsequent production and processing methods. In particular, with the ever ending infiltration of smart technologies [1], such as Unmanned Aerial Vehicles (UAVs) [2], Robots [3], smart supply chains, the continuous evolution of Computer Vision (CV) and the continuous amelioration of Artificial Intelligence (AI) in most industrial technologies, the production methods in the primary sector [4,5] have undergone a serious upgrade to new quality standards [6]. This phenomenon has increasingly been seen in the Agricultural sector, as new methods to procure the quality of the product and establish its sustainability are needed [7]. On the subject of product quality assurance, the agricultural sector has been influenced by many novel AI-enabled technologies, and specifically, implementations based on the Machine Learning (ML) and Deep Learning (DL) paradigm. Modern implementations utilizing the power of these technologies and complemented by the recent surge in the utilization of AI-oriented hardware, like Graphical Processor Units (GPUs), on the edge, have revolutionized the way the quality of the products is maintained to a specific standard, while at the same time significantly accelerating the process resulting in higher-quality higher-amount performance. It is significant to implement these modern technologies in the confrontation of tree diseases. This work will be analyzing a dangerous and invisible sickness on the foliage of a tree. This disease has the ability until this moment to be detected only on decayed roots. More specifically, for Sweet Cherry trees this disease is identified after the completely wilting of the tree foliage. In other words, the identification can be executed after the death of the tree. The examination of the tree requires two conditions. Firstly, the whole tree must uproot. Secondly, the tree should dismantle into parts. Every part will be analyzed by experts.This procedure has three main drawbacks. Specifically, this method is very costly, is time-consuming, and does not predict the infected trees early enough to save them. The name of this dangerous disease is Armillaria. Notably, in the U.S. loses every year approximately 8 million dollars every year from Armillaria [8].
Every single advancement comes with its respective shortcomings, so does the implementation of AI methods in the agricultural sector. Even though the progress in some technological fields has been monumental, such as quality assurance in Precision Agriculture [9], in others the adaption of AI has staggered behind leaving a big gap in its holistic utilization. Specifically, the use of ML and DL for detecting possible diseases in trees, which can have a severe impact both on the quality and amount of the product but also in future crops, have blatantly been left behind. This can be traced back to two significant factors. The first stems from the fact that the complexity of the problem-to-solve is naturally high. A perennial tree can have hundreds of leaves and branches that may or may not be infected, something that exponentially increases the amount of data to be processed. Moreover, the way of obtaining the data plays a major role in the process. One of the most common methods for obtaining data about the subjects is by means of photographing the leaves, branches, or the trees themselves. Since most deceases are appear as perturbations, degradation, or degeneration on small portions of the tree body, higher resolution, deeper networks, and data optimization are needed, making the production of a standardized methodology for tree stress/disease detection a hard task. The second factor is, as always in ML, data availability. Since datasets are the pillars on which Supervised Learning is based, the lack thereof, including low-quality datasets and the big morphological gap in the variety of tree species, makes the construction of AI-enabled solutions for disease detection on trees a practical impossibility.
Notably, some noteworthy work has been performed to solve these setbacks. On the subject of disease detection and recognition, the authors in [10] develop an algorithm to automatically detect and subsequently classify insect-infected fir trees (Abies mariesii) and deciduous trees. Their methodology is based on treetop (aerial) photos from UAVs. The authors utilize a Dense point cloud and normalized Digital Surface Models (nDSM) approach to detect the treetops and an orthomosaic approach to differentiate between the tree categories. The annotated data are aggregated and then fed to a Convolutional Neural Network (CNN) [11] to categorize the trees to their health status and respective category. Their study produced significant results in recognizing infested trees. A certain drawback of this method is that only treetops images can be obtained resulting in information loss about the trees like the disease progression. Moreover, the performance of the algorithm can be affected based on the density of the tree population and their different categories. Likewise, the authors in [12] utilize the Faster-RCNN [13] DL architecture based on ResNet101 [14], trained on UAV-obtained treetop images to detect pine wild diseased pine trees. They compare the performance of the utilized model with the known VGG16 [15] and present comparable results, about 90 % detection. This method suffers from the aforementioned setbacks as well.
Another significant contribution on the subject of disease detection and identification was made by [16]. In this work, the authors utilized an open-source dataset that includes 54,306 images from infected leaves, 26 different diseases, and 38 classes. Each image contains a single leaf, which has been infected by one particular disease. All leaves present obvious and advanced symptoms of the disease, from which they are infected. They use three different versions of the PlantVillage dataset [17] to train their machine learning models: (a) original color of images, (b) converted all images to gray-scale, and (c) only leaves without background. Furthermore, they utilize the AlexNet [18] and GoogLeNet [19] architectures and combined them with two training mechanisms. The most high-accuracy combination was GoogLeNet-TransferLearning-Color, which had 99.34 % accuracy. However, machine learning models constantly need more images to be added. As a result, the authors implemented various computer vision techniques, which eventually failed to procure better results than the models.
Notably, some noteworthy work has been performed to compare machine algorithms [20]. In this work, the authors compared several machine learning algorithms such as YOLOv5 + ResNet50, YOLOv5, Fast RCNN, and EfficientDet. The purpose of this study is to identify chest abnormalities in X-Ray images. The dataset was collected via VinBigData’s web-based platform. This dataset includes 14 critical radiographic findings and 18,000 scans in total. During the evaluation process of the trained models, one model has distinguished it from others. The combination of Yolov5 and Resnet-50 has the best metric values, which are [email protected] and Precision equals 0.254 and 0.512 respectively.
As in most life forms, diseases in trees come in all shapes and sizes. Specifically, though, for sweet cherry trees that are the main focus of this study, the symptoms of the infected trees can become apparent by closely examining the leaves and branches [21]. A diseased or stressed leaf is characterized by four optical factors: (a) the symptoms of the disease, (b) its deformation from its original shape, (c) its color shade, and (d) wilting of the foliage. These factors are better depicted in Figure 1. A common disease that usually plagues the cherries trees is Armillaria [22], which is one of the most severe root rot pathogens. Armillaria sp. mainly affects the plant’s root tissue and has a notable impact on tree foliage tissues. Identification of 101 diseases [23]. Unfortunately, the task of examining and further studying the roots of cherries trees can be a challenging task but also extremely harmful to the tree, most of the time undermining its subsequent production performance. For this reason, this study focuses on symptoms of foliage such as leaf twists and wilting leaves (yellowish leaves), which are at an advanced stage.
Armillaria has also a severe impact on branches. This disease infects healthy branches and eventually makes them a mass of wilting leaves, which after some time each leaf will change color and fall to the ground. These infected areas are located outer circumference of the tree or even the main body of the tree. These infections are quite devastating for the cherries in the growing season. Some examples are presented in Figure 2.
The primary goal and the purpose of this work are not just to detect individually infected foliage in sweet cherry trees. On the contrary, to provide all environmental variables from the entire field. Having a complete picture of the crop is possible or even actuality to understand the state of the crop is healthy or not. In the scenario that the crop has individually infected areas (trees or plants), possibly an algorithm can observe the pattern created by them. Evaluating these patterns, an algorithm can determine the cause behind these infected areas. For example, if a water pipe breaks, the water will leak and create stress near trees or plants by extreme irrigation.
Considering the above problem formulation, this work strives to produce a methodology for tree disease detection on variable family sweet cherry trees. Specifically, this study undertakes the creation of an analytical sweet cherry tree dataset aimed at multivariate disease detection from the perspective of individually sampled tree images, annotated to differentiate infected leaves and branches. Consequently, a Deep Learning algorithm, leveraging the ResNet50 architecture is trained on the produced dataset, the results of which are compared with other known implementations.
This work has two primary contributions to the scientific community, which can assist future researches on both infected or stressed sweet cherry trees and the identification of the stress induce parameters. These contributions are:
  • The production of chErry tRee dIsease deteCtion dAtaset (ERICA).
  • A methodology leveraging Deep Learning and specifically the ResNet architecture.
The first contribution refers to the production of ERICA, an annotated sweet cherry tree dataset for multivariate stress/disease detection. The ERICA dataset can be analyzed in multiple points of interest. Every image consists of hundreds or even thousands of objects, which can take part in another dataset or process with computer vision techniques. This flexibility that offers the ERICA can assist researchers to develop methods and evaluate them for a revised understanding of disease identification. The second contribution relates to Deep Learning and the ResNet architecture, to detect diseased sweet cherry trees using the produced (ERICA) dataset. This methodology can be useful for the identification of multivariate objects. In the evaluation of models in this paper, researchers can utilize the most trustworthy model configuration and algorithm, which can use it in their dataset. Furthermore, the machine learning models developed and presented in this work can be applied to images or videos acquired by UAVs for the detection of Armillaria symptoms in perennial fruit trees. On the one hand, a UAV can be utilized only for scanning the crop field and reporting the collected images back to the server for further processing via the trained models. On the other hand, promoting the employment of Next Generation Internet of Things applications in Agriculture as well as edge computing applications, the analysis of the infection status of crop fields could occur upon the UAV itself by using an advanced microcontroller. Finally, the outcome of this paper can be applied to any photographic or video footage.

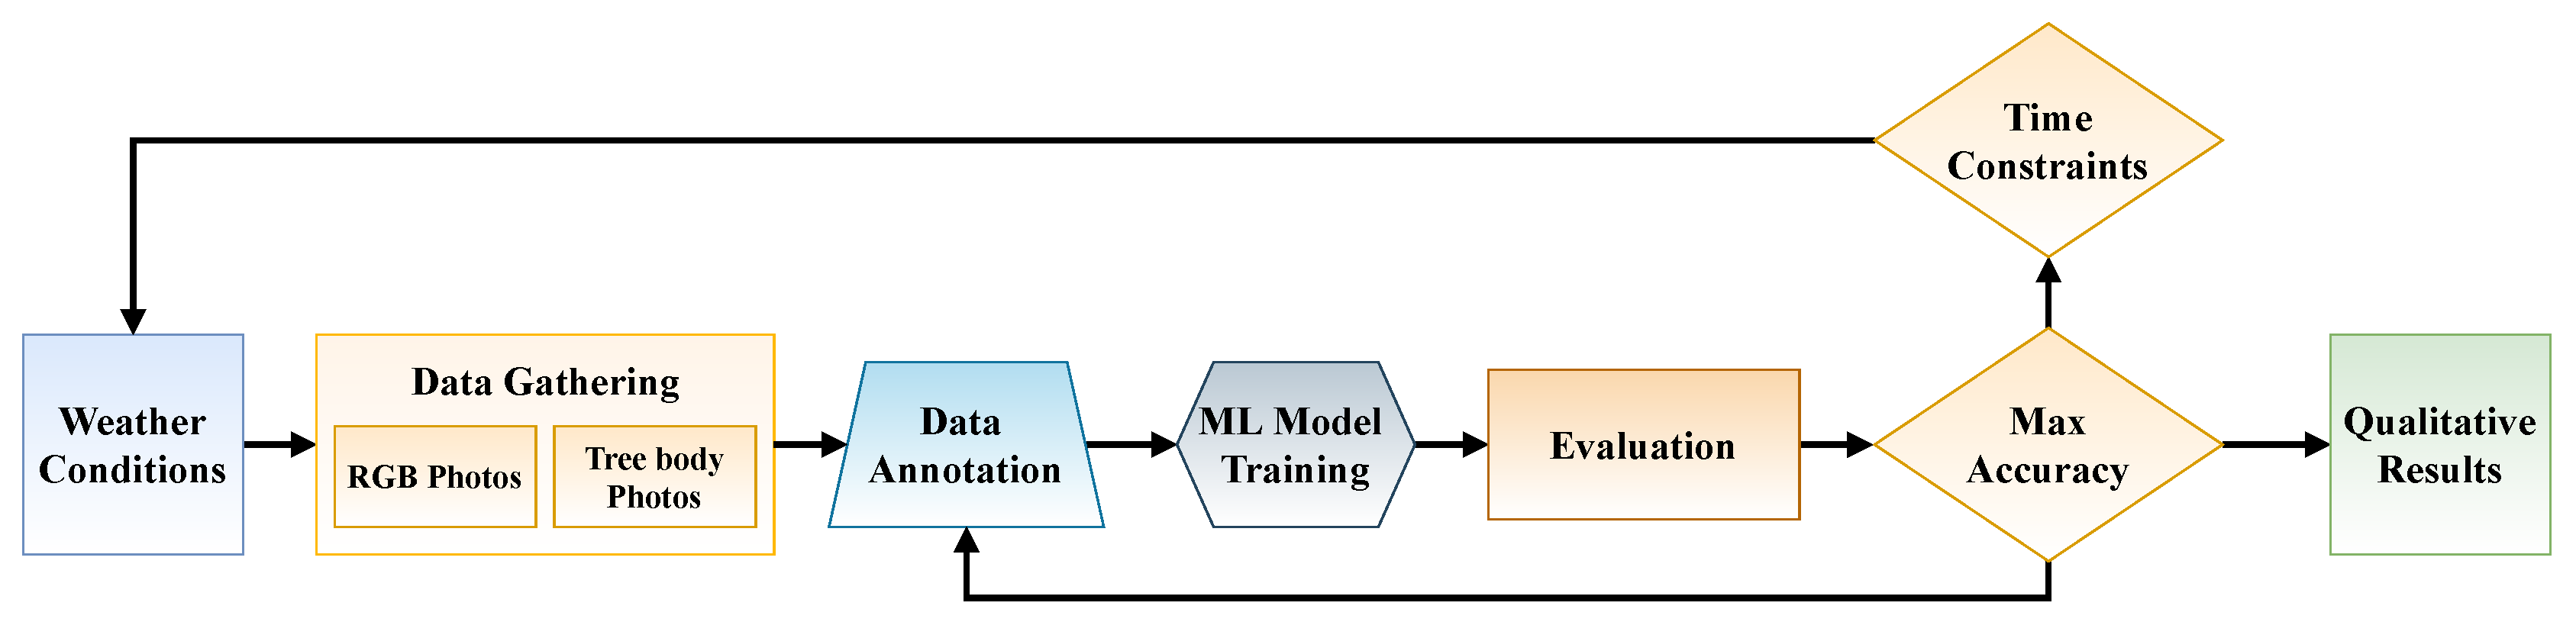
2. Materials and Methods

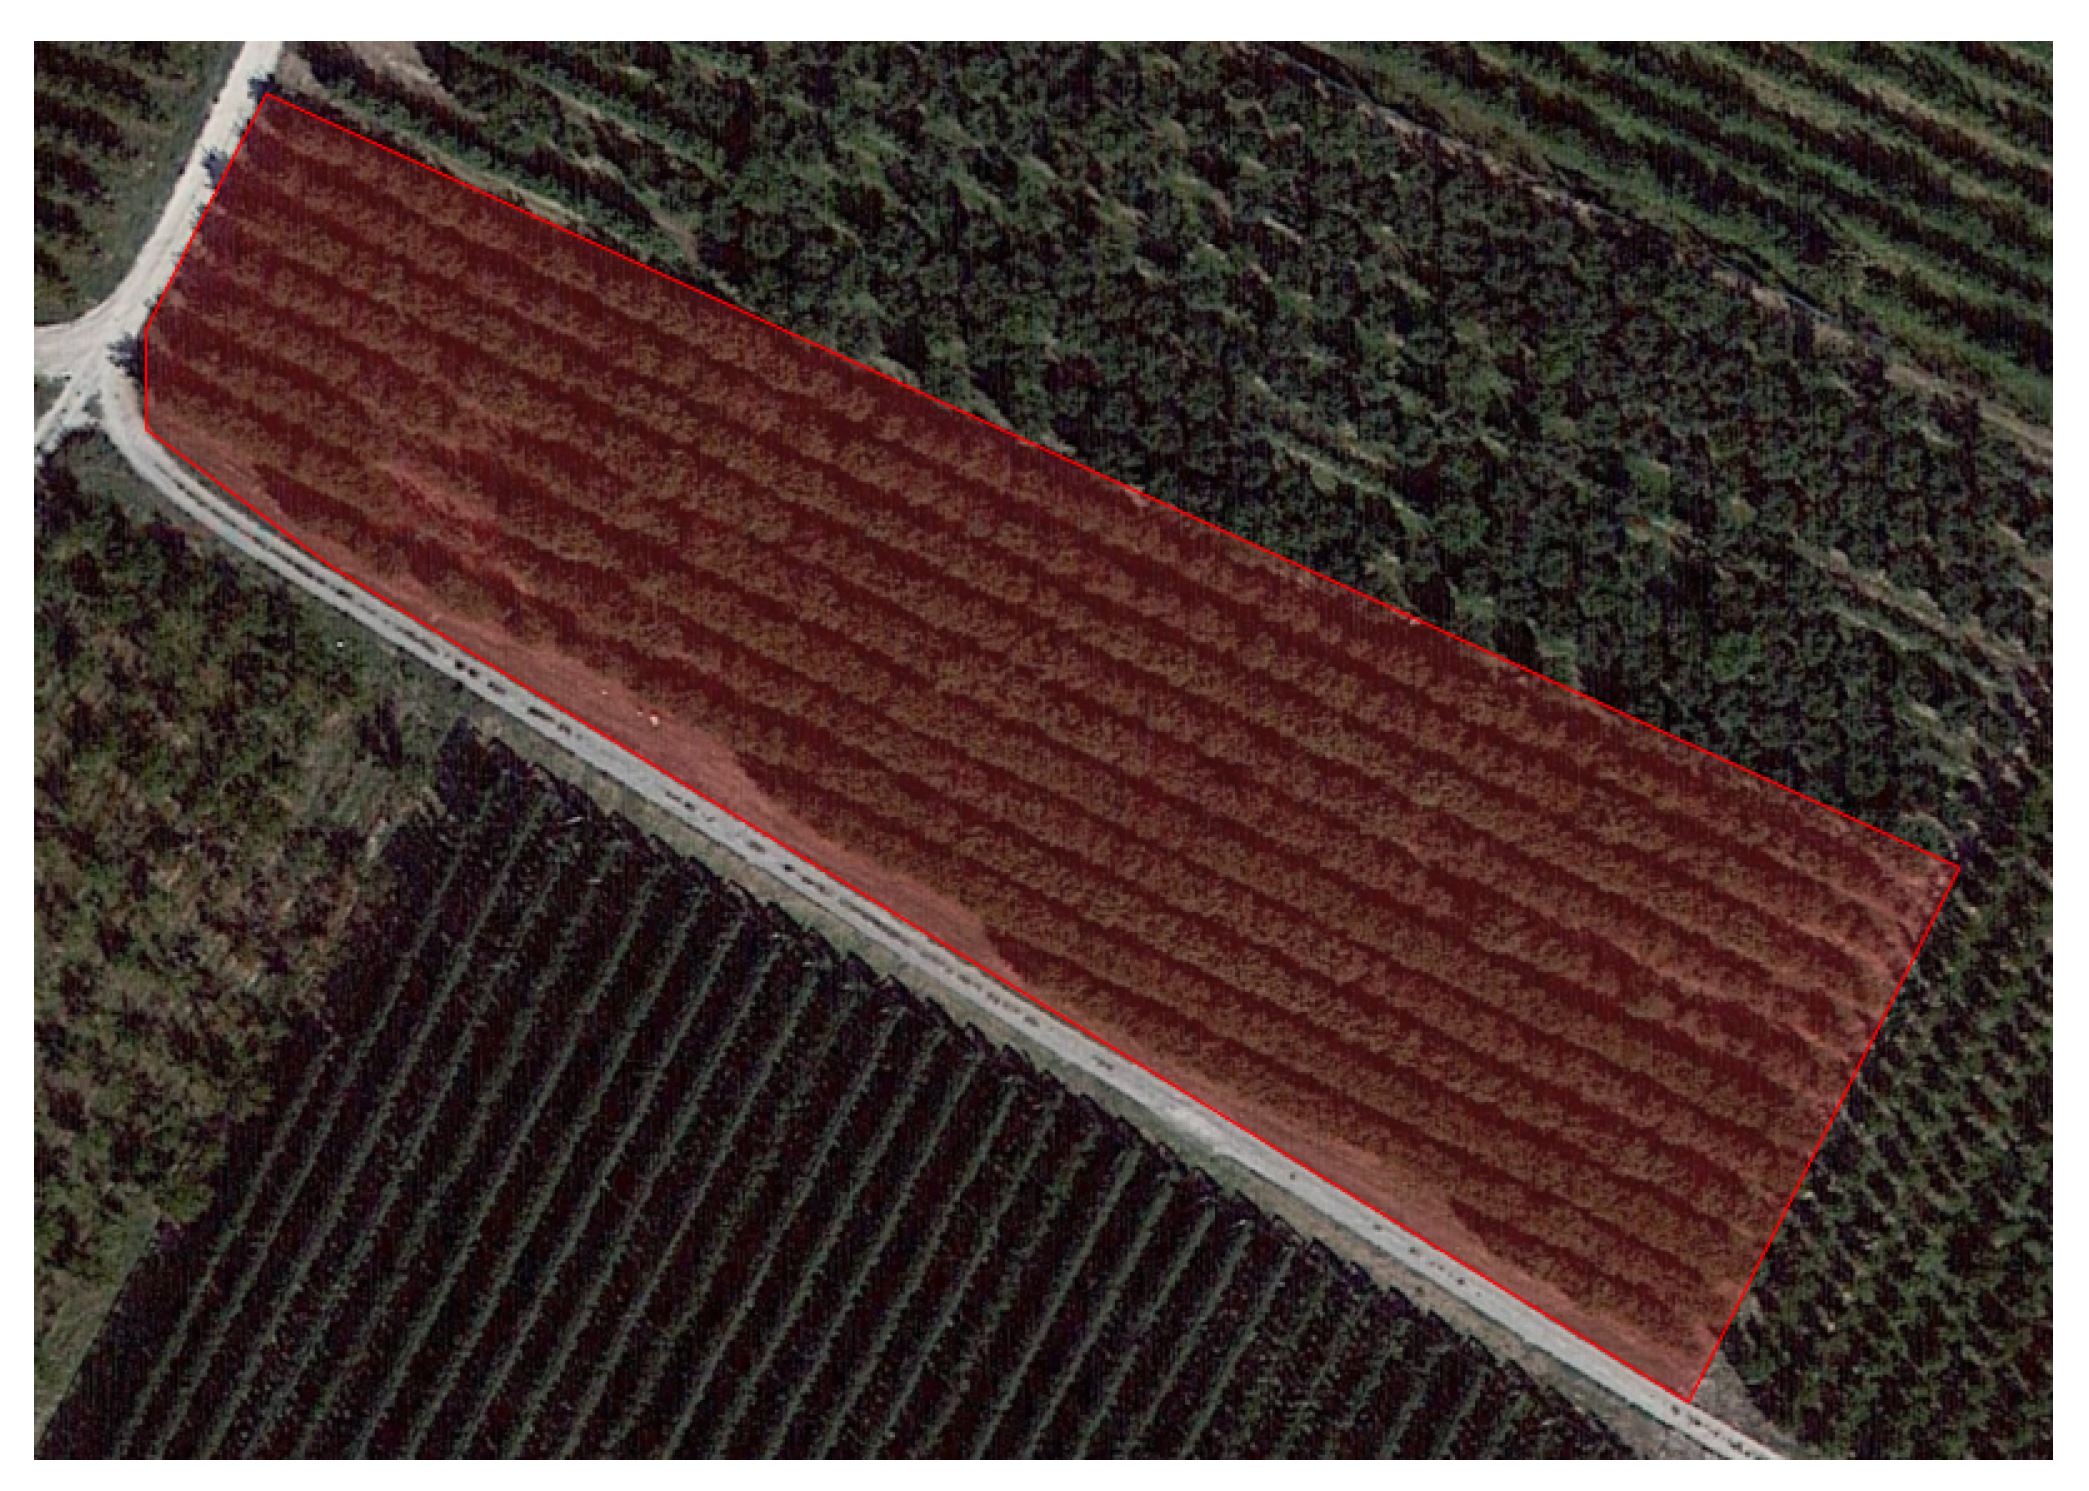
2.1. Data Acquisition

The ERICA, containing a plethora of sweet cherry trees’ specimens in various stages of the disease. The aim of this dataset is to facilitate the training cycle of ML and DL methods on recognizing these various stages. Purposefully, this dataset includes possible points of interest such as healthy leaves, infected or stressed leaves, healthy branches, infected or stressed branches, and symptoms of the disease on tree trunks. The main feature of the ERICA Dataset is to capture and organize samples of benign and infected sweet cherry trees.
To obtain the samples from the trees there is the need to follow a strict process. Firstly, the experts evaluate the weather condition for the day on which the data will be obtained. Consequently, each sweet cherry tree in the field is classified by row and column. Furthermore, a team of experts and researchers utilize various types of equipment to photograph the perennial fruit trees in ascending order. The equipment consists of cameras with high resolution, such as mobile devices and mirrorless cameras. The ERICA dataset has images with the total view (body) of the tree plus its individual infected/stressed leaves. Each object inside an image must be classified. The objects can be classified into two classes (infected leaf or infected branches). This process is generally known as an annotation. The labeling of objects can be implemented in online platforms or softwares. The outcome of annotation is exported in various types of files. This work used txt files with Yolov5 format. Yolov5 uses four coordinates (corners of the box), which include the object and the identification number of the class, which belongs. The data were normalized with GaussianBlur, to alleviate possible noise and outlets in the samples. Since the images containing the holistic tree body view contain high-resolution pictures and for the sake of computational reserve, the images were further resized to 640 × 640 pixels and inputted to the network.This process is repeated for each field every month as shown in the pipeline, Figure 3. Inside this dataset can be found one primary disease, which is called Armillaria.
It is noteworthy that the geographic location of data collection in the ERICA dataset is in Greece and more specifically in Western Macedonia. The location of the study has a latitude “40.81007636843986” and longitude “21.800632900335405”. These coordinates were acquired from google maps which use World Geodetic System (WGS) 84 format. The Figure 4 shows the Keyhole Markup Language (KML) file, which presents the test area.
Figure 5 presents the distribution of labels in the ERICA dataset. The labels are separated into two classes, which are infected leaves and Infected branches. The infected leaves in training are approximately two times more than branches. This ratio is logical because these include infected leaves. Although this ratio is unbalanced, it is beneficial for the training, because infected leaves are more challenging to be detected. In summary, the ERICA dataset consists of:
  • 1086 images of 1872 × 4160 and mixed image pixel resolutions (regular cameras).
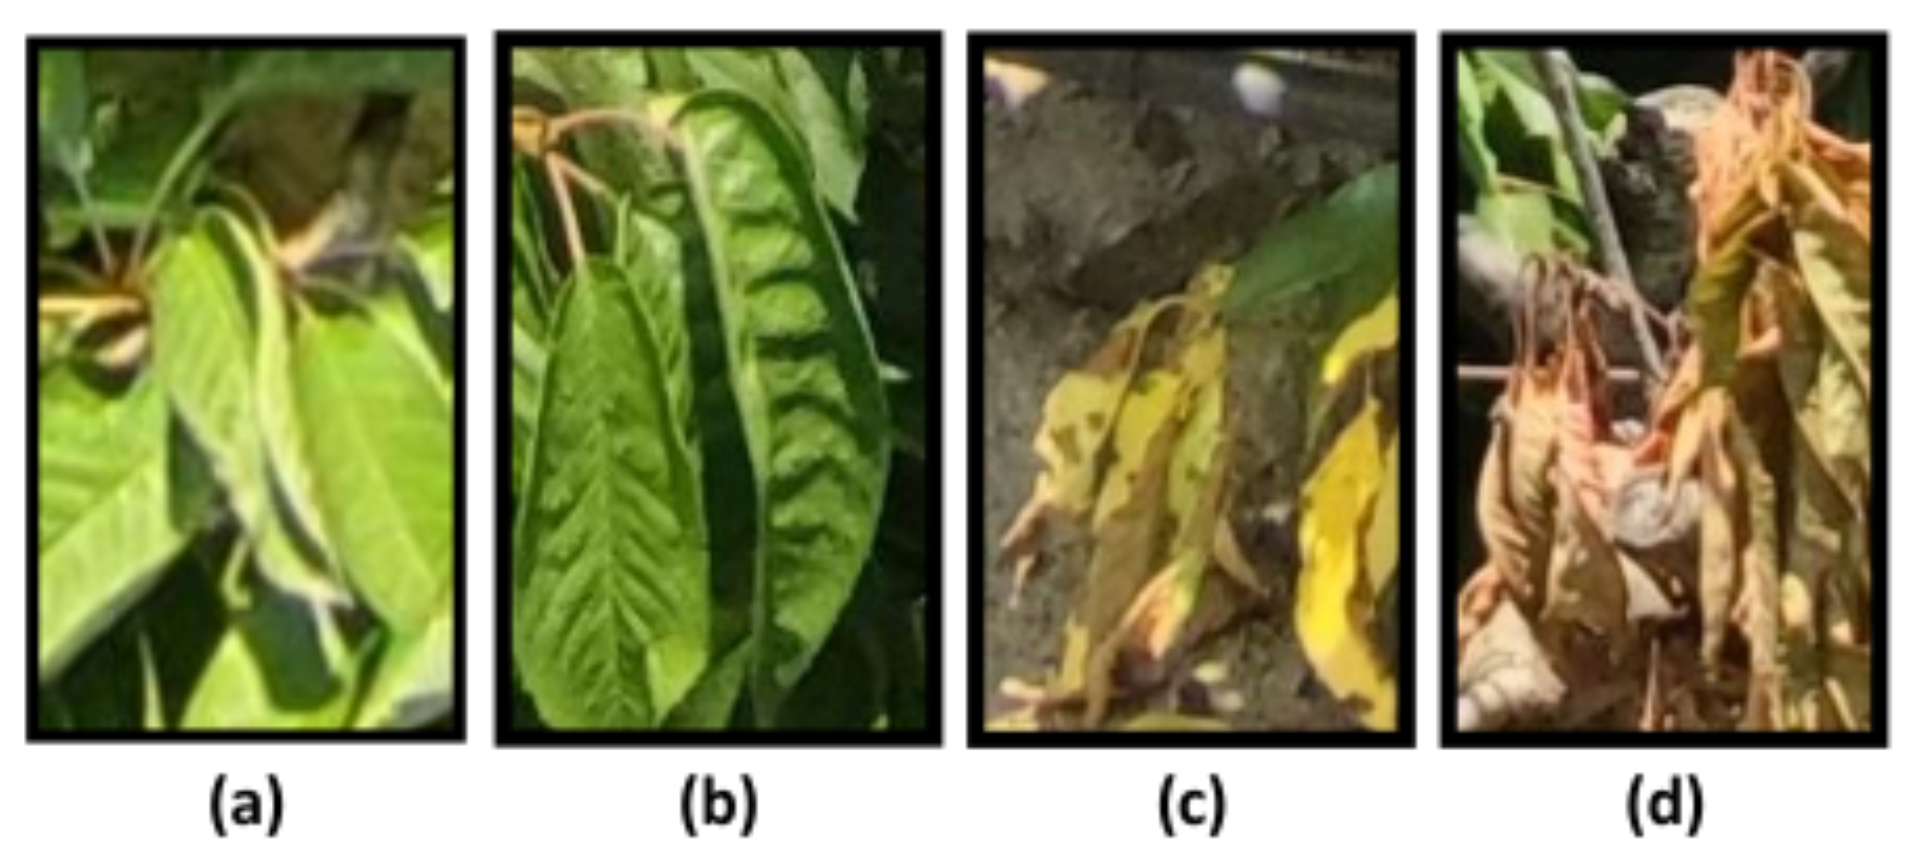
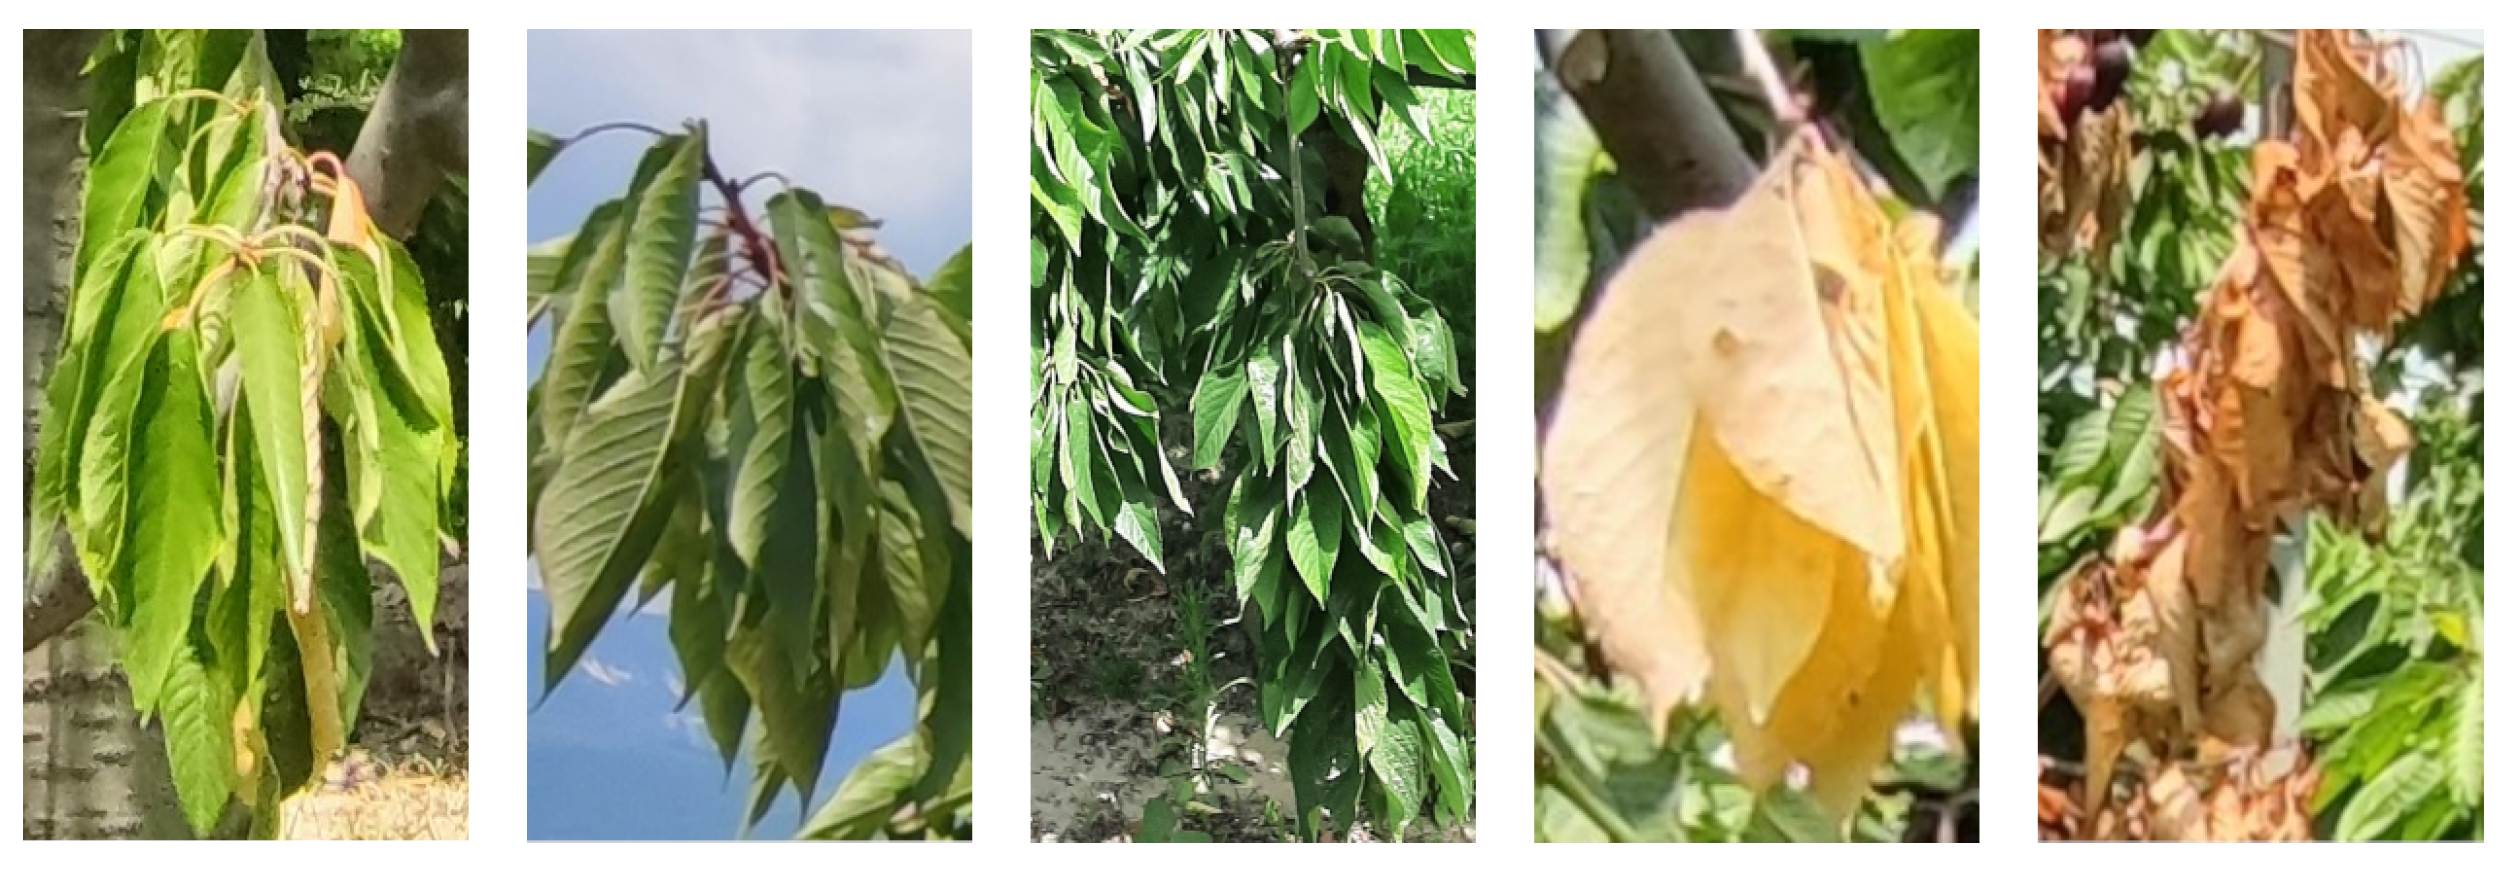
  • Two classes of points interest on cherries trees.
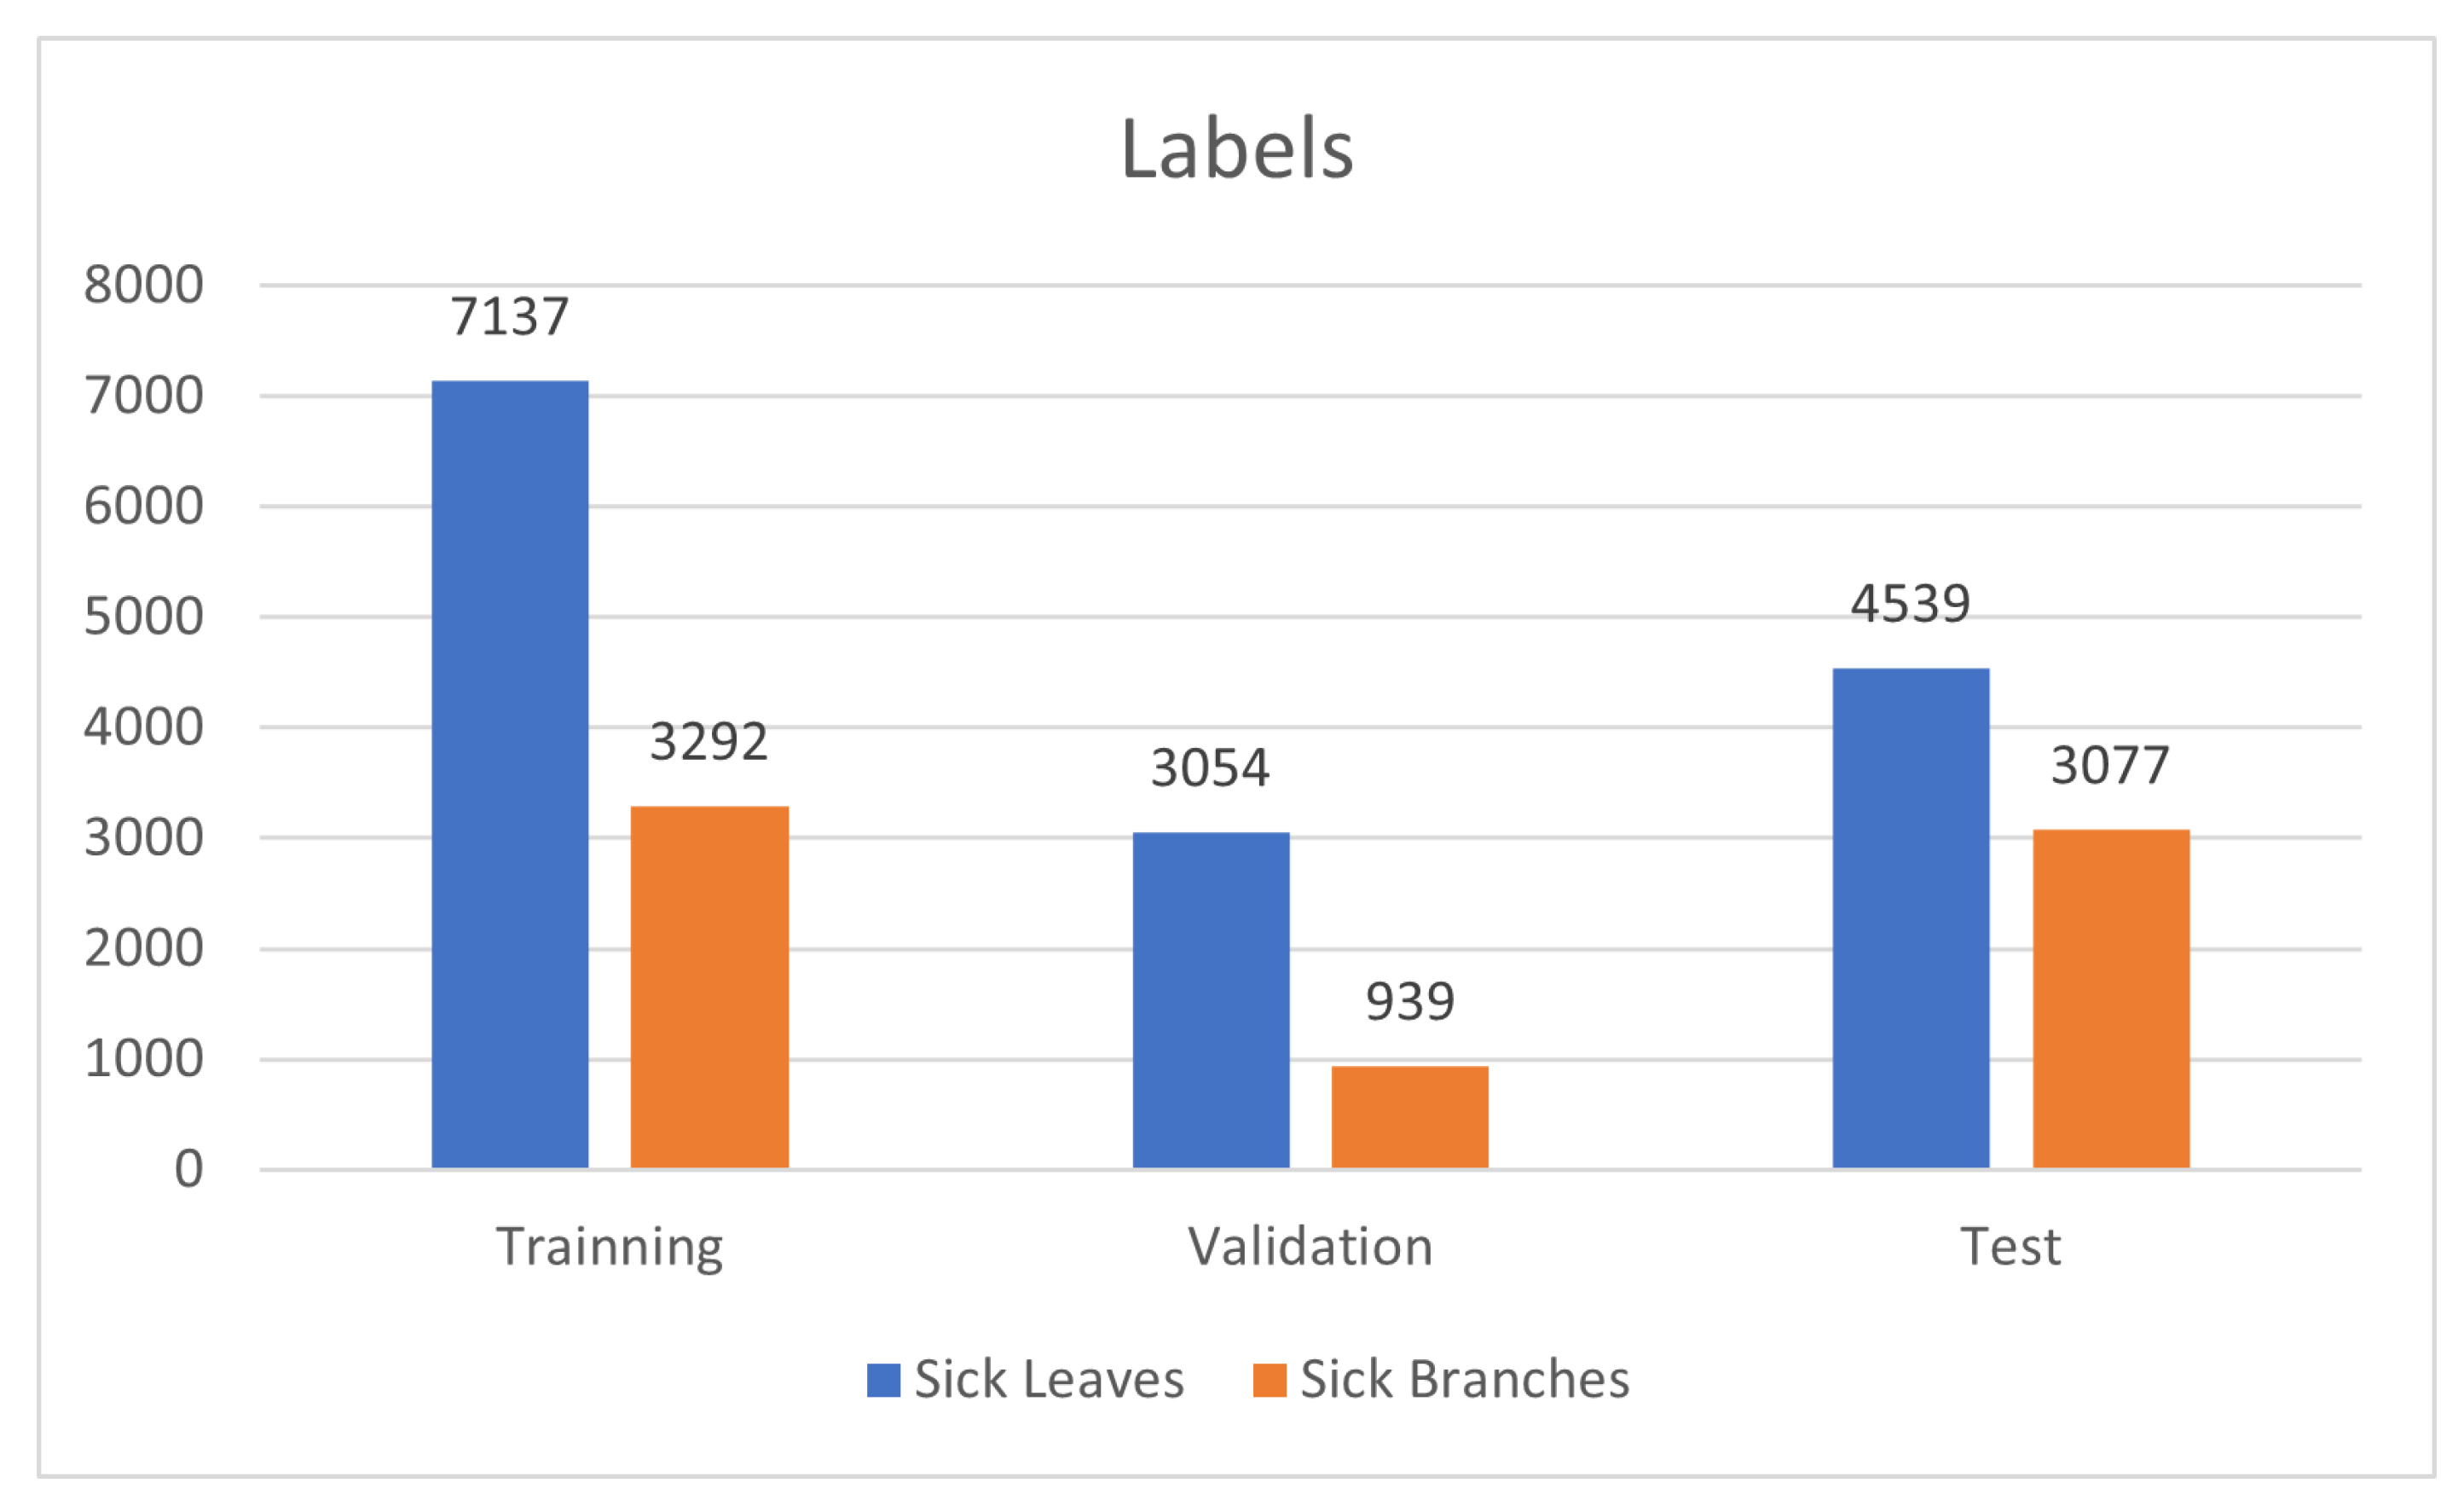
  • Infected leaves class has 11,676 labels and infected branches 6369.
  • The images were captured at a specific time during the day (midday).
  • Manually annotation until reaching high accuracy and then contributing as assistance to the rest of the annotation.
  • Ideal weather conditions (cloudless).
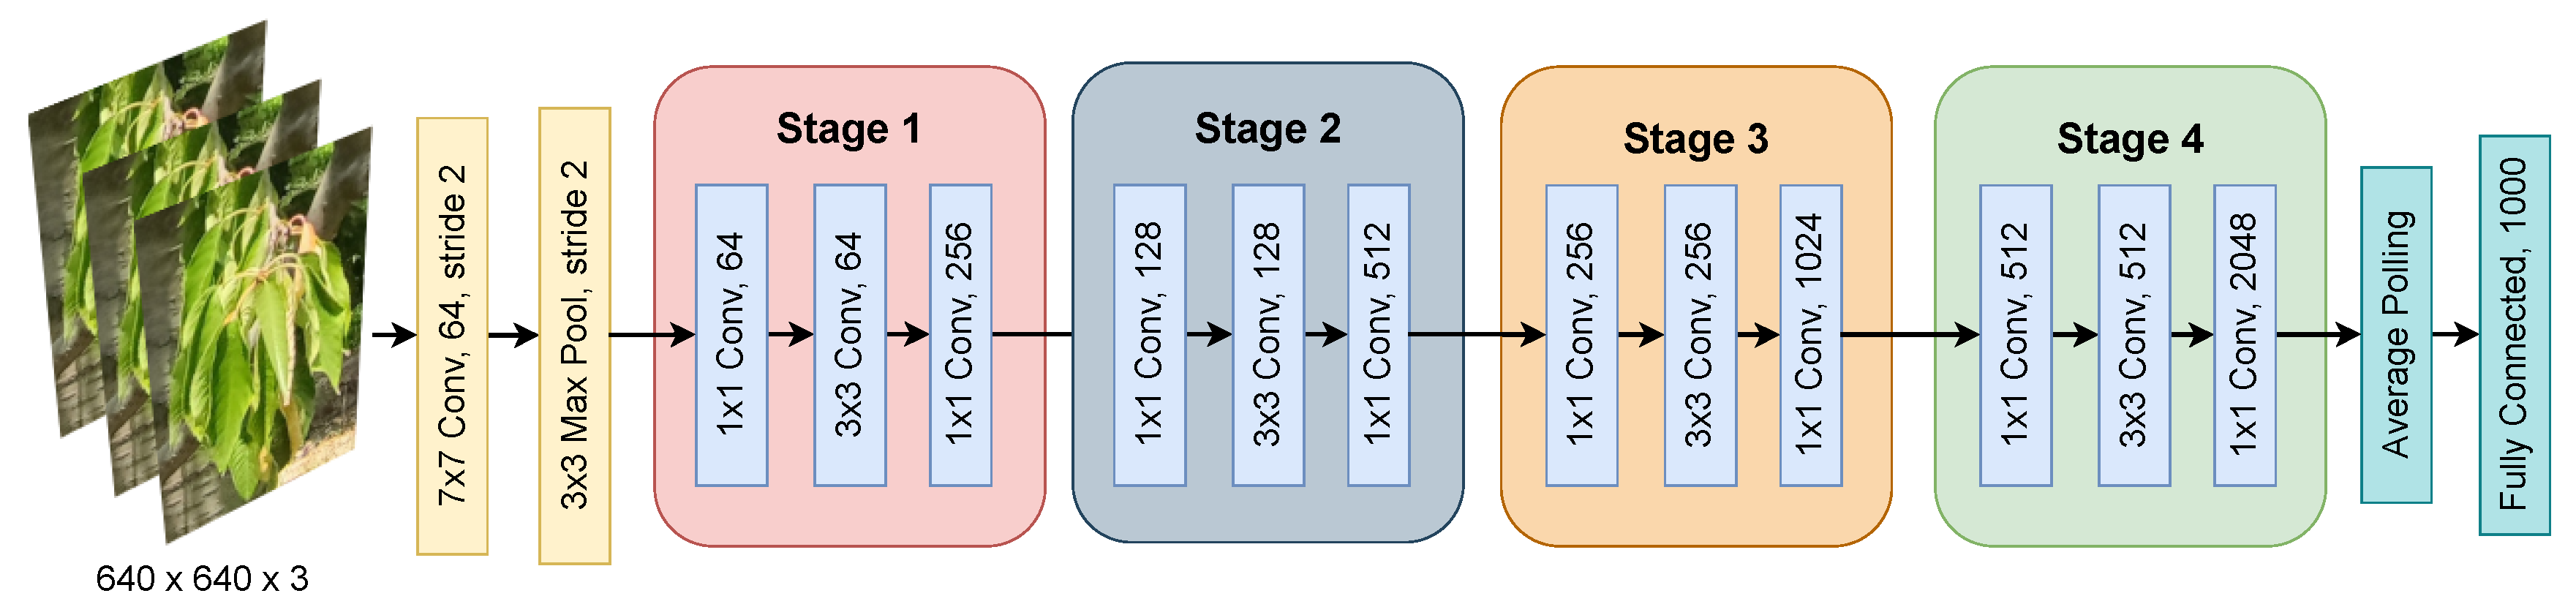
2.2. ResNet 50

This works relies heavily on the ResNet-50 [24,25] architecture, which defines a deep residual network. The number after dash indicates how many layers the model consists of. Thus the ResNet-50 has 50 layers. A model constructed under the ResNet-50 architecture incorporates four stages each containing a convolution and an Identity block. For the sake of explanation, we will consider the input size as 640 × 640 × 3. Each convolution block and identity block have three convolution layers. The size of kernels used to perform the convolution operation in all three layers of the block of stage 1 are 64, 64, and 256. Afterward, Stage 1 of the network starts and it has 3 more stages containing 3 layers each. As we progress from one stage to another, the channel width becomes double, and the size of the input has shrunk to half. Finally, the network has an Average Pooling layer followed by a fully connected layer having 1000 neurons. The 3 × 3 layer is left as a bottleneck with smaller input/output dimensions.
Every ResNet architecture performs the initial convolution and max-pooling using 7 × 7 and 3 × 3 kernel sizes. It is noteworthy that, ResNet-50 has a large number of trainable parameters, which are over 23 million. Furthermore, this model is often utilized for image classification. The novelty which makes ResNet a robust and highly usable architecture is its innate skip connection property, which without adjustments, assists the deep networks to overcome the vanishing gradient problem. The Figure 6 shows the Resnet-50 architecture.

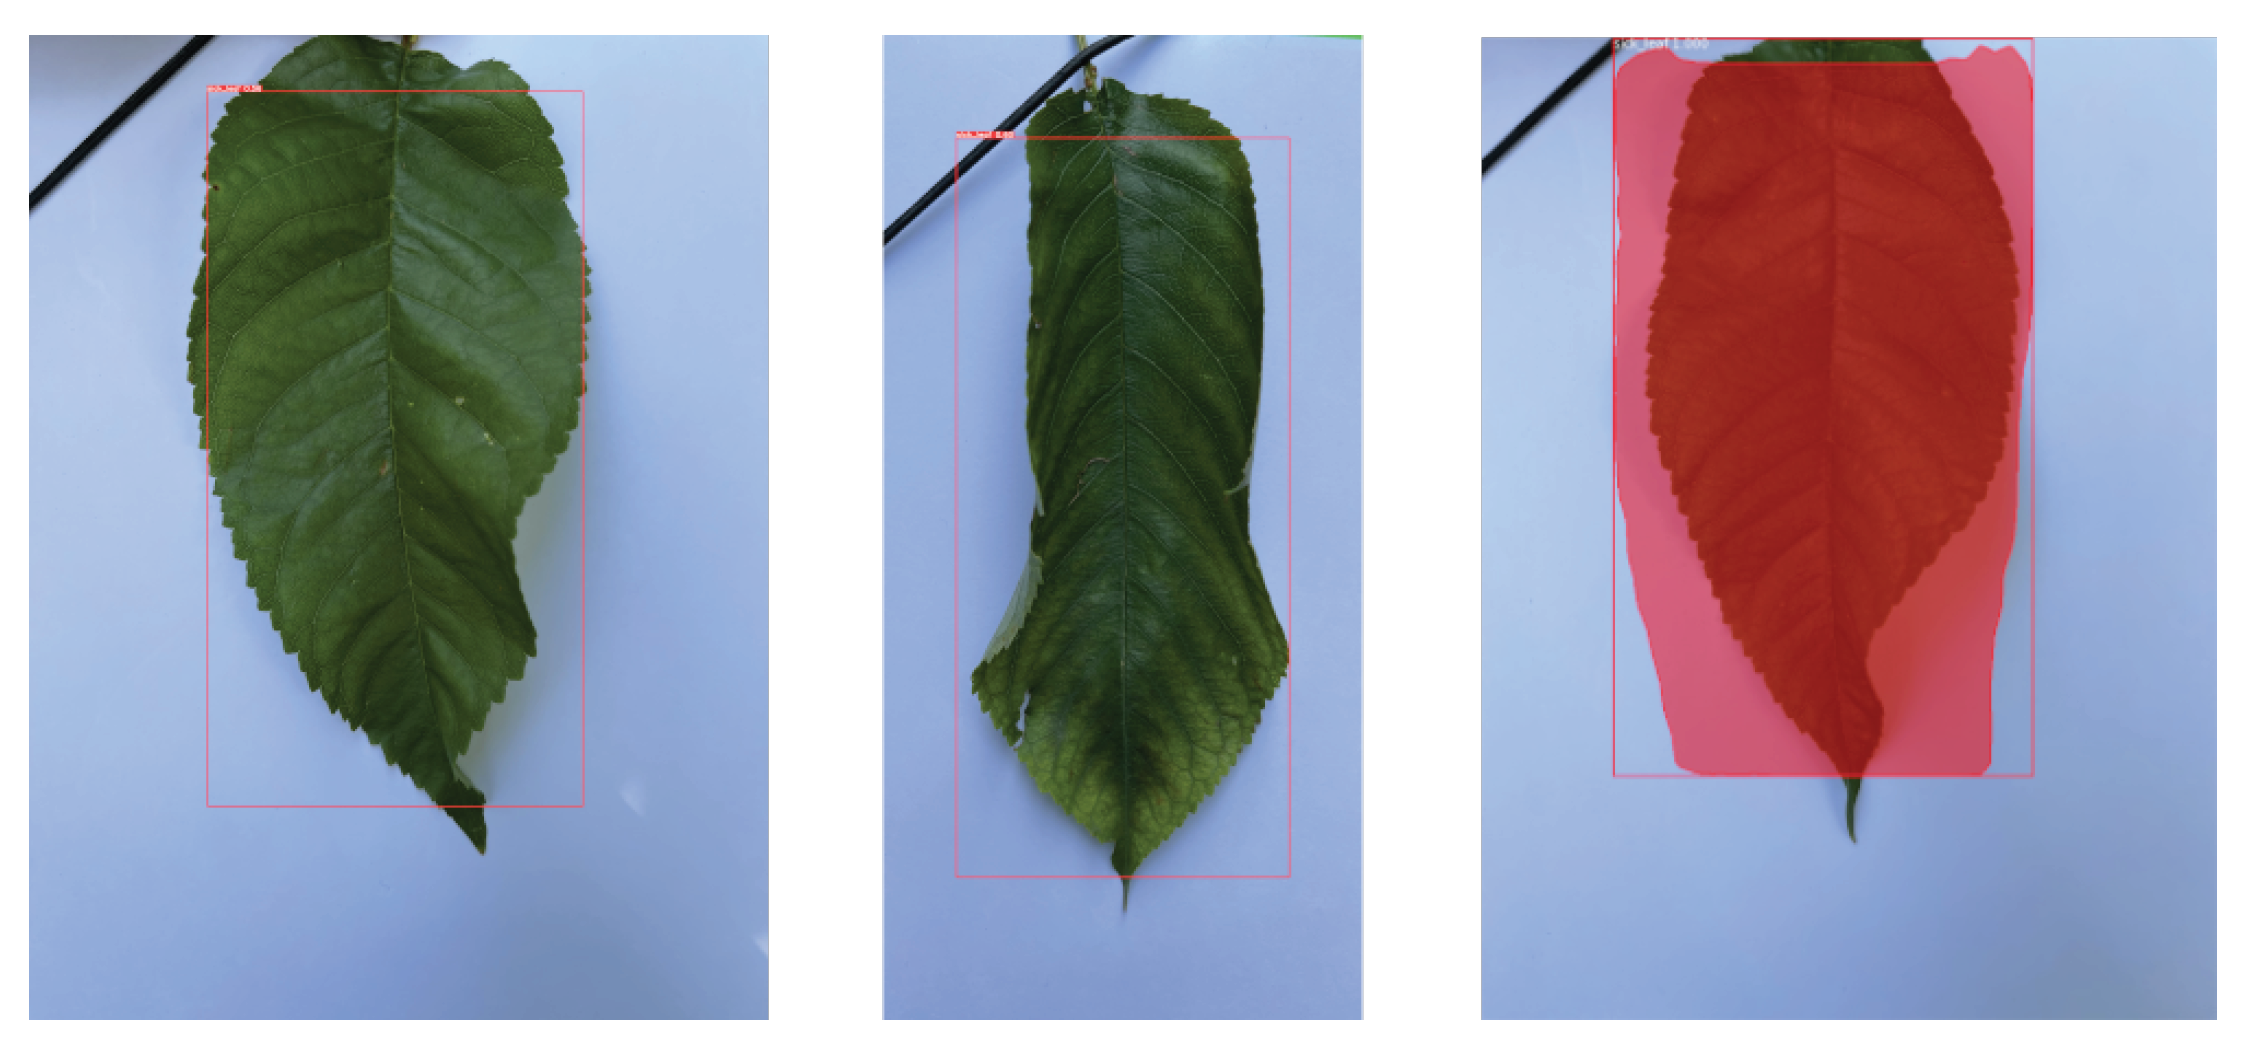
2.3. Infected Leaf and Infected Branch Recognition

The first step for detecting infected leaves and infected branches is to leverage the Region Proposal Network (RPN). The algorithm runs a lightweight binary classifier on boxes (anchors) over the image and returns object/no-object scores. It is noteworthy that, anchors with a high object detection score (positive anchors) are passed to stage two to be classified. It is usual, that positive anchors don’t cover the point of interest sufficiently. So the RPN also regresses a refinement to be applied to the anchors to shift it and resize it a bit to the correct boundaries of the object, which is challenging and is not very successful. For the generation of the detection targets, first, a grid must be created containing anchors that cover the full image. Subsequently, the Intersection over Union (IoU) [26] is used which is a crucial metric used in object detection evaluations. The term IoU defines the overlap between the ground truth and prediction box as shown in Equation (1).
I o U = area of overlap are of unit = a r e a ( g t p d ) a r e a ( g t p d )
here g t denotes the ground truth annotation and p d describes the prediction box in the image. The next step includes the computation of the IoU for each anchor compared with the ground truth points of interest. Each anchor has IoU over 0.7 with any ground truth point of interest, and negative anchors are those that don’t cover any object by more than 0.3 IoU. Anchors in between are considered neutral and excluded from detection. The following step is to filter all the predictions before the visualization. Each prediction box has a lower IoU than the IoU threshold and confidence than the confidence Threshold, in that case, the predicted box is considered unqualified. For better results, it was used the algorithm Non-maximum Suppression [27]. This algorithm contributes to filtering each predicted box for the same point of interest into a single box. The algorithms achieve that by knowing only the box located inside the image and its score. The final step of the process is the generation of masks for each predicted box. Then, the trained models were evaluated by detecting leaves in the test dataset and extracting metrics. Finally, in order to gain better results, the process is repeated until the extracted metrics show saturation. As a result, the final model has an optimal accuracy, which could be reached with the ERICA dataset.
This paper utilized six of yolov5 models, which are (i) yolov5s, (ii) yolov5m, (iii) yolov5l, (iv) yolov5s6, (v) yolov5m6, and (vi) yolov5l6. The evaluation for the trained models uses three different qualitative metrics to find the optimal configuration of the network. The metrics are (a) Precision, (b) Recall, and (c) mAP (Mean Average Precision). Precision refers to the ability of the model to distinguish between all detection, which point of interest is classified in each class. The recall is slightly different from the precision and the only change that distinguishes between all ground truths. AP (Average Precision) is calculated individually for each class and then aggregates them. These AP values are aggregated into one value to obtain the metric mAP (mean Average Precision). In other words, mean Average Precision (mAP) is the average from AP values over all classes. To accurately train the CNN to be able to classify objects inside in images, numerous hyperparameters demand to be modified. These hyperparameters will influence the performance of the trained model and the time to convergence. One of the primary hyperparameters that this paper focuses on is batch size [28,29]. The batch size is the number of images utilized in each epoch during the training of the model. It is noteworthy that different values of batch sizes bring severe changes to metrics values. Furthermore, a high value of batch size is increasing the time of training and the results are not always better than lower values of batch size. Testing our models in batch size limits, would not have centrally better results [30]. For this reason, this paper used small batch sizes values, which are between two and sixteen (2, 4, 8, and 16). This paper, in order to evaluate the Resnet decently, decided to be trained, 24 models.

3. Results and Discussion

3.1. Data Preparation

To successfully train a high accuracy model, the data need preparation. Every image can contain hardened objects, which must be annotated into classes. In this work, the data is separated into two classes, which are infected leaves and branches. This annotation was implemented in an online platform (https://www.makesense.ai/, accessed on 12 December 2021). After the annotation, the labels are exported in txt files with Yolov5 format. The data were normalized with GaussianBlur, in order to alleviate possible noise and outlets in the samples. Since the images containing the holistic tree body view contain high-resolution pictures and for the sake of computational reserve, the images were further resized to 640 × 640 pixels and inputted to the network. The data disunite into Training, Validation, and Test set and divided into batches. The batches have then participated in the training procedure of the model. The purpose of the previous separation aims to succeed the best performance and evaluation of the trained model. More specifically, the data for training utilize for the fed of the model. The validation assists the model during training to execute a self-evaluation and implement self-adjusting. Moreover, the test dataset consists of unrevealed data to the trained model, the primary reason for this is to perform an objective evaluation.

3.2. Infected Tree Detection Evaluation

In order to train the detection model, a mid-to-high end testbed was employed. Specifically, the testbed consisted of a Linux Workstation running Ubuntu 20.04, and consisting of an Intel Core i7, 64 Gb of memory, and an NVIDIA RTX 3080 GPU/10Gb GPU memory. To comparatively produce the best detection model, different instances of the Resnet architecture were utilized. To this end, the Yolov5 framework was deployed and used for the purpose of the model training. In particular, 24 experiments were performed evaluating the different Resnet instances as can be seen in Table 1.
The network can readily predict the infected or stressed leaves. An example of the predicted infected leaves can be seen in Figure 7. The Yolov5 platform, which contains a set of ResNet models, was utilized to realize the experiments [31]. In Table 1 all models trained at 25 epochs and with the full dataset, which is 1086 images. The results of Table 1 show that the best-trained model is yolov5m. In general, all models with batch size value 16 have the lowest recall values, which can be justified by the fact that during the training a large number of images are processed in every epoch. The low recall values mean that the algorithm has identified a small number of ground truths. For this reason, the algorithm can identify and classify more easily the object between classes. Thus, these models have high values at mean Average Precision and Precision metrics. It is noteworthy that, is equally significant that the model’s ability to identify every ground truth and to classify it correctly. However, if precision has a high value, it will assist with the creation of a threshold to identify the symptoms of a disease. Moreover, in Table 1 are two primary categories of models, which are yolov5x (x = s, m, and l) and yolov5x6. The first category during the evaluation procedure is detecting images of 640 × 640 and the second with 1280 × 1280 pixels. Also, in the training state, these categories follow the exact dimension of images. At the 25 epoch of training, it is logical that the second category of the model does not reach convergence yet. During the training, the model needs to process and learn more information about the details of each object. For this exact reason, this category needs more epochs to reach saturation of her metrics.
The yolov5m, a pre-trained instance of a ResNet50 model, which was found to have the optimal configuration, showed a declining recall score. The low value of this metric means that the algorithm can not find all ground truths in each image, or in other words, all infected leaves and branches. However, this model has 86.1 % efficiency in selecting the correct class of each object. A proper solution to this is to raise dataset size and include more variety in images. For example, several images contain only infected leaves or even infected branches in different light exposures.

3.3. Ablation

This Section presents the ablation of hyperparameter k, denoting the number of epochs, on which the yolov5m Resnet model is seen as the training iterations are increased. The best model based on metrics was yolov5m with batch size 16, which tested in a different number of epochs as shown in the following table. Table 2 presents the qualitative results of the model as the k parameter cascades.
Notably, as can be seen from the results, the network saturates over larger iteration using this dataset. Of course, this is expected since ResNet is a very Deep Network, meaning that it converges faster using a small amount of data. A possible solution is either collecting or augmenting more samples and feeding them to the Network. Furthermore, a reliable solution to increase the metrics of the model is during the detection phase to use computer vision techniques. Such as, crop each image into a grid and then detecting objects in every cell of the grid. However, this technique has many disadvantages. The most negative is the separation of an object at half or even other percentages between two or more cells.
Furthermore, this study utilizes the default hyperparameters of the Yolov5 algorithm. In order to justify the selection of default parameters, two more schemes (combinations of hyperparameters) were trained and evaluated on yolov5m with batch size 16, which held the highest scores compared to the other models. These various schemes with their hyperparameters values are shown in Table 3. First of all, the “lr0” hyperparameter refers to the initial learning rate of training, and the “lrf” hyperparameter is the final learning rate during the training process. “Momentum” is the size of the step in each epoch of the algorithm to learn the problem. Notably, in complex problems momentum should have a small value, in order not to lose the direction of learning the problem. Furthermore, the “weight decay” hyperparameter is utilized as a penalty strategy. Finally, “warmup epochs” and “warmup momentum” hyperparameters are used with a low learning rate, in order to achieve low errors at the beginning of the training.
Notably, as can be seen from the outcome in Table 4 the “Scheme one” has the best metrics in comparison to the other two, as result, this study recommends default hyperparameters of Yolov5.

4. Conclusions

In the modern applications of the primary sector and significantly in precision agriculture, DL-oriented solutions have become significant pillars in product quality assurance. In particular, in health reservation and subsequently disease detection of crops, DL produces robust solutions. The ERICA dataset includes images of entire sweet cherries trees and single leaves, which will give better recognition results on the unbalanced data set. Eventually, 29 machine learning models have trained, which have produced enlightenment results. More specifically, 24 models have trained with various parameters, and the best model has trained again with a different number of epochs. Based on the experimental results, the model with the highest accuracy was the yolov5m with batch size 16 at 25 epochs and 86.1 % precision. Regarding future work, the classes of this paper could be increased referring to other points of interest or even different plant diseases and stress responses. It is noteworthy that, the ERICA dataset can be utilized for the identification of healthy leaves, healthy branches, and healthy trunks not only in sweet cherry trees but in other perennial species as well.

Author Contributions

Conceptualization, C.C., C.K., E.G.M. and E.K.; Methodology, C.C., C.K., E.G.M. and E.K.; Software, C.C.; Validation, C.K., E.G.M. and E.K.; Formal Analysis, C.C.; Investigation, C.C., C.K., E.G.M. and E.K.; Resources, E.G.M. and E.K.; Data Curation, C.C., C.K., E.G.M. and E.K.; Writing—Original Draft Preparation, C.C.; Writing—Review & Editing, C.C., C.K., E.G.M. and E.K.; Visualization, C.C.; Supervision, P.G.S.; Project Administration, P.G.S.; Funding Acquisition, P.G.S. All authors have read and agreed to the published version of the manuscript.

Funding

This research received no external funding.

Informed Consent Statement

Not applicable.

Data Availability Statement

The data presented in this study are available on request from the corresponding author. The data are not publicly available due to restrictions privacy.

Acknowledgments

This research was co-funded by the European Union and Greek national funds through the Operational Program Competitiveness, Entrepreneurship, and Innovation, grant number T1EDK-04759.

Conflicts of Interest

The authors declare no conflict of interest.

References

  1. Moysiadis, V.; Sarigiannidis, P.; Vitsas, V.; Khelifi, A. Smart Farming in Europe. Comput. Sci. Rev. 2021, 39, l100345. [Google Scholar] [CrossRef]
  2. Radoglou-Grammatikis, P.; Sarigiannidis, P.; Lagkas, T.; Moscholios, I. A compilation of UAV applications for precision agriculture. Comput. Netw. 2020, 172, 107148. [Google Scholar] [CrossRef]
  3. Amatya, S.; Karkee, M.; Zhang, Q.; Whiting, M.D. Automated Detection of Branch Shaking Locations for Robotic Cherry Harvesting Using Machine Vision. Robotics 2017, 6, 31. [Google Scholar] [CrossRef] [Green Version]
  4. Kashyap, P.K.; Kumar, S.; Jaiswal, A.; Prasad, M.; Gandomi, A.H. Towards Precision Agriculture: IoT-Enabled Intelligent Irrigation Systems Using Deep Learning Neural Network. IEEE Sens. J. 2021, 21, 17479–17491. [Google Scholar] [CrossRef]
  5. Anand, T.; Sinha, S.; Mandal, M.; Chamola, V.; Yu, F.R. AgriSegNet: Deep Aerial Semantic Segmentation Framework for IoT-Assisted Precision Agriculture. IEEE Sens. J. 2021, 21, 17581–17590. [Google Scholar] [CrossRef]
  6. Siniosoglou, I.; Argyriou, V.; Bibi, S.; Lagkas, T.; Sarigiannidis, P. Unsupervised Ethical Equity Evaluation of Adversarial Federated Networks. In Proceedings of the 16th International Conference on Availability, Reliability and Security, Vienna, Austria, 17–20 August 2021; Association for Computing Machinery: New York, NY, USA, 2021. [Google Scholar] [CrossRef]
  7. Lakshmi, V.; Corbett, J. How Artificial Intelligence Improves Agricultural Productivity and Sustainability: A Global Thematic Analysis. 2020. Available online: https://scholarspace.manoa.hawaii.edu/handle/10125/64381 (accessed on 12 December 2021). [CrossRef] [Green Version]
  8. Devkota, P.; Iezzoni, A.; Gasic, K.; Reighard, G.; Hammerschmidt, R. Evaluation of the susceptibility of Prunus rootstock genotypes to Armillaria and Desarmillaria species. Eur. J. Plant Pathol. 2020, 158, 177–193. [Google Scholar] [CrossRef]
  9. Triantafyllou, A.; Sarigiannidis, P.; Bibi, S. Precision Agriculture: A Remote Sensing Monitoring System Architecture. Information 2019, 10, 348. [Google Scholar] [CrossRef] [Green Version]
  10. Nguyen, H.T.; Lopez Caceres, M.L.; Moritake, K.; Kentsch, S.; Shu, H.; Diez, Y. Individual Sick Fir Tree (Abies mariesii) Identification in Insect Infested Forests by Means of UAV Images and Deep Learning. Remote Sens. 2021, 13, 260. [Google Scholar] [CrossRef]
  11. O’Shea, K.; Nash, R. An Introduction to Convolutional Neural Networks. arXiv 2015, arXiv:1511.08458. [Google Scholar]
  12. Deng, X.; Tong, Z.; Lan, Y.; Huang, Z. Detection and Location of Dead Trees with Pine Wilt Disease Based on Deep Learning and UAV Remote Sensing. AgriEngineering 2020, 2, 294–307. [Google Scholar] [CrossRef]
  13. Sri, M.; Naik, B.; Sankar, K. Object Detection Based on Faster R-Cnn. Int. J. Eng. Adv. Technol. 2021, 10, 72–76. [Google Scholar] [CrossRef]
  14. Zhu, H.; Yang, L.; Fei, J.; Zhao, L.; Han, Z. Recognition of carrot appearance quality based on deep feature and support vector machine. Comput. Electron. Agric. 2021, 186, 106185. [Google Scholar] [CrossRef]
  15. Mkonyi, L.; Rubanga, D.; Richard, M.; Zekeya, N.; Sawahiko, S.; Maiseli, B.; Machuve, D. Early identification of Tuta absoluta in tomato plants using deep learning. Sci. Afr. 2020, 10, e00590. [Google Scholar] [CrossRef]
  16. Mohanty, S.P.; Hughes, D.P.; Salathé, M. Using Deep Learning for Image-Based Plant Disease Detection. Front. Plant Sci. 2016, 7, 1419. [Google Scholar] [CrossRef] [PubMed] [Green Version]
  17. Hughes, D.P.; Salathe, M. An open access repository of images on plant health to enable the development of mobile disease diagnostics. arXiv 2016, arXiv:1511.08060. [Google Scholar]
  18. Matin, M.M.H.; Khatun, A.; Moazzam, M.; Uddin, M. An Efficient Disease Detection Technique of Rice Leaf Using AlexNet. J. Comput. Commun. 2020, 8, 49–57. [Google Scholar] [CrossRef]
  19. Alguliyev, R.; Imamverdiyev, Y.; Sukhostat, L.; Bayramov, R. Plant disease detection based on a deep model. Soft Comput. 2021, 25, 13229–13242. [Google Scholar] [CrossRef]
  20. Luo, Y.; Zhang, Y.; Sun, X.; Dai, H.; Chen, X. Intelligent Solutions in Chest Abnormality Detection Based on YOLOv5 and ResNet50. J. Healthc. Eng. 2021, 2021, 2267635. [Google Scholar] [CrossRef]
  21. Joshua, J.; Mmbaga, M.T. Perpetuation of Cherry Leaf Spot Disease in Ornamental Cherry. J. Phytopathol. 2015, 163, 194–201. [Google Scholar] [CrossRef]
  22. Devkota, P.; Hammerschmidt, R. The infection process of Armillaria mellea and Armillaria solidipes. Physiol. Mol. Plant Pathol. 2020, 112, 101543. [Google Scholar] [CrossRef]
  23. Crespo Palomo, M.; Lawrence, D.; Nouri, M.; Doll, D.; Trouillas, F. Characterization of Fusarium and Neocosmospora Species Associated With Crown Rot and Stem Canker of Pistachio Rootstocks in California. Plant Dis. 2019, 103, 1931–1939. [Google Scholar] [CrossRef]
  24. He, K.; Zhang, X.; Ren, S.; Sun, J. Deep Residual Learning for Image Recognition. In Proceedings of the IEEE Conference on Computer Vision and Pattern Recognition (CVPR), Las Vegas, NV, USA, 27–30 June 2016. [Google Scholar]
  25. Carvalho, O.L.F.D.; de Carvalho Júnior, O.A.; Albuquerque, A.O.D.; Bem, P.P.D.; Silva, C.R.; Ferreira, P.H.G.; Moura, R.D.S.D.; Gomes, R.A.T.; Guimarães, R.F.; Borges, D.L. Instance Segmentation for Large, Multi-Channel Remote Sensing Imagery Using Mask-RCNN and a Mosaicking Approach. Remote Sens. 2021, 13, 39. [Google Scholar] [CrossRef]
  26. Rezatofighi, H.; Tsoi, N.; Gwak, J.; Sadeghian, A.; Reid, I.; Savarese, S. Generalized Intersection Over Union: A Metric and a Loss for Bounding Box Regression. In Proceedings of the IEEE/CVF Conference on Computer Vision and Pattern Recognition, Long Beach, CA, USA, 16–20 June 2019; pp. 658–666. [Google Scholar] [CrossRef] [Green Version]
  27. Hosang, J.; Benenson, R.; Schiele, B. Learning Non-Maximum Suppression. In Proceedings of the IEEE Conference on Computer Vision and Pattern Recognition, Honolulu, HI, USA, 21–26 July 2017. [Google Scholar]
  28. Ioffe, S.; Szegedy, C. Batch Normalization: Accelerating Deep Network Training by Reducing Internal Covariate Shift. In Proceedings of the 32nd International Conference on Machine Learning, Lille, France, 7–9 July 2015; Bach, F., Blei, D., Eds.; PMLR: Lille, France, 2015; Volume 37, pp. 448–456. [Google Scholar]
  29. Kandel, I.; Castelli, M. The effect of batch size on the generalizability of the convolutional neural networks on a histopathology dataset. ICT Express 2020, 6, 312–315. [Google Scholar] [CrossRef]
  30. You, Y.; Wang, Y.; Zhang, H.; Zhang, Z.; Demmel, J.; Hsieh, C.J. The Limit of the Batch Size. arXiv 2020, arXiv:2006.08517. [Google Scholar]
  31. Yan, B.; Pan, F.; Lei, X.; Liu, Z.; Yang, F. A Real-Time Apple Targets Detection Method for Picking Robot Based on Improved YOLOv5. Remote Sens. 2021, 13, 1619. [Google Scholar] [CrossRef]
Figure 1. Leaf Categories—(a) the symptoms of the disease, (b) deformation from its original shape, (c) color shade and (d) wilting of the foliage.
Drones 06 00003 g001
Figure 2. Samples of Infected branches.
Drones 06 00003 g002
Figure 3. Methodology Pipeline.
Drones 06 00003 g003
Figure 4. Study area in Western Macedonia of Greece.
Drones 06 00003 g004
Figure 5. The distribution of the dataset consists of the training, validation and test dataset.
Drones 06 00003 g005
Figure 6. Resnet-50 architecture.
Drones 06 00003 g006
Figure 7. Predicted Infected Sweet Cherry Tree Leaves.
Drones 06 00003 g007
Table 1. Detection Model Experiments.
ModelBatchPrecisionPixelsRecallmAP
yolov5s20.7640 × 6400.0890.394
40.696640 × 6400.110.4
80.675640 × 6400.1080.388
160.681640 × 6400.0940.385
yolov5m20.646640 × 6400.0940.367
40.653640 × 6400.0750.363
80.617640 × 6400.0930.352
160.861640 × 6400.0530.456
yolov5l20.653640 × 6400.0750.363
40.617640 × 6400.0930.352
80.79640 × 6400.0510.42
160.695640 × 6400.0820.317
yolov5s620.5121280 × 12800.0790.286
40.4941280 × 12800.050.263
80.4861280 × 12800.0370.258
160.561280 × 12800.0280.292
yolov5m620.4091280 × 12800.0450.222
40.4971280 × 12800.0430.269
80.4451280 × 12800.0560.247
160.4621280 × 12800.0750.262
yolov5l620.4021280 × 12800.0560.221
40.4021280 × 12800.0730.227
80.4521280 × 12800.0460.241
160.4351280 × 12800.0320.263
Table 2. Ablation of parameter k.
yolov5mk = 25507090
Precision0.8610.6250.6950.426
Recall0.0530.0680.0820.064
mAP0.4560.3280.3870.240
Table 3. Various schemes of hyperparameters values.
HyperparametersScheme OneScheme TwoScheme Three
lr00.010.002580.0032
lrf0.20.170.12
momentum0.9370.7790.843
weight_decay0.00050.000580.00036
warmup_epochs3.01.332.0
warmup_momentum0.80.860.5
Table 4. Outcome of various schemes with different value hyperparameters.
yolov5mScheme OneScheme TwoScheme Three
Precision0.8610.6310.827
Recall0.0530.0620.004
mAP0.4560.3460.416
Publisher’s Note: MDPI stays neutral with regard to jurisdictional claims in published maps and institutional affiliations.

