Process Optimization for 100 W Nanosecond Pulsed Fiber Laser Engraving of 316L Grade Stainless Steel

 ,
,
Abstract
:1. Introduction
2. Methodology
2.1. Material
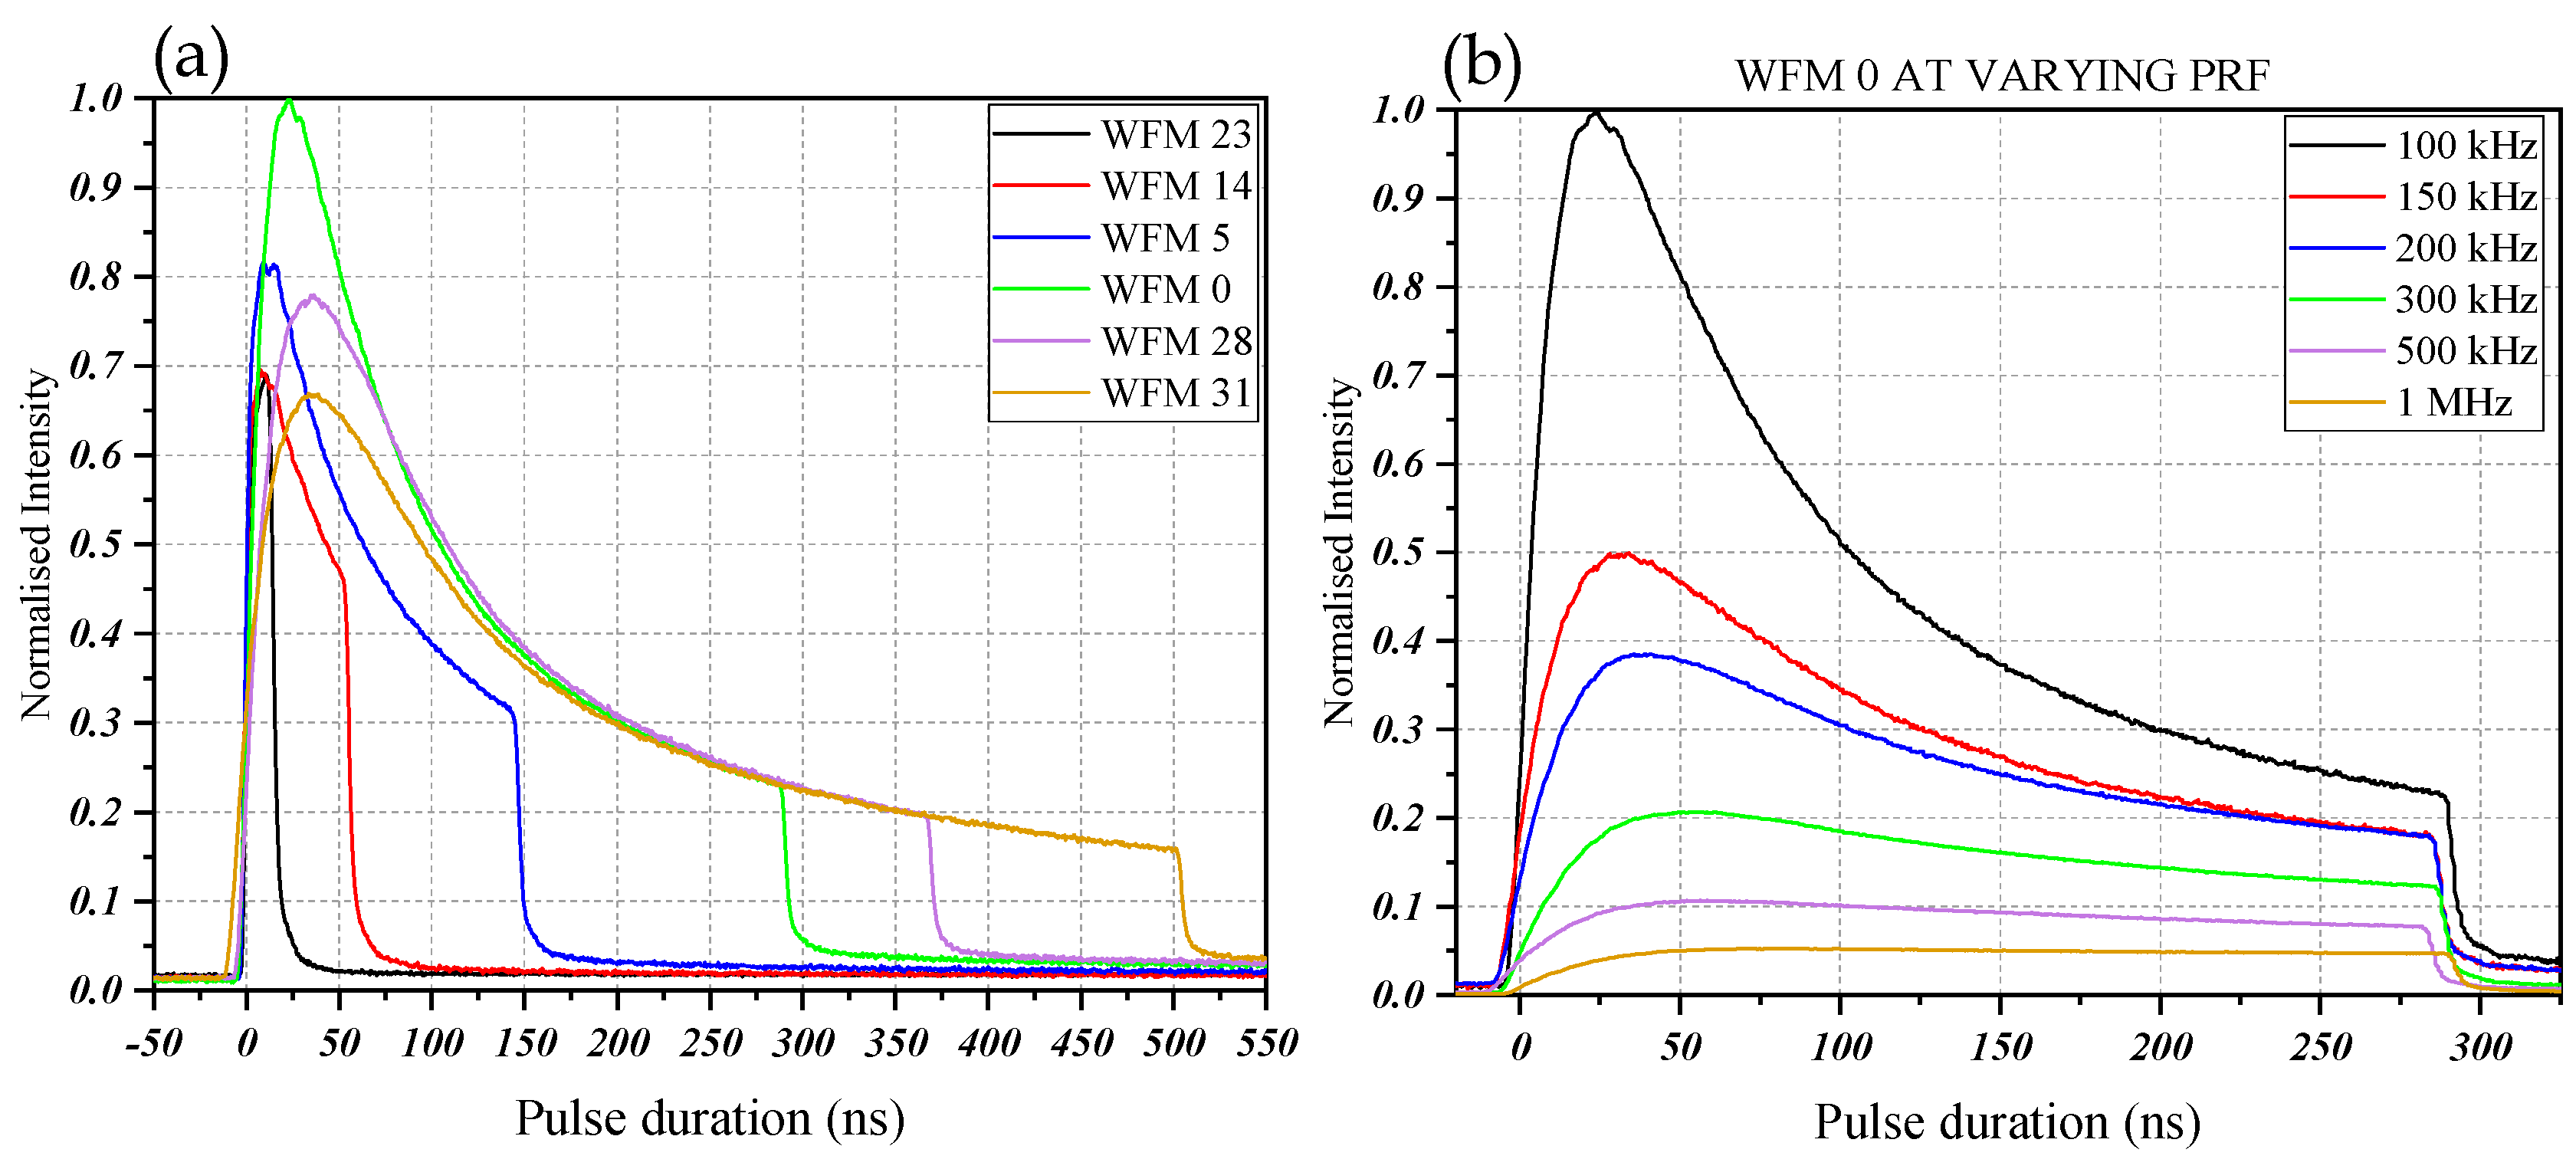
2.2. Laser Set-Up
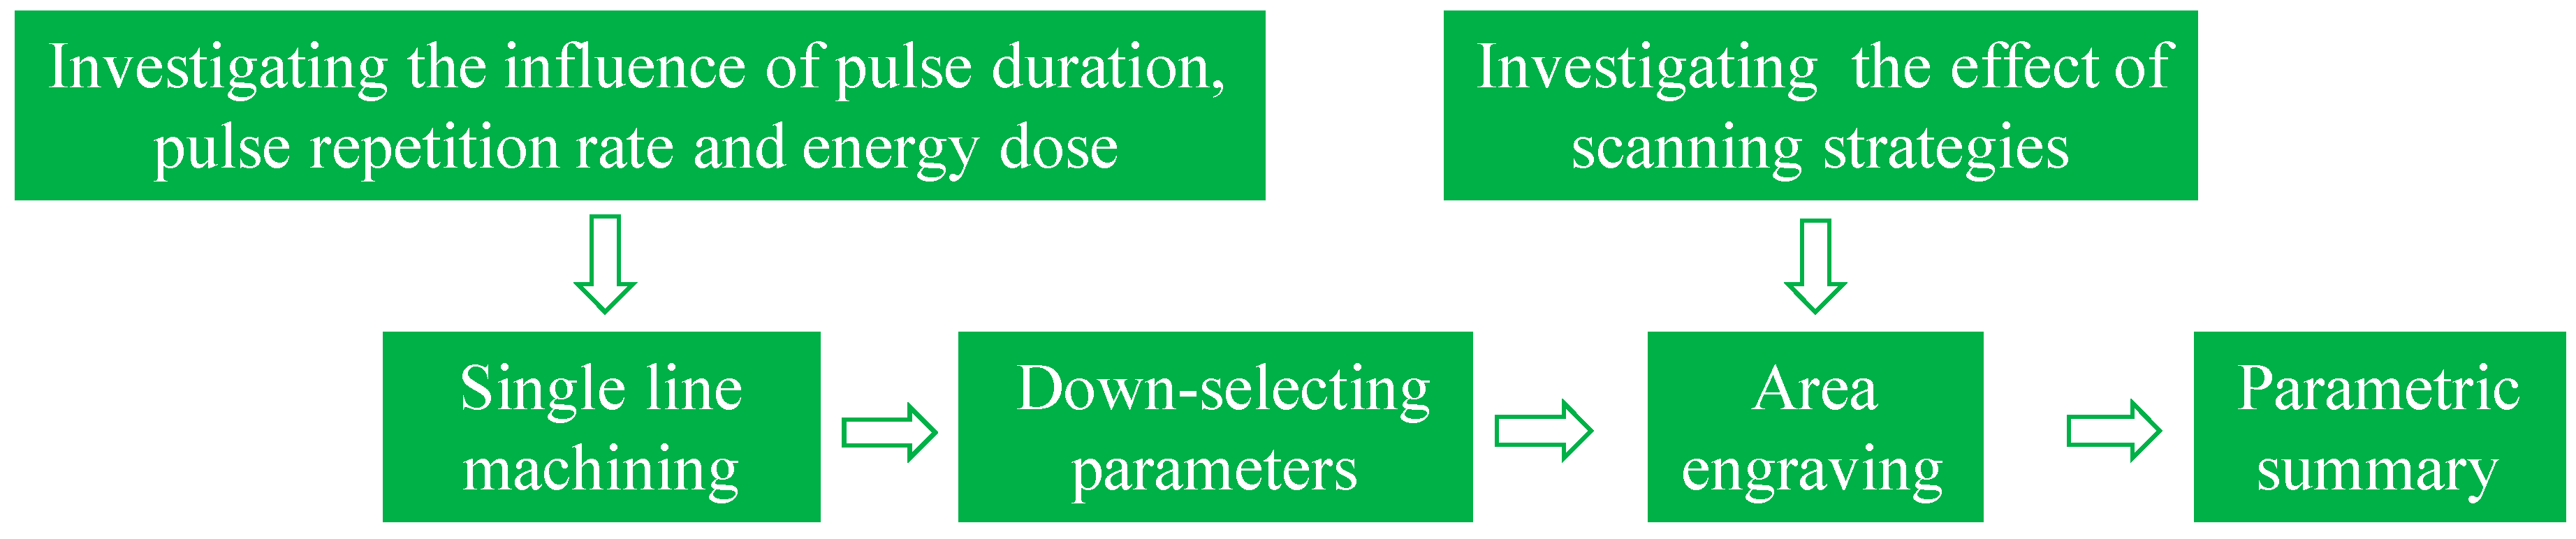
2.3. Experimental Protocol
2.3.1. Single Line Machining
2.3.2. Area Machining Experiment
2.4. Sample Postprocessing and Analysis
3. Results and Discussion
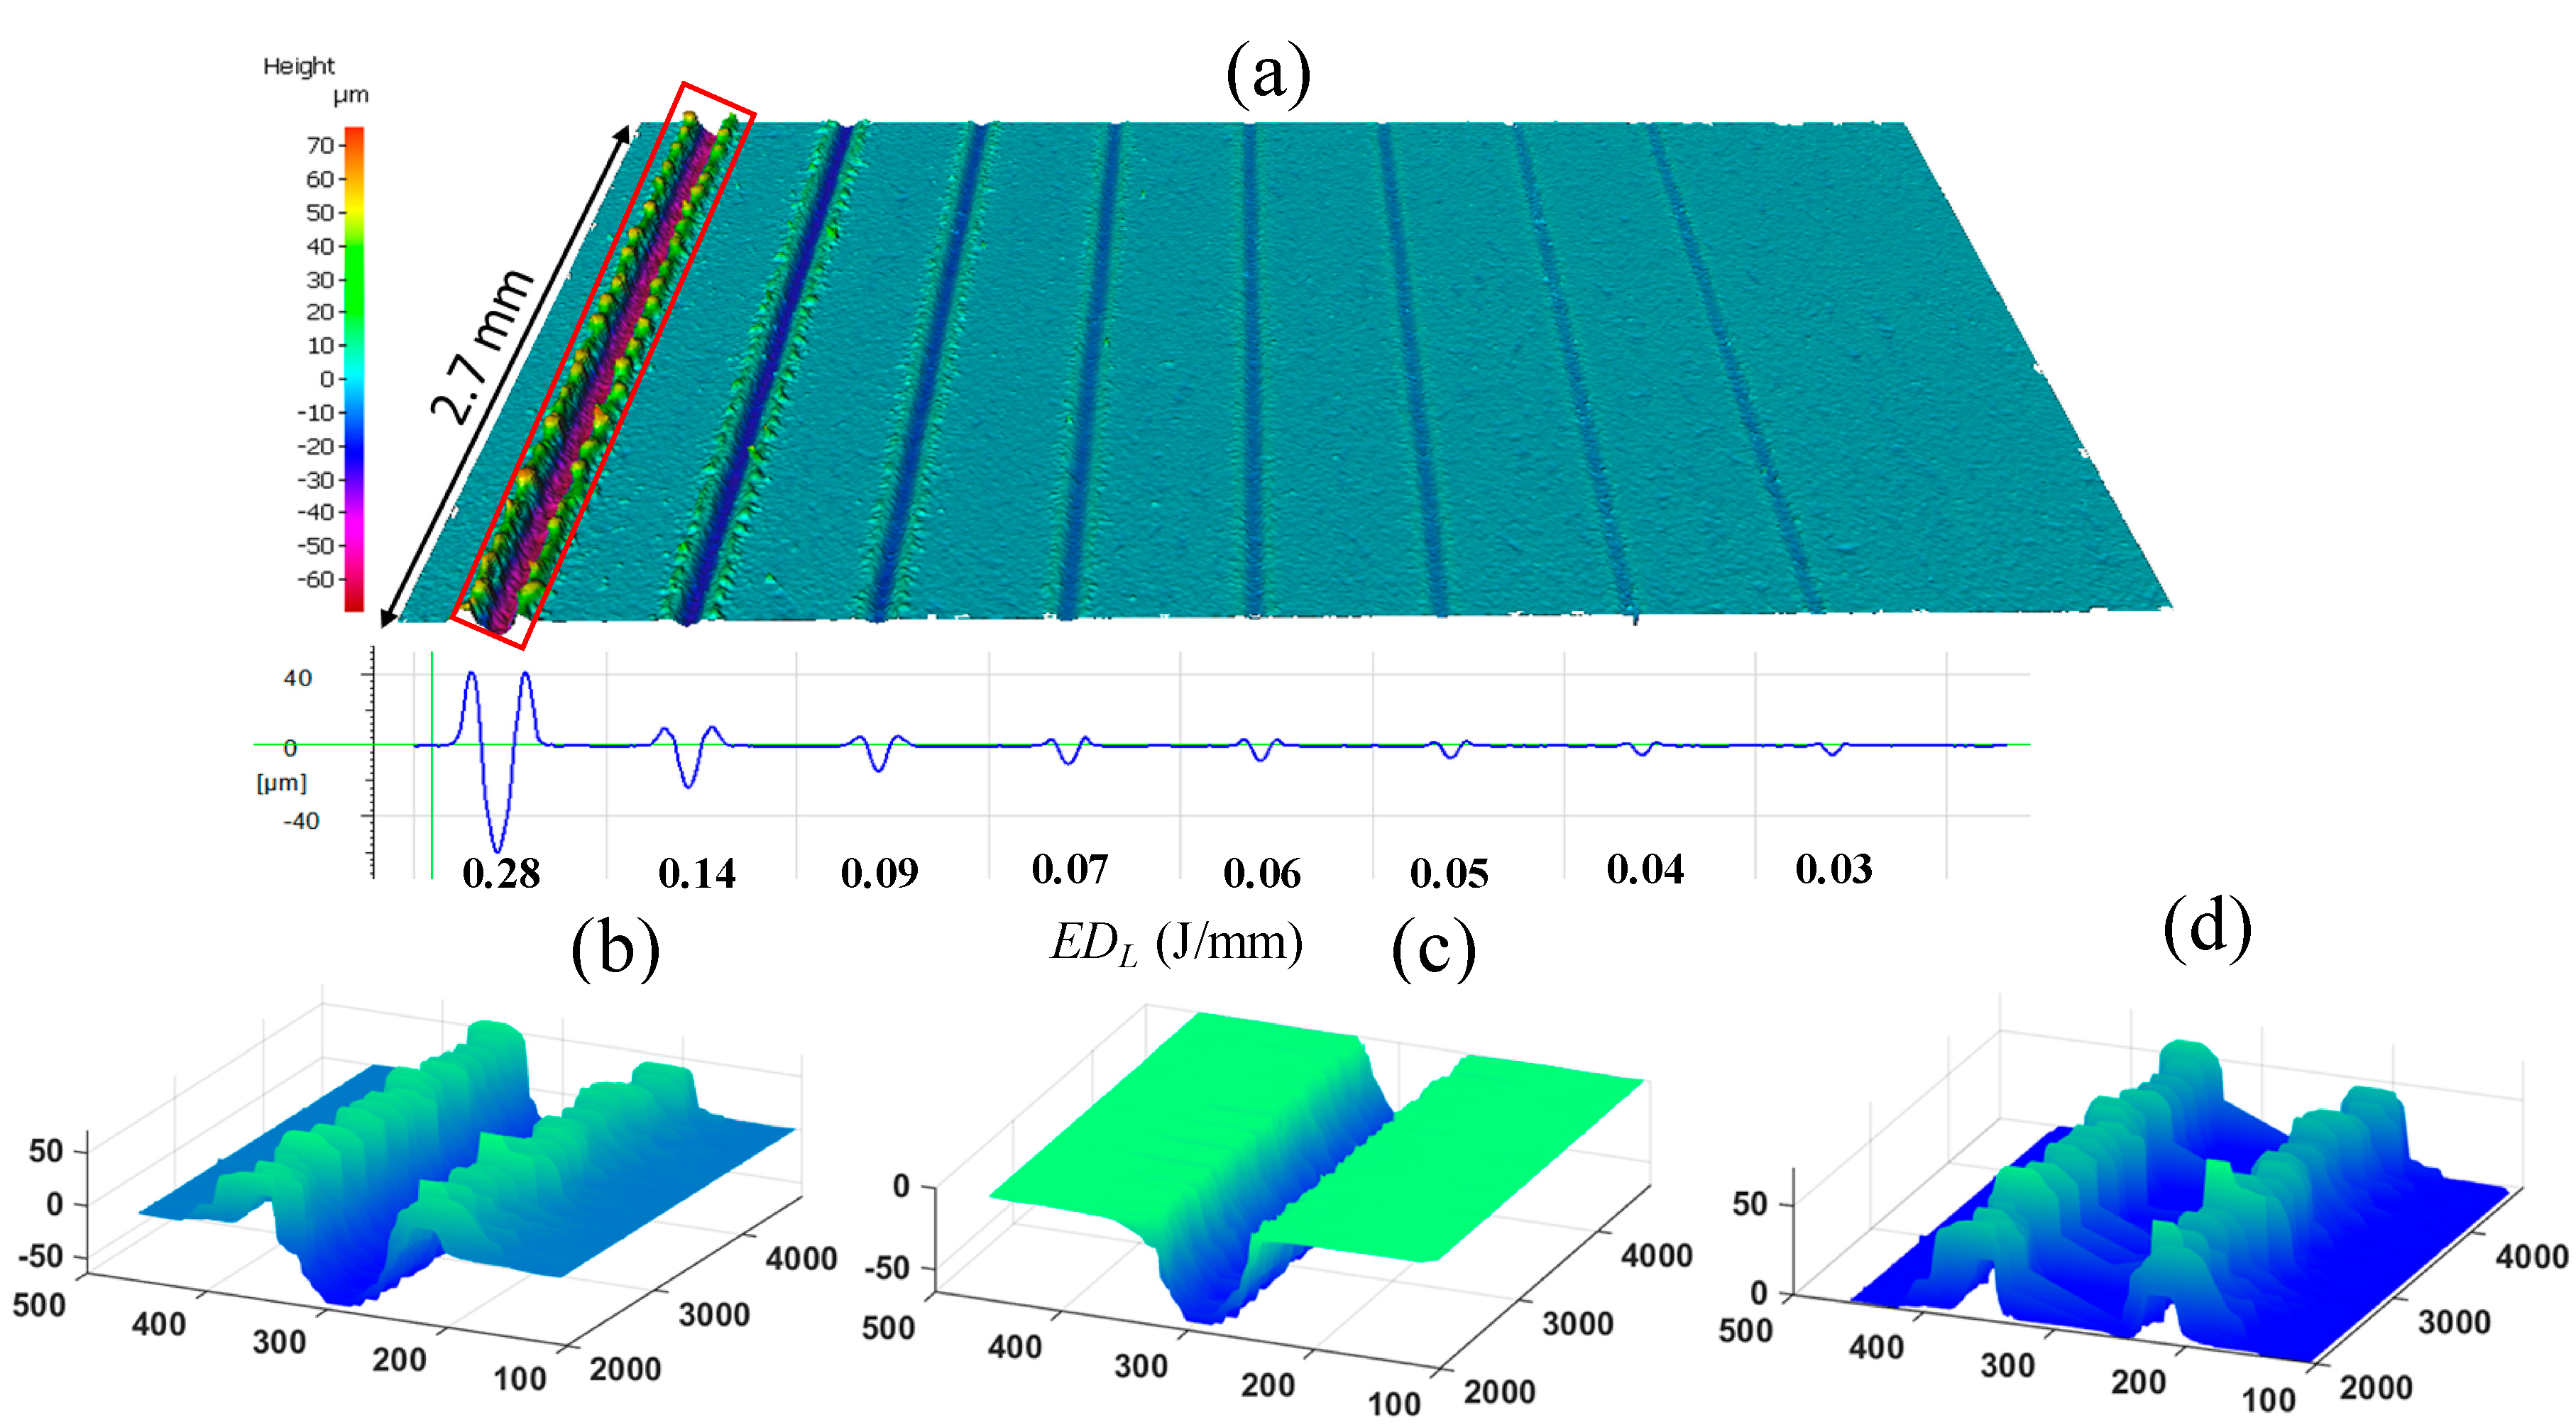
3.1. Single Line Machining Experiment
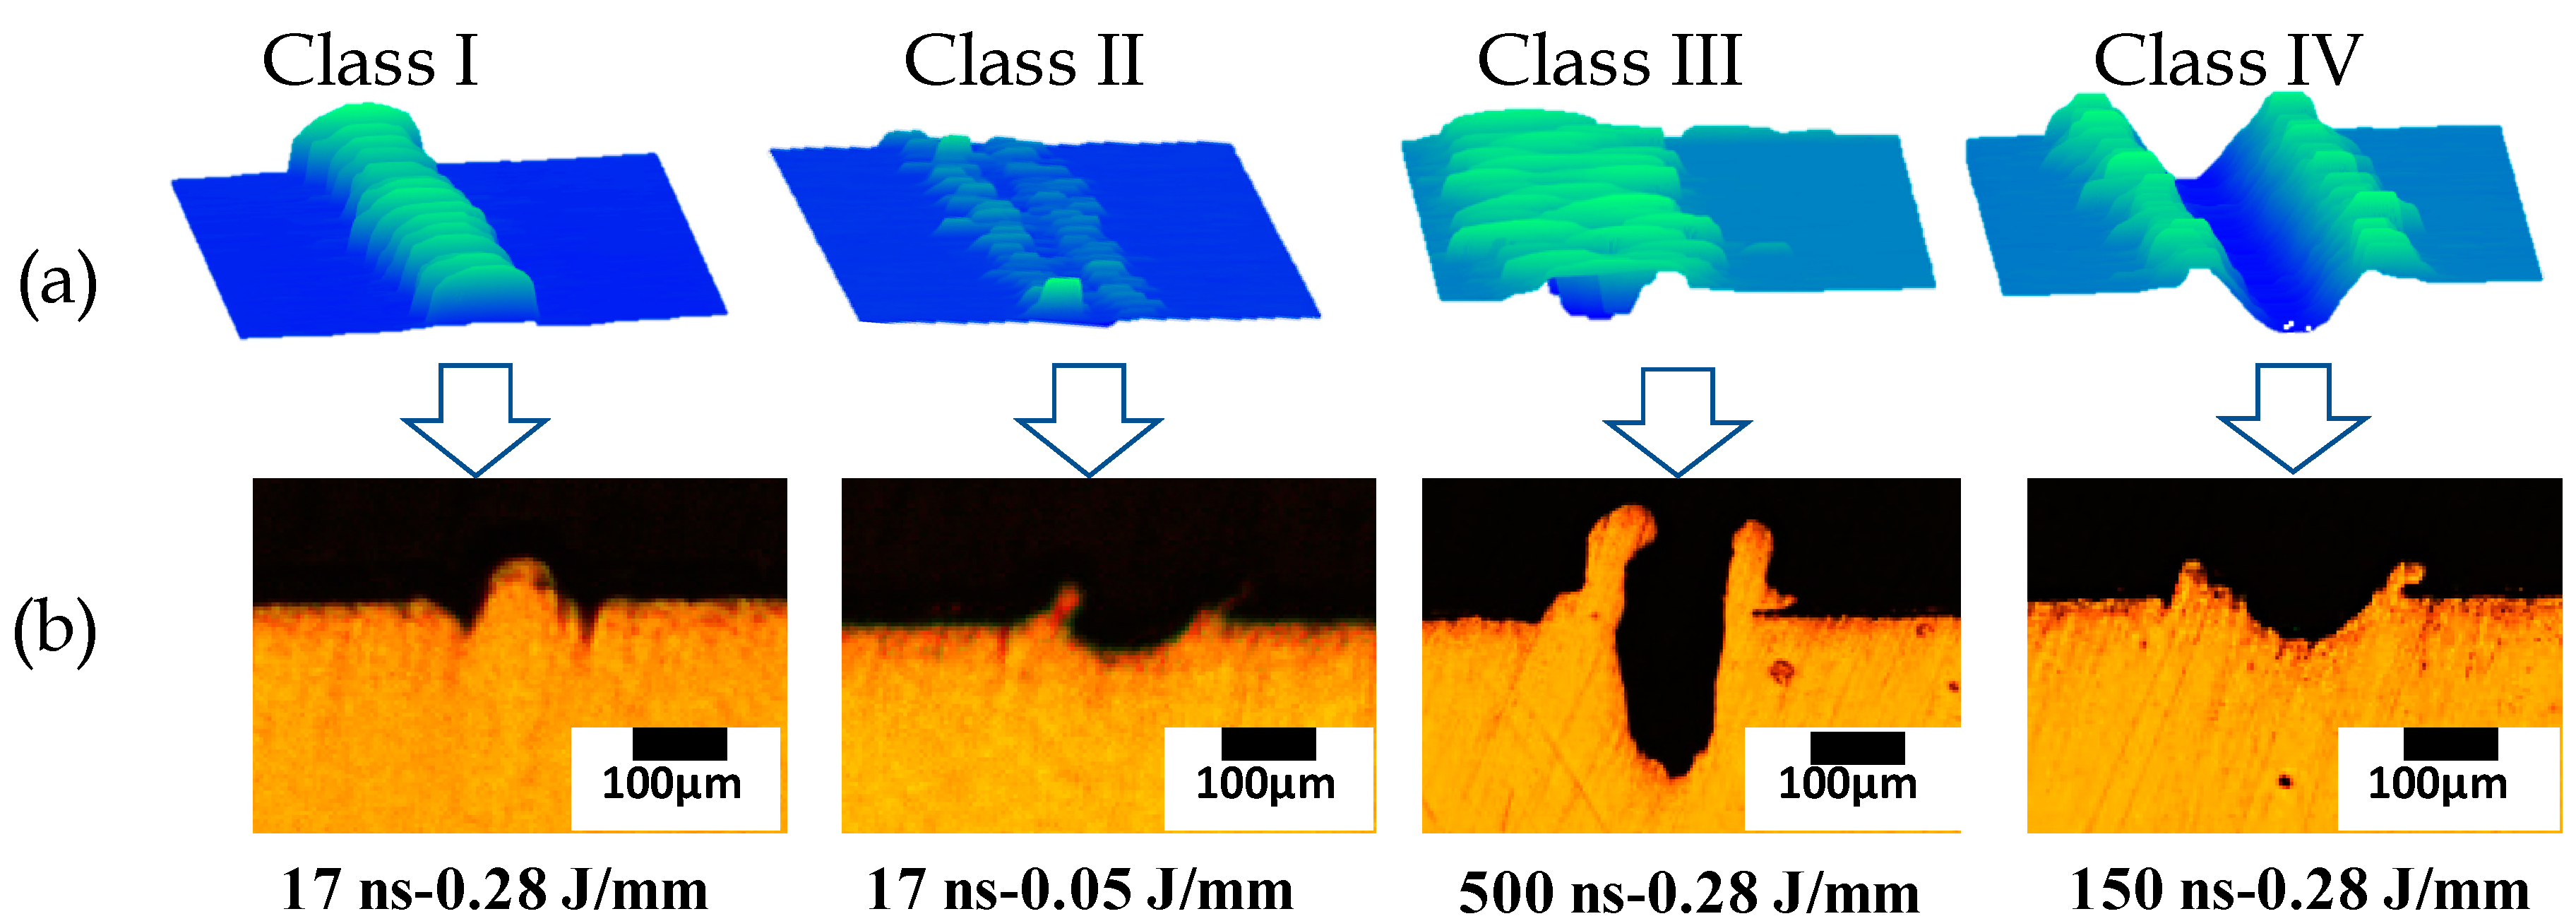
3.1.1. Groove Analysis
3.1.2. Influence of Change in and τ on Groove and Burr Formation
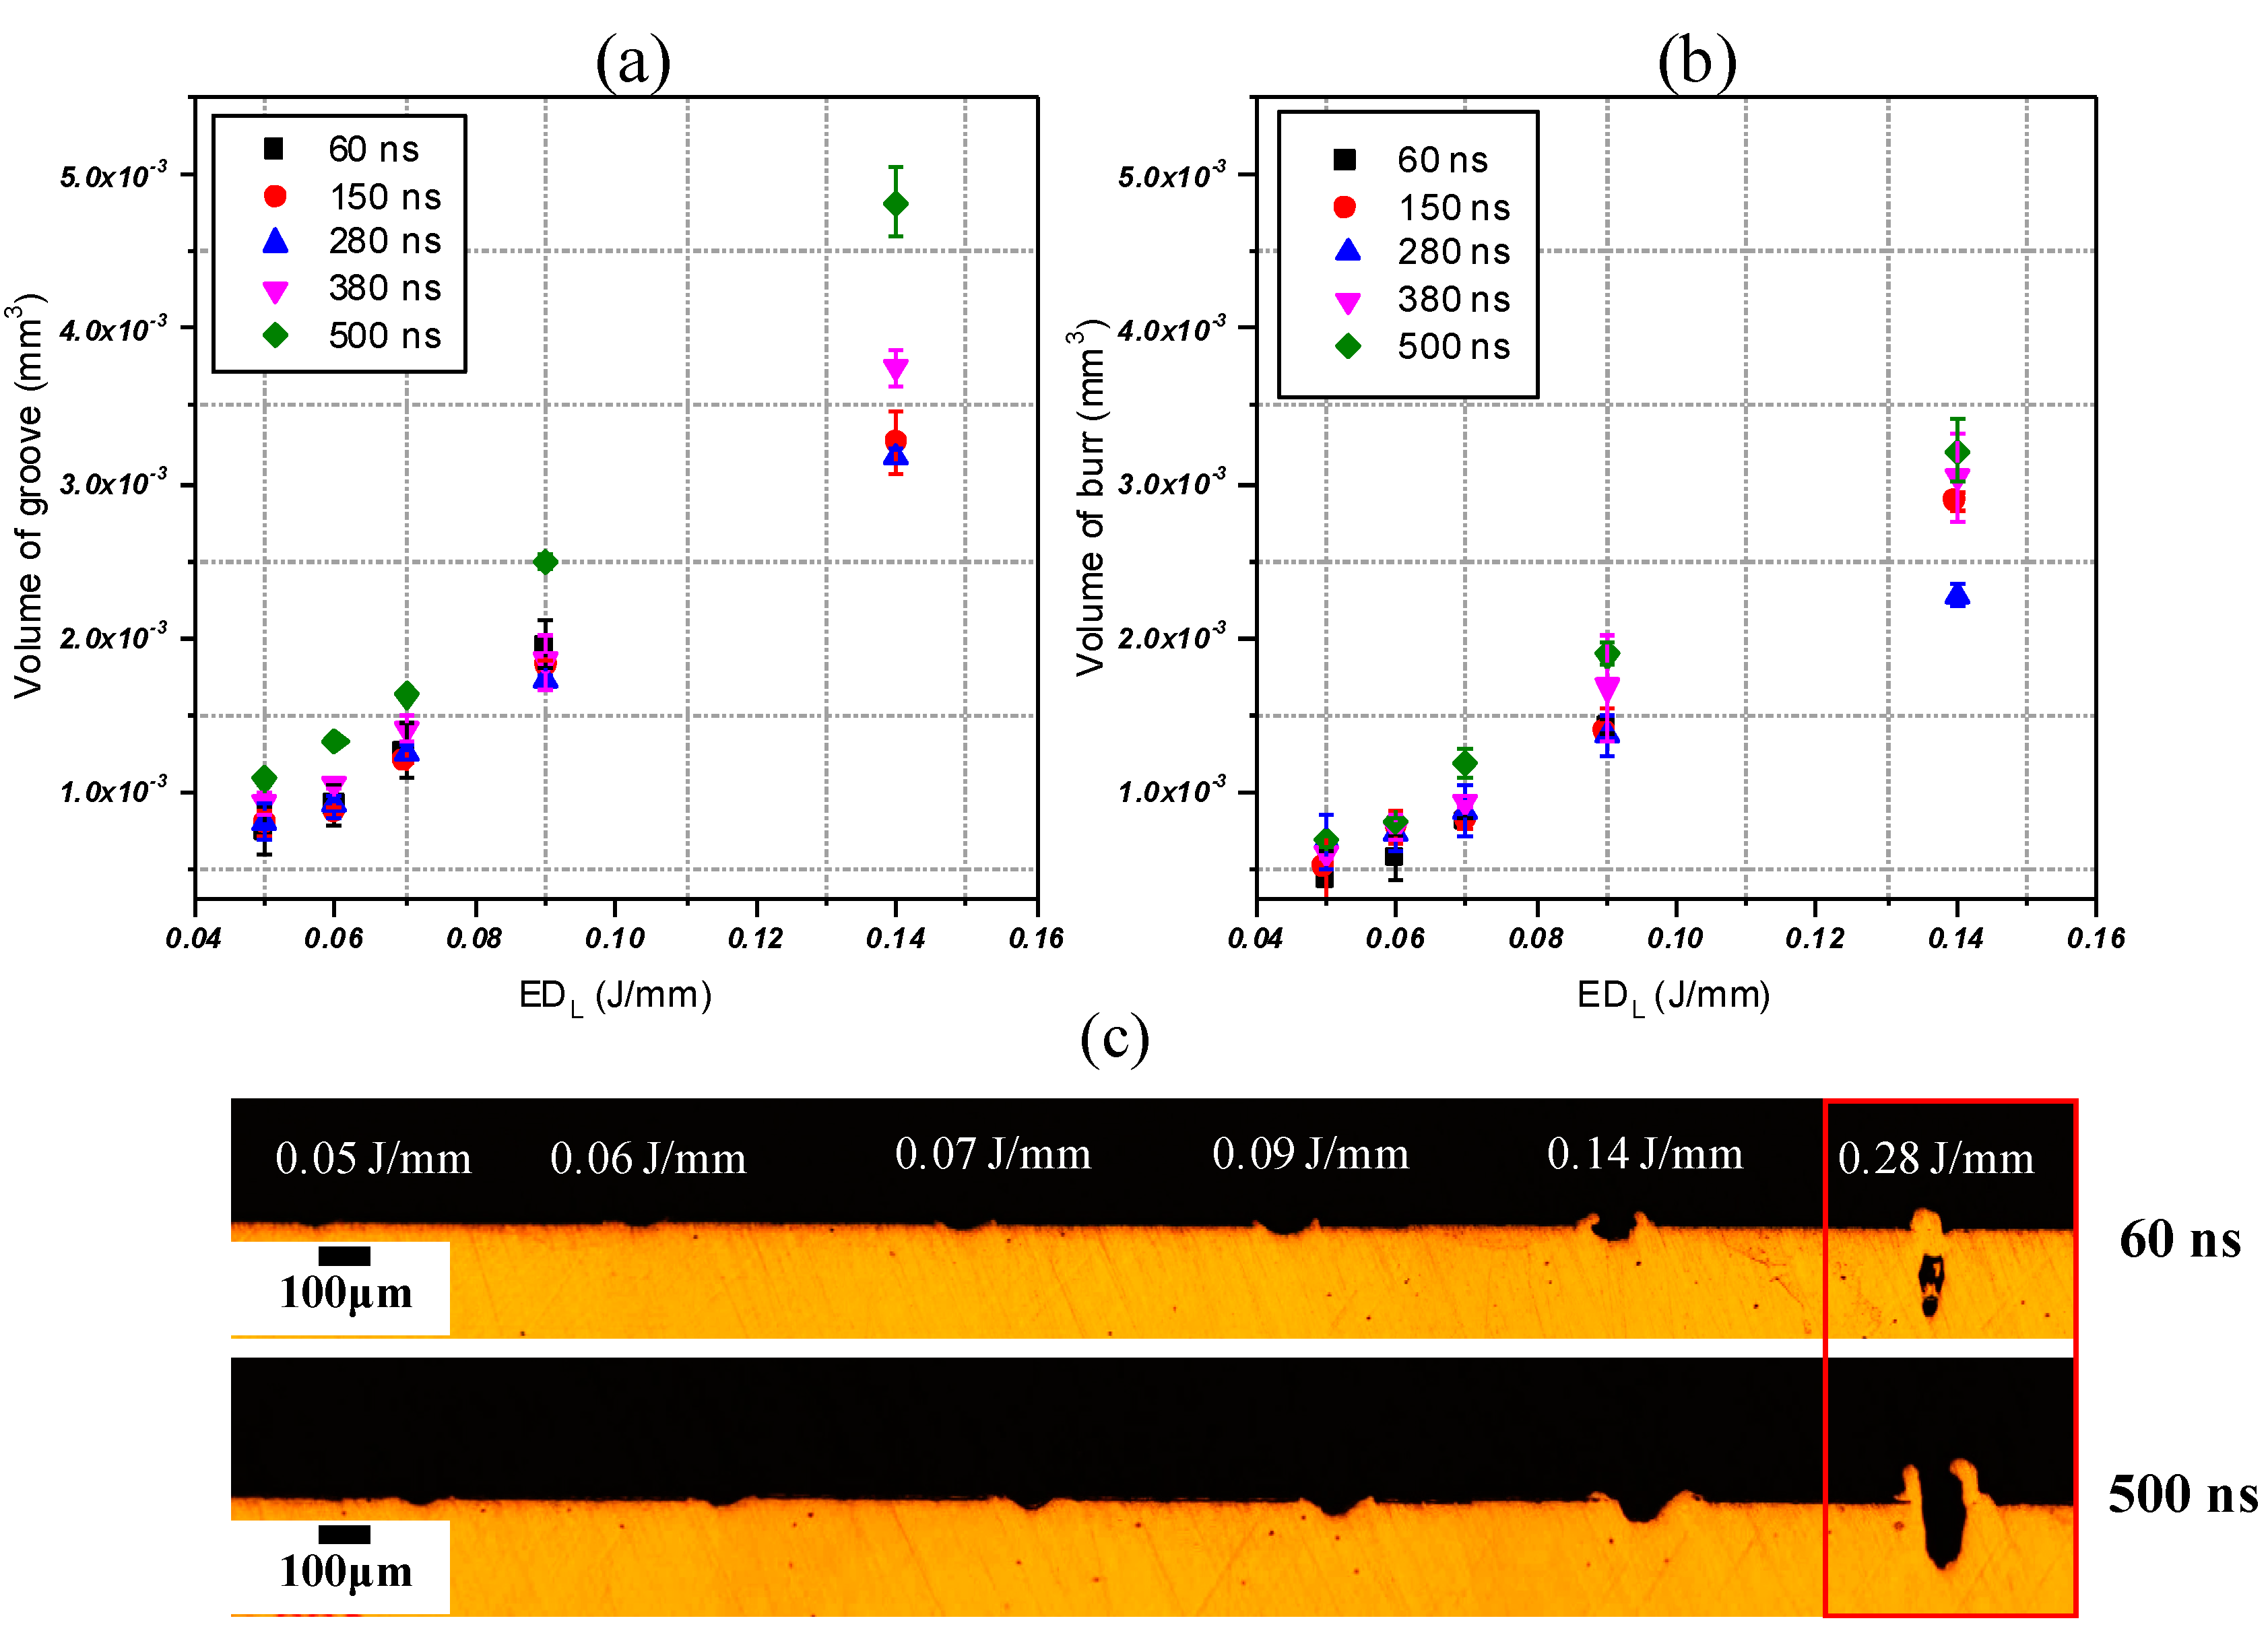
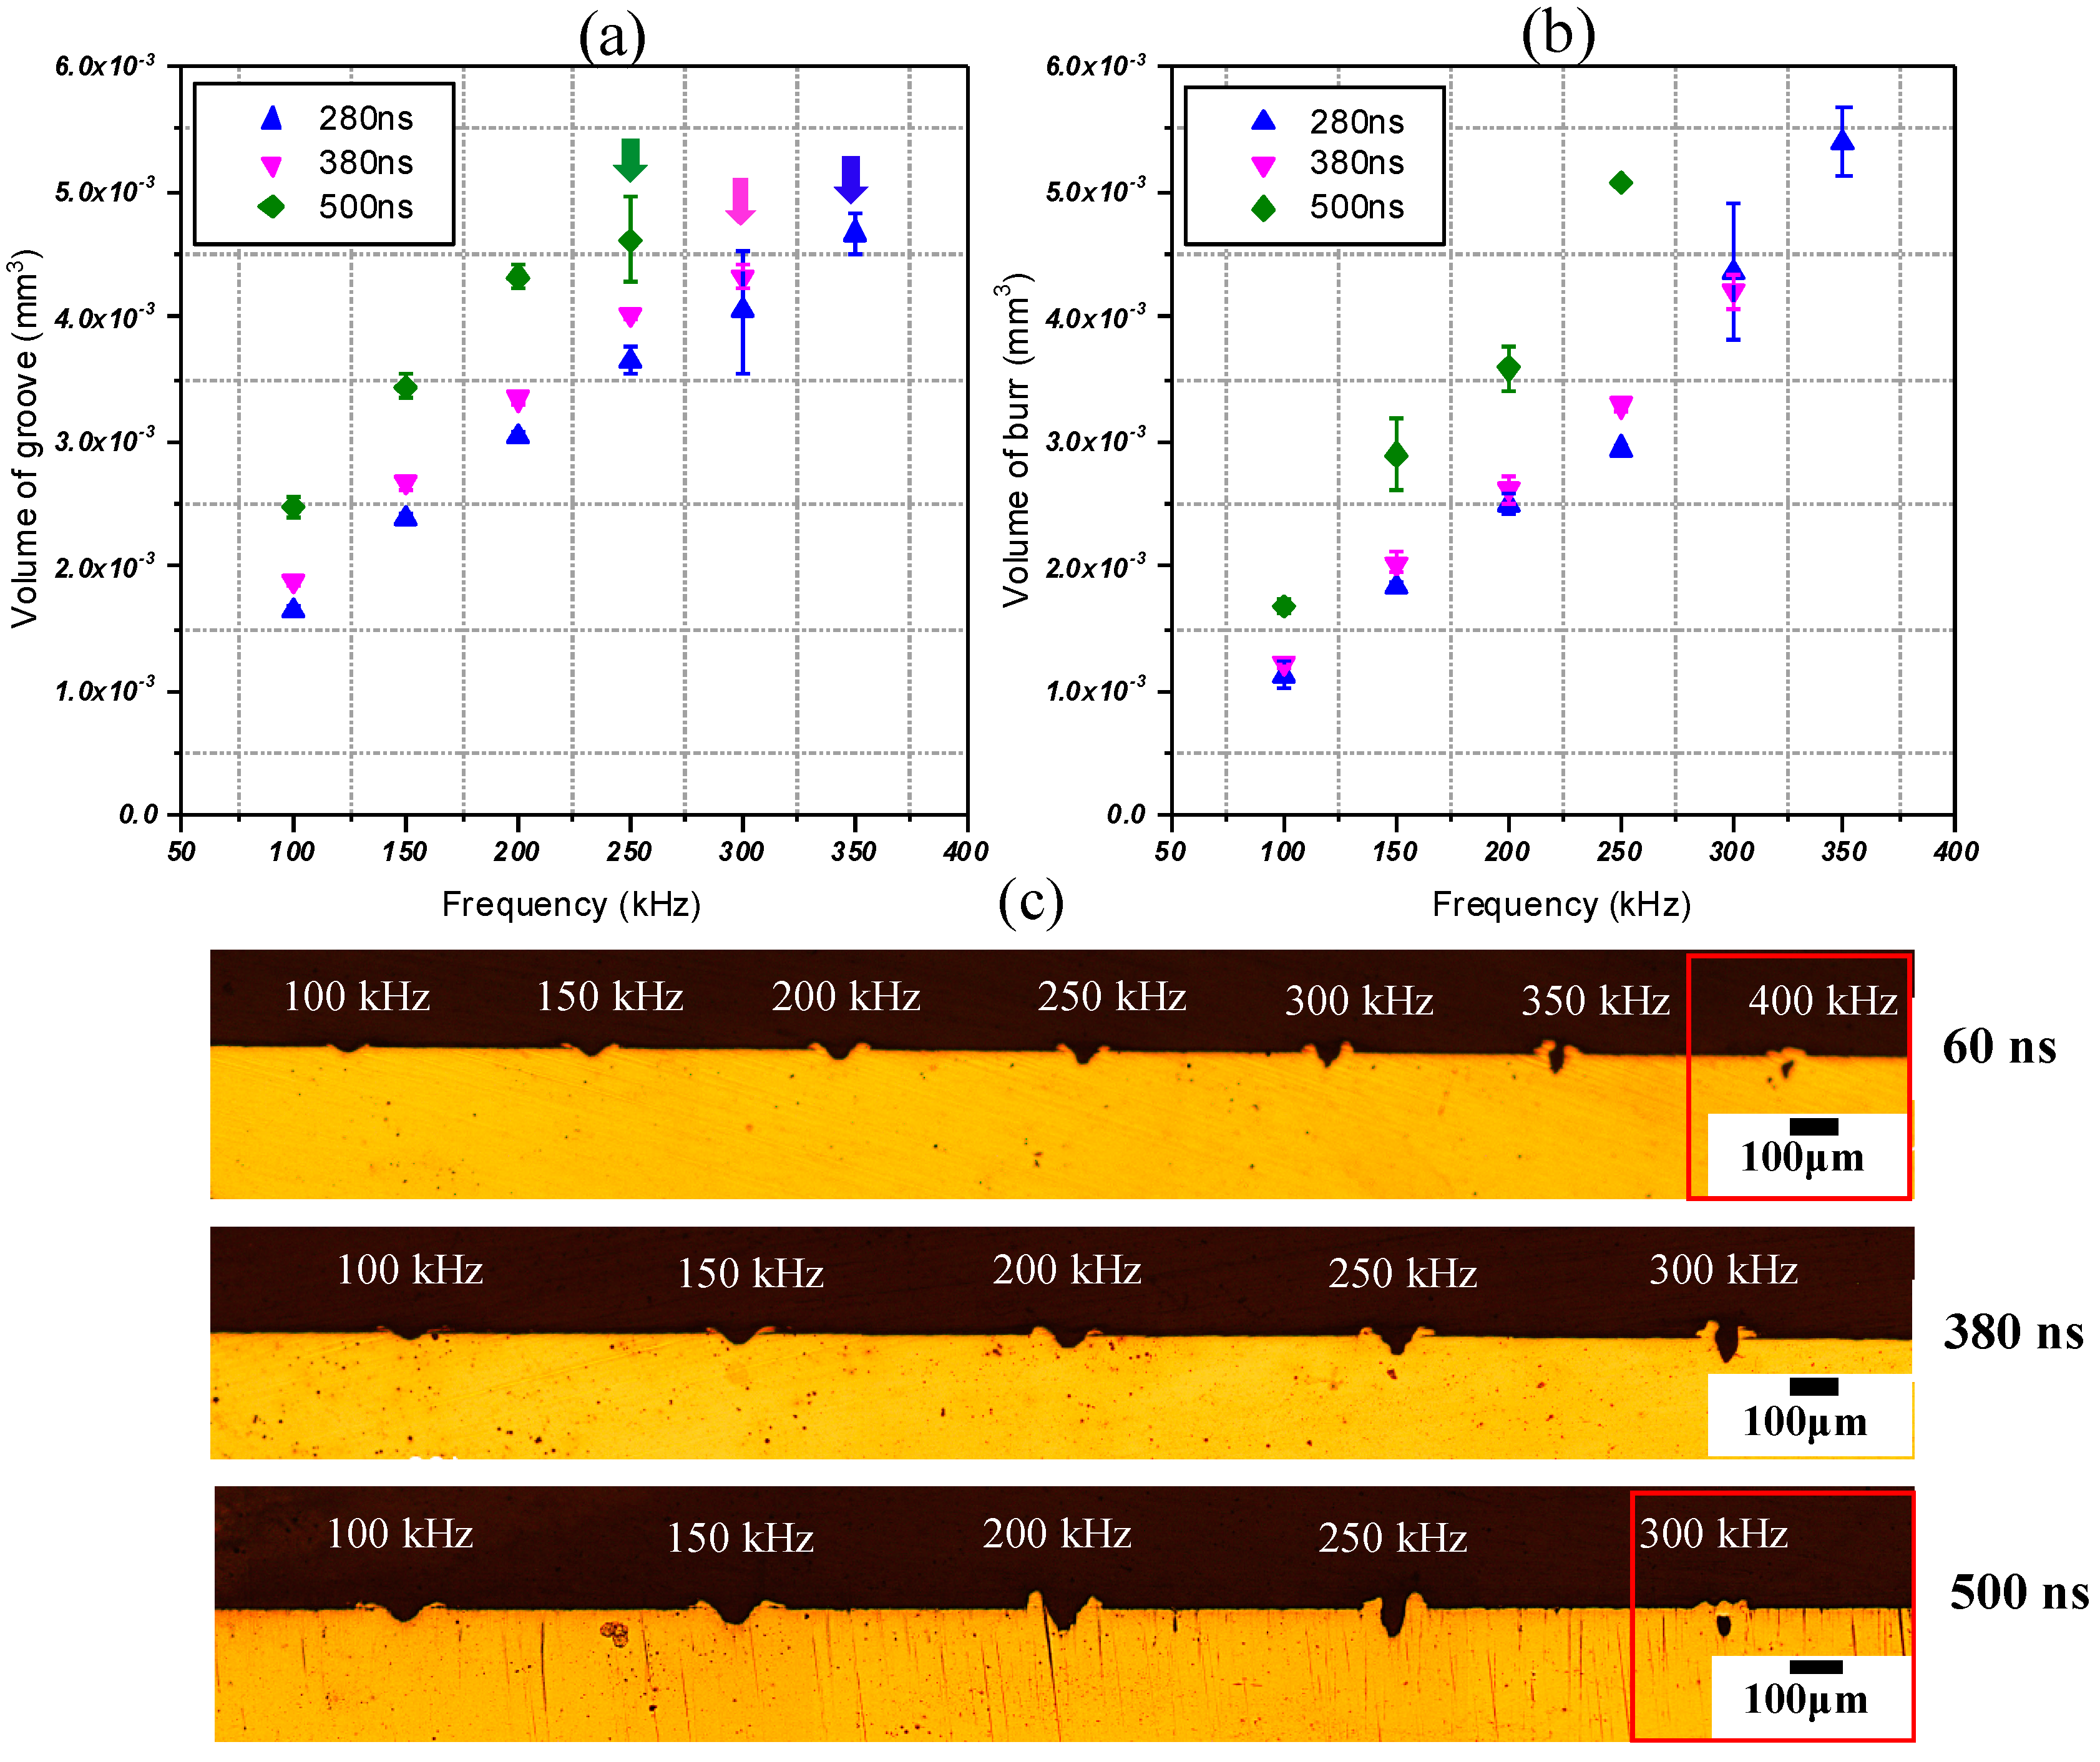
3.1.3. Effect of Change in PRF and τ on the Volume of Groove and Burr Formation
3.2. Area Machining Experiment
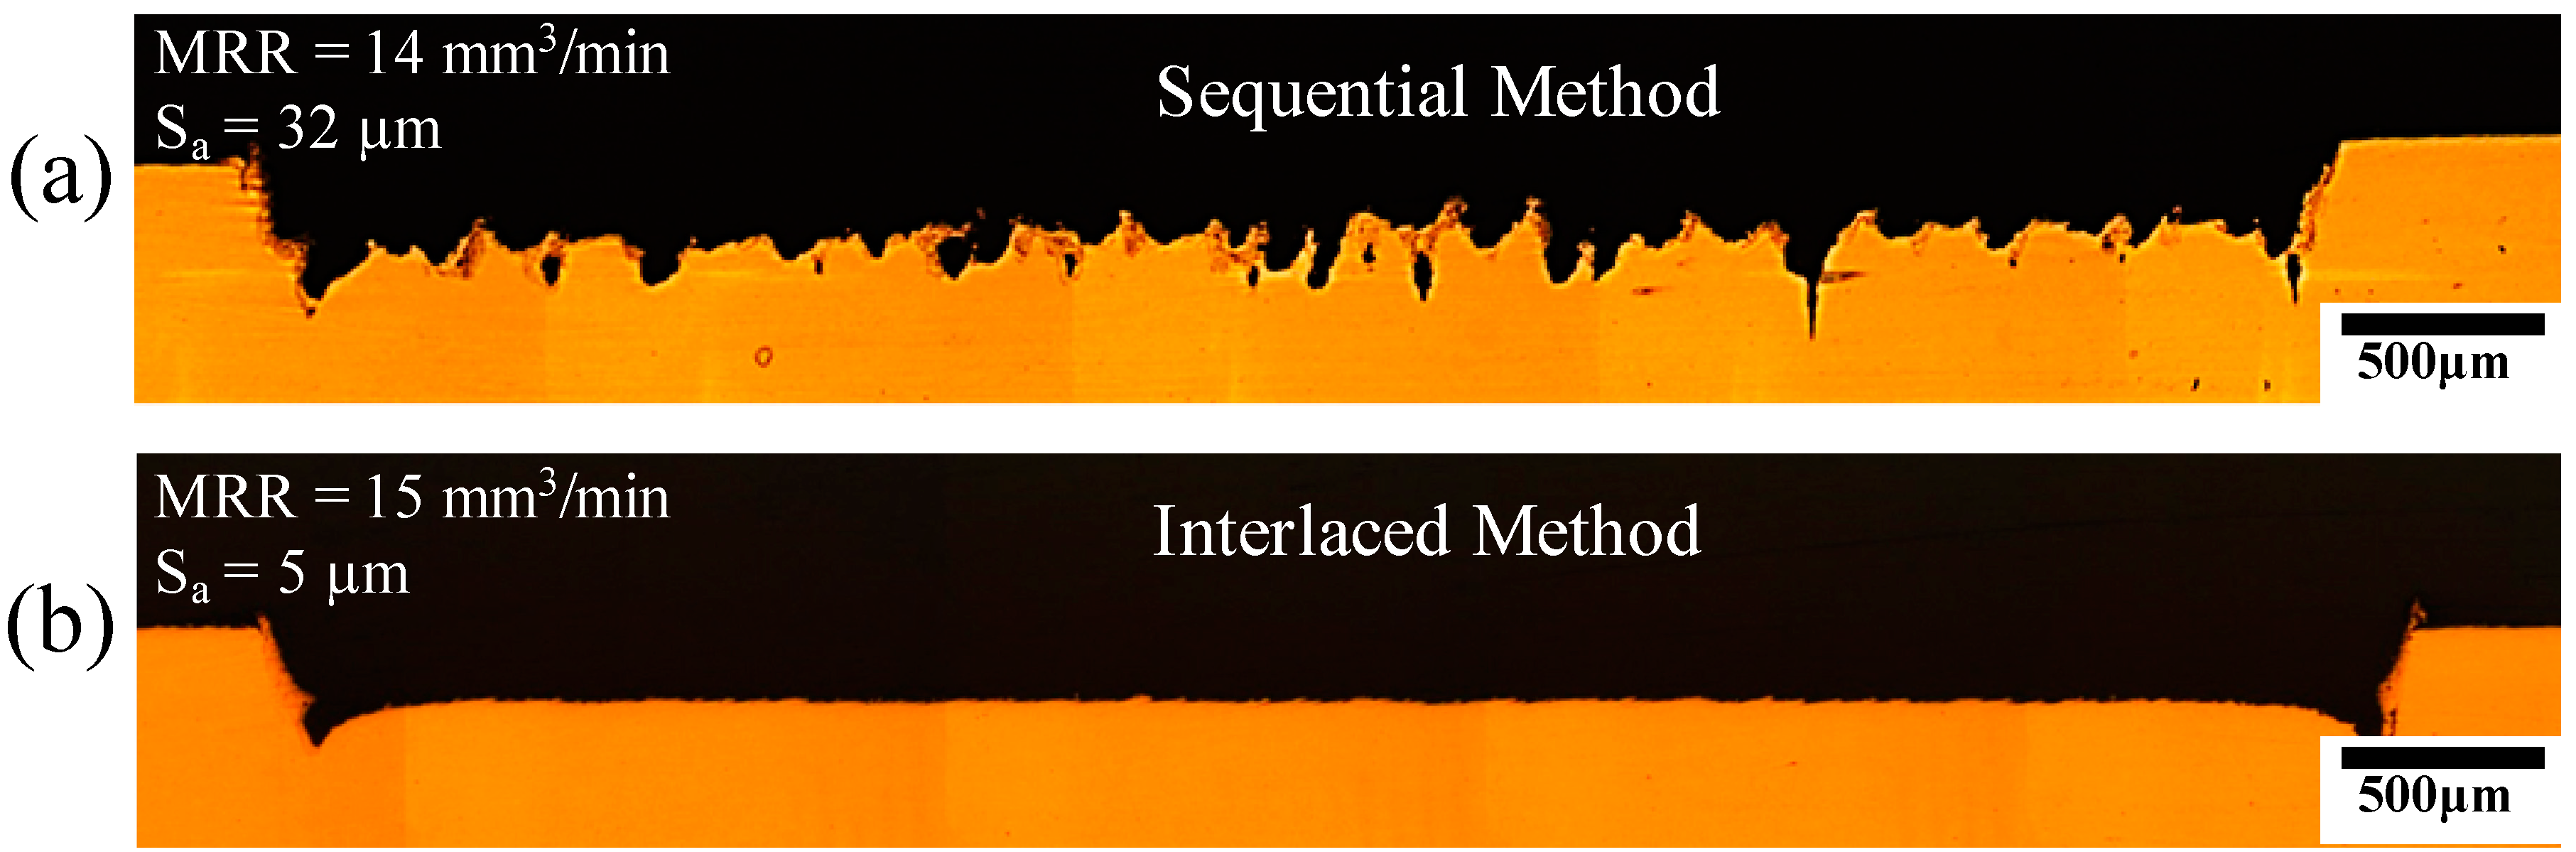
3.2.1. Effect of Different Laser Beam Scanning Strategies
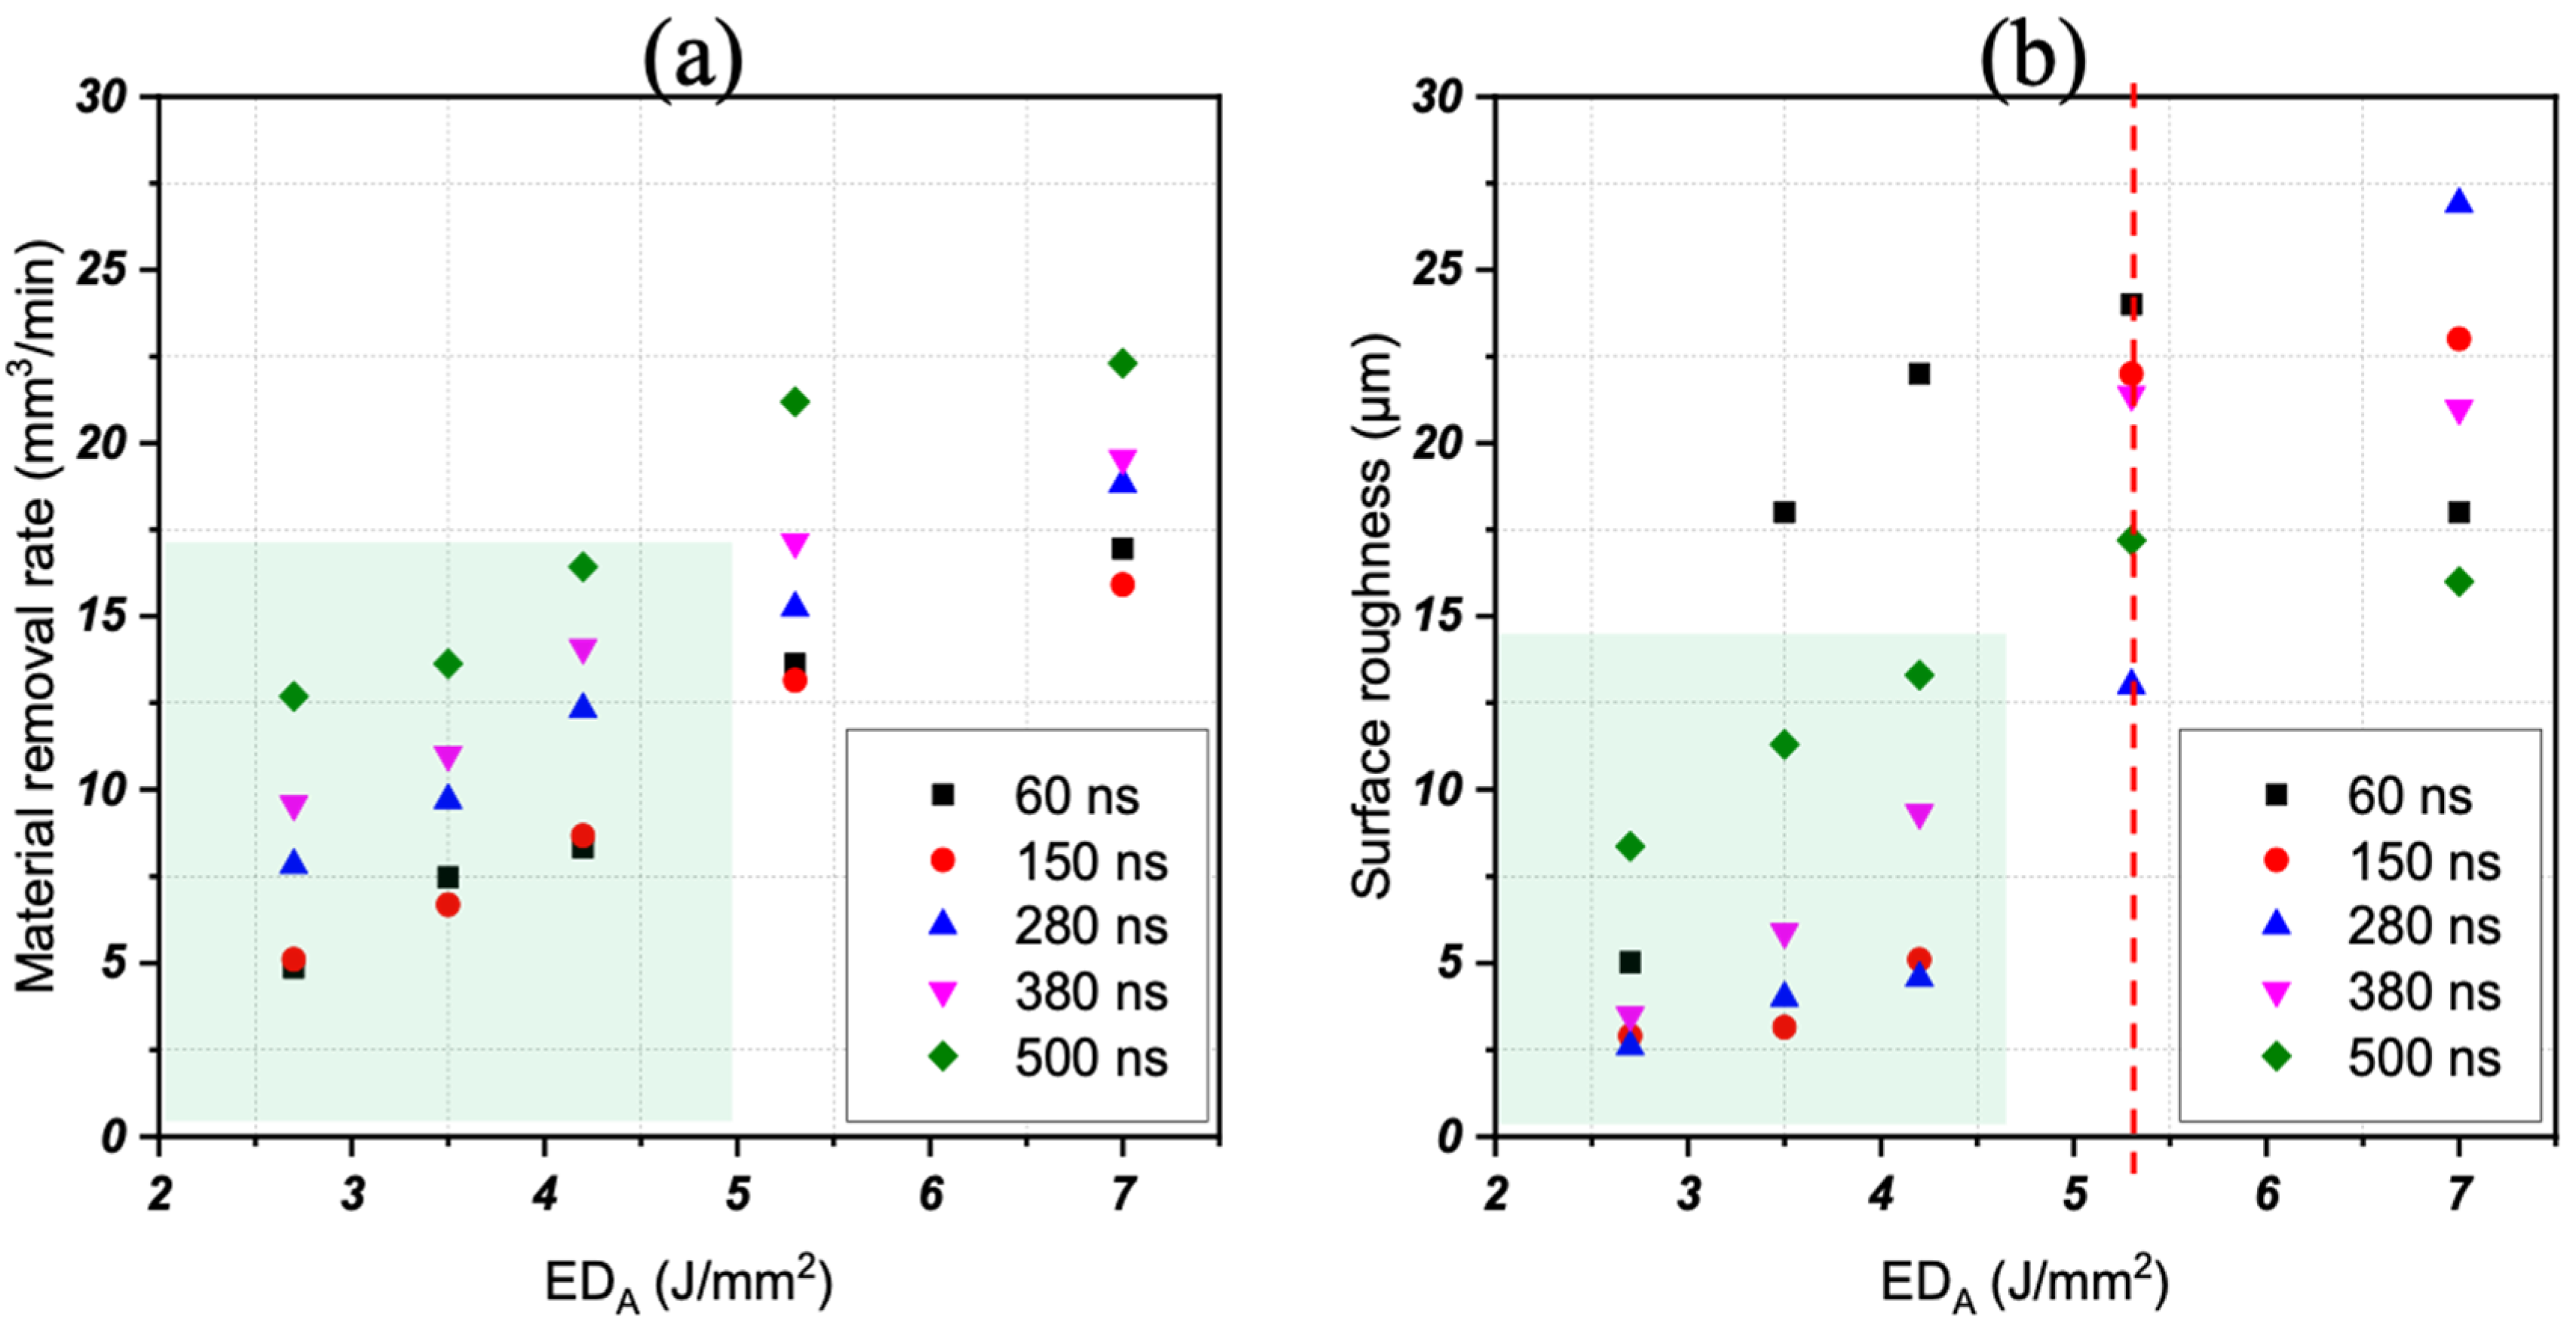
3.2.2. Influence of Change in and τ on the MRR and Sa
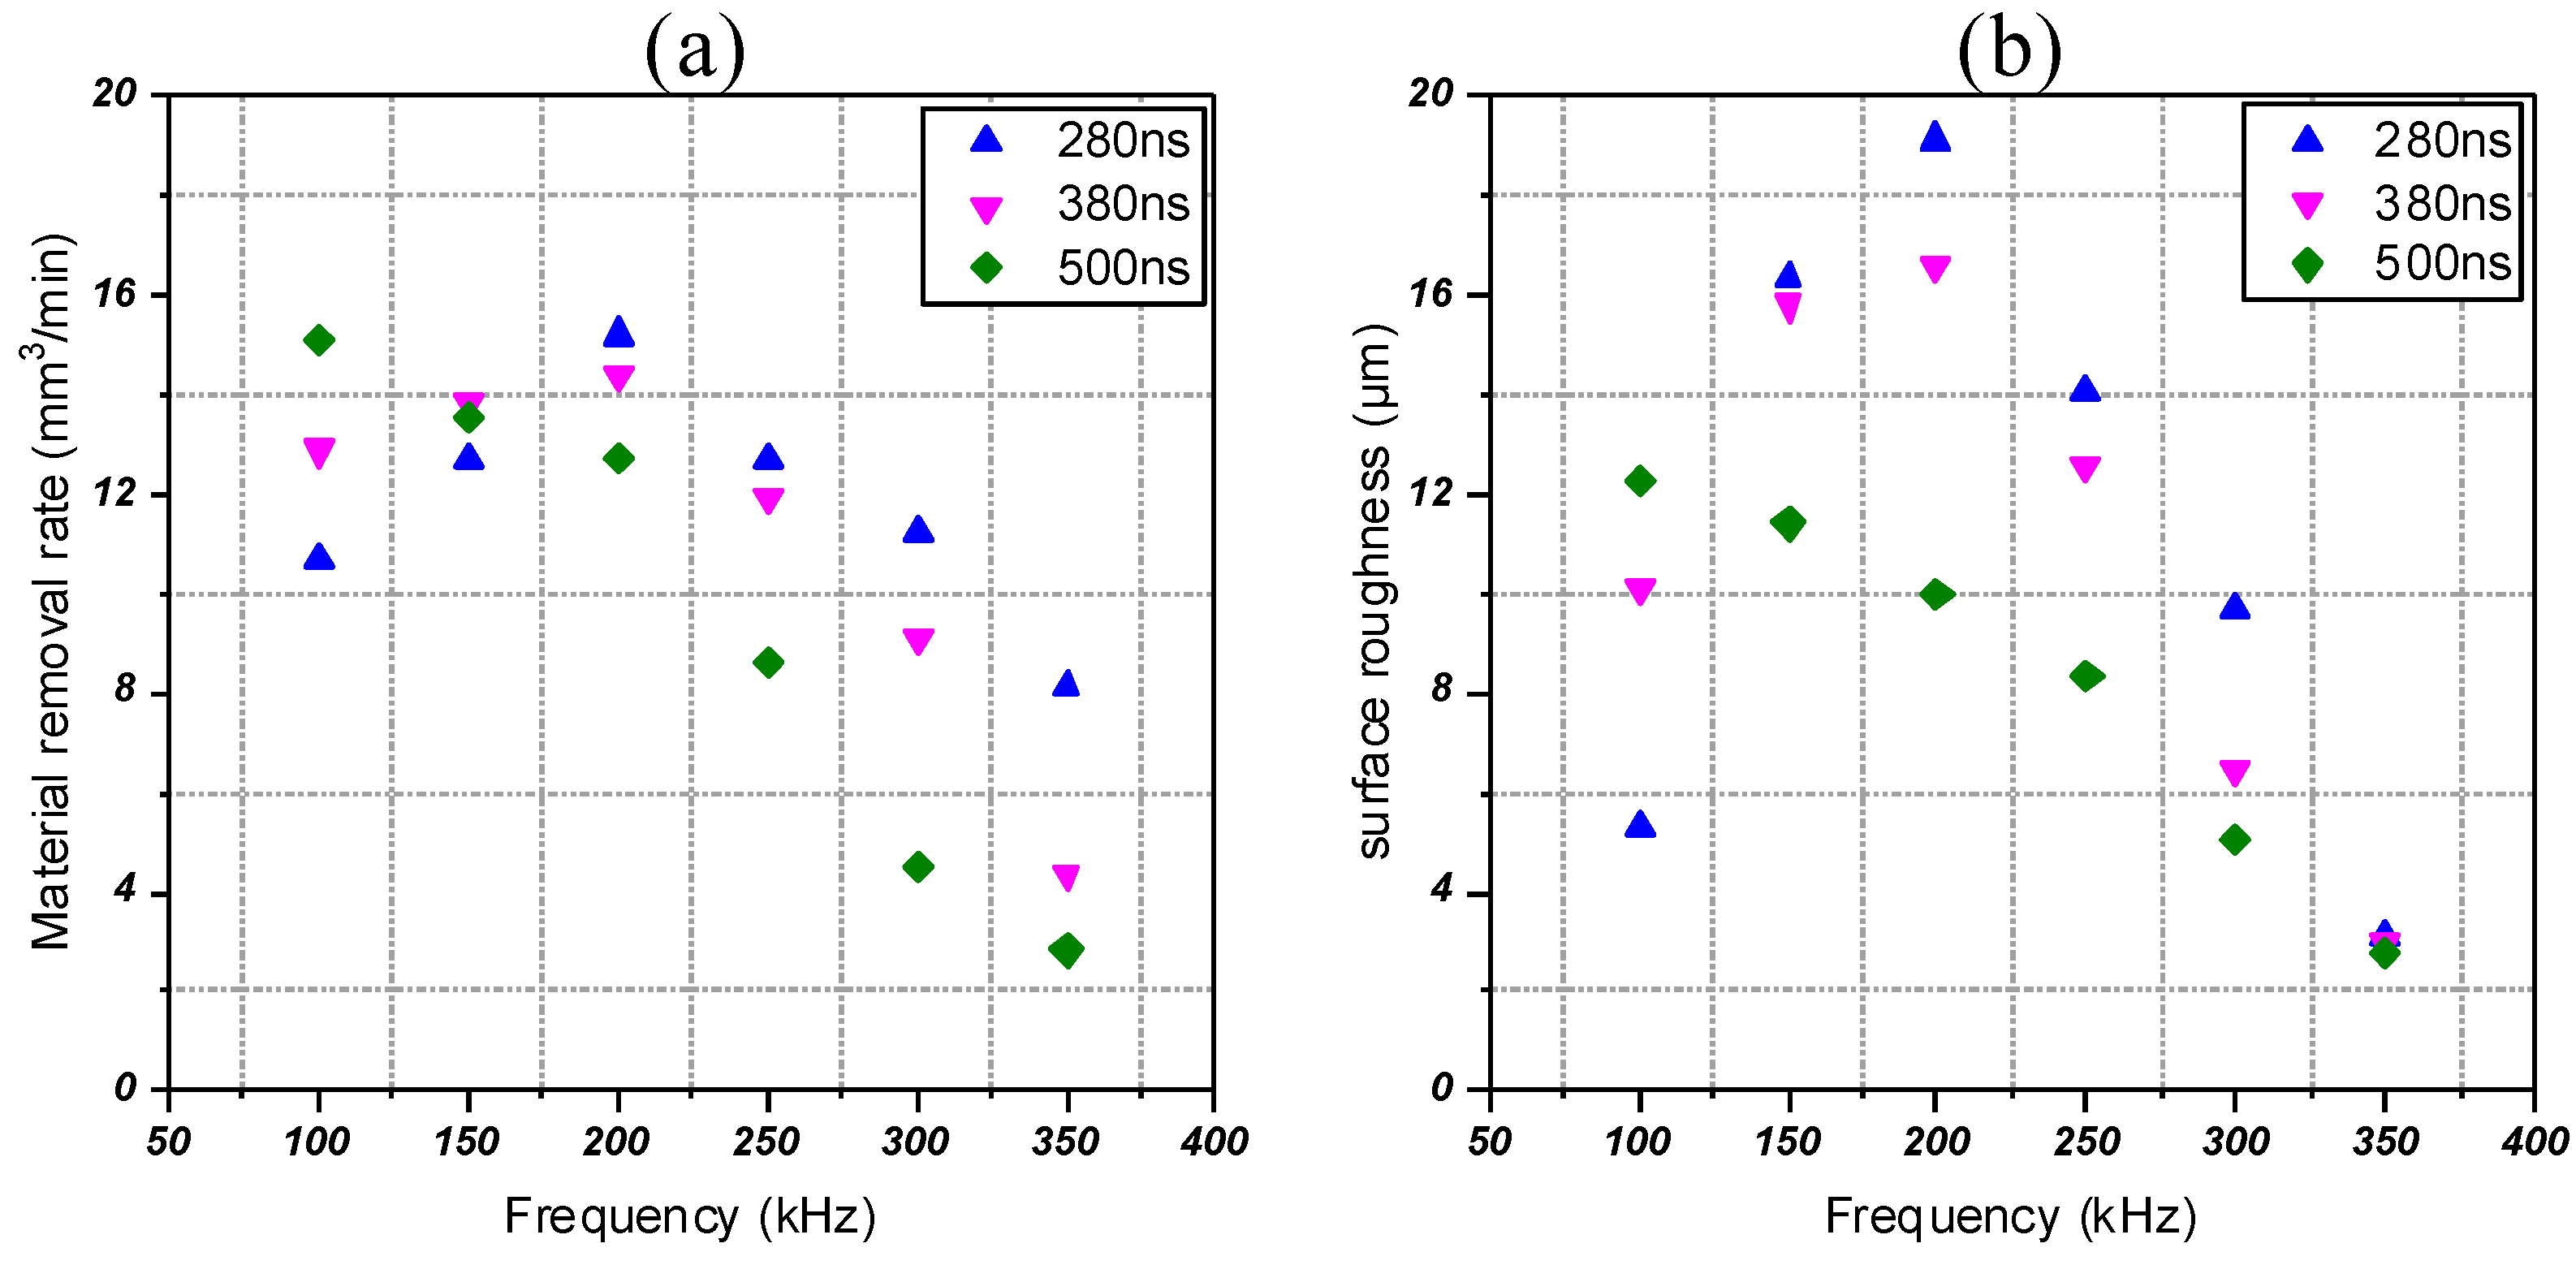
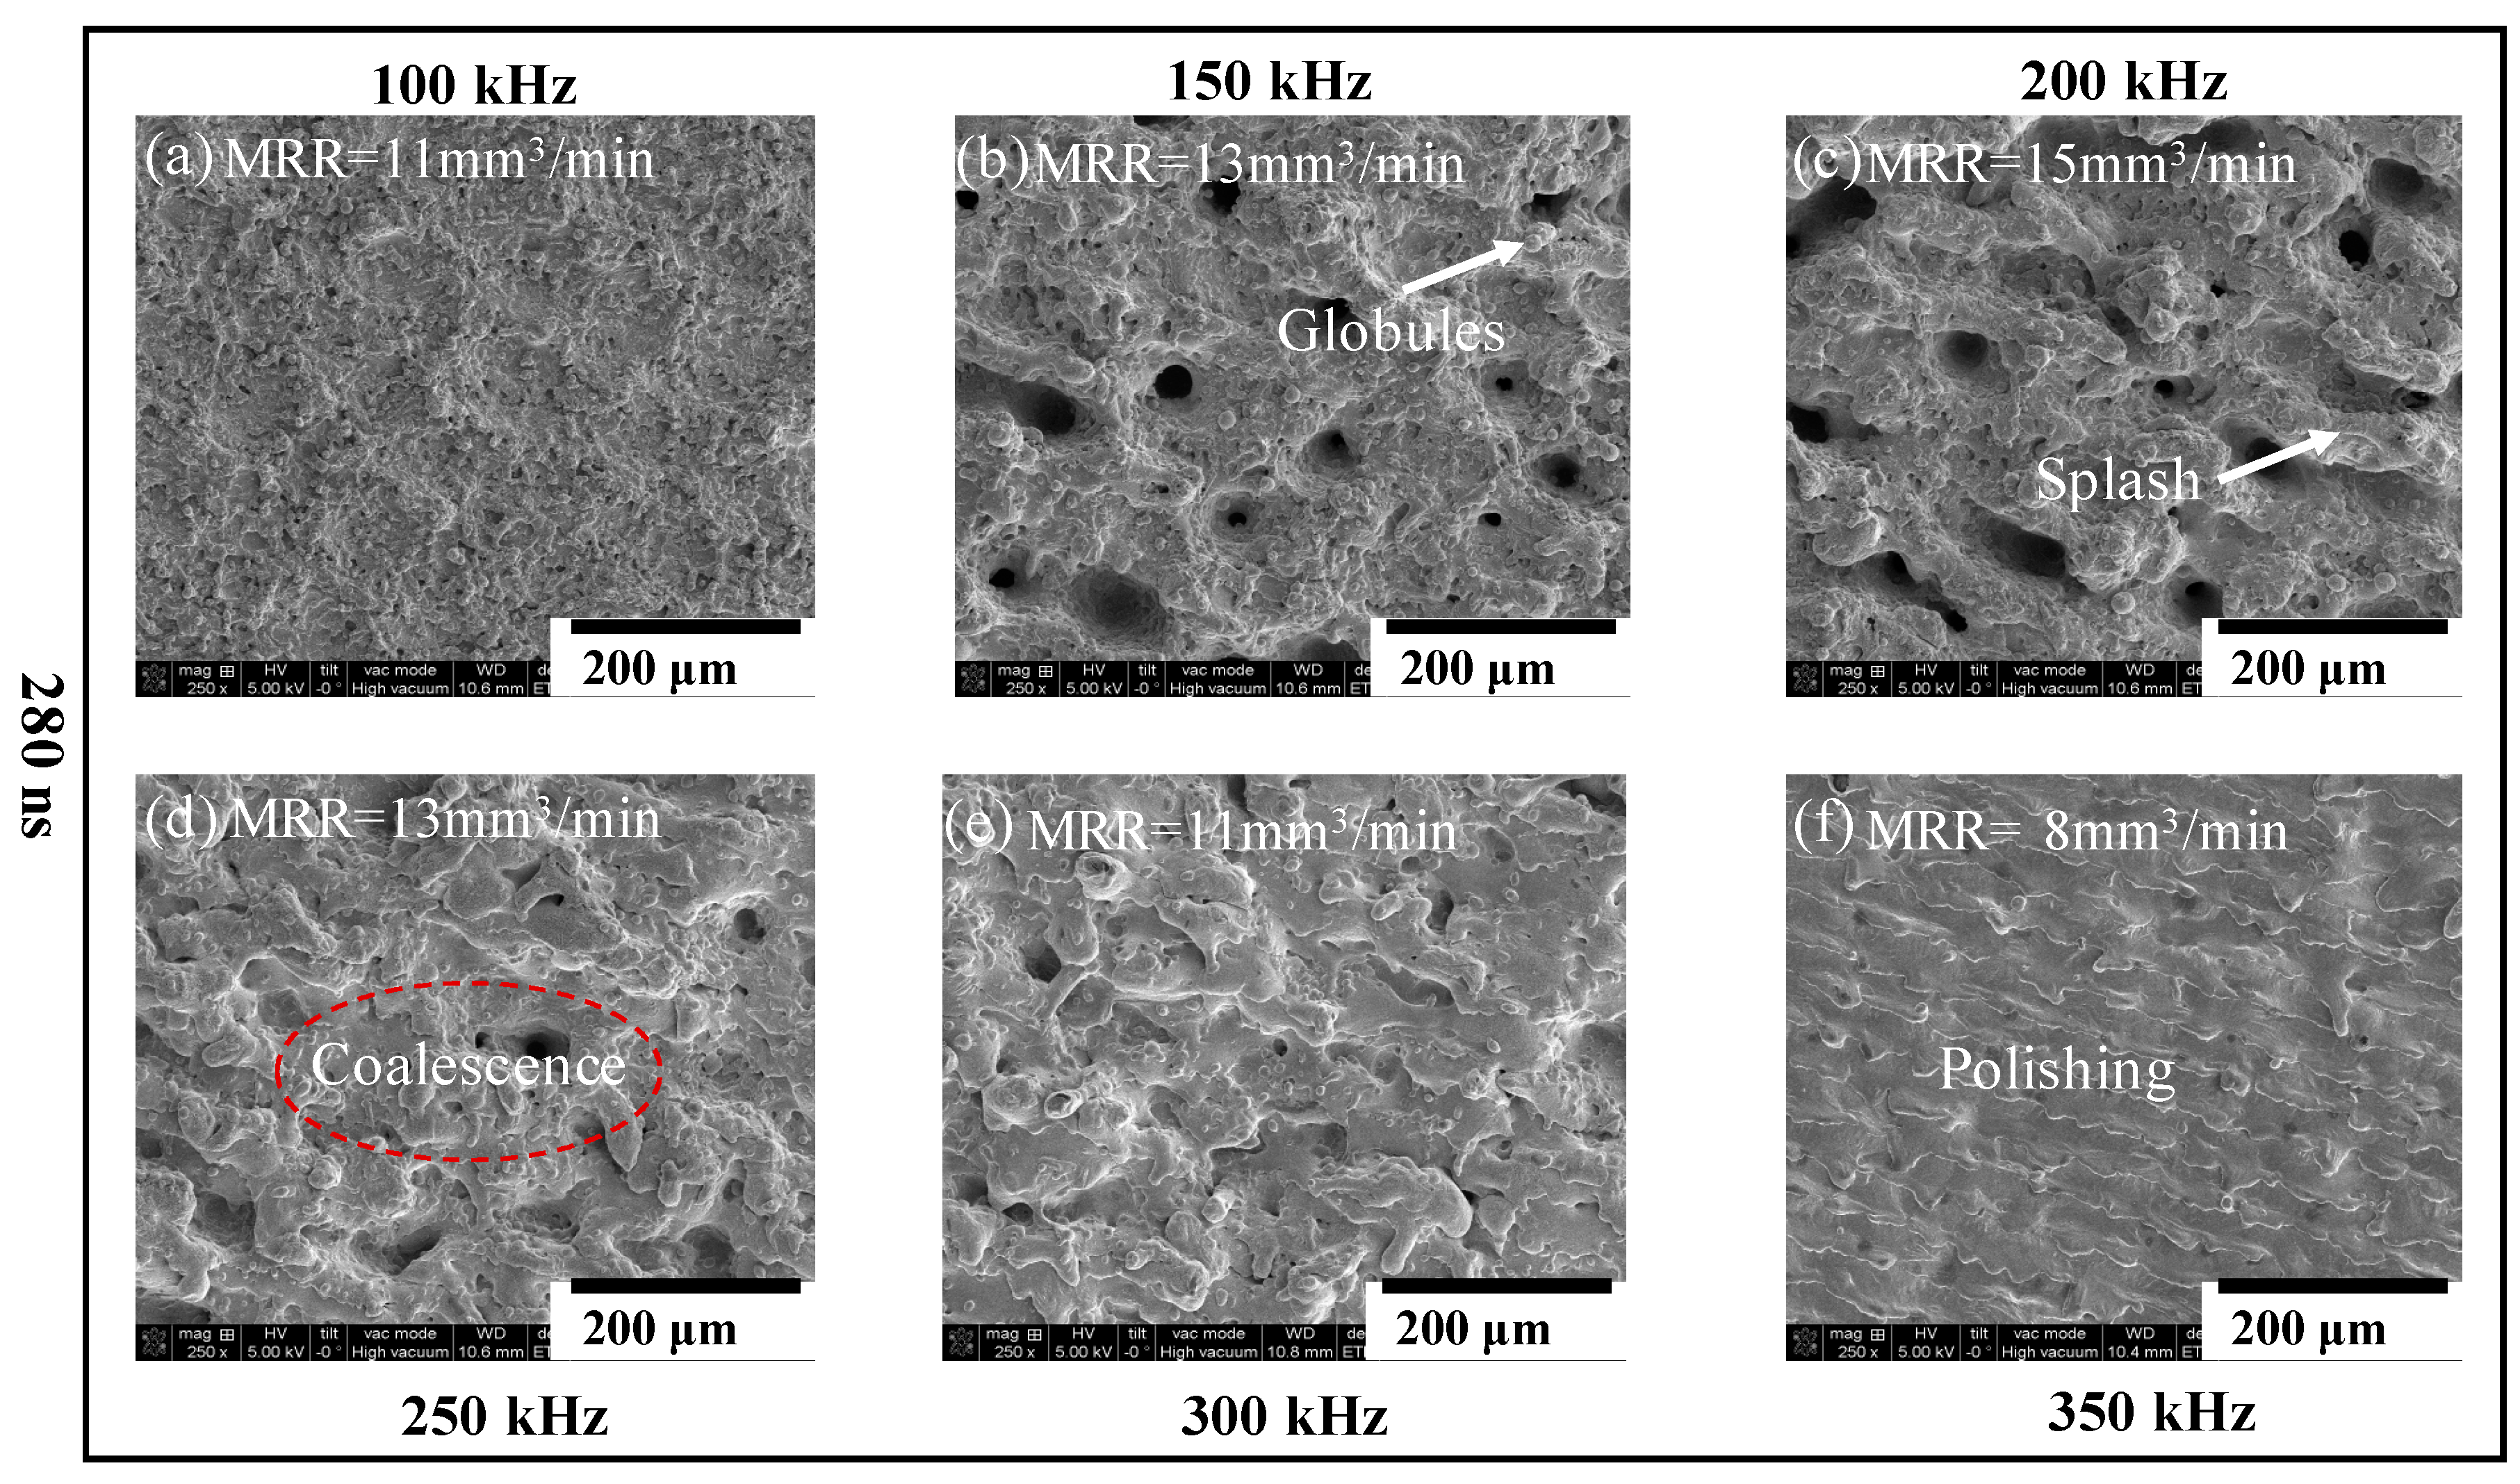
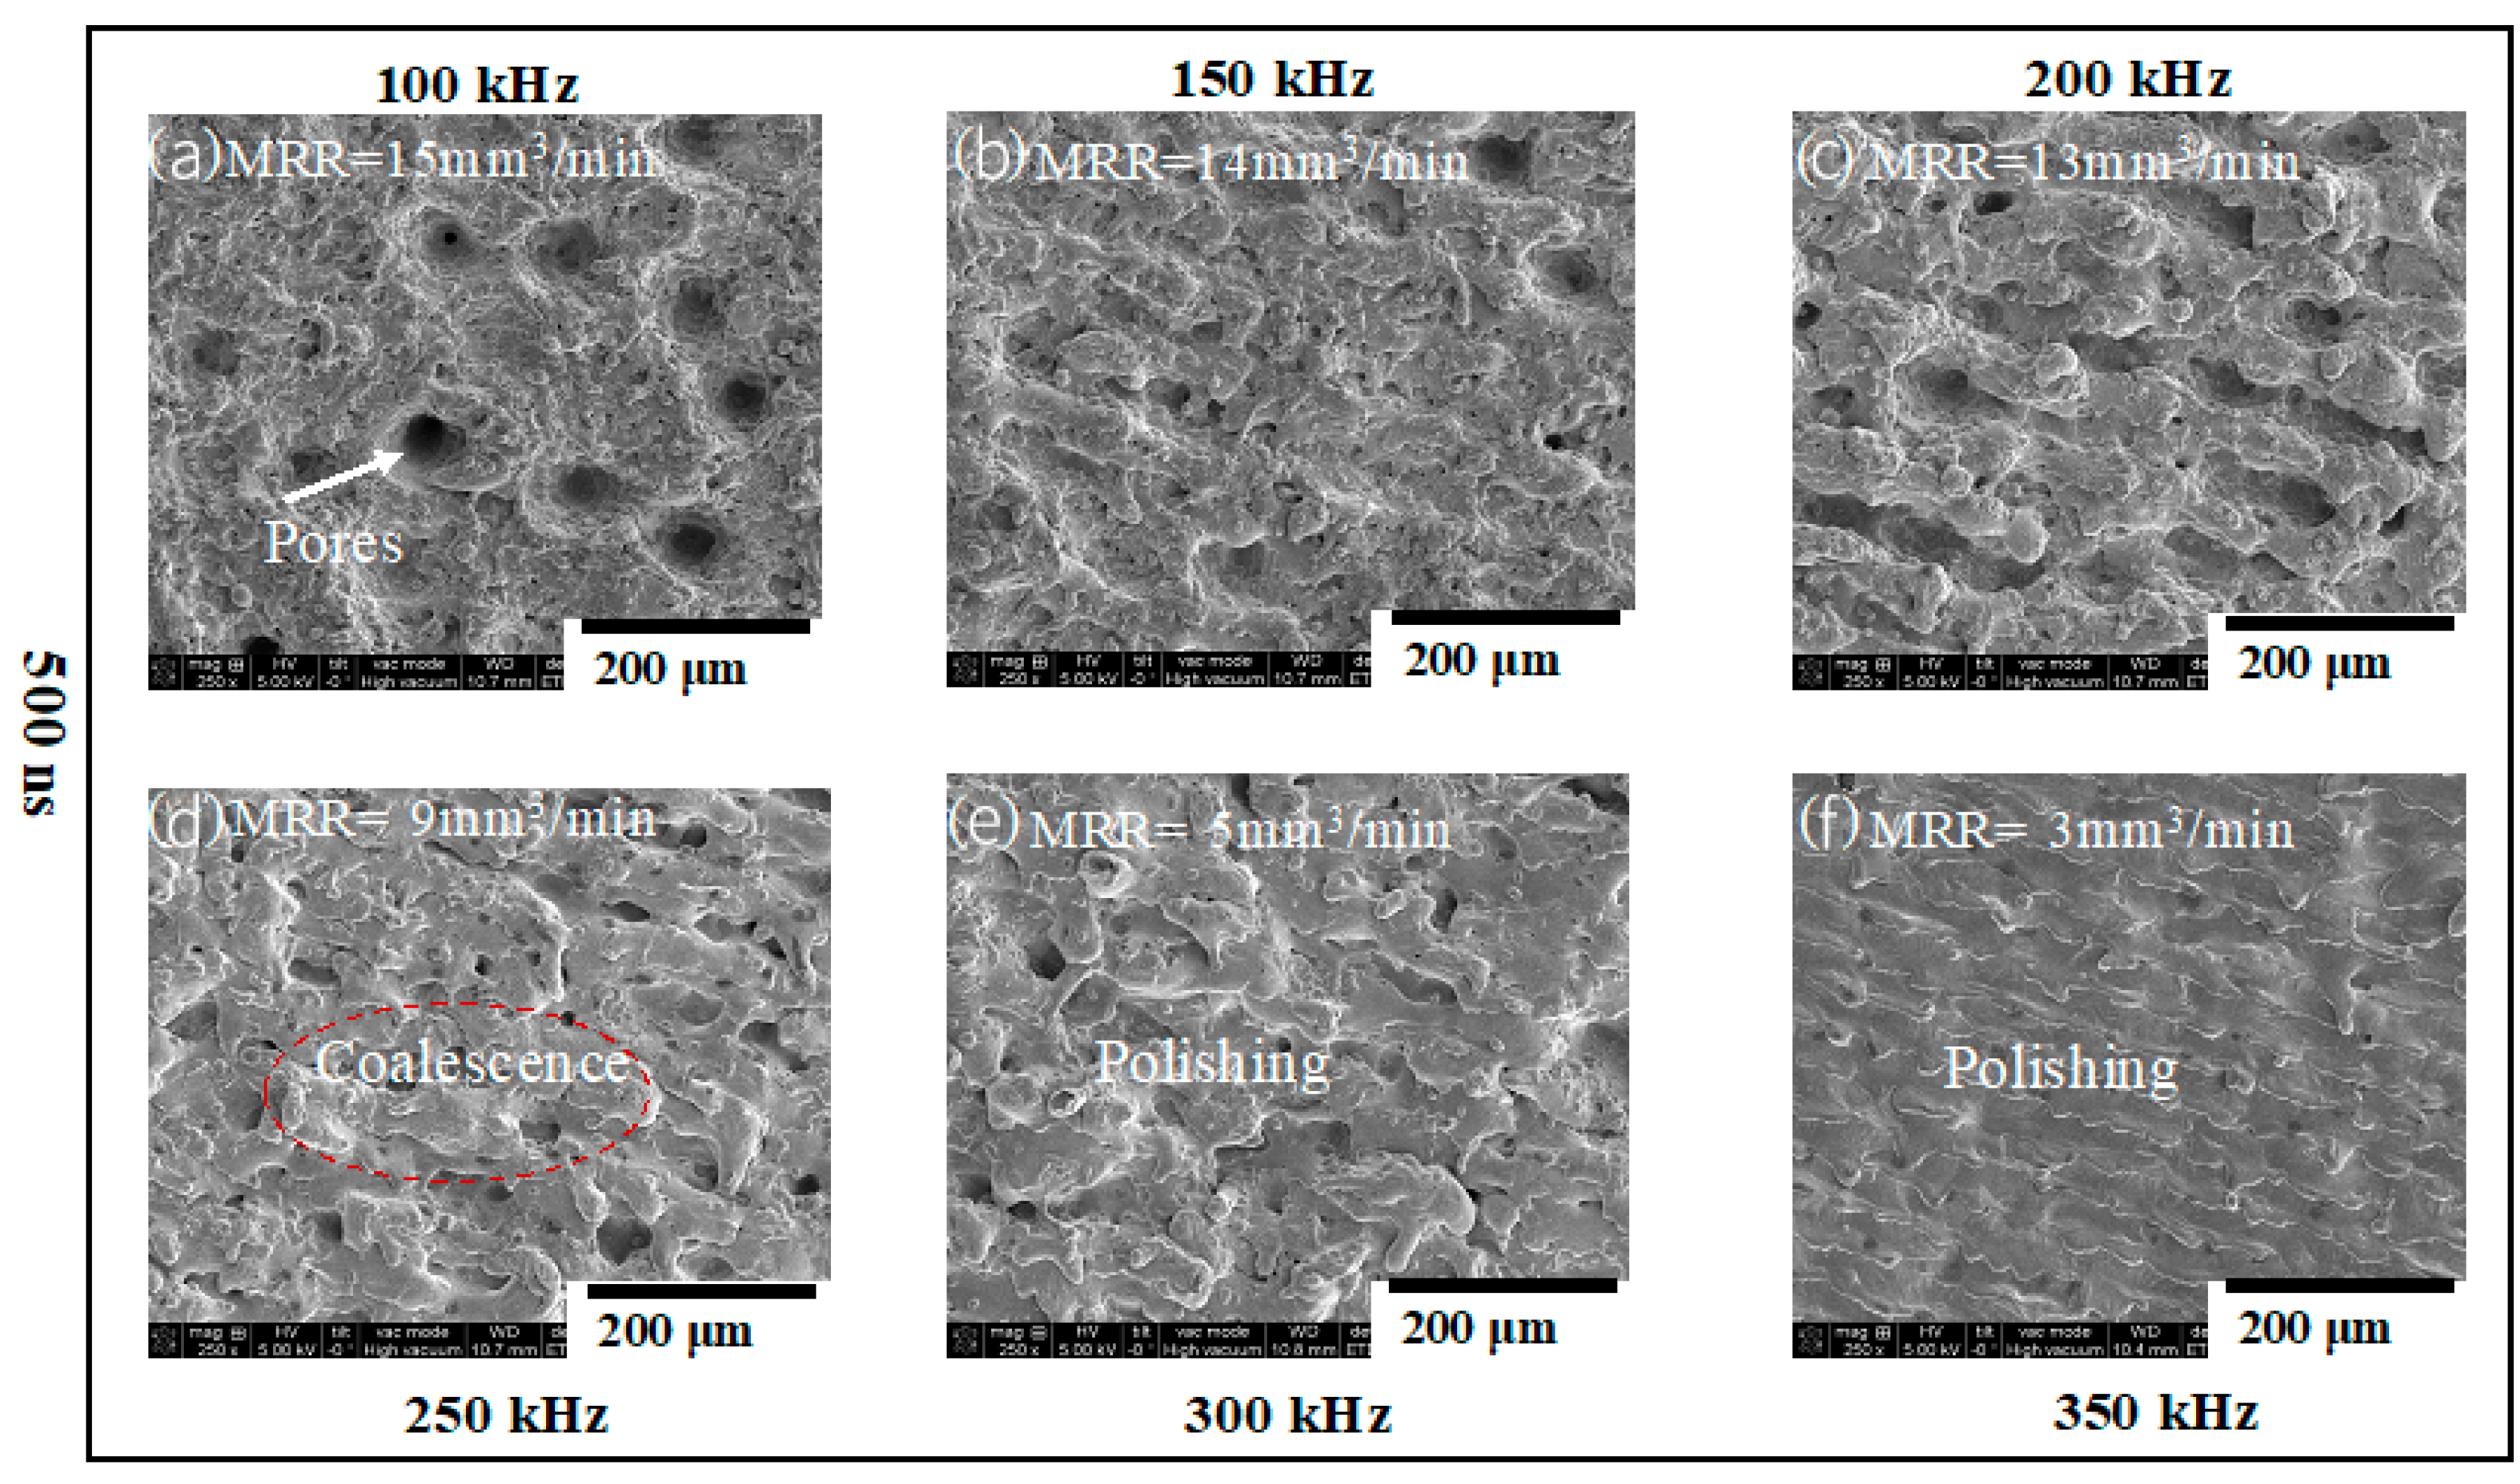
3.2.3. Influence of Change in PRF and τ on the MRR and Sa
4. High-Quality Engraving
5. Conclusions
Author Contributions
Funding
Conflicts of Interest
References
- Lopez, J.; Zaouter, Y.; Torres, R.; Faucon, M.; Hönninger, C.; Georges, P.; Kling, R. Parameters of influence in surface ablation of metals with using a high power tunable ultrafast laser. In Proceedings of the ICALEO 2013—32nd International Congress on Applications of Lasers and Electro-Optics, Miami, FL, USA, 6–10 October 2013. [Google Scholar]
- Lopez, J.; Mishchik, K.; Mincuzzi, G.; Audouard, E.; Mottay, E.; Kling, R. Efficient Metal Processing Using High Average Power Ultrafast Laser. J. Laser Micro/Nanoeng. 2017, 12, 296–303. [Google Scholar] [CrossRef] [Green Version]
- Knowles, M.R.H.; Rutterford, G.; Karnakis, D.; Ferguson, A. Micro-machining of metals, ceramics and polymers using nanosecond lasers. Int. J. Adv. Manuf. Technol. 2007, 33, 95–102. [Google Scholar] [CrossRef]
- Genna, S.; Leone, C.; Lopresto, V.; Santo, L.; Trovalusci, F. Study of fibre laser machining of C45 steel: Influence of process parameters on material removal rate and roughness. Int. J. Mater. Form. 2010, 3 (Suppl. 1), 1115–1118. [Google Scholar] [CrossRef]
- Wu, B.; Deng, L.; Liu, P.; Zhang, F.; Duan, J.; Zeng, X. Effects of picosecond laser repetition rate on ablation of Cr12MoV cold work mold steel. Appl. Surf. Sci. 2017, 409, 403–412. [Google Scholar] [CrossRef]
- Petkov, P.V.; Dimov, S.S.; Minev, R.M.; Pham, D.T. Laser milling: Pulse duration effects on surface integrity. Proc. Inst. Mech. Eng. Part B J. Eng. Manuf. 2008, 222, 35–45. [Google Scholar] [CrossRef] [Green Version]
- Anisimov, S.I.; Luk’yanchuk, B.S. Selected problems of laser ablation theory. Physics-Uspekhi 2002, 45, 293–324. [Google Scholar] [CrossRef] [Green Version]
- Shi, W.; Zhang, Q. High power nanosecond pulsed fiber lasers and applications. In Proceedings of the 2014 IEEE Photonics Conference, IPC 2014, San Diego, CA, USA, 12–16 October 2014; Volume 3, pp. 392–393. [Google Scholar] [CrossRef]
- Su, R.; Zhou, P.; Xiao, H.; Wang, X.; Xu, X. 150 W high-average-power, single-frequency nanosecond fiber laser in strictly all-fiber format. Appl. Opt. 2012, 51, 3655–3659. [Google Scholar] [CrossRef] [PubMed]
- Limpert, J.; Höfer, S.; Liem, A.; Zellmer, H.; Tünnermann, A.; Knoke, S.; Voelckel, H. 100-W Average-Power, High-Energy Nanosecond Fiber Amplifier. Appl. Phys. B. 2002, 75, 477–479. [Google Scholar] [CrossRef]
- Lopez, J.; Mincuzzi, G.; Devillard, R.; Zaouter, Y.; Hönninger, C.; Mottay, E.; Kling, R. Ablation efficiency of high average power ultrafast laser. J. Laser Appl. 2015, 27, S28008. [Google Scholar] [CrossRef]
- Schille, J.; Schneider, L.; Loeschner, U. Process optimization in high-average-power ultrashort pulse laser microfabrication: How laser process parameters influence efficiency, throughput and quality. Appl. Phys. A 2015, 120, 847–855. [Google Scholar] [CrossRef]
- Raciukaitis, G.; Brikas, M.; Gecys, P.; Gedvilas, M. Accumulation effects in laser ablation of metals with high-repetition-rate lasers. In Proceedings of the Volume 7005, High-Power Laser Ablation VII 2008, Taos, NM, USA, 20–24 April 2008; p. 70052. [Google Scholar] [CrossRef]
- Neuenschwander, B.; Jaeggi, B.; Zimmermannn, M.; Markovic, V.; Resan, B.; Weingarten, K.; Penning, L. Laser surface structuring with 100 W of average power and sub-ps pulses. J. Laser Appl. 2016, 28, 022506. [Google Scholar] [CrossRef]
- Deladurantaye, P.; Gay, D.; Cournoyer, A.; Roy, V.; Labranche, B.; Levesque, M.; Taillon, Y. Material micromachining using a pulsed fiber laser platform with fine temporal nanosecond pulse shaping capability. In Proceedings of the SPIE Fiber Lasers VI: Technology, Systems, and Applications, San Jose, CA, USA, 26–29 January 2009; Volume 7195, p. 71951S. [Google Scholar] [CrossRef]
- Schille, J.; Schneider, L.; Streek, A.; Kloetzer, S.; Loeschner, U. High-throughput machining using a high-average power ultrashort pulse laser and high-speed polygon scanner. Opt. Eng. 2016, 55, 096109. [Google Scholar] [CrossRef]
- Raciukaitis, G. Use of High Repetition Rate and High Power Lasers in Microfabrication: How to Keep the Efficiency High? J. Laser Micro/Nanoeng. 2009, 4, 186–191. [Google Scholar] [CrossRef]
- Leone, C.; Bassoli, E.; Genna, S.; Gatto, A. Experimental investigation and optimisation of laser direct part marking of Inconel 718. Opt. Lasers Eng. 2018, 111, 154–166. [Google Scholar] [CrossRef] [Green Version]
- Wlodarczyk, K.; Lopes, A.; Blair, P.; Maroto-Valer, M.M.; Hand, D.P. Interlaced Laser Beam Scanning: A Method Enabling an Increase in the Throughput of Ultrafast Laser Machining of Borosilicate Glass. J. Manuf. Mater. Process. 2019, 3, 14. [Google Scholar] [CrossRef] [Green Version]
- Gora, W.S.; Tian, Y.; Cabo, A.P.; Ardron, M.; Maier, R.R.J.; Prangnell, P.; Hand, D.P. Enhancing surface finish of additively manufactured titanium and cobalt chrome elements using laser based finishing. Phys. Procedia 2016, 83, 258–263. [Google Scholar] [CrossRef]
- Malinowski, A.; Gorman, P.; Codemard, C.A.; Ghiringhelli, F.; Boyland, A.J.; Marshall, A.; Durkin, M.K. High-peak-power, high-energy, high-average-power pulsed fiber laser system with versatile pulse duration and shape. Opt. Lett. 2013, 38, 4686. [Google Scholar] [CrossRef] [PubMed]
- Wlodarczyk, K.L.; Schille, J.; Naumann, L.; Lopes, A.A.; Bitharas, I.; Bidare, P.; Maroto-Valer, M.M. Investigation of an interlaced laser beam scanning method for ultrashort pulse laser micromachining applications. J. Mater. Process. Technol. 2020, 285, 116807. [Google Scholar] [CrossRef]
- Manninen, M.; Hirvimäki, M.; Poutiainen, I.; Salminen, A. Effect of Pulse Length on Engraving Efficiency in Nanosecond Pulsed Laser Engraving of Stainless Steel. Metall. Mater. Trans. B 2015, 46, 2129–2136. [Google Scholar] [CrossRef]
- Vadali, M.; Ma, C.; Duffie, N.A.; Li, X.; Pfefferkorn, F.E. Effects of pulse duration on laser micro polishing. J. Micro Nano-Manuf. 2013, 1, 291–297. [Google Scholar] [CrossRef]


| Scan Speed (mm/s) | |||||||
|---|---|---|---|---|---|---|---|
| 17 ns 1000 kHz 0.11 mJ | 60 ns 340 kHz 0.32 mJ | 150 ns 175 kHz 0.62 mJ | 280 ns 100 kHz 1.1 mJ | 380 ns 100 kHz 1.1 mJ | 500 ns 100 kHz 1.1 mJ | ||
| 379 | 0.28 | = 0.4 µm Po = 99% | = 1.1 µm Po = 97% | = 2.2 µm Po = 94% | = 3.8 µm Po = 90% | = 3.8 µm Po = 90% | = 3.8 µm Po = 90% |
| 759 | 0.14 | = 0.8 µm Po = 98% | = 2.2 µm Po = 94% | = 4.3 µm Po = 89% | = 7.6 µm Po = 80% | = 7.6 µm Po = 80% | = 7.6 µm Po = 80% |
| 1140 | 0.09 | = 1.1 µm Po = 97% | = 3.4 µm Po = 91% | = 6.5 µm Po = 82% | = 11.4 µm Po = 70% | = 11.4 µm Po = 70% | = 11.4 µm Po = 70% |
| 1520 | 0.07 | = 1.5 µm Po = 96% | = 4.5 µm Po = 88% | = 8.7 µm Po = 77% | = 15.2 µm Po = 60% | = 15.2 µm Po = 60% | = 15.2 µm Po = 60% |
| 1900 | 0.06 | = 1.9 µm Po = 95% | = 5.6 µm Po = 85% | = 10.9 µm Po = 71% | = 19 µm Po = 50% | = 19 µm Po = 50% | = 19 µm Po = 50% |
| 2280 | 0.05 | = 2.3 µm Po = 94% | = 6.7 µm Po = 82% | = 13.0 µm Po = 66% | = 22.8 µm Po = 40% | = 22.8 µm Po = 40% | = 22.8 µm Po = 40% |
| 3000 | 0.04 | = 3.0 µm Po = 92% | = 8.8 µm Po = 77% | = 17.1 µm Po = 55% | = 30 µm Po = 21% | = 30 µm Po = 21% | = 30 µm Po = 21% |
| 3420 | 0.03 | = 3.4 µm Po = 91% | = 10.1 µm Po = 74% | = 19.5 µm Po = 49% | = 34.2 µm Po = 10% | = 34.2 µm Po = 10% | = 34.2 µm Po = 10% |
| PRF (kHz) | Ep (mJ) | Po (%) at 0.09 J/mm |
|---|---|---|
| 100 | 1.08 | 70 |
| 150 | 0.72 | 80 |
| 200 | 0.54 | 85 |
| 250 | 0.43 | 88 |
| 300 | 0.36 | 90 |
| 350 | 0.31 | 91 |
| 400 | 0.25 | 93 |
Publisher’s Note: MDPI stays neutral with regard to jurisdictional claims in published maps and institutional affiliations. |
© 2020 by the authors. Licensee MDPI, Basel, Switzerland. This article is an open access article distributed under the terms and conditions of the Creative Commons Attribution (CC BY) license (http://creativecommons.org/licenses/by/4.0/).
Share and Cite
Dondieu, S.D.; Wlodarczyk, K.L.; Harrison, P.; Rosowski, A.; Gabzdyl, J.; Reuben, R.L.; Hand, D.P. Process Optimization for 100 W Nanosecond Pulsed Fiber Laser Engraving of 316L Grade Stainless Steel. J. Manuf. Mater. Process. 2020, 4, 110. https://0-doi-org.brum.beds.ac.uk/10.3390/jmmp4040110
Dondieu SD, Wlodarczyk KL, Harrison P, Rosowski A, Gabzdyl J, Reuben RL, Hand DP. Process Optimization for 100 W Nanosecond Pulsed Fiber Laser Engraving of 316L Grade Stainless Steel. Journal of Manufacturing and Materials Processing. 2020; 4(4):110. https://0-doi-org.brum.beds.ac.uk/10.3390/jmmp4040110
Chicago/Turabian StyleDondieu, Stephen D., Krystian L. Wlodarczyk, Paul Harrison, Adam Rosowski, Jack Gabzdyl, Robert L. Reuben, and Duncan P. Hand. 2020. "Process Optimization for 100 W Nanosecond Pulsed Fiber Laser Engraving of 316L Grade Stainless Steel" Journal of Manufacturing and Materials Processing 4, no. 4: 110. https://0-doi-org.brum.beds.ac.uk/10.3390/jmmp4040110