Article

In-Line Height Measurement Technique for Directed Energy Deposition Processes

1
Faculty of Engineering, University of Deusto, Avenida de las Universidades 24, 48007 Bilbao, Spain
2
LORTEK Technological Centre, Basque Research and Technology Alliance (BRTA), Arranomendia Kalea 4A, 20240 Ordizia, Spain
*
Author to whom correspondence should be addressed.
J. Manuf. Mater. Process. 2021, 5(3), 85; https://0-doi-org.brum.beds.ac.uk/10.3390/jmmp5030085
Submission received: 9 July 2021 / Revised: 30 July 2021 / Accepted: 4 August 2021 / Published: 5 August 2021

Abstract

:
Directed energy deposition (DED) is a family of additive manufacturing technologies. With these processes, metal parts are built layer by layer, introducing dynamics that propagate in time and layer-domains, which implies additional complexity and consequently, the resulting part quality is hard to predict. Control of the deposit layer thickness and height is a critical issue since it impacts on geometrical accuracy, process stability, and the overall quality of the product. Therefore, online feedback height control for DED processes with proper sensor strategies is required. This work presents a novel vision-based triangulation technique through an off-axis located CCD camera synchronized with a 640 nm wavelength pulsed illumination laser. Image processing and machine vision techniques allow in-line height measurement right after metal solidification. The linearity and the precision of the proposed setup are validated through off-and in-process trials in the laser metal deposition (LMD) process. Besides, the performance of the developed in-line inspection system has also been tested for the Arc based DED process and compared against experimental weld bead characterization data. In this last case, the system additionally allowed for the measurement of weld bead width and contact angles, which are critical in first runs of multilayer buildups.

1. Introduction

Directed energy deposition (DED) is a family of additive manufacturing (AM) technologies that is characterized by a concentrated energy source and a feed of raw material intersect in the interaction point, commonly protected from oxidation by an inert shield gas. The applied energy melts the raw materials forming a melt pool, a liquid material in the interaction point. Depending on feedstock type, DED processes are divided into powder feed and wire-feed based. According to the ISO/ASTM 52900 standard [1], DED is the AM process in which focused thermal energy is used to fuse materials by melting as they are being deposited. “Focused thermal energy” means that an energy source (for example, laser, electron beam, or plasma arc) is focused to melt the materials being deposited. More in detail, the ASTM F3187 standard [2] guidelines details the components of DED systems, which are made up of four fundamental subcomponents: heat source, positioner (motion), feedstock feed mechanism, and a computer control system. Powder based DED predominantly uses a laser beam as the heat source and metal powder as the feedstock, so called powder based laser metal deposition (LMD-p) [3,4]. Wire based DED processes result in lower resolution compared to LMD-p, but provide a higher deposition rate and allow for the fabrication of larger structures [5,6]. Among wire-based DED, special attention has been given to wire-Arc additive manufacturing (WAAM) that uses metal wire as the feedstock and an electric arc as the energy source.
The directed energy deposition (DED) processes were born as an “open-loop” control manufacturing process, but at present, the researchers and specialized manufacturers can offer it as a “closed-loop” control process and it is possible to modify the laser and other parameters if the analysis of some key process parameters (KPPs) warrants it. These mainly focus on molten pool temperature, melt pool size, and layer height [5,6], and the idea is to reduce the thermal distortion, residual stresses, and cracking.
A complicated interplay of process parameters (powder or wire feed rate, scanning speed, laser power or current, spot diameter, trajectory, kinematic precision, material properties, gas flow rate etc.) and high sensibility to small fluctuations of the input parameters makes it nearly impossible to elaborate accurate physical models of the DED processes to predict and control the geometry and quality of the fabricated part simultaneously. Control of the deposit layer thickness and height is a critical issue since it impacts on the geometrical accuracy and overall quality of the product [4]. The laser metal deposition (LMD-p) is a class of additive manufacturing DED processes where the powder along with an inert gas are delivered to a laser-powder interaction point through a nozzle coaxial or lateral to the laser beam optical axis. The laser interacts with a substrate material and the delivered metal powder creates a hot liquid metal region commonly called melt pool. Due to the movement of the laser beam relative to the substrate, a deposition track is fabricated in an additive manner, layer by layer [3,4] and the overlap of tracks creates each layer.
Wire-arc additive manufacturing (WAAM) is another directed energy deposition technology that uses the arc welding process, instead of laser, to 3D print metal parts. Unlike metal powder AM processes, WAAM works by melting metal wire using an electric arc as the heat source. The melted material is deposited upon a base material creating a metallic layer. By repeating the process layer by layer a 3D part is generated [
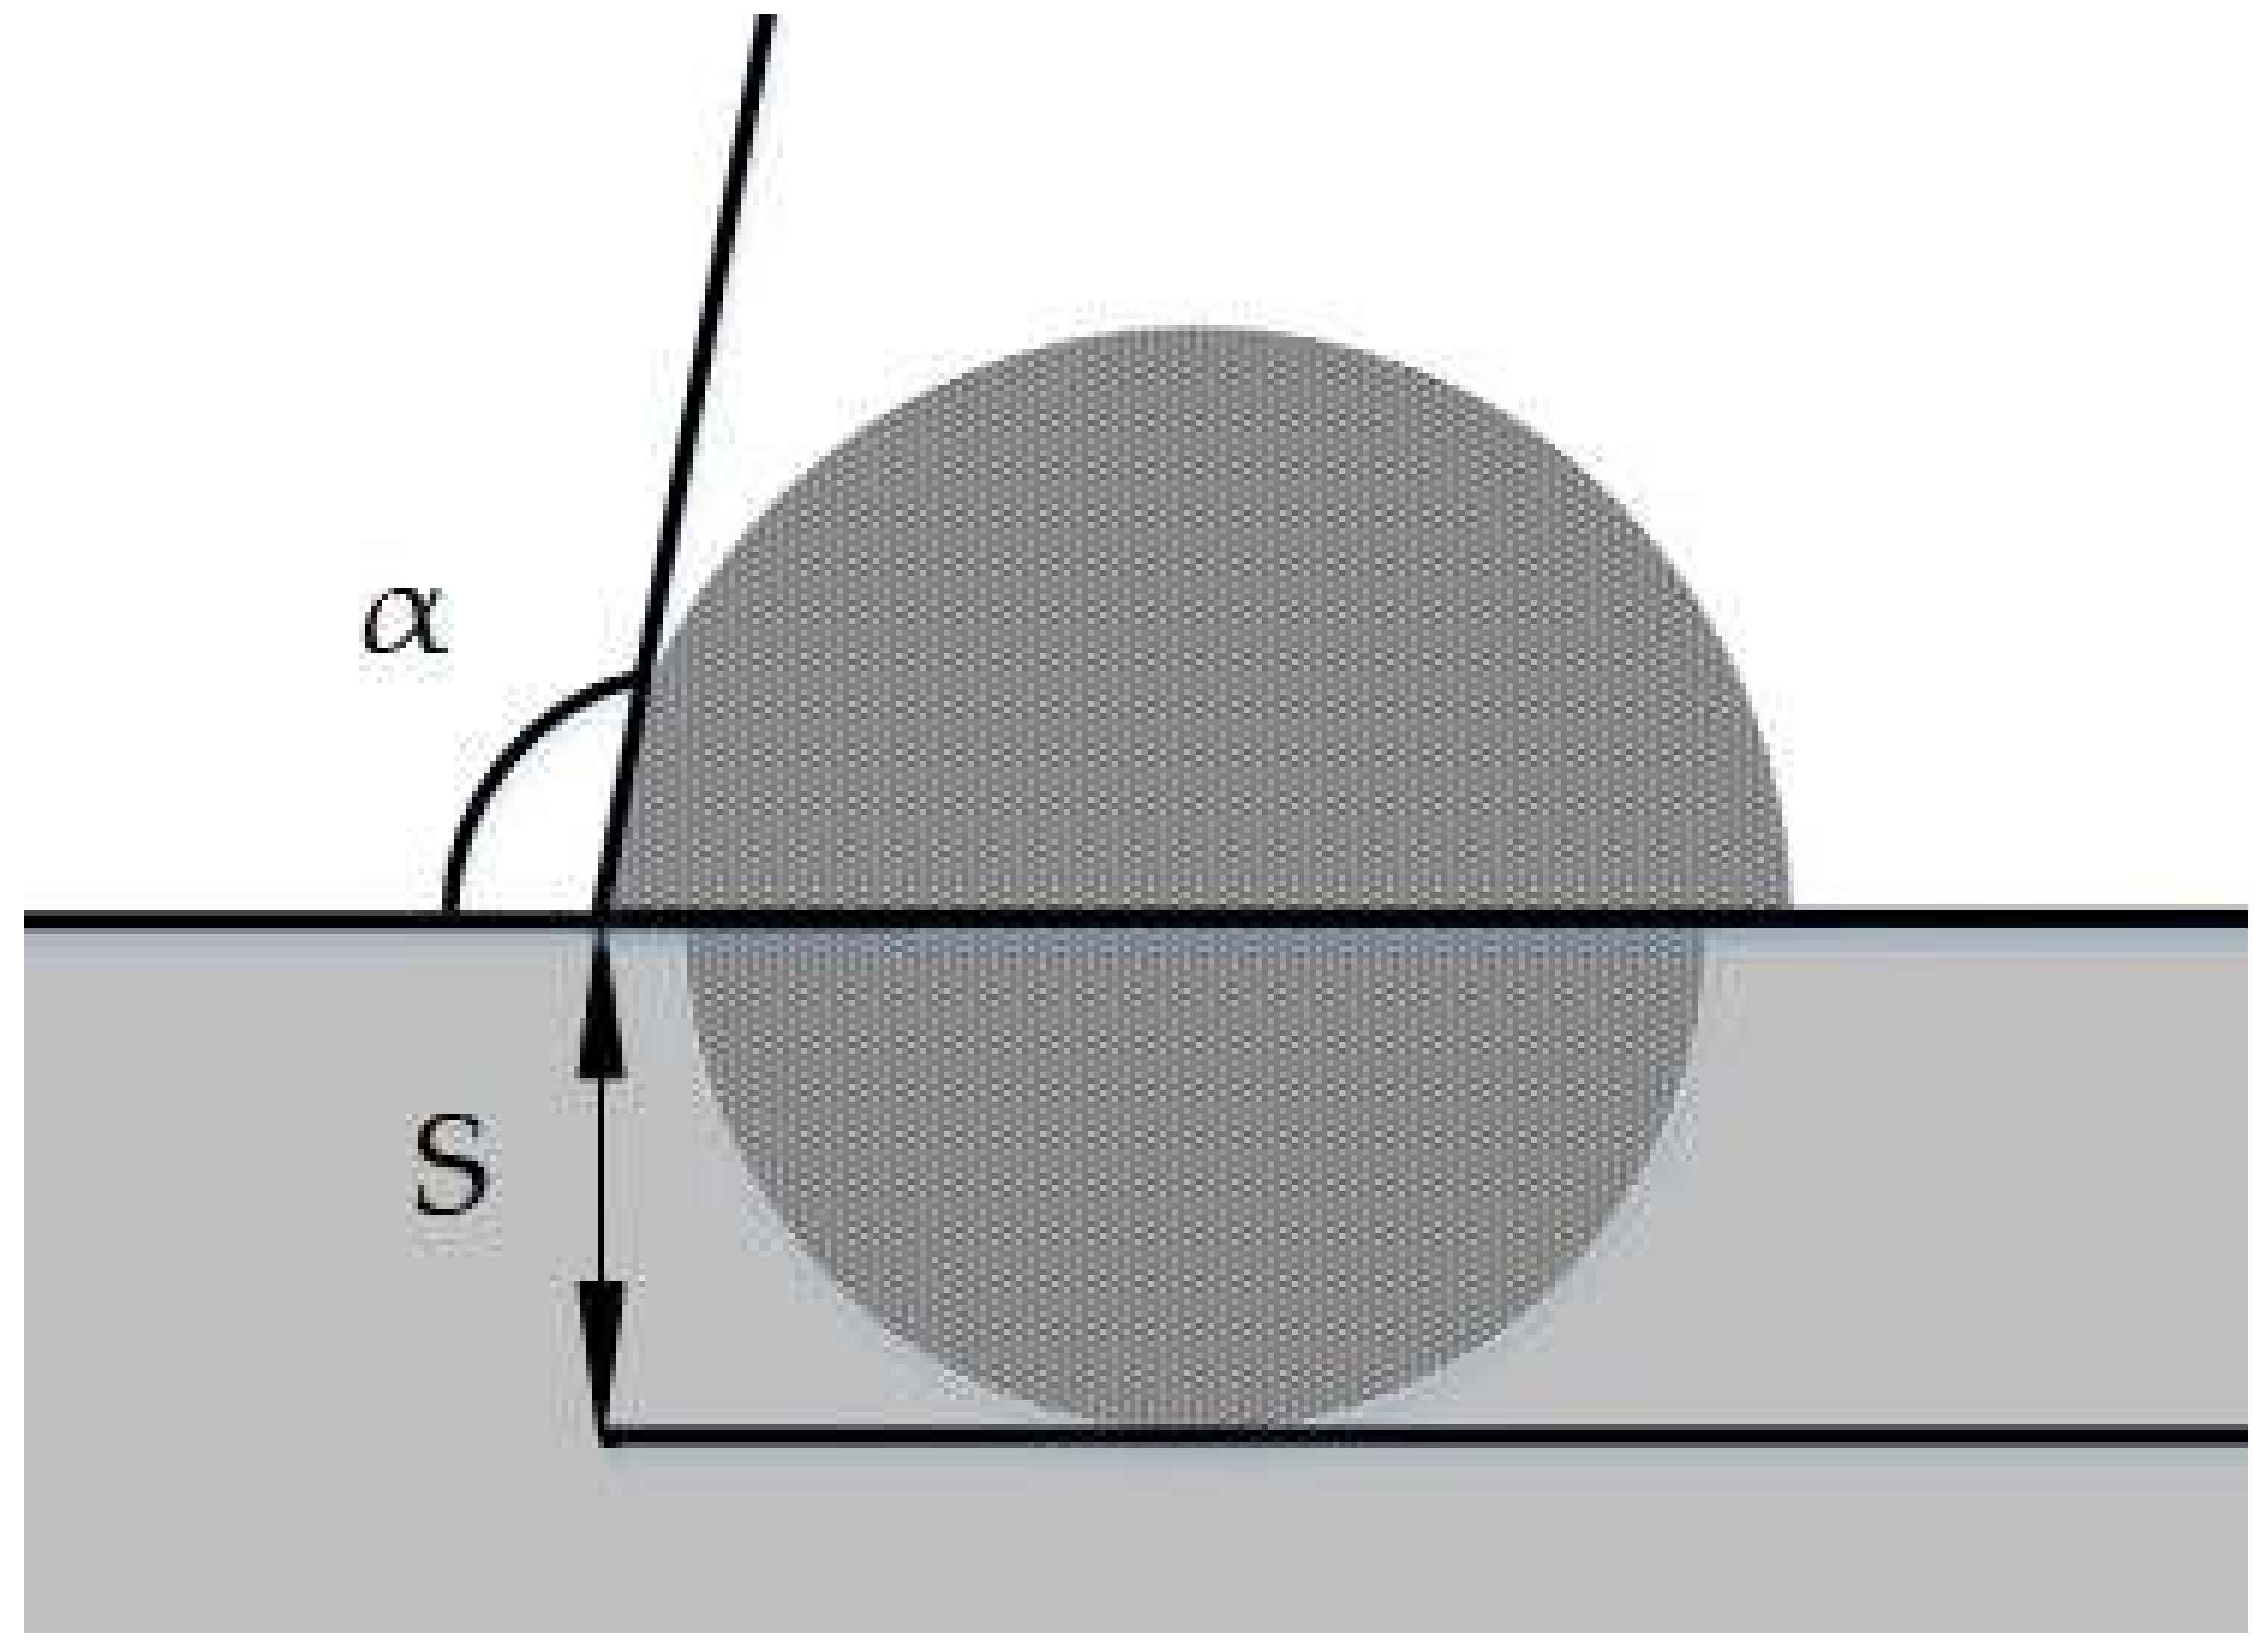
5]. During the manufacturing of the first layer, one aspect that determines the quality of the bonding between the deposited layer and the base material is the wetting angle (also known as contact angle, α). A contact angle is the angle that a liquid makes with a solid at the solid/liquid/vapor interface. Each liquid–solid combination forms a characteristic contact angle at the interface. In most cases, a change in the properties of the solid’s surface will be measurable by a change in the contact angle and penetration S. This wetting angle (Figure 1) may be defined as the angle that a droplet of metal liquid makes at the contact point with the surface.
Wetting angles close to or higher than 90° are related to the likelihood of generating a lack of fusion defect with the substrate. Selection of the right welding parameters in this first layer is critical due to the enhanced heat sinking effect along the substrate. This is particularly critical for aluminum parts, which usually require an adaptation of the welding current to counter the enhanced heat sinking along the substrate. For that purpose, an in-line measurement of the wetting angle is desirable. Because this opens up the possibility of taking corrective actions during the process by acting upon the heat source and thus avoiding, consequently, scrap generation. However, this must obviously rely on reliable in-line measurement of the first WAAM track, which is related to weld overlay cladding (WOC) and this is precisely the scope of this second use case.
Regarding WAAM sensing and control, these are still at the very early stage of their development [7]. Pioneering studies focused on monitoring and controlling the width and the height of the layers in walls. Monitoring of melt pool during WAAM is very challenging due to the strong influence of welding arc, and visual sensing has been used to monitor the weld bead behind the welding area with a certain distance lag [8,9]. In these studies, CCD cameras and special filtering and edge detection algorithms were developed. Xiong et al. proposed adjusting the travel speed to compensate for layer height deviations during WAAM [10]. Recently, different multi-sensor monitoring systems have been developed for WAAM processes [11,12]. Previous closed-loop control systems have relied only on one physical phenomenon (temperature, weld geometry, …) and this was insufficient to effectively control WAAM under different operating conditions. Modern multiple monitoring concepts for WAAM are based on a combination of thermal, geometrical, and environmental data. Despite the monitoring performance of these multi-sensor systems having been validated in some WAAM trials, they still need to be further developed to demonstrate the possibility of detecting defects in-line and to use them as input for more advanced close-loop control solutions [12].
With respect to LMD, harsh environmental conditions of LMD and the resulting high temperature dictate the usage of non-contact height measuring techniques, thus optical techniques are considered the most suitable [13,14,15]. Various approaches for height monitoring systems in the DED processes have been reported in the literature: charged couple device (CCD) cameras [13,14,15,16,17,18,19,20,21,22], laser triangulation displacement sensors [23,24,25,26,27,28], stigmometer [29], structured light 3D imaging [30], and optical coherence tomography [31,32].
Nevertheless, all of them have their advantages and disadvantages. Direct imaging acquisition and analysis of the melt pool with CCD cameras requires physical modeling since the borders of the melt pool are hard to distinguish and the height measurement cannot be performed directly. Due to a nonlinear relationship between the melt pool shape and the DED track shape, direct imaging of the melt pool borders does not guarantee accurate track height prediction [11].
The advantages of laser triangulation displacement sensors are as follows: it can be used for 1D (point), 2D (line), and 3D (structured grid) height measurements; accuracy down to 10 µm; and measurement frequency up to 300 kHz. On the other hand, the process laser and thermal emission disturbs the height measurements and this, together with dimensional constraints, does not allow for in-line height monitoring. Most of the times, this results in off-line measurements, which means the process is stopped to scan the whole area for a number of selected layers, which causes a loss in productivity [14,15,16,17,18,19].
This paper describes a vision-based triangulation technique, shape-from-shadow (SFS), that utilizes a 640 nm wavelength pulsed laser illumination with a shadow pattern projected onto the LMD and WAAM tracks and one off-axis located CCD camera synchronized with the illumination laser to capture images of the illuminated LMD and WAAM tracks with a shadow pattern. This approach has the same advantages as the conventional triangulation system, but can be used in-line without stopping the production process. Usage of the narrowband optical filter together with placement of SFS away from the melt pool eliminates interference with the process emission. Consequently, it is possible to perform the height measurement of only the solidified deposit close to the melt pool. SFS is seemingly similar to a structured light technique, but there are a number of differences. First, in SFS, shadow patterns are projected instead of laser patterns. Second, structured light utilizes interchanging patterns to perform the measurement while SFS uses a single static shadow pattern throughout the entire fabrication. Due to the fact that SFS is a vision based measurement technique, a visual inspection of the process conditions is possible in real time, although this analysis is not included in this paper. Therefore, it is an appealing alternative to existing solutions as it offers complementary features to the conventional laser triangulation. The proposed technique can reduce the time it takes to fabricate an LMD and WOC part, ensure the near-net-shape fabrication, enable closed-loop height control, and reduce the person-hour [33].
The current work is organized as follows. Section 2 presents the system design and implementation and covers the basic principles of SFS for a DED layer height measurement and the hardware arrangement of the proposed SFS setup for the LMD process. The WOC hardware specifications and the process parameters are also given in this section. 
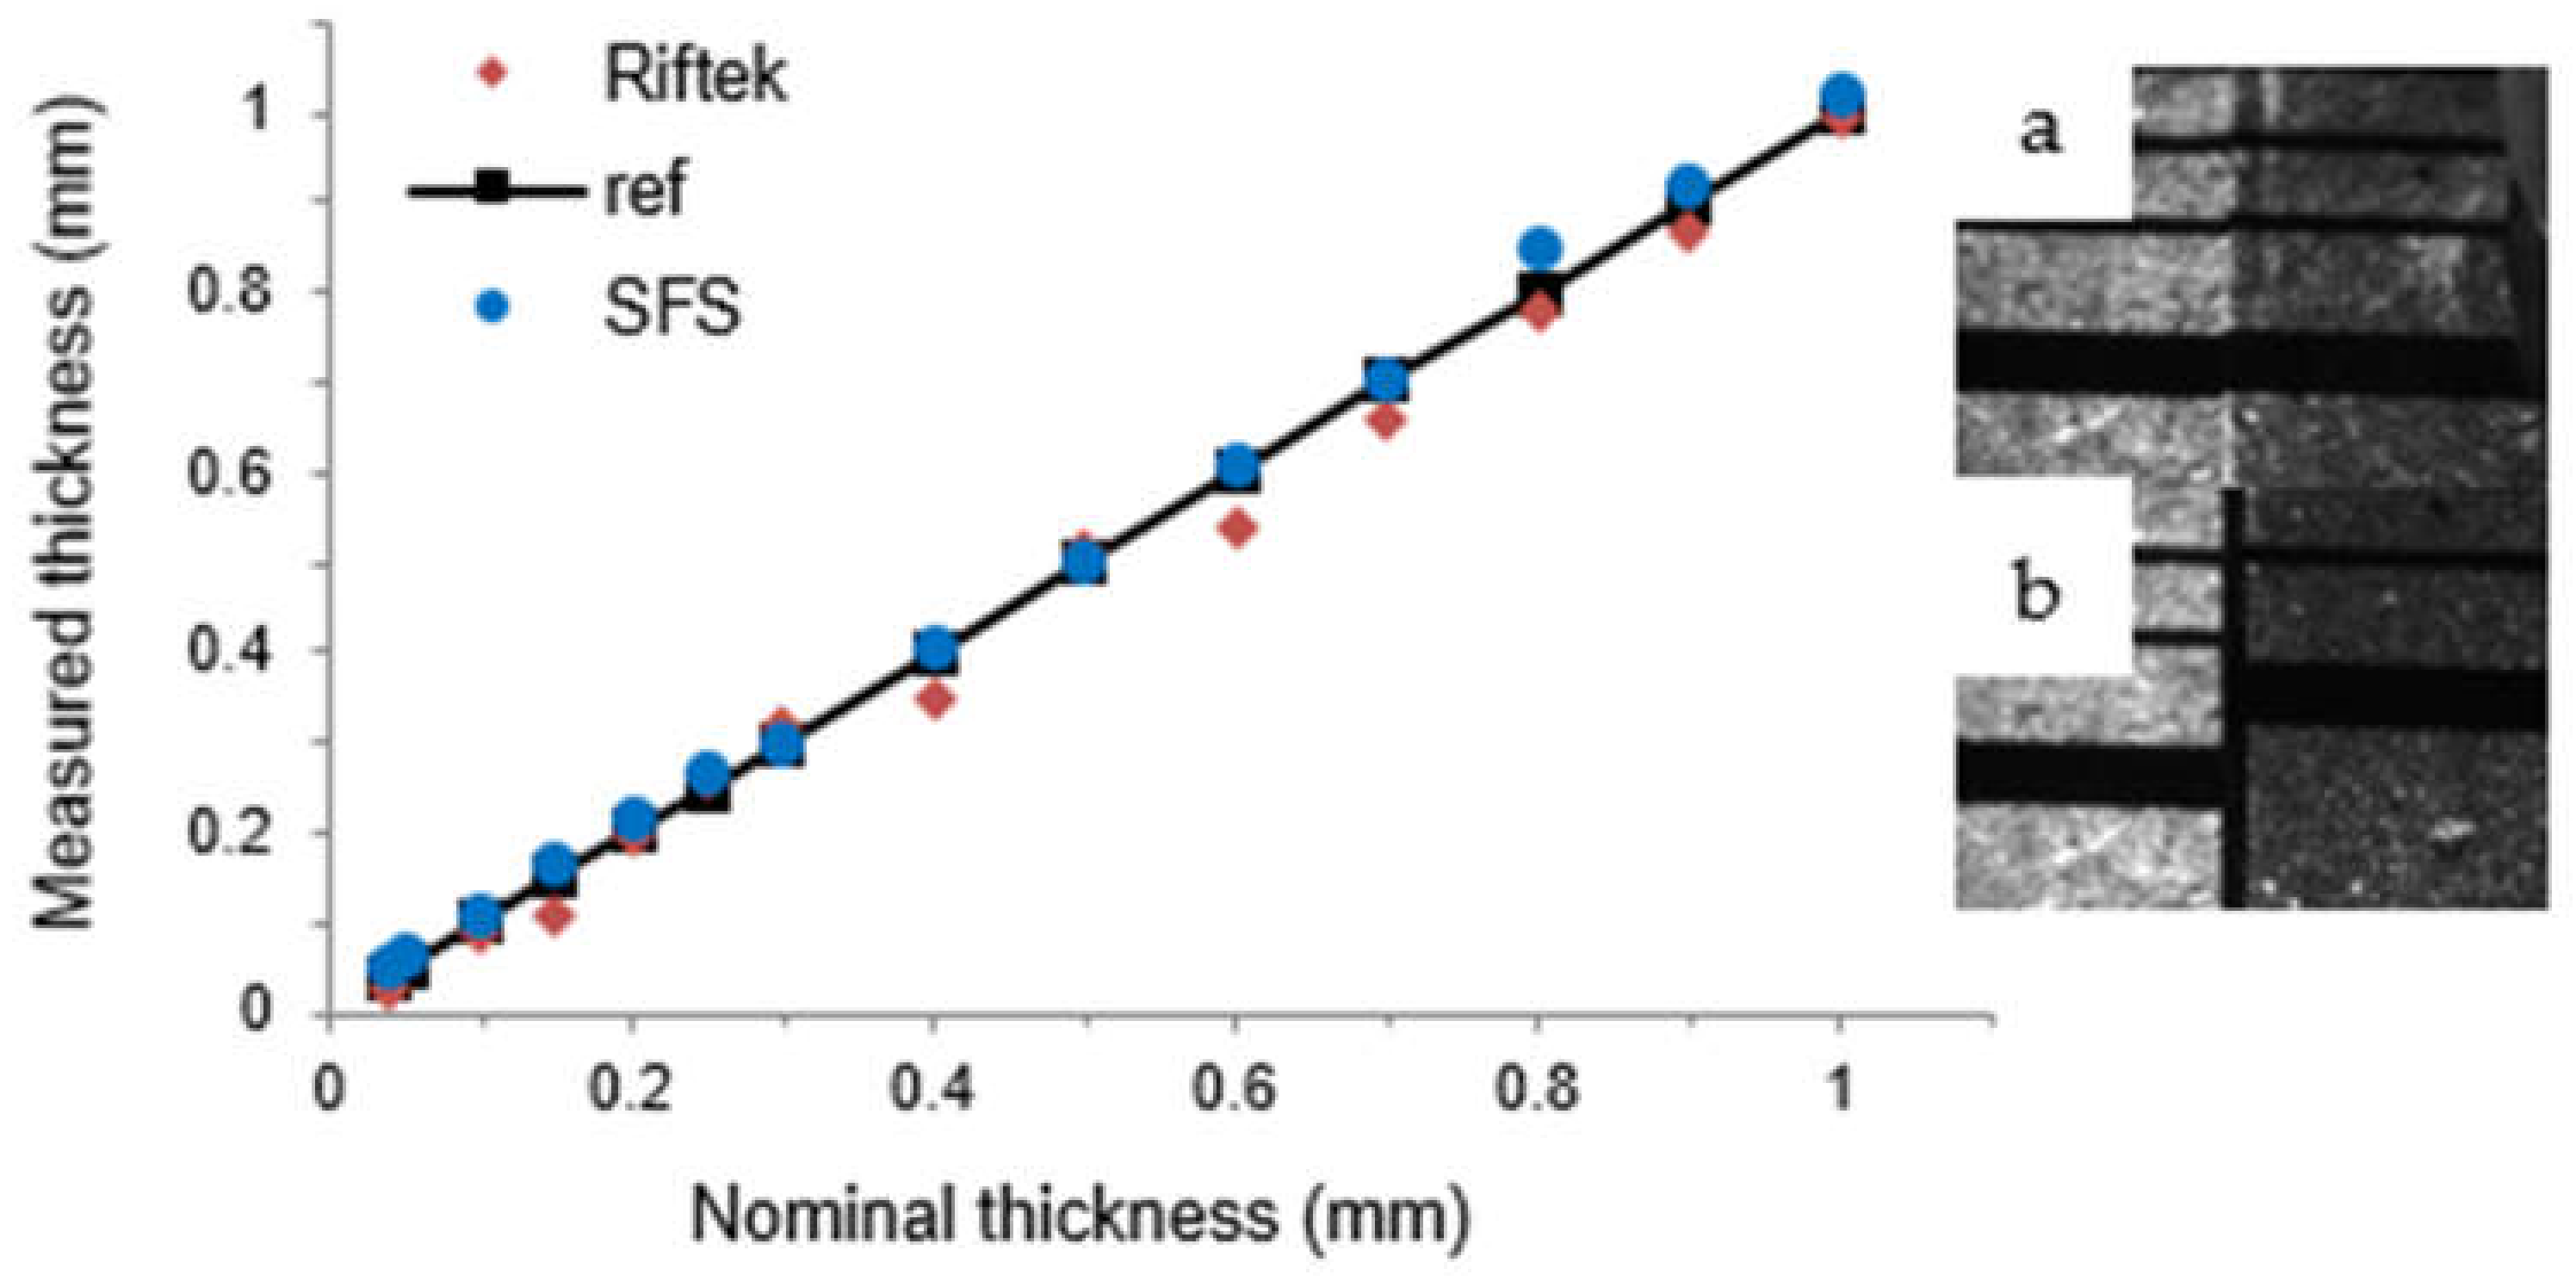
Section 3 describes the system calibration and includes the validation of the proposed technique through a comparative study with a 2D laser triangulation sensor measurement and corresponding values of the linearity and precision. Section 4 shows the experimental results and its analysis, in which the case studies of the in-line height measurement of an LMD single track multi-layer structure (thin wall) and WOC width, height, and contact angle measurements with SFS are described and evaluated. Finally, the main conclusions are summarized in Section 5.

2. System Design and Implementation

2.1. Shape-from-Shadow Working Principle

Shape-from-shadow is an active triangulation technique for 3D geometry measurement based on a laser triangulation principle that differs from conventional methods by projecting a shadow pattern instead of light. In addition, pulsed laser is employed—synchronized with camera exposure—which eliminates the influence of the radiation stemming from the process. The set-up is show in Figure 2.
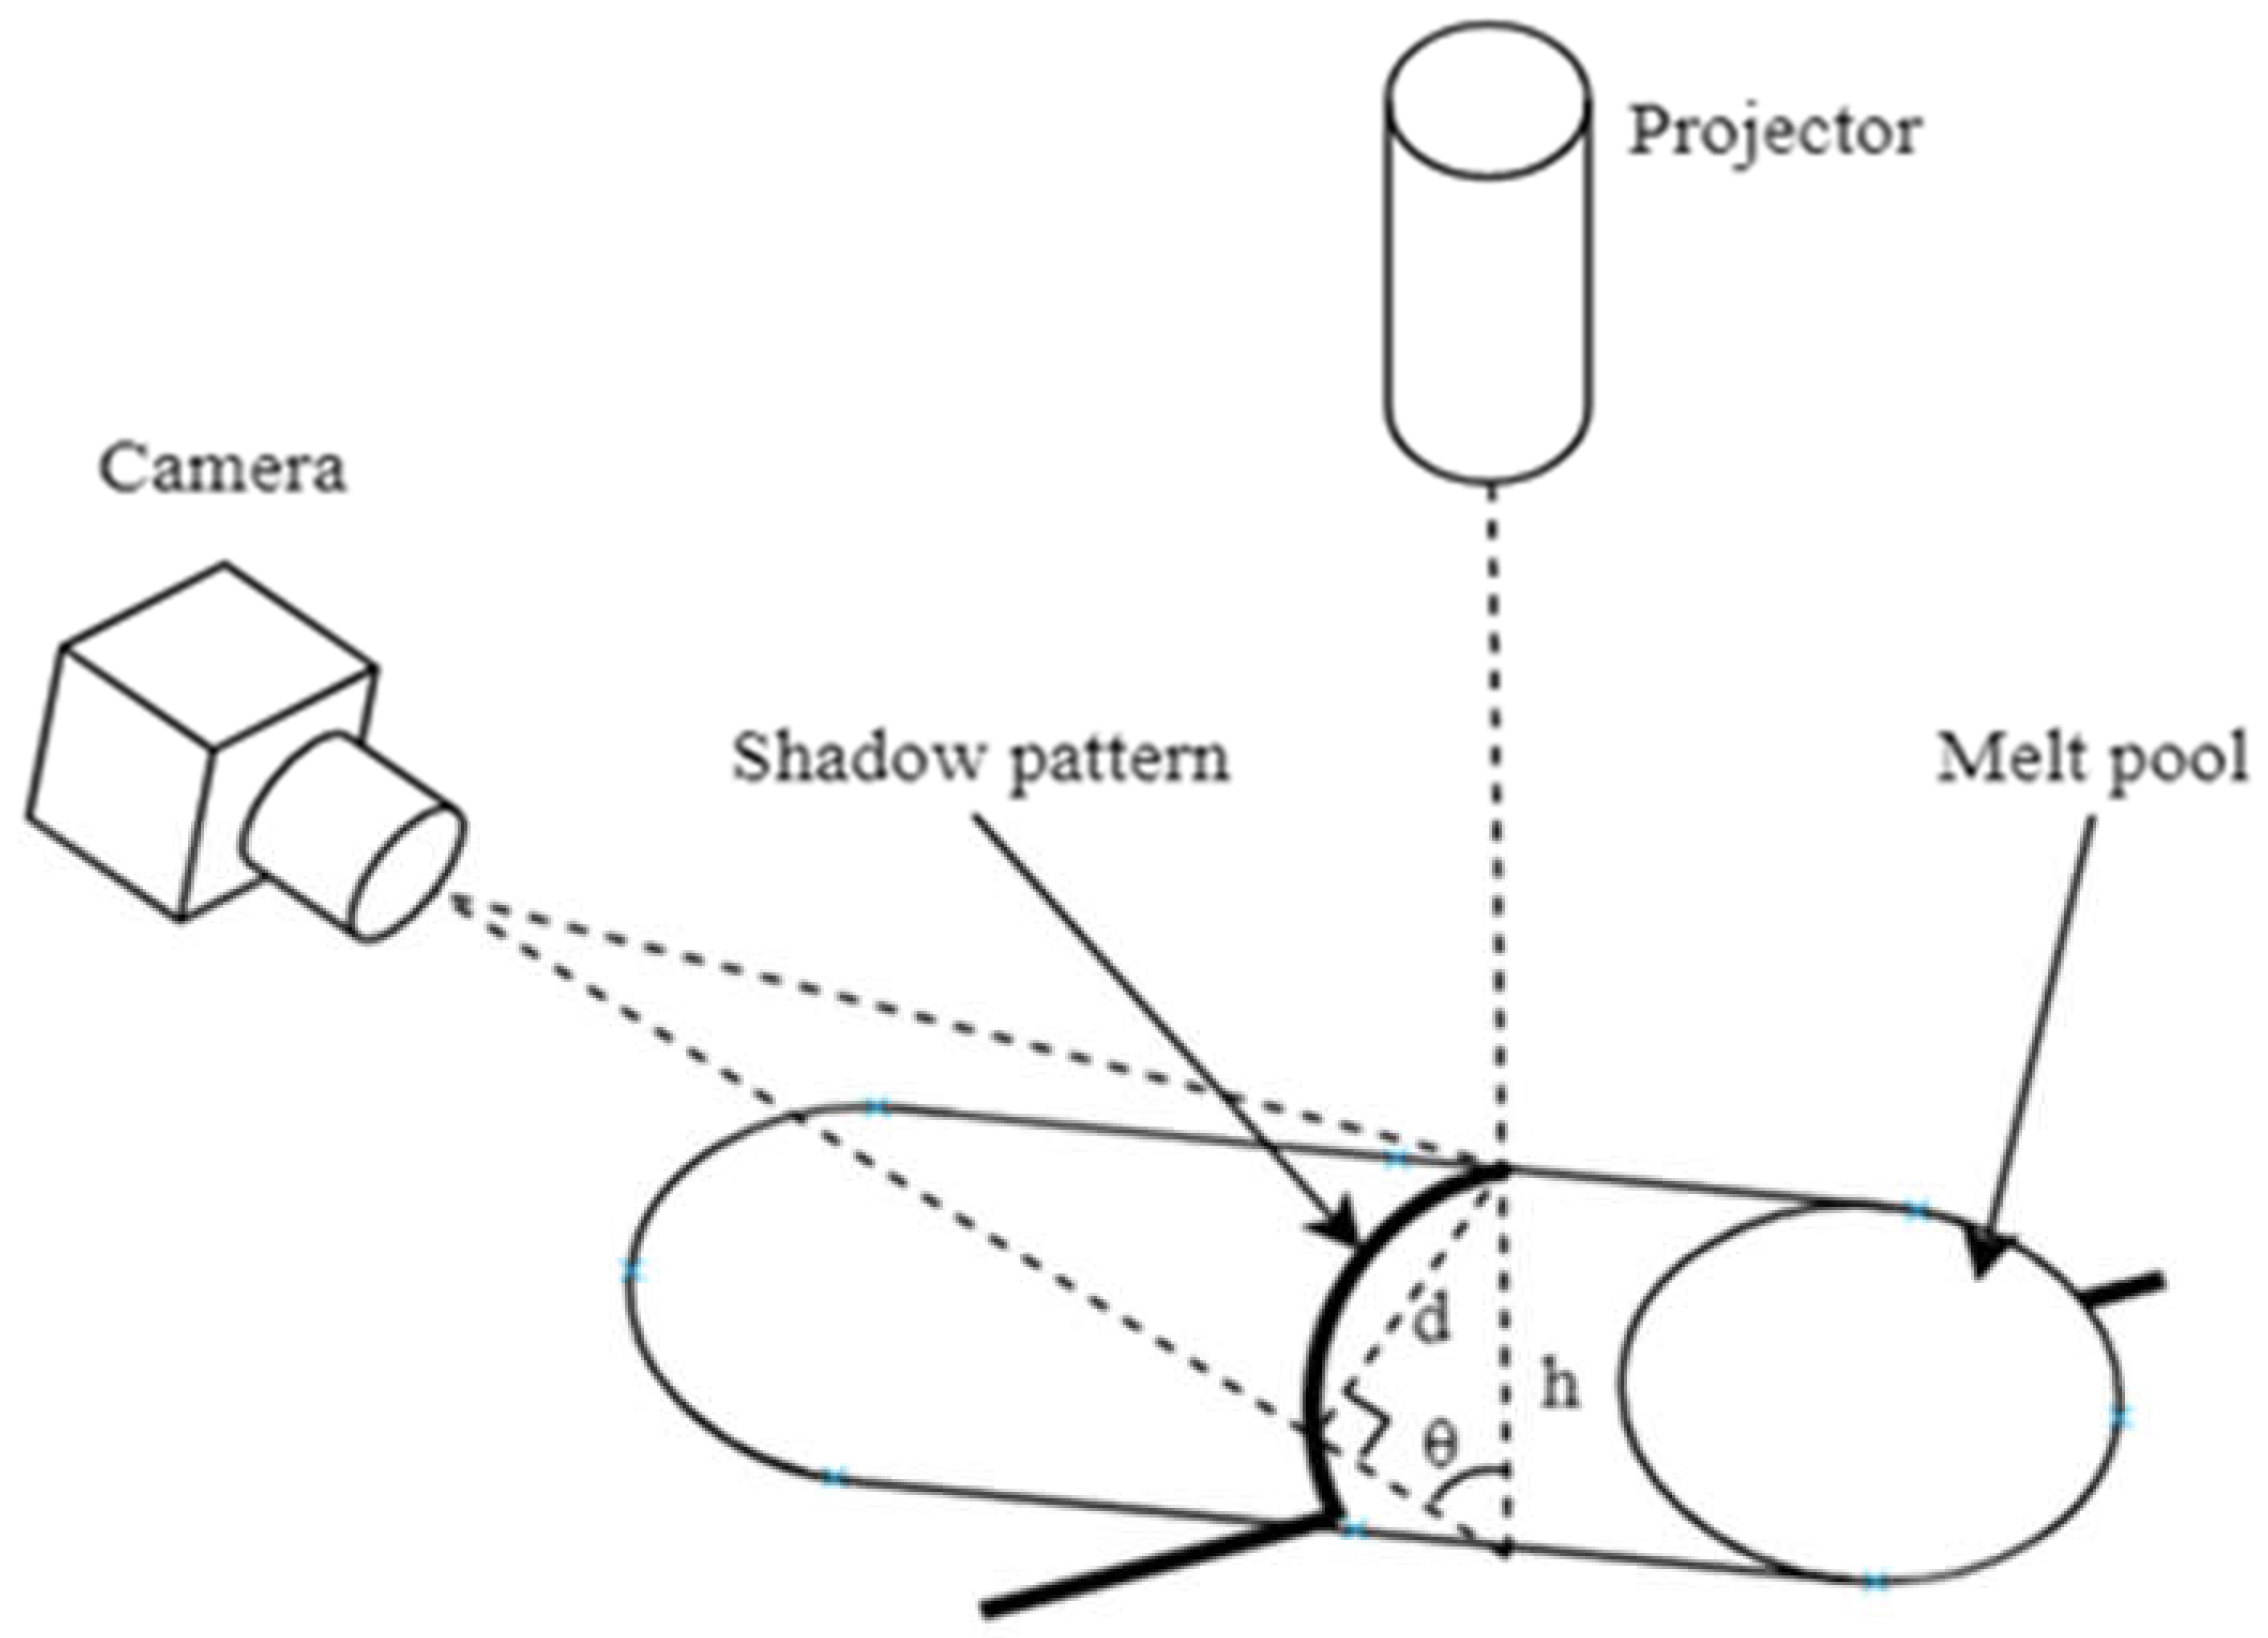
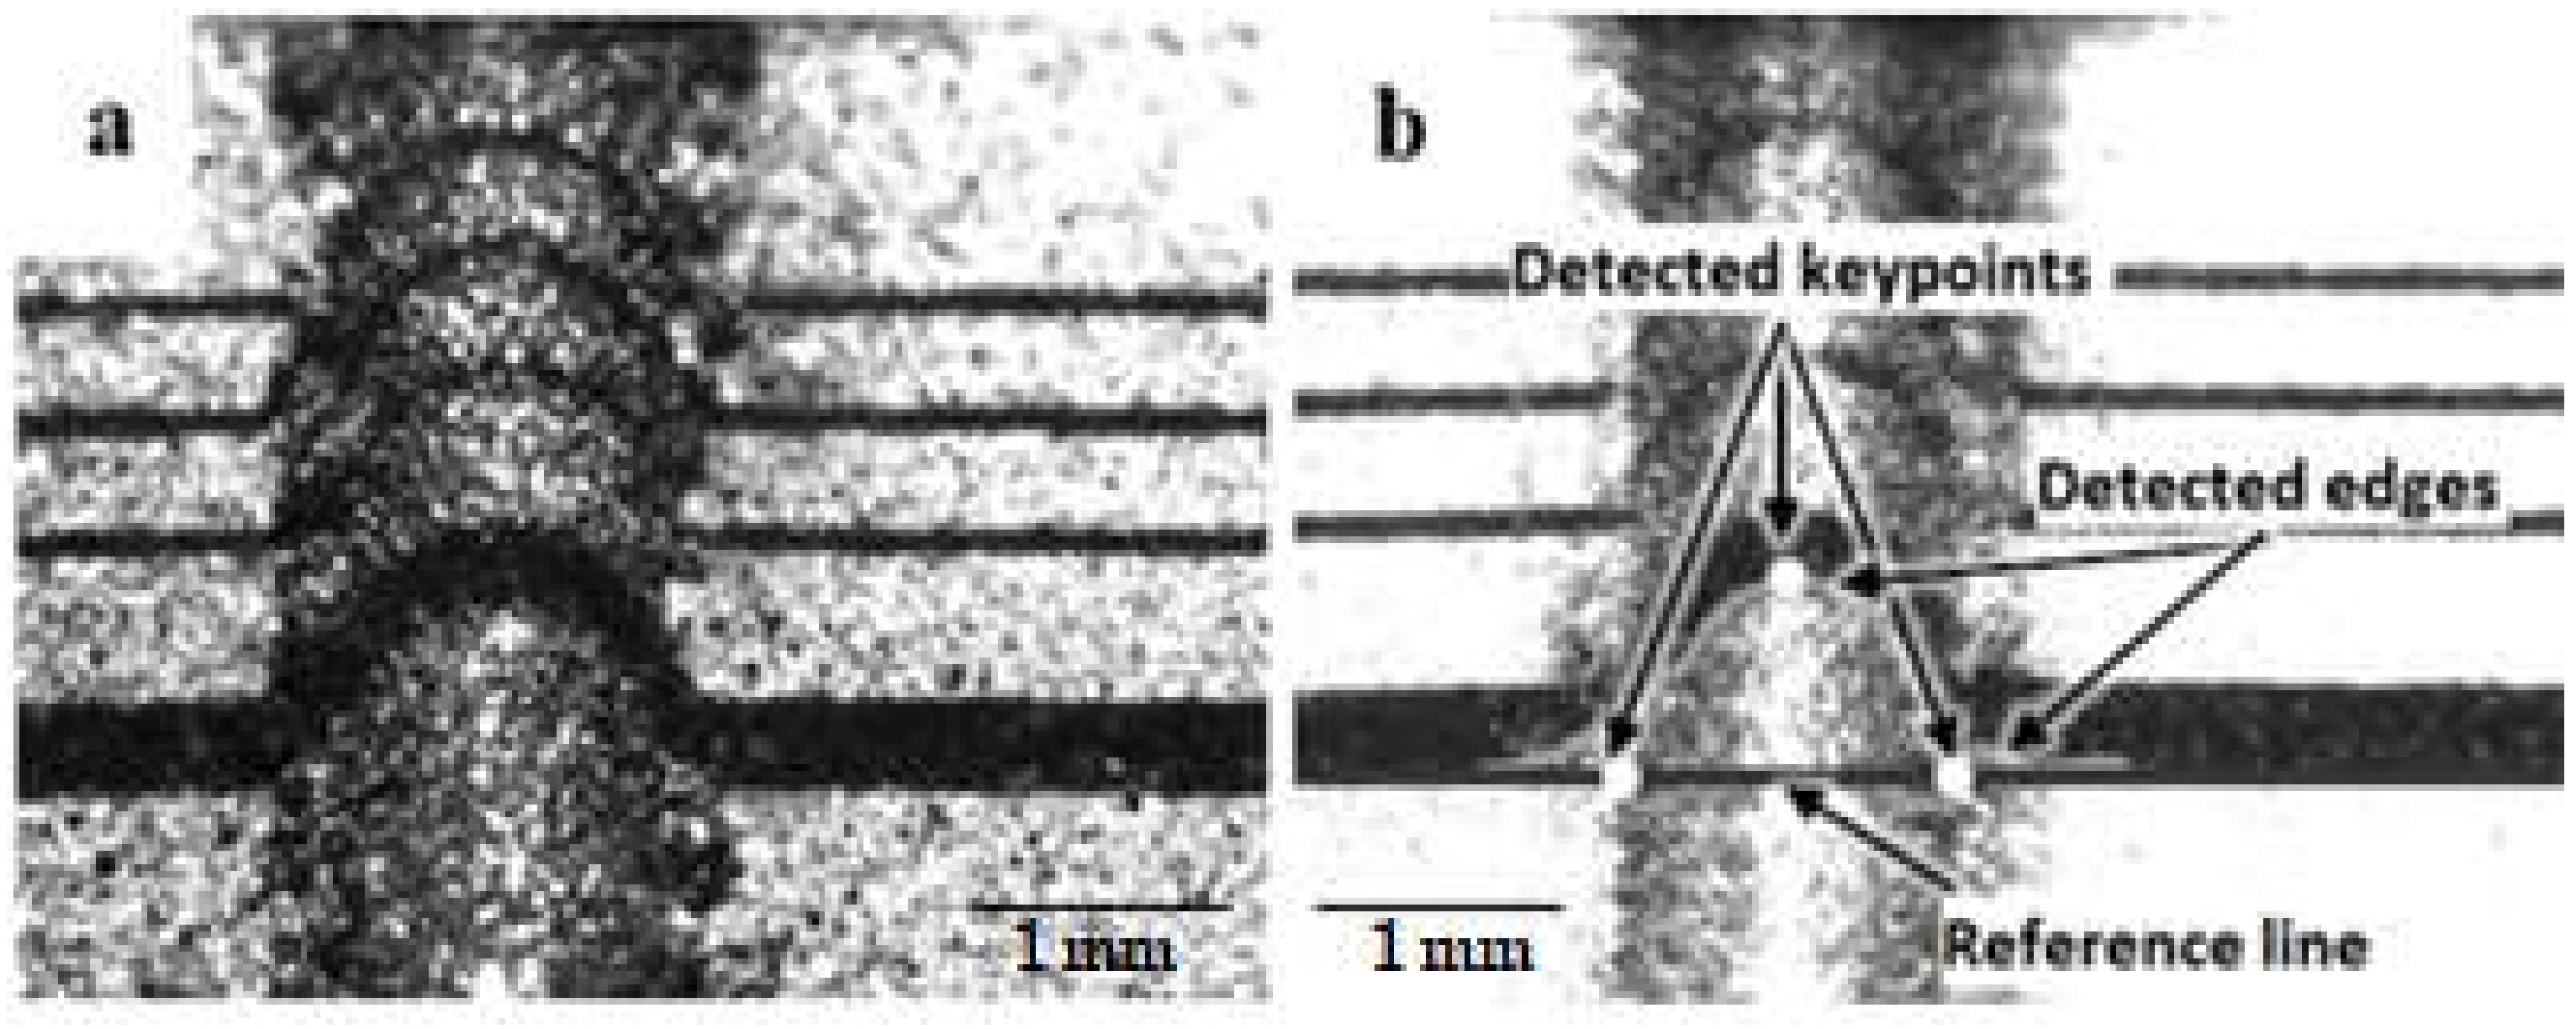
The height measurement of the deposits consists of acquiring images and processing them with an algorithm developed in PYTHON. By using the algorithm, the difference in pixels between the peak of the distorted shadow line on the LMD or WAAM track and the undistorted part of the shadow (reference line) is calculated (Figure 3) using Equation (1).
In the SFS height measurement principle, d is the height in pixels in camera projection plane, with this value, the track height (h) is measured according to Equation (1) [11], where θ is the angle between the projector and the camera, and k is the conversion coefficient that represents a pixel size in the international unit system (μm):
h = k   d s i n   θ
The conversion coefficient k depends on the camera resolution, angle θ, and the focusing optics. Both θ and k have to be found during the calibration using a calibrated pattern.
To assess presence of camera lens distortion, a calibrated object (10 × 10 mm) with a chess pattern was placed on top of the substrate at the focal point of SFS. In addition, to obtain camera parameters (k and θ), a pattern with known dimensions was also introduced. After the calibration procedure, the conversion coefficient was assessed to be k = 10 and the angle θ = 85° for LMD setup.
The height measurement of the second layer upward follows the same procedure with the difference that the previous layer height hn−1 is added to track height h. The resultant height of the n-th layer of the LMD deposit will be:
h n = h       1 + h n 1

2.2. Shape-from-Shadow Setup for LMD

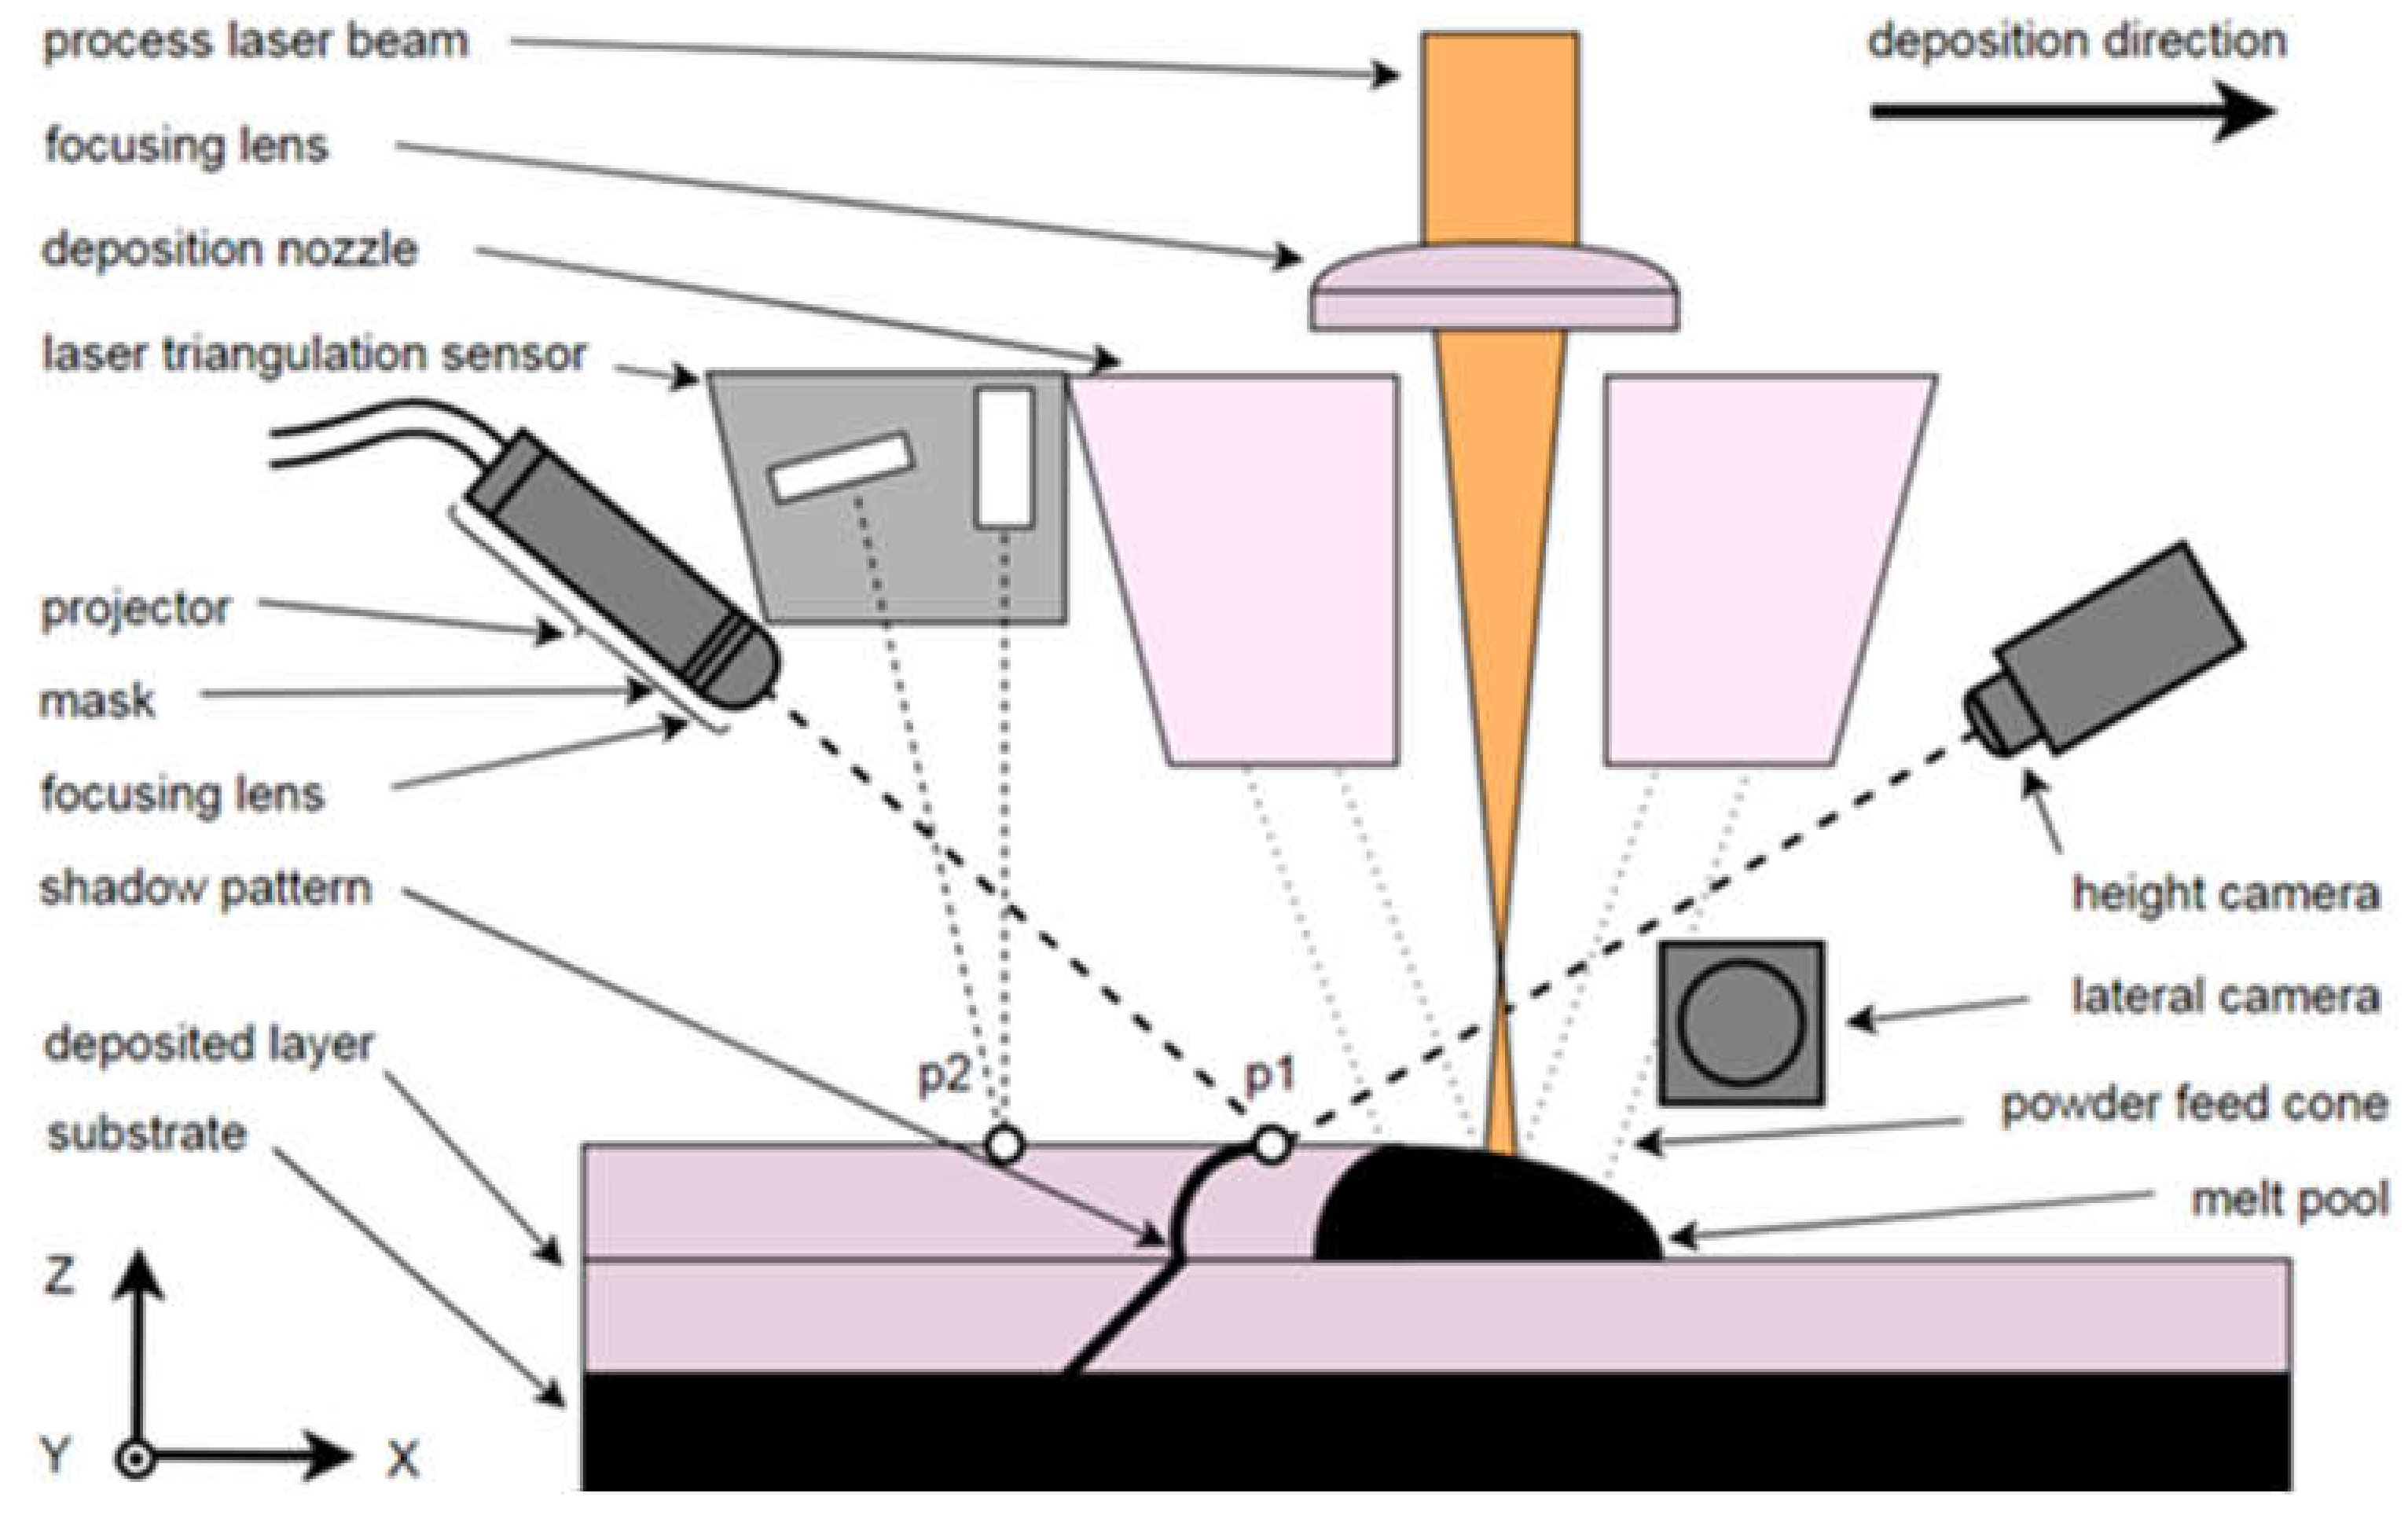
Depending on the height of the LMD deposit, the projected shadow will distort correspondingly, so CCD camera images were acquired, processed, and after appropriate calibration, the height data were extracted. As previously stated, for validation purposes, a laser scanner was employed that measured the layer height after process. The geometrical arrangement of the SFS and the laser scanner (Riftek model RF627, Minsk, Belarus) on the LMD working station at LORTEK is shown in Figure 3. By using the laser scanner, a conventional 2D triangulation laser displacement sensor, X and Z axes were measured simultaneously and a profile of the entire LMD track was formed. Main specifications of the laser scanner are as follows: a 450 nm wavelength (visible blue), a measuring range of 50 mm, a linearity of ±0.05% of measuring range, nominal precision of 10 μm, and a frequency up to 3.6 kHz. As shown in Figure 3, the laser scanner is only able to measure a track height in point 2 (p2), which in this setup equals 60 mm from the melt pool, while the SFS acquires the height data at point 1 (p1), which can be adjusted and it can be as close as 2 mm. Due to this fact, height measurement via the laser scanner was performed off-line and established as a reference for the validation of the SFS system.
As a light source, a pulsed diode laser (CAVILUX Smart further CAVILUX, CAVITAR, Tampere, Finland) was used with a 640 nm wavelength (visible red), an output power of 300 W, a pulse duration of 5 μs, and a frequency of 30 Hz. The laser radiation is delivered by an optical fiber with a 300 μm core diameter. To generate a shadow pattern, transparent glass with a non-transparent multiple straight lines mask was placed in between the probe laser fiber output and the focusing lens (Figure 3). The divergent output laser beam from CAVILUX Smart was focused down on the working area with a lens of a focal length of 17.5 mm and an aperture of f/2.5 (Edmund Optics TECHSPEC® Rugged Blue Series M12, York, UK). The fiber output with the mask and the lens (projector) was mounted in a direction opposite to the scan motion, 150 mm above the LMD track with an elevation angle of 55° to the substrate plane. The resultant laser spot diameter was 20 mm with a shadow line thickness of ~400 μm on the substrate plane. The shadow measuring line was projected 2 mm away from the melt pool to avoid overlap of the line with the melt pool in certain fabrication scenarios. Additionally, the shadow line was carefully adjusted in the XY plane to be projected perpendicularly to the measured LMD track.
The images were captured by a monochrome CCD camera (Basler acA640-120gm, Basler AG, Ahrensburg, Germany) with a 656 × 494 pixel resolution and a framerate of 30 frames per second. A narrowband filter of 640 nm for the CAVILUX was used to filter out the process laser emission, stray light, and to reduce the effects from flares. In addition, to reduce the effects from unwanted emissions, the camera was triggered by the illumination laser and the exposure time was set to 5 μs to coincide with the laser pulse duration. The focusing optics were used by giving a 6560 × 4940 μm field of view at the substrate plane, resulting in an effective measuring range on the Z axis of approximately 4 mm. The camera was placed 100 mm above the substrate plane with an elevation angle of 40°. Hence, the deposition nozzle appeared in between the camera and the projector. The angle θ was found empirically and it was heavily conditioned by the geometry of the nozzle and stand-off-distance (SOD) of 12 mm. The camera position should be carefully adjusted to avoid the shading effect from the deposition nozzle, the glare from the melt pool, and to provide the maximum possible measuring range. Illumination conditions due to roughness or presence of soot and the camera’s parameters greatly affect further image processing, so have to be considered before the measurement.

2.3. LMD Setup

The LMD setup consists of a continuous wave disk laser with a central wavelength of 1030 nm (TRUMPF Trudisk 6002) and a maximum laser power of 5 kW. The laser beam is delivered to a focusing head (TRUMPF BEO D70, Ditzingen, Germany) by an optical fiber with a 400 μm core diameter (Table 1). Furthermore, the laser beam is collimated by a 200 mm focal length collimating lens. Finally, the laser beam is focused by the focusing lens with a 200 mm focal length. The achievable laser spot diameter with this configuration ranges from 0.4 mm to 4 mm. The deposition head was mounted on an independent Z axis (vertical) of the 3-axis Cartesian CNC system (Fagor CNC-8070, Basque Country, Sapin) and mounts a three-jet powder nozzle (Fraunhofer ILT 3-JET-SO12-S, Munich, Germany).
The processed metal powder was Inconel 718 (TLS Technik GmbH & Co. Spezialpulver KG, Bitterfeld-Wolfen, Germany) with a particle size distribution between 45 μm to 90 μm. The metallic powder was fed to the nozzle by a powder feeder (Sulzer Metco Twin 10-C) using argon as both a carrier gas and a shielding gas. For the single track single layer experiment, the powder flow rate was set to 26 g/min and for the single track multi-layer experiment, it was set to 15 g/min. The substrate was made of Inconel 718 with a 10 mm thickness. The standoff distance was fixed to 12 mm.

2.4. WOC Setup

For the WOC process, a Fronius CMT TPS 400i welding power source and WF 60i Robacta Drive CMT/W welding torch assembled in a Fanuc ARC Mate 120iC robot were employed. Cold metal transfer (CMT) mode was applied. The filler metal was 1.2 mm diameter ER5356 (aluminum) wire that was deposited over a substrate of AA6082-T6 with a 4 mm thickness. The torch speed, which is attached to a robotic arm, was established at 70 cm/min. In addition, Argon Q1 shielding gas at a 30 L/min flow rate was employed to protect the welding area. The hatching deposition strategy (i.e., straight weld beads without any weaving) was employed.

2.5. Shape-from-Shadow Setup for WOC

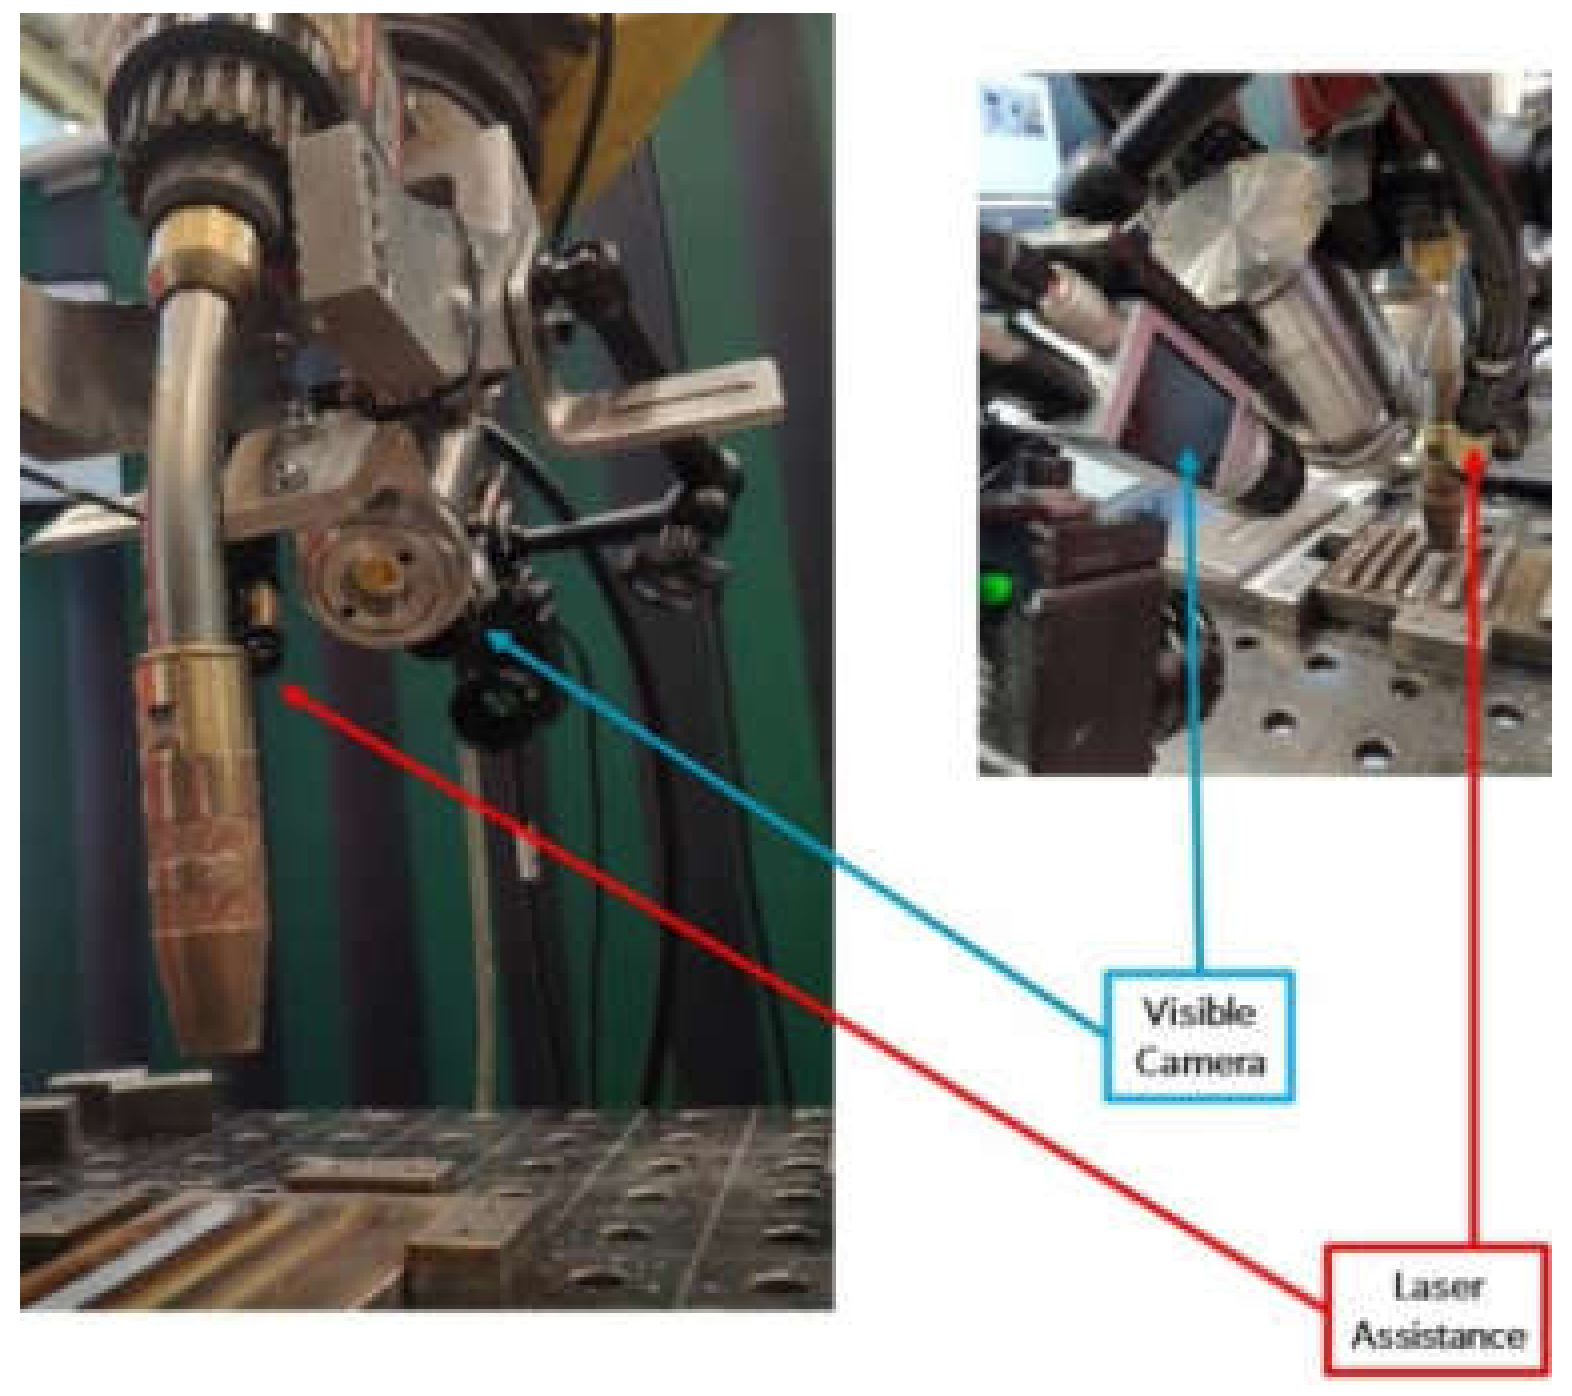
Regarding the configuration for the wetting angle measurement, the same procedure as in the case of laser metal deposition use case was followed. The same camera was attached to the welding torch in the WAAM station with a given angle (45°), pointing out the location where the melt pool forms. Camera and laser illumination formed an angle of 17° (See Figure 4). Two different configurations as shown in Figure 5 were tested; on one hand, in the former, the shadows were projected onto the molten pool so that the wetting angle of the liquid was obtained. In the latter, the shadows were positioned just after the molten metal was solidified. It has to be emphasized that in this case, measurements resulted in higher stability because these were not disturbed by the brightness of the arc. In fact, this was the configuration chosen for the measurements based on the stability criterion.
The sequence of images was acquired at 60 frames per second being the exposure time 5 µs, which matched with the illumination pulse as the laser pulse width was also established as 5 µs. In addition, the laser and camera were synchronized so that the image quality was enhanced.
The differences in SFS configuration for LMD and WOC are summarized in Table 2.
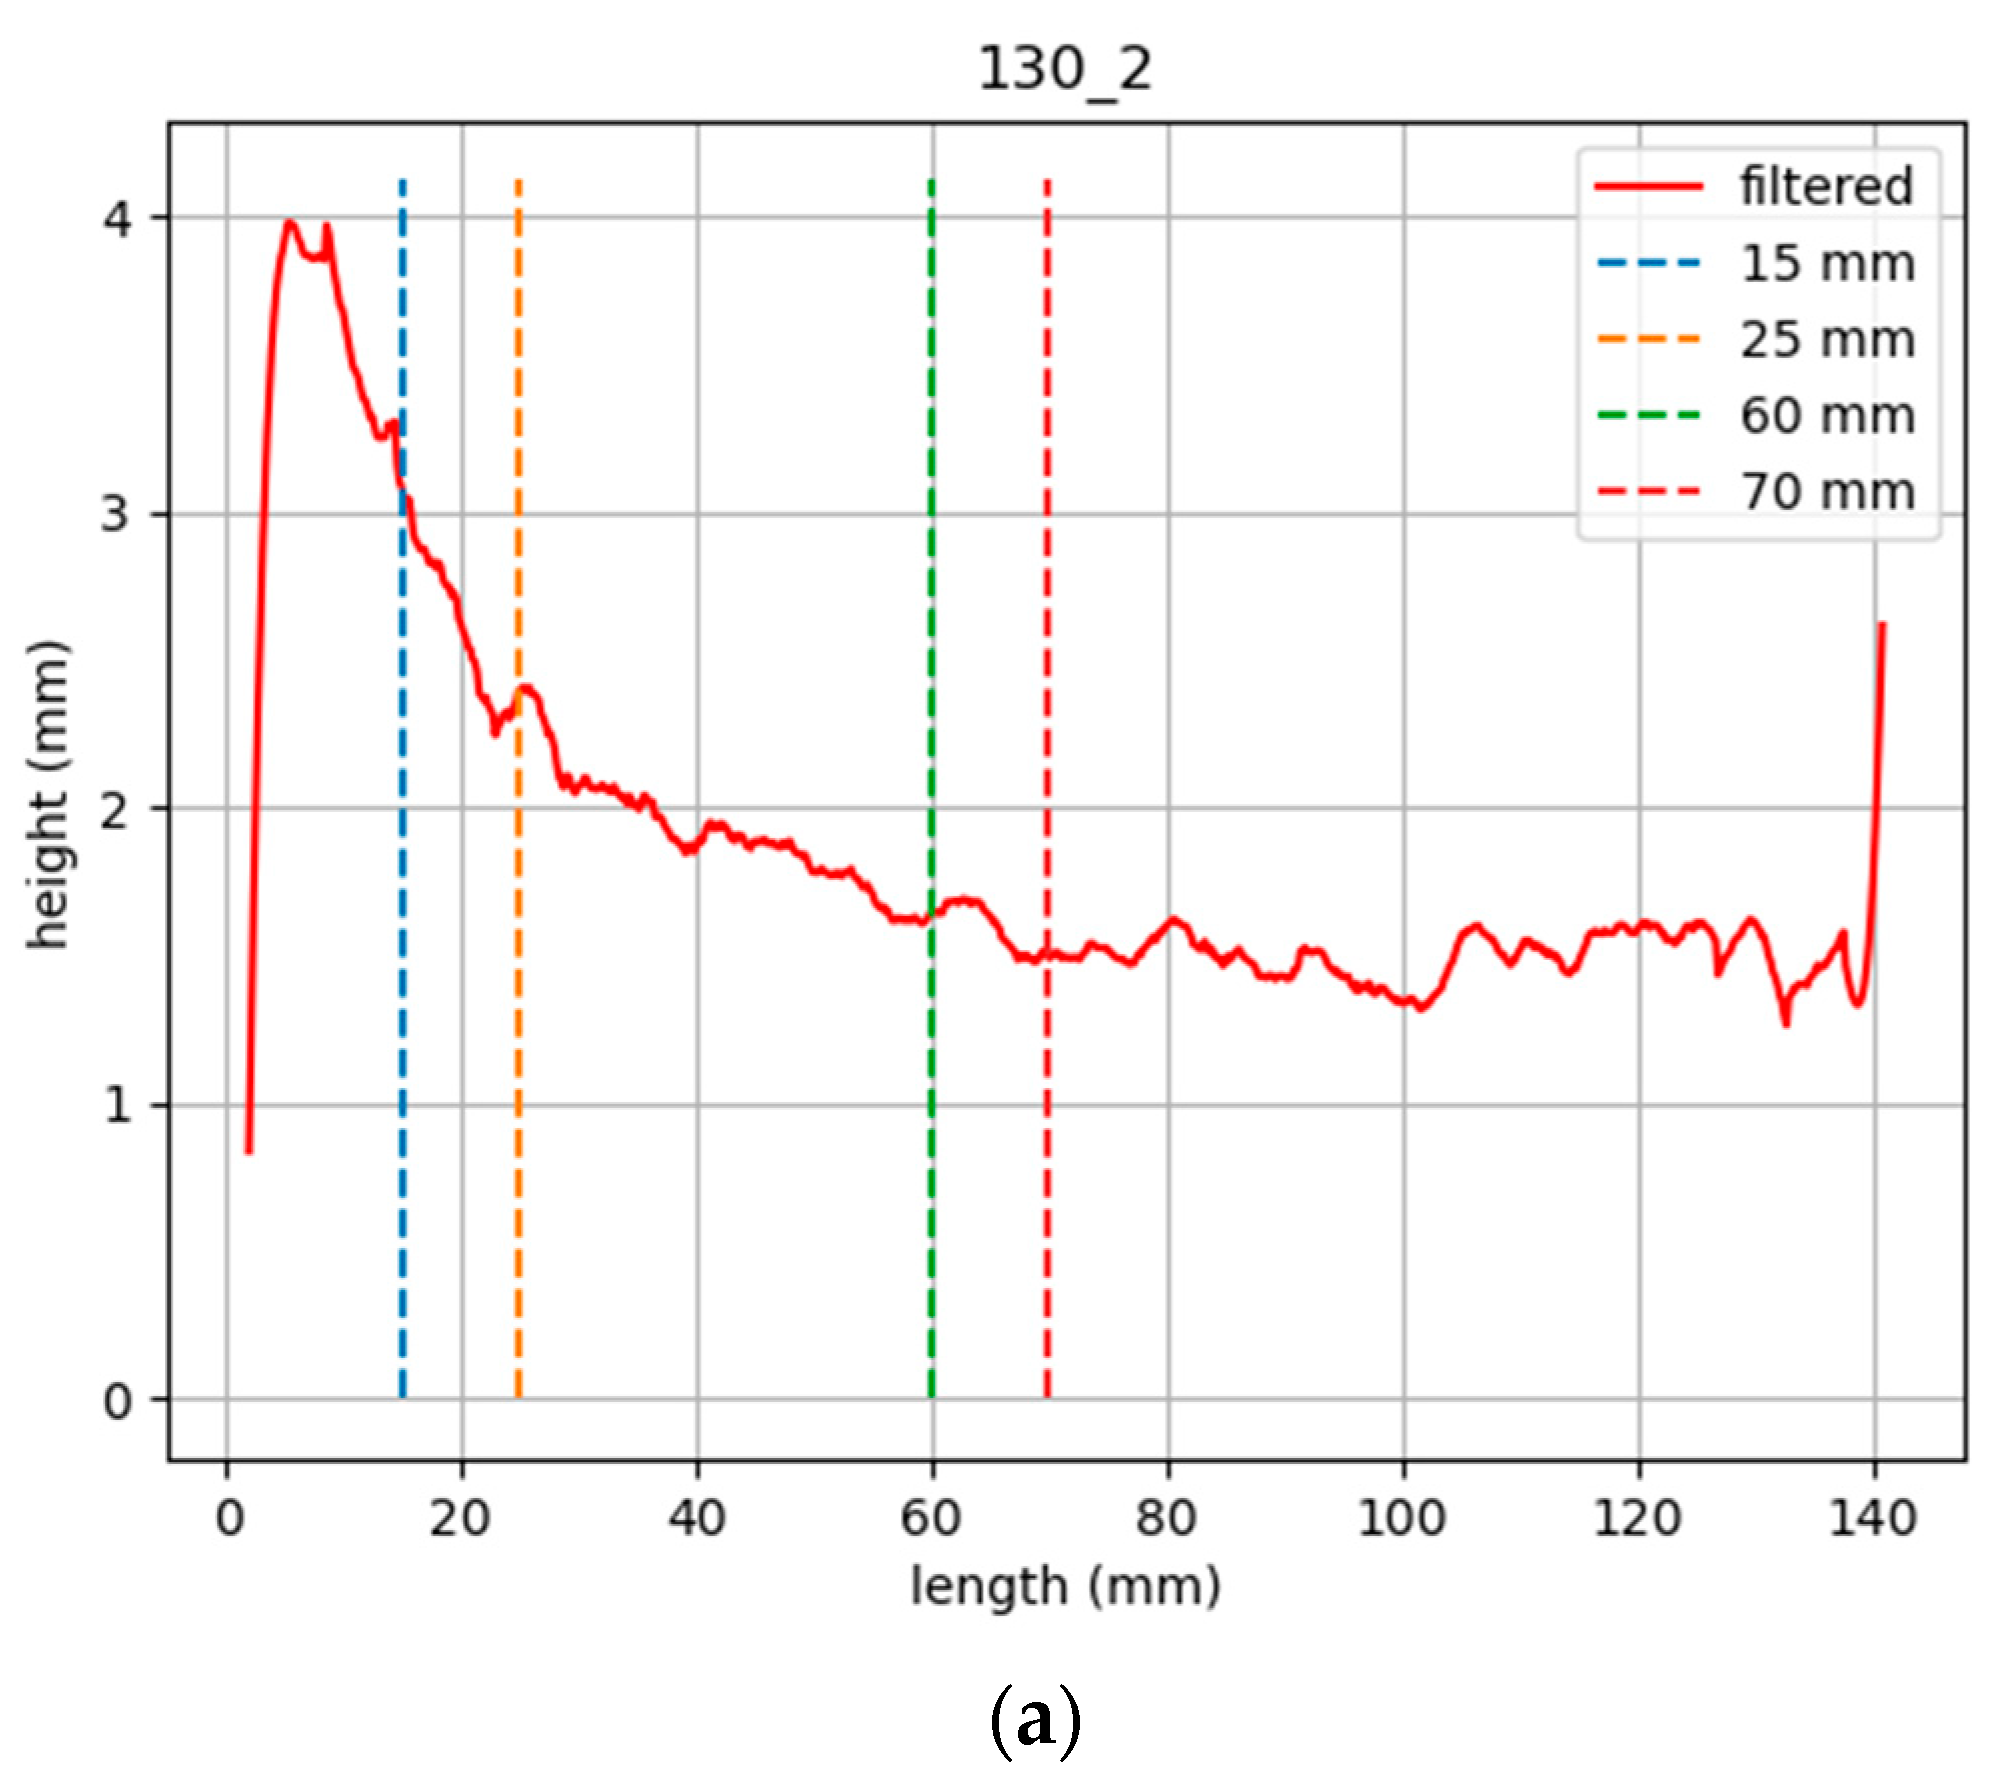
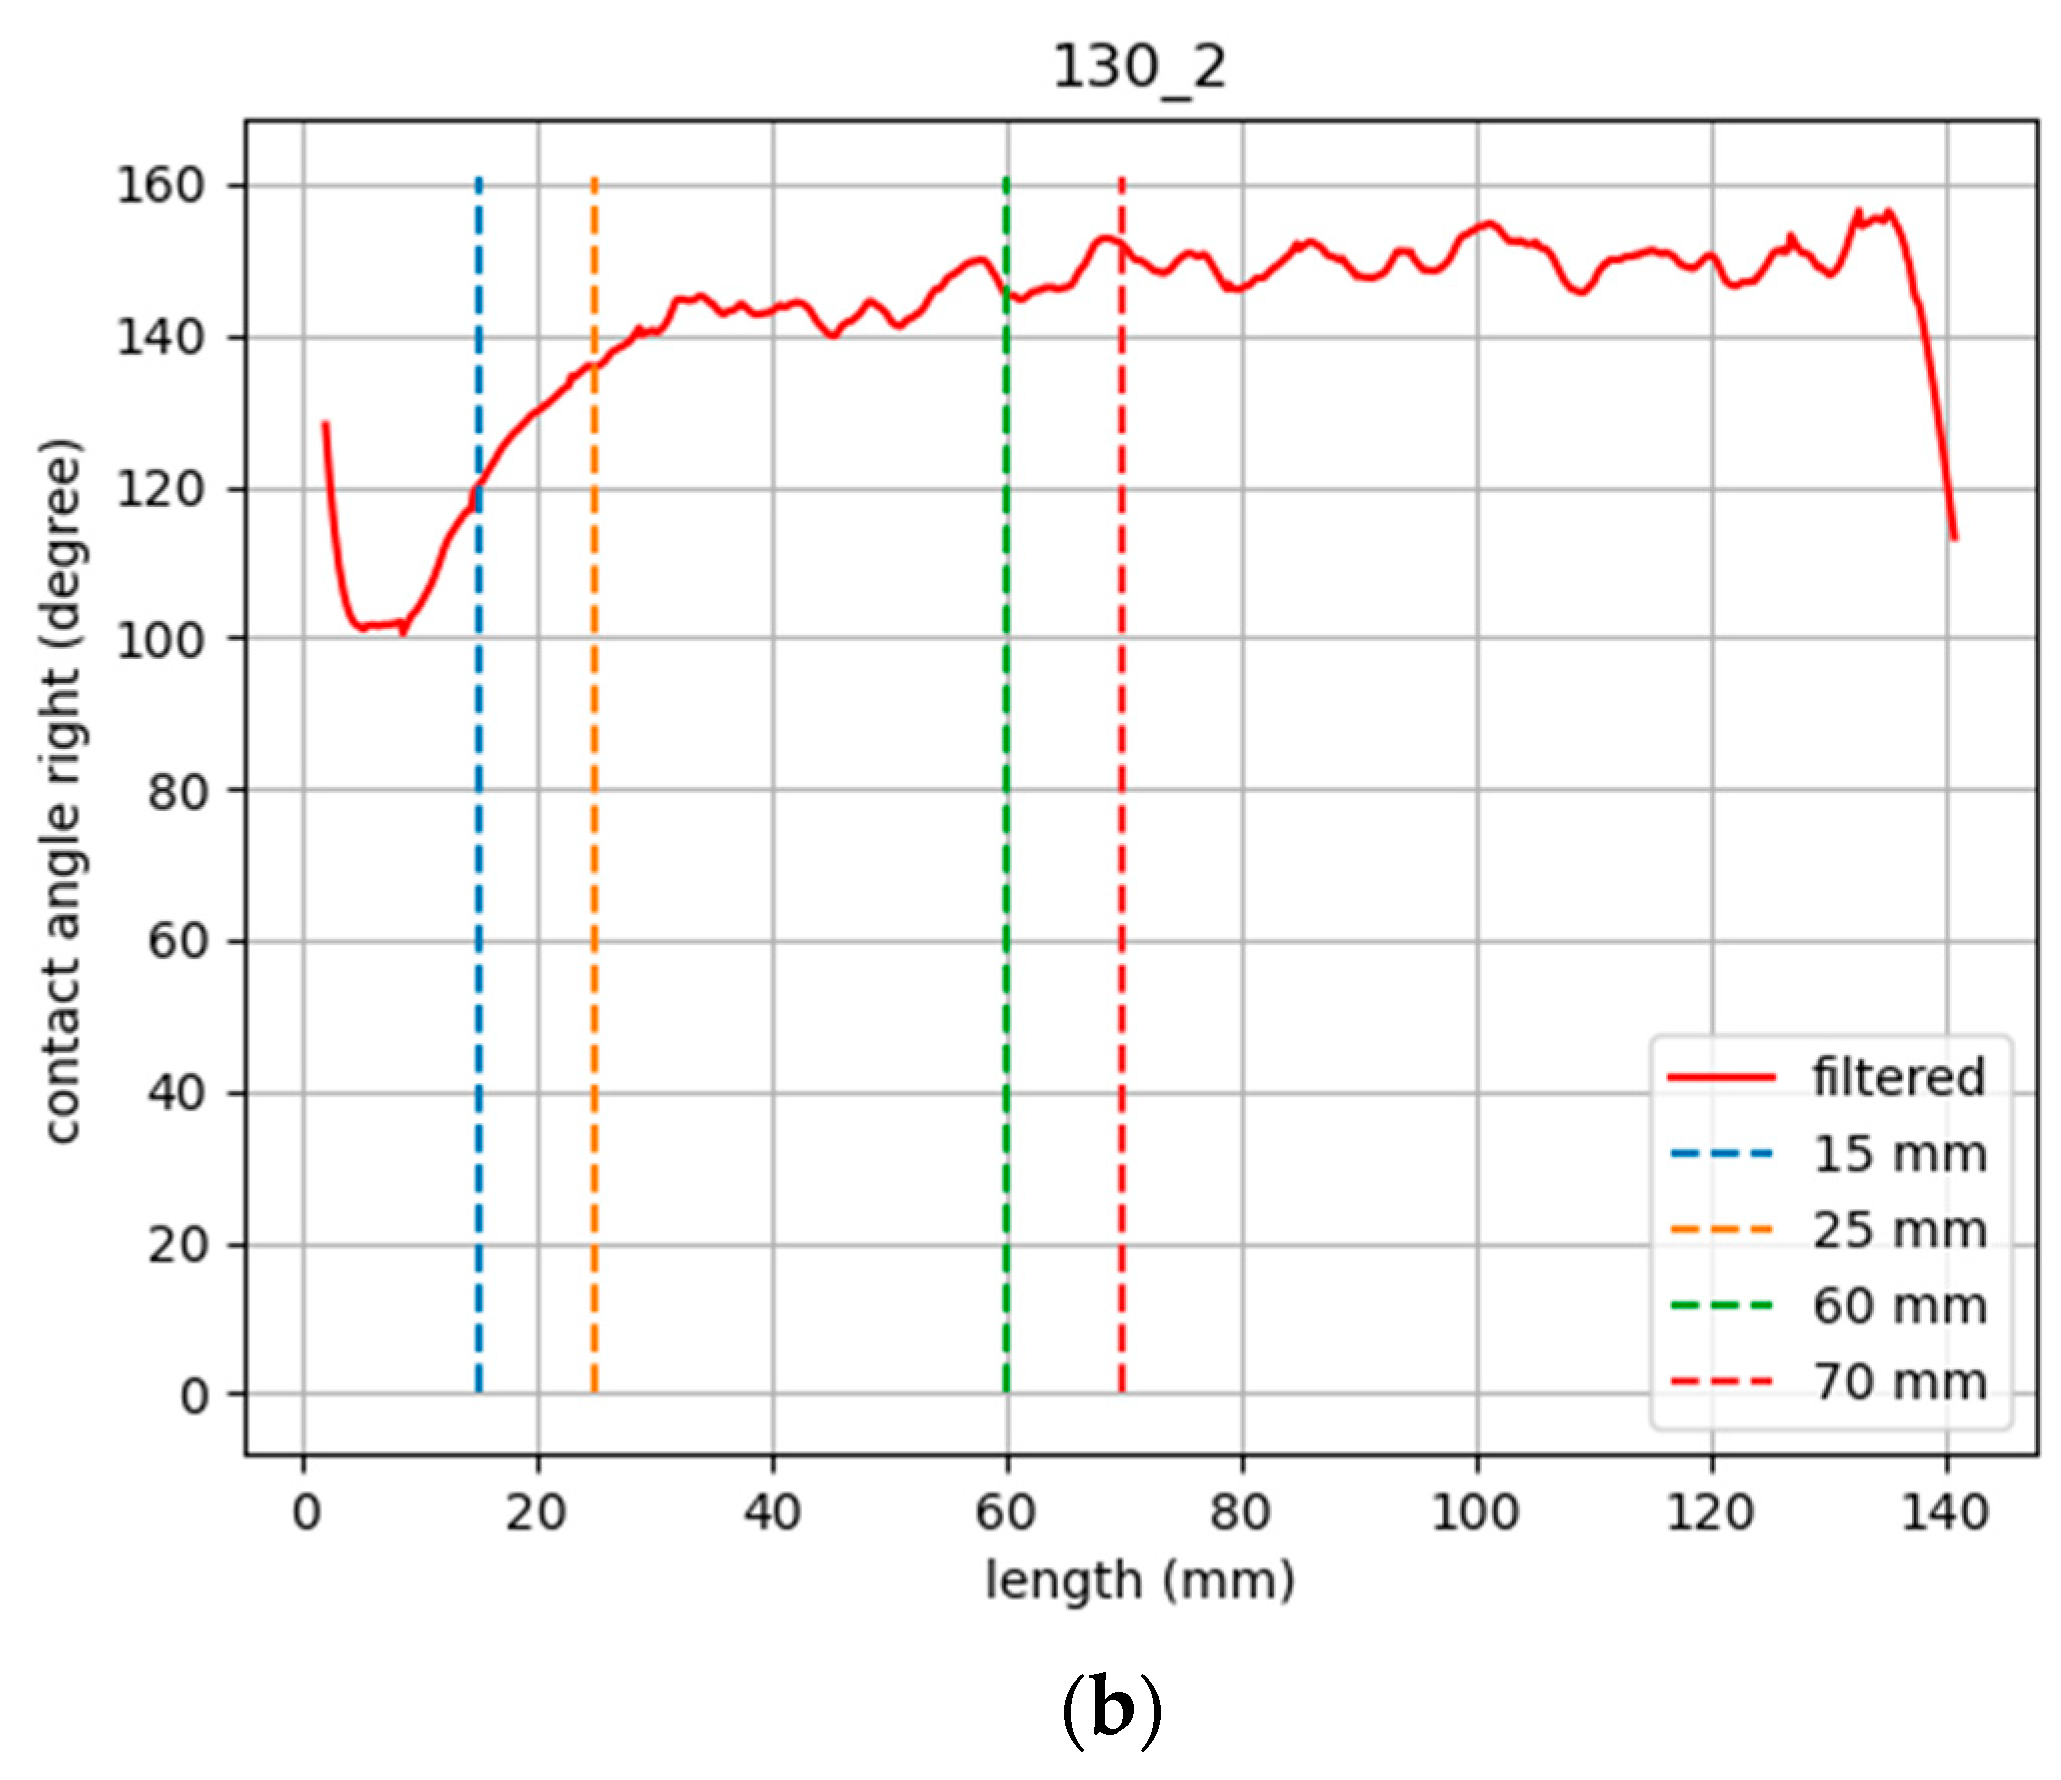
Another relevant aspect deals with the image sequence analysis to obtain the wetting angle values. This image processing step was carried out off-line once the sequence of images were recorded, nevertheless, it has the potential to be implemented on-line for further process control strategy. The image processing steps consisted of the following aspects: (a) pre-analysis of the image sequence by averaging every 5 images, reducing the noise level considerably; (b) binarization to distinguish the shadows from the background; (c) obtaining the projected line coordinates through the Sobel edge detection algorithm (in image coordinates, that is pixels); and (d) conversion into international units by the previously described operation (described in Equation (1)). Average computation time was evaluated to be around 5 ms. Finally, with these coordinates, some mathematical operations are introduced to extract not only the wetting angle, but also the height and the width of the weld bead, which may also play a major role. For the specific case of the wetting angle, curve derivatives are assessed to identify the point at which there is an abrupt change in these values, which corresponds to angle shift. It is at this point where the angle is computed (computation time per image is 10 ms). As there are two points where this shift occurs, corresponding to each side of the weld bead, this operation is repeated. It is the distance between these two points that determines the weld bead width. All in all, from the image sequence wetting angle, weld bead width and height are computed.

3. System Calibration

3.1. Linearity Test

To assess the measurement accuracy of the SFS for height monitoring of the DED fabricated parts, the offline linearity test was performed.
For that purpose, feeler gauges of 0.04–1 mm (Figure 6b) nominal thickness were clamped to a custom made support and measured sequentially with SFS and the laser scanner. Thickness data were collected and visualized on a graph with a reference line. The deviation from the ideal line for both measurement techniques are shown in Figure 6a.
The analysis of a linear regression fit of experimental data from the thickness measured by the SFS yielded a coefficient of determination (goodness-of-fit) R² = 99.87% and R² = 99.43% for the laser scanner. Error statistics for the linearity test is shown in Table 3.
In conclusion, it can be stated that the results obtained for a SFS are comparable to the laser scanner results. Nevertheless, certain errors that may not be ascribed to the measurement method such as uncertainty in the positioning of the gauges may slightly alter the measurement. Additionally, it was found that the laser scanner performed worse on highly shining surfaces.

3.2. Precision Test

To ensure the feasibility of the SFS for a height measurement of LMD fabricated deposits, a precision test was performed and contrasted with the height measurements obtained by the laser scanner.
To validate precision of the SFS, the 6σ standard was chosen, which is based on the statistical evaluation of errors. As a first in-process study object, a single layer single track LMD deposit was chosen. The test object was designated as a single layer single track of 30 mm in length to be fabricated in a single pass fabricated in an open-loop fashion. The process conditions used for the deposit fabrication are indicated in Table 4.
The height measurement of the LMD deposit was performed in-process by SFS mounted on the Z axis support post next to the focusing head to follow the fabrication direction. After fabrication, corresponding LMD thin walls and single layer tracks were measured off-line by the laser scanner repeating the fabrication trajectory, but with an offset of 80 mm in the X direction to reach the deposit with a probe laser of the laser scanner. The single layer single track height measurements are depicted in Figure 7.
After that, the height data acquired by SFS was contrasted to the laser scanner data and the relative measurement errors were obtained. Basic error statistics are shown in Table 5 and the corresponding error distribution histogram is shown in Figure 8.
To verify the obtained results for the deposit material, the precision test was repeated for the LMD thin wall structure. The measurement procedure was kept the same.
The LMD thin wall was designated as a 4-layer single track of 40 mm in length to be fabricated by moving back and forth on the X axis, with the initial standoff distance of 12 mm. The height increment of the CNC at each layer was ΔZ = 0.6 mm. The process conditions used for the thin wall fabrication are indicated in Table 6.
The LMD thin wall height measurements of SFS and the laser scanner as well as programmed total deposition head raise are shown in Figure 9.
Errors analysis was performed following the same procedure as the single layer single track case. Basic statistics and the first three of 6σ standard are presented in Table 7. An error distribution histogram is shown in Figure 10.
In spite of some errors due to vibrations and illumination condition variations, these results show the potential of SFS for in-line height measurement and this is why a layer by layer case study is presented next.

4. Experimental Results and Its Analysis

4.1. LMD In-Line Layer Height Measurement

To compare the elevation of the deposition head with the actual height of the LMD track layer by layer, another LMD thin wall structure was investigated in-process. The height measurements of the deposit were performed in-process by the SFS camera mounted on the Z axis support post next to the focusing head. Corresponding images are shown in Figure 11.
The LMD thin wall was designated as a 4-layer single track of 40 mm in length to be fabricated in one direction on the X axis with the process laser turned off in between the layers. One-way deposition direction and an excessive powder feed were intentionally introduced to assess the capability to measure the variations in height. The height increment of the CNC at each layer was fixed to ΔZ = 0.5 mm. The process conditions used for the thin wall fabrication are indicated in Table 8.
The LMD thin wall SFS height measurements of each layer as well as a programmed elevation of the deposition head per layer are depicted in Figure 12. The measurements of the thin wall were contrasted with manual measurements after the fabrication.
Figure 12 shows that the height of the very first layer (l1) was nearly twice as much as the programmed height increment of the deposition head. At the starting position, there was a clear accumulation of the material due to a one-directional fabrication trajectory and a delay in the execution of the CNC program iterations of the loop. This is properly captured by the SFS and corresponds to the peaks illustrated in Figure 9. Therefore, by using SFS, the LMD track height variation can be measured. This technique is promising for the measurement of layer height in LMD as key data for the stability of the deposition and for the control of the process. Recently, this has been a trend included in reviews that talk about the challenges to be addressed with monitoring technologies [34].
Another aspect to highlight is the possibility of reducing the computational operations with the developed measurement algorithm in SFS, which is advantageous if we compare it with other new approaches based on the dynamic modeling of melt-pool geometry [35]. Here, the modeling approximation, costly in terms of computation, will inevitably cause errors in estimating the build height in LMD.

4.2. WOC Wetting Angle Measurement

In this case study, an aluminum layer was deposited over the base material to build the first layer of the 3D printed part. As previously mentioned, in terms of creating good bonding between the deposited material and the base material, this is the most critical moment because it may lead to a weak joint and jeopardize the component integrity. This effect is particularly critical in the case of aluminum parts, which usually requires an increase in the welding intensity in the first layer to avoid a lack of fusion or necking defects [36]. Moreover, the thickness and initial temperature of the substrate will directly affect to the resulting wetting angle.
Two different manufacturing conditions were tested. The difference between them was the heat input, which was varied by modifying the electric current from one to another. Two different levels of heat input were tested: (a) low levels that correspond with electrical currents equal to 115 A and (b) high levels that correspond with electrical values equal to 130 A. In all of them, the relevant weld bead geometrical parameters were measured (wetting angle, width and height) and for validation purposes, welds were cut after the process and these cross sections were analyzed via microscopy to measure the same geometrical parameters. Afterward, these values were compared with the ones obtained through the shape-from-shadow measurement system.
An example of a sequence at different instants of the welding process is illustrated below. It is noteworthy that, at first glance, differences were observed in terms of the welding shape at different locations. For instance, at the beginning of the weld, a clear wider and higher area was observed. It has to be noted that due to the robotic arm inertia, the welding torch speed was not constant at the beginning of the process (it was actually lower) and this resulted in a higher amount of deposited material, which was clearly captured by the measurement system (see Figure 13, upper left image). After this part, a necking effect (i.e., a reduction of weld bead width) occurred, which was also correctly captured by the developed system prior to entering in the stable region where three main free parameters (angle, width and height) remained constant, as will be illustrated next in the corresponding curves (see Figure 14). This can also be observed in the 3D weld reconstruction (Figure 13, lower image) where the initial bump compared to the rest of the weld bead is clearly visible at first glance.
From the above introduced sequences, weld bead geometric parameters were computed following the measuring principle described in Section 2.1. This was based on tracking the projected shadows (via image processing) and calculating the displacement of the line with respect to the reference value (initial straight line). This difference in pixels was translated into millimeters according to Equation (1) (Section 2.1) and considered the parameters (k and θ) that needed to be calibrated beforehand. Finally, to obtain the geometric parameters from the extracted curves, height was computed as the maximum value of the curve while for width and contact angle, additional processing was required. Derivative of the curve had to be assessed in order to automatically determine where the edge of the weld bead was located. As there were two abrupt changes in the derivative curve corresponding to both sides of the weld, the distance between them was defined as the weld width. In addition, at this exact location, the tangent of the curve was calculated as a measure of the contact angle in each of the sides of the weld. As a result, graphs showing the evolution of the different geometrical parameters along the whole weld were obtained. Some of them are illustrated next. As an example, in the following graphs, the contact angle and height evolution are depicted for the high energy input sample. It has to be highlighted that the effect of the bump or accumulated material at the beginning is clearly reflected in the graphs (from 0 mm to 30 mm indicated by the red line) and values stabilized from moment one. Four transversal dashed lines were also included in the graph to indicate the location where weld cross-sections were analyzed for validation purposes.
These assessed geometric parameters (contact angle, weld width, and weld height) were employed for a twofold purpose; on one hand to compare the samples manufactured under different heat inputs (low and high heat input) to evaluate the effect of the welding conditions. On the other hand, this was also used to validate the shape-from-shadow system as a means to extract weld geometry parameters during the process.
The comparison between measurements of low and high heat inputs is summarized in Table 9. In this table, results from measurements in the cross sections are illustrated before comparing with the SFS results and its deviations (Table 10). For simplicity, only the measurements conducted at the stabilized region (weld locations at 60 mm and 70 mm) will be discussed, as the ones from the 15 mm and 25 mm are not representative of stable welding conditions (initial segment of the track). By comparing the width of the weld, it is evident that there was an increase in its size when applying higher energy input (from 7.5 mm to 8.2 mm), while height was reduced considerably (from 2.4 mm to 1.8 mm). This can be ascribed to the effect of increased wetting capacity when more heat input is applied. This was proven by analyzing the contact angle; the sample with higher energy input had higher values (around 145° with respect to 125 mm in the other case), meaning that the melt pool was spread more on the surface of the substrate before getting solidified. This was due to a higher melt pool temperature.
Finally, to address one of the main purposes of this paper, which was measurement system validation, the obtained results via microscopy were compared to those attained via the shape-from-shadow method. This was illustrated in the same format as the previous comparison and differences (or errors) were directly illustrated (Table 10).
With respect to width, it was observed that the SFS system tended to measure higher width values (negative errors), being the mean error of 0.288 mm with a standard deviation of 0.38 mm while the maximum deviation was found to be 0.73 mm. By carrying out the same analysis in the height values, deviations were considerably lower (0.065 mm mean value, 0.10 mm standard deviation, and 0.17 maximum deviation), although it has been highlighted that these deviation values are reduced in the same percentage approximately as the width–height relation (width/height ≈ 3). That is, the performance of the measurement system was similar and the source of the error for both cases was ascribed to multiple causes, although the main one is related to processing noise in the images that reduce the accuracy of the shadow tracking. With regard to the contact angle, it is noteworthy that most of the measurements led to negative errors, meaning that shape-from-shadow gives higher contact angle values. The main explanation for this effect is the fact that the location where the tangent of the curve is defined determines the angle, and reproducibility of this procedure in microscopic images (with respect to shape-from-shadow) is hard to achieve, leading to these differences. Nevertheless, the maximum deviation in the contact angle (−11.93 mm) was below the 10% of the measuring range (around 140°), indicating the suitability of the system for the measurement of this geometrical parameter. This fact was proven for the rest of the geometrical parameters (width and height) according to Table 9, where maximum errors were below 10% of the measurement range. This was also proven in the LMD application with similar conclusions, and therefore is a good measure of the system performance for different applications.

5. Conclusions

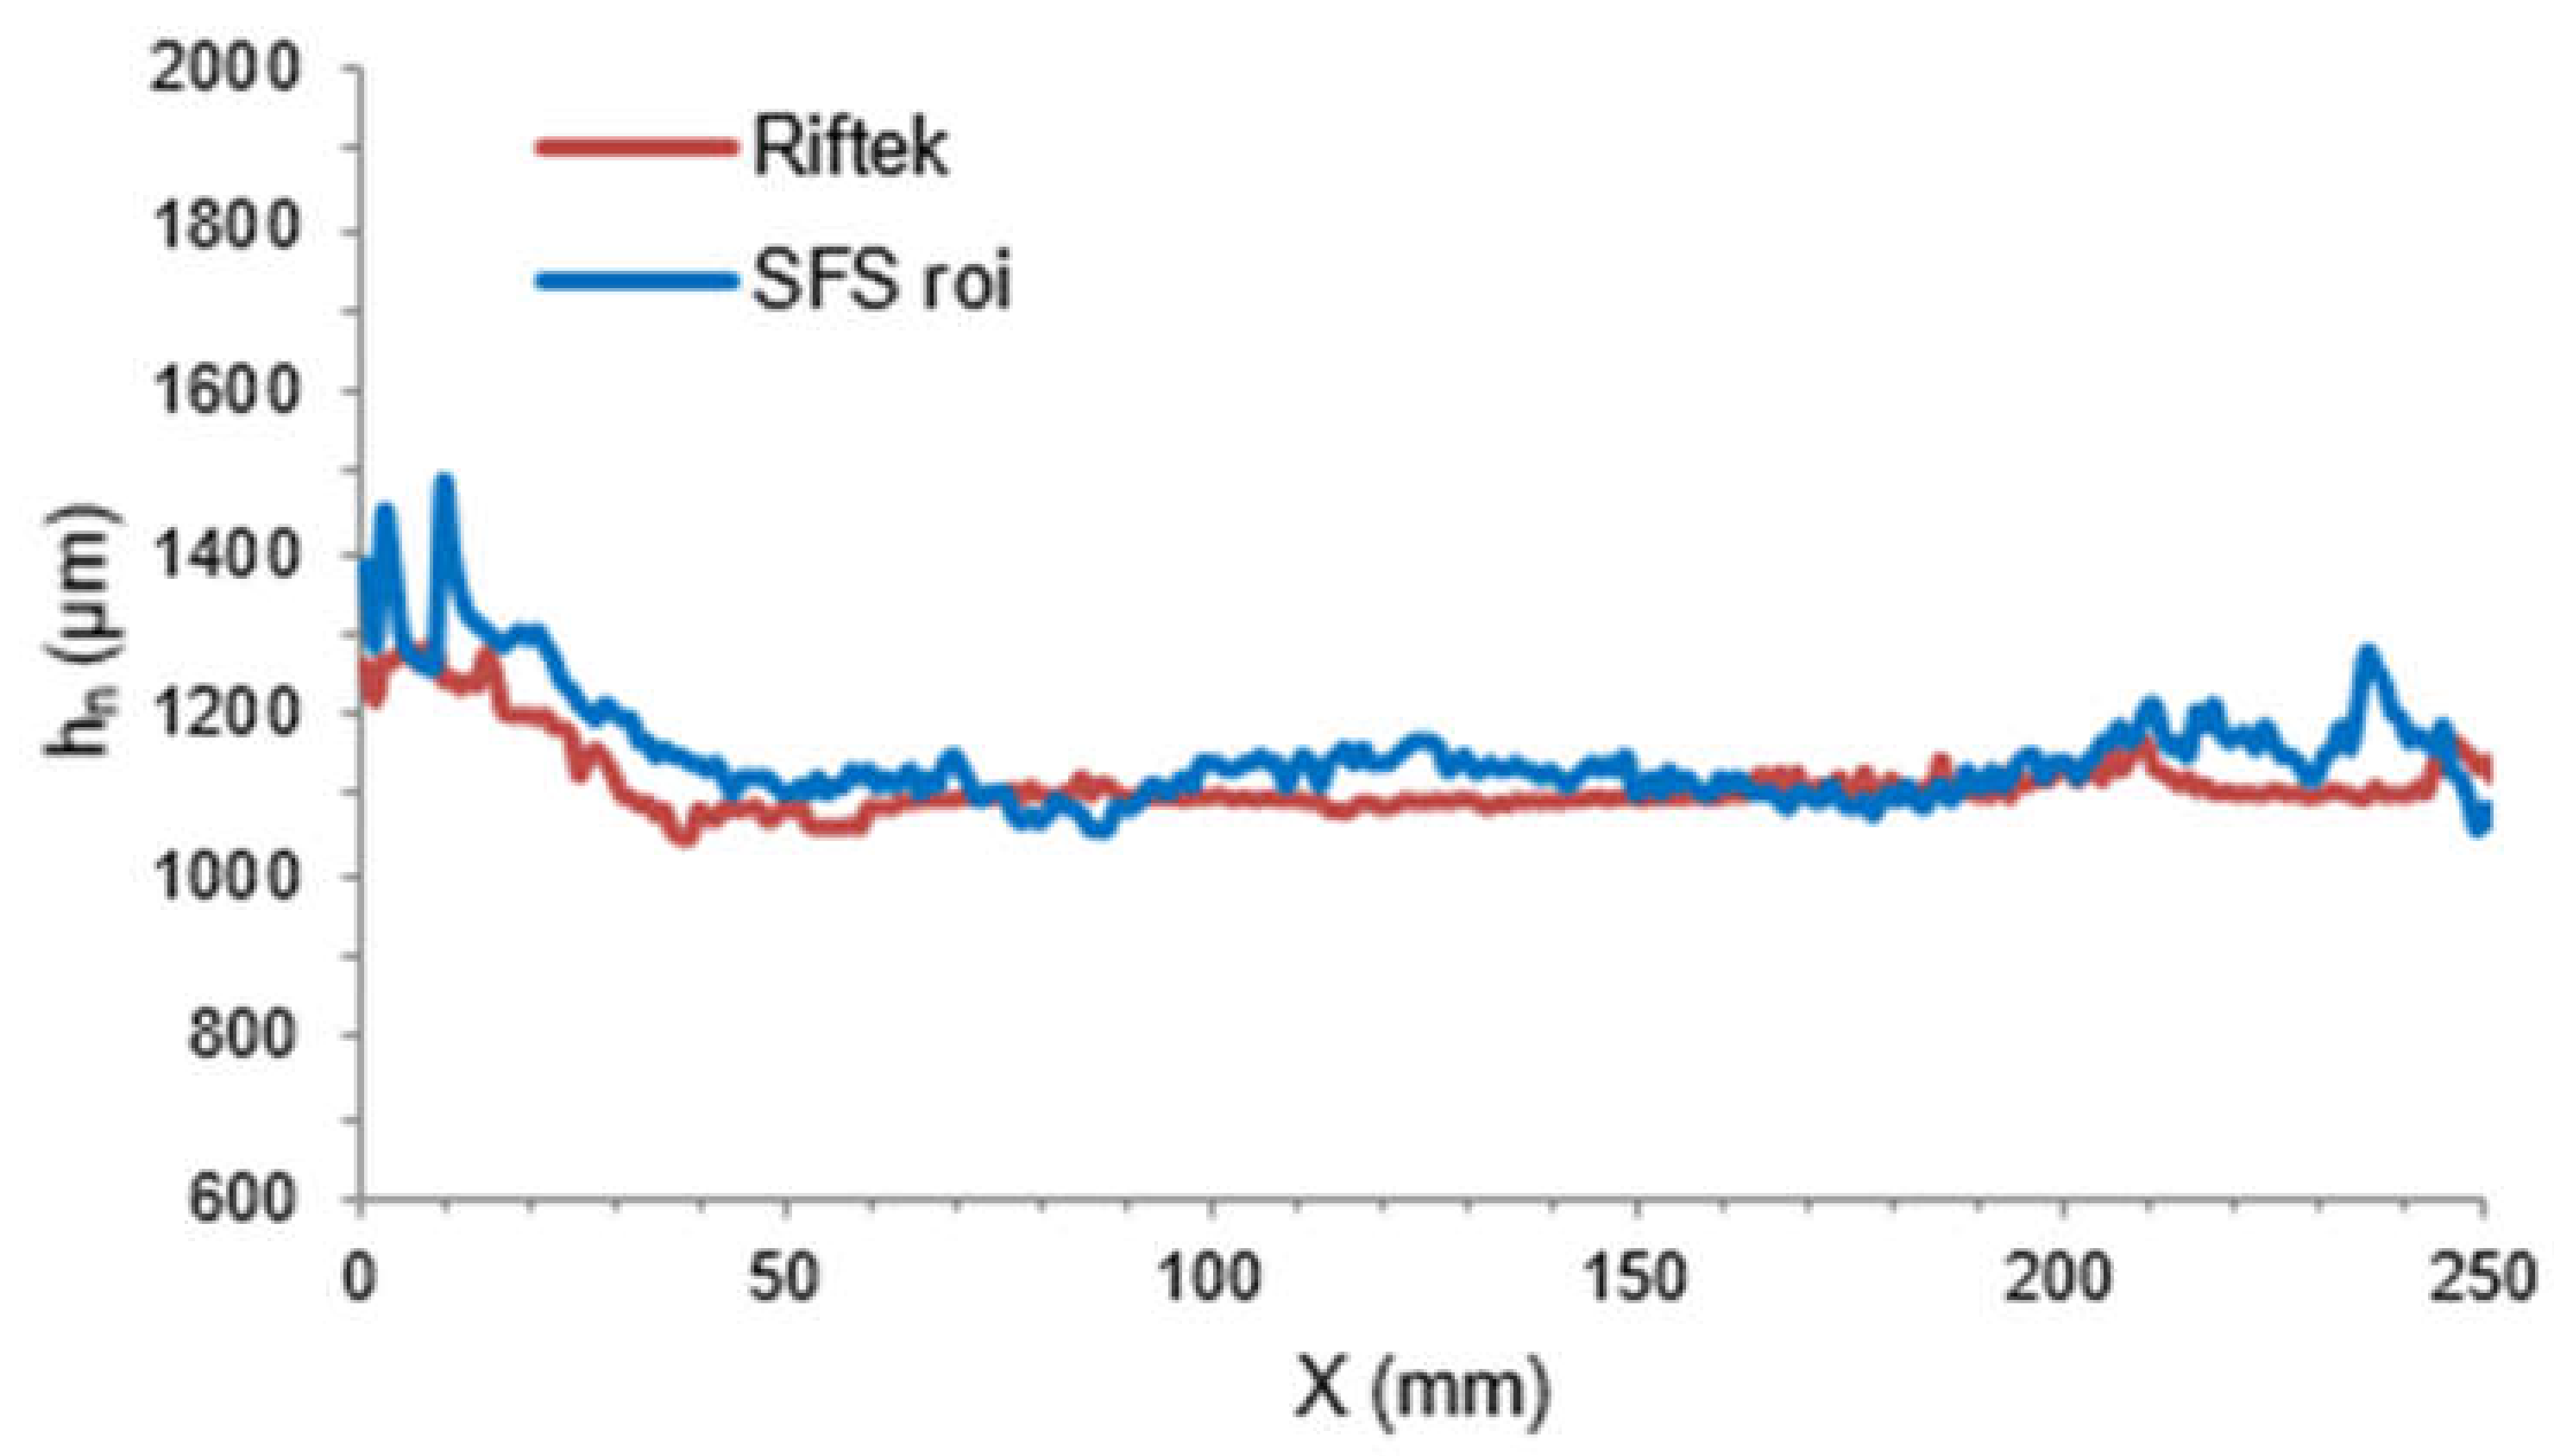
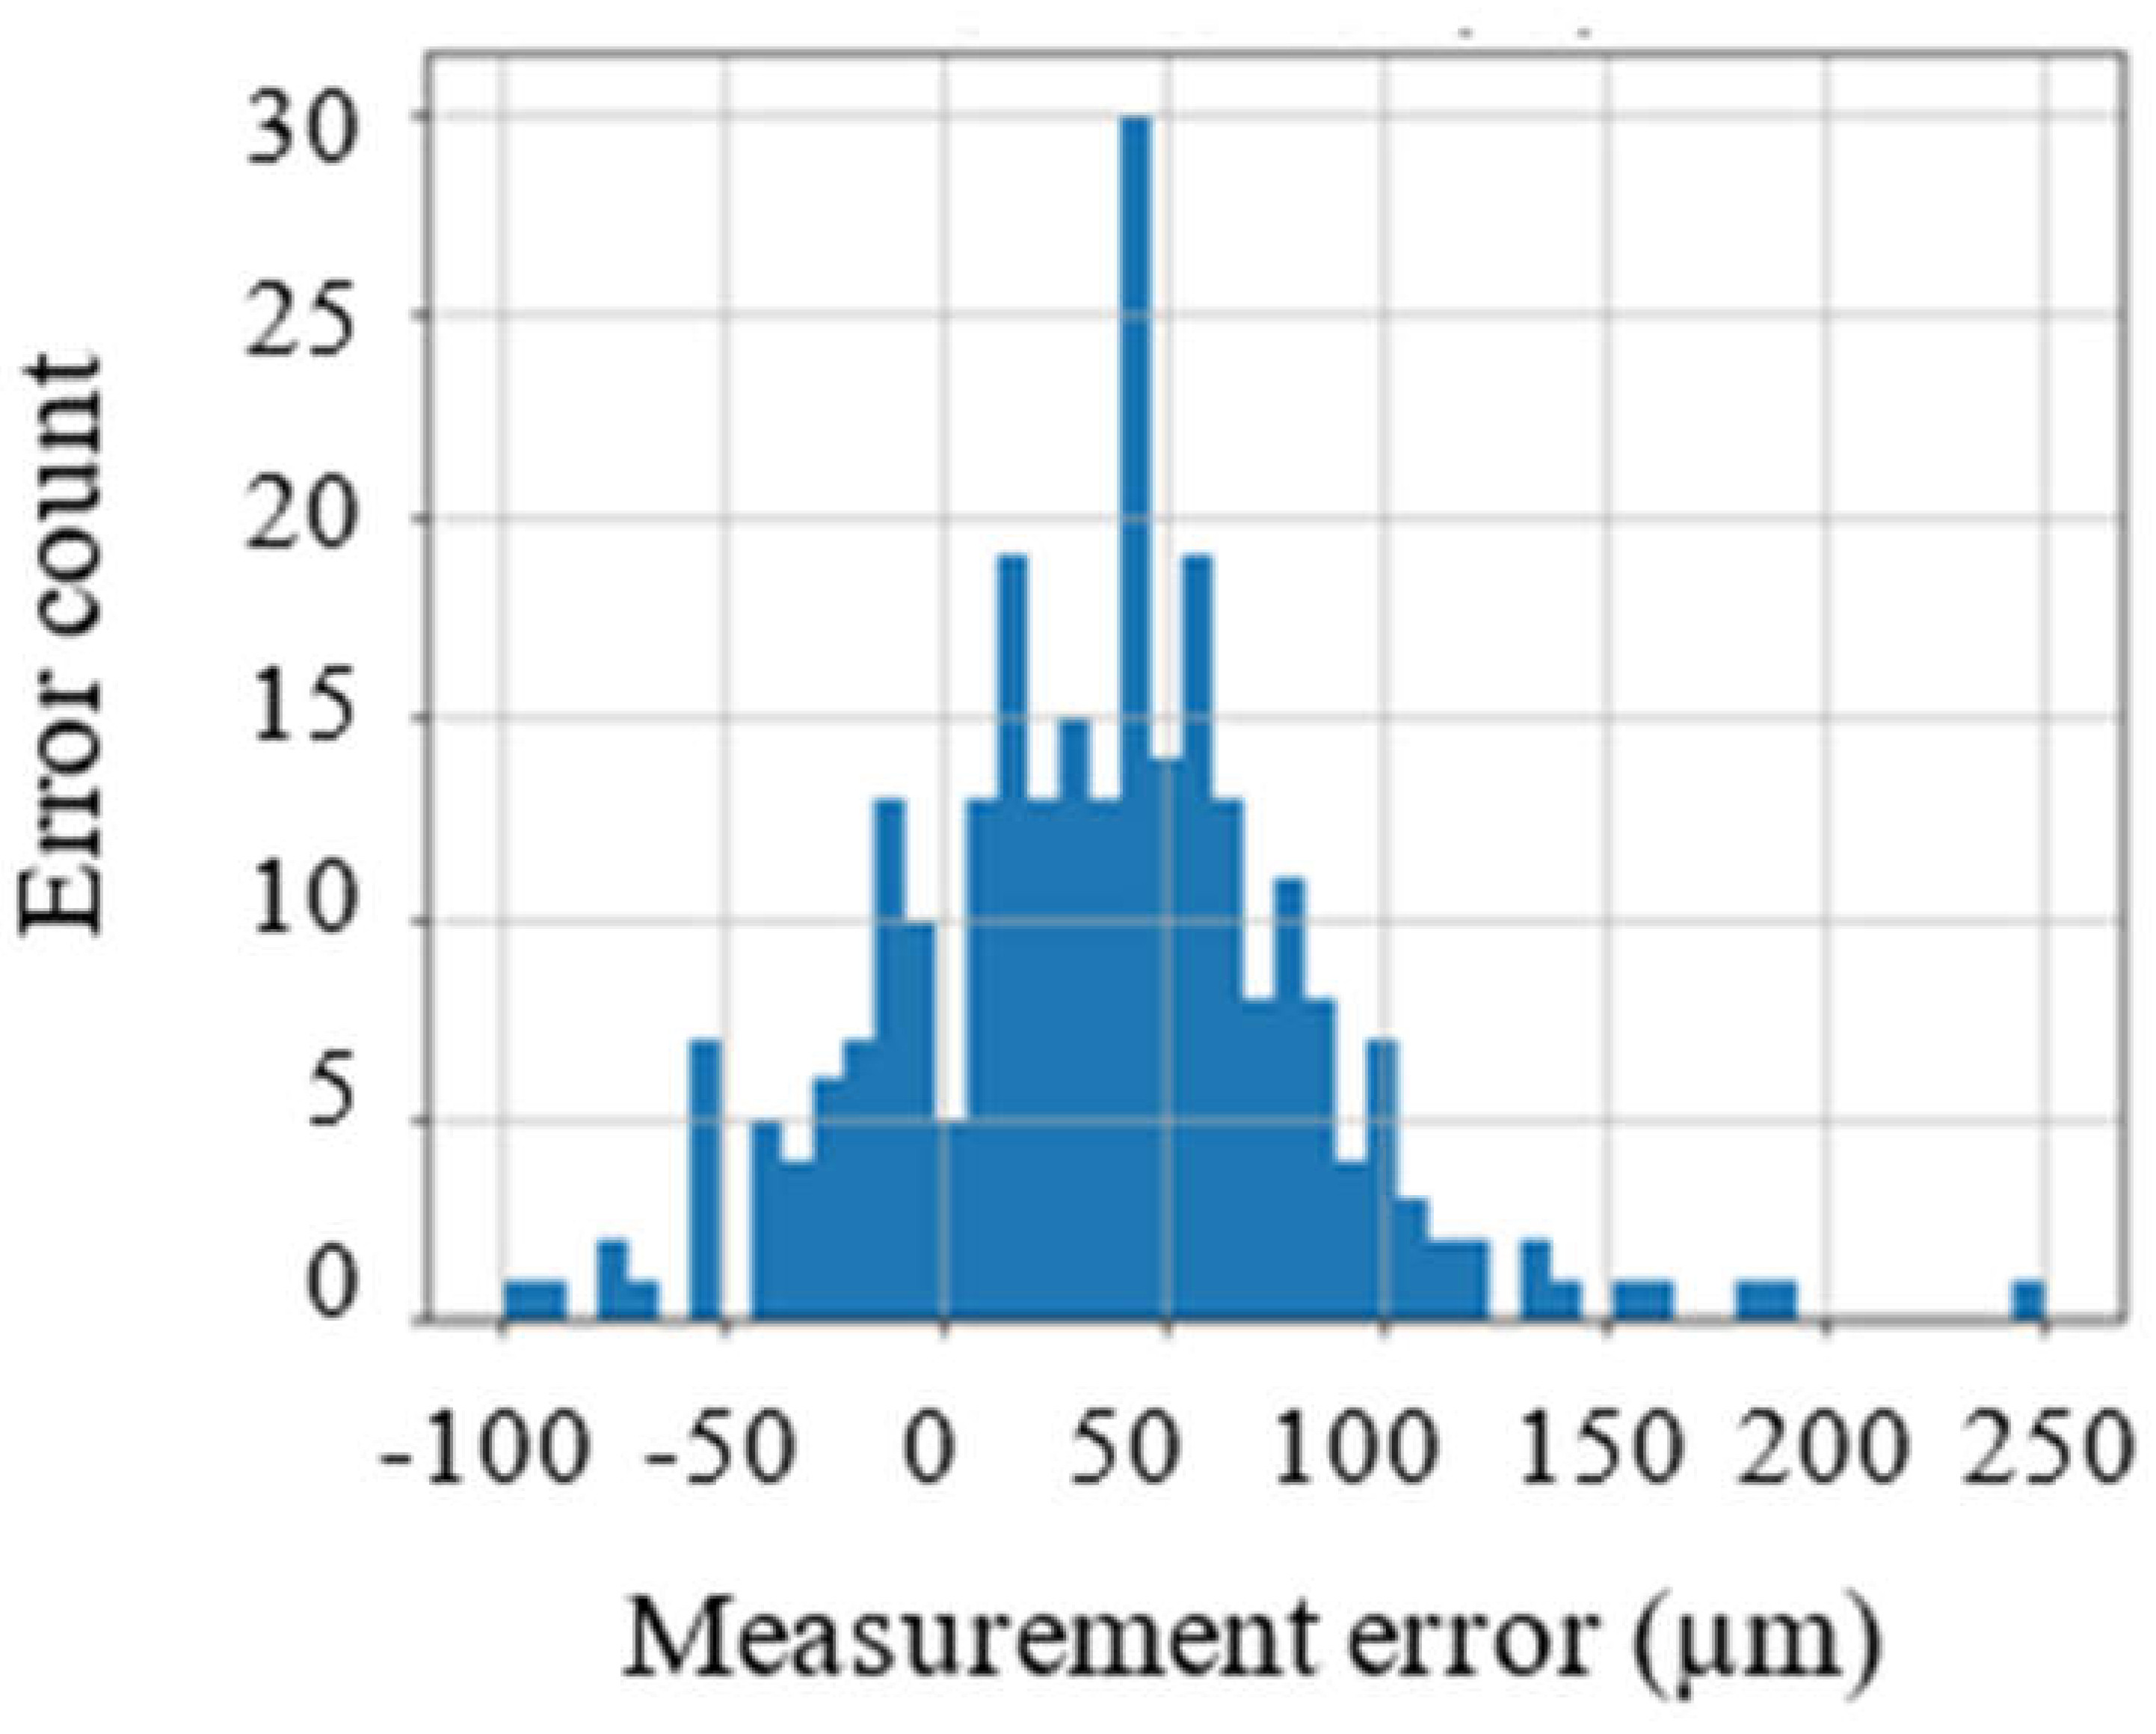
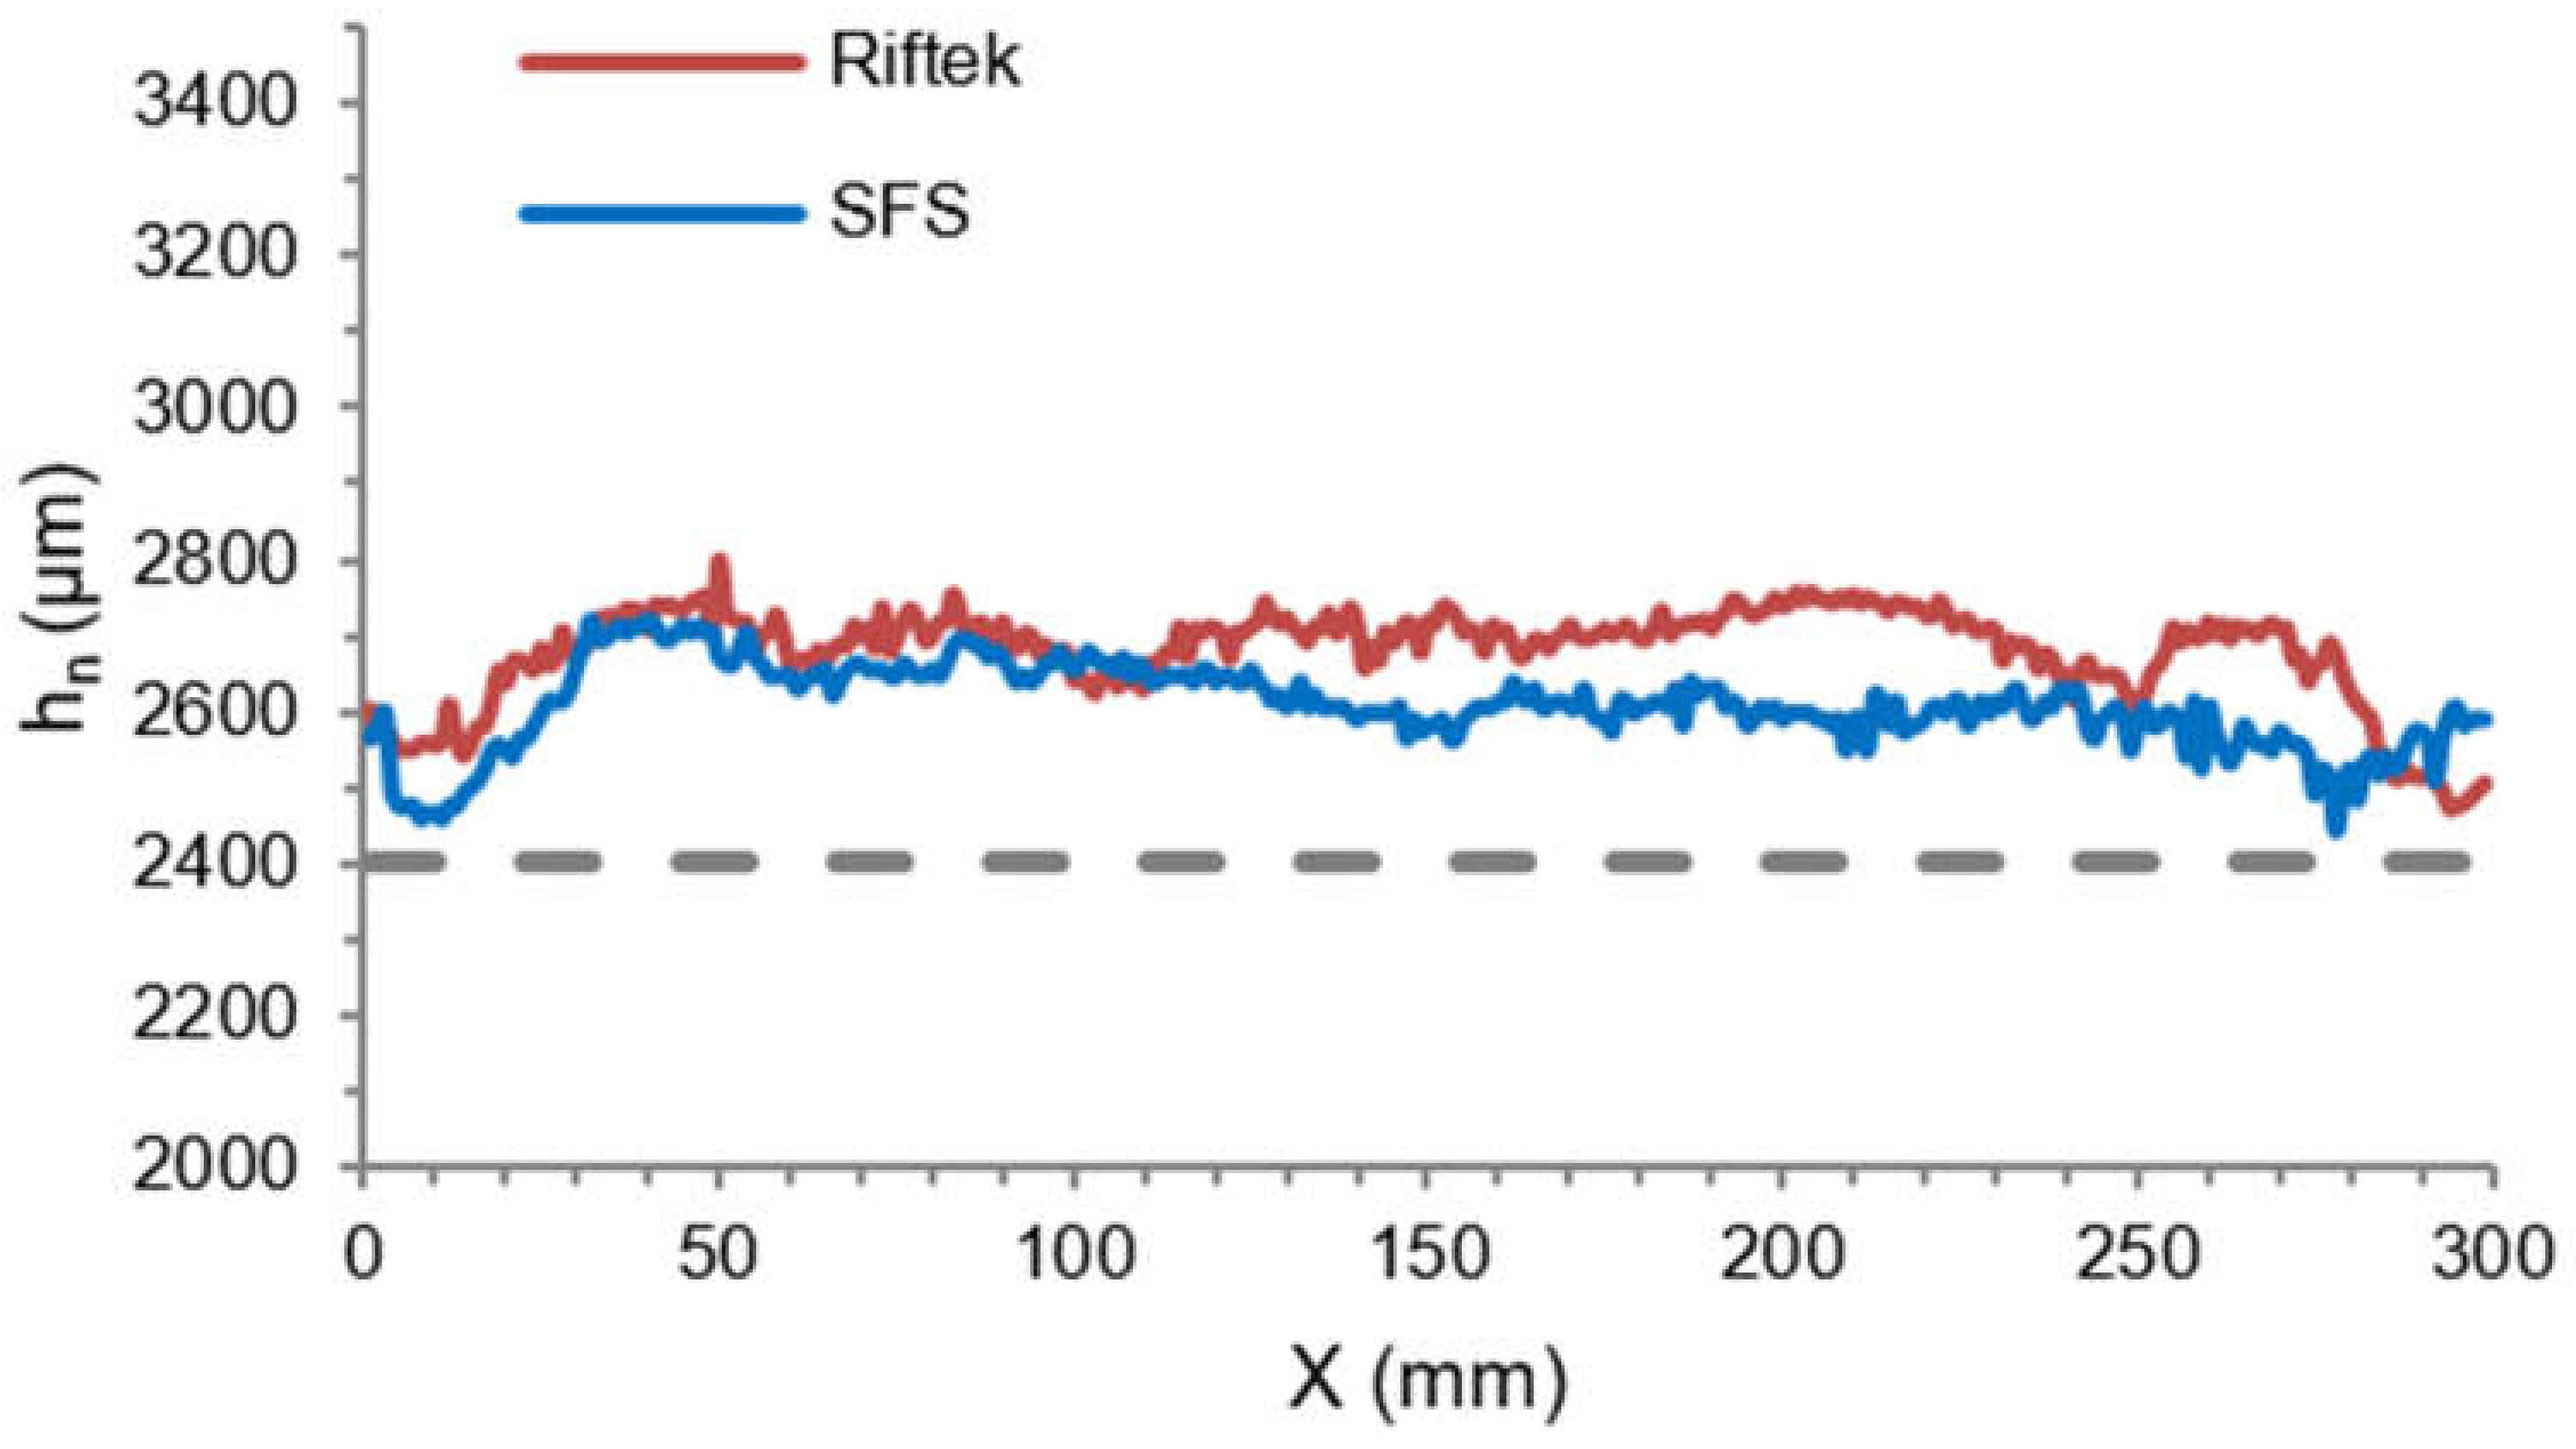
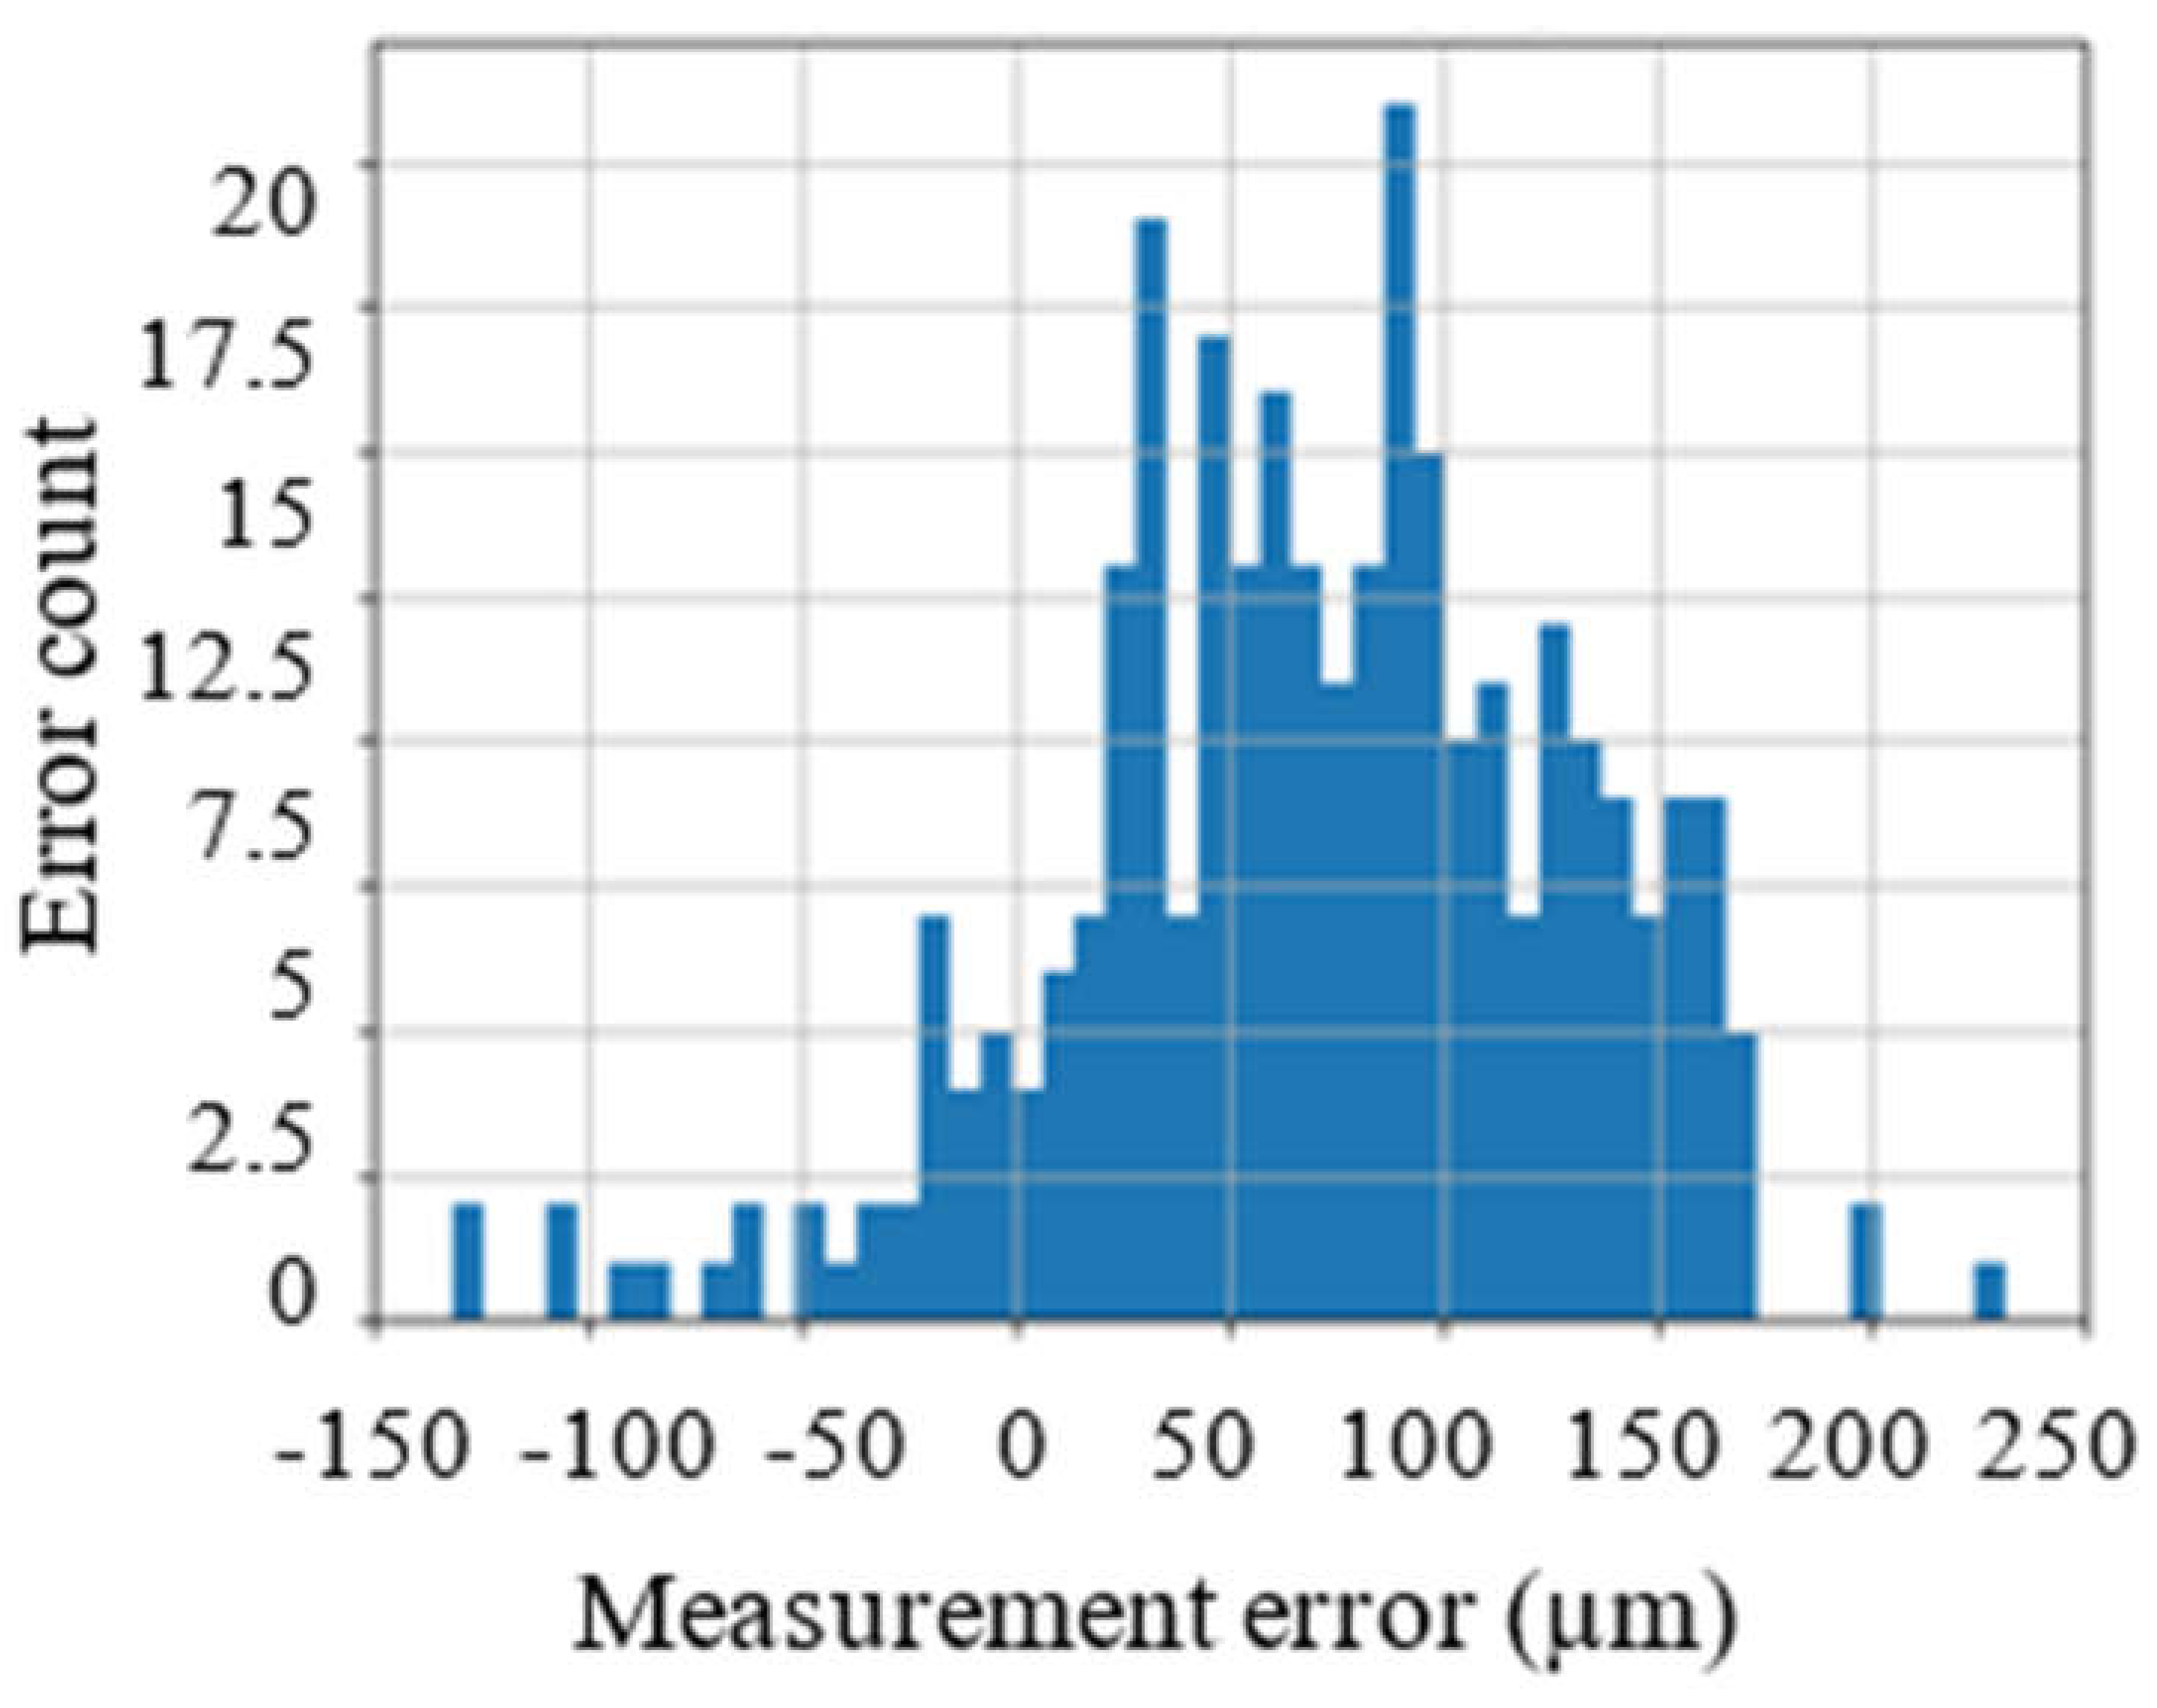
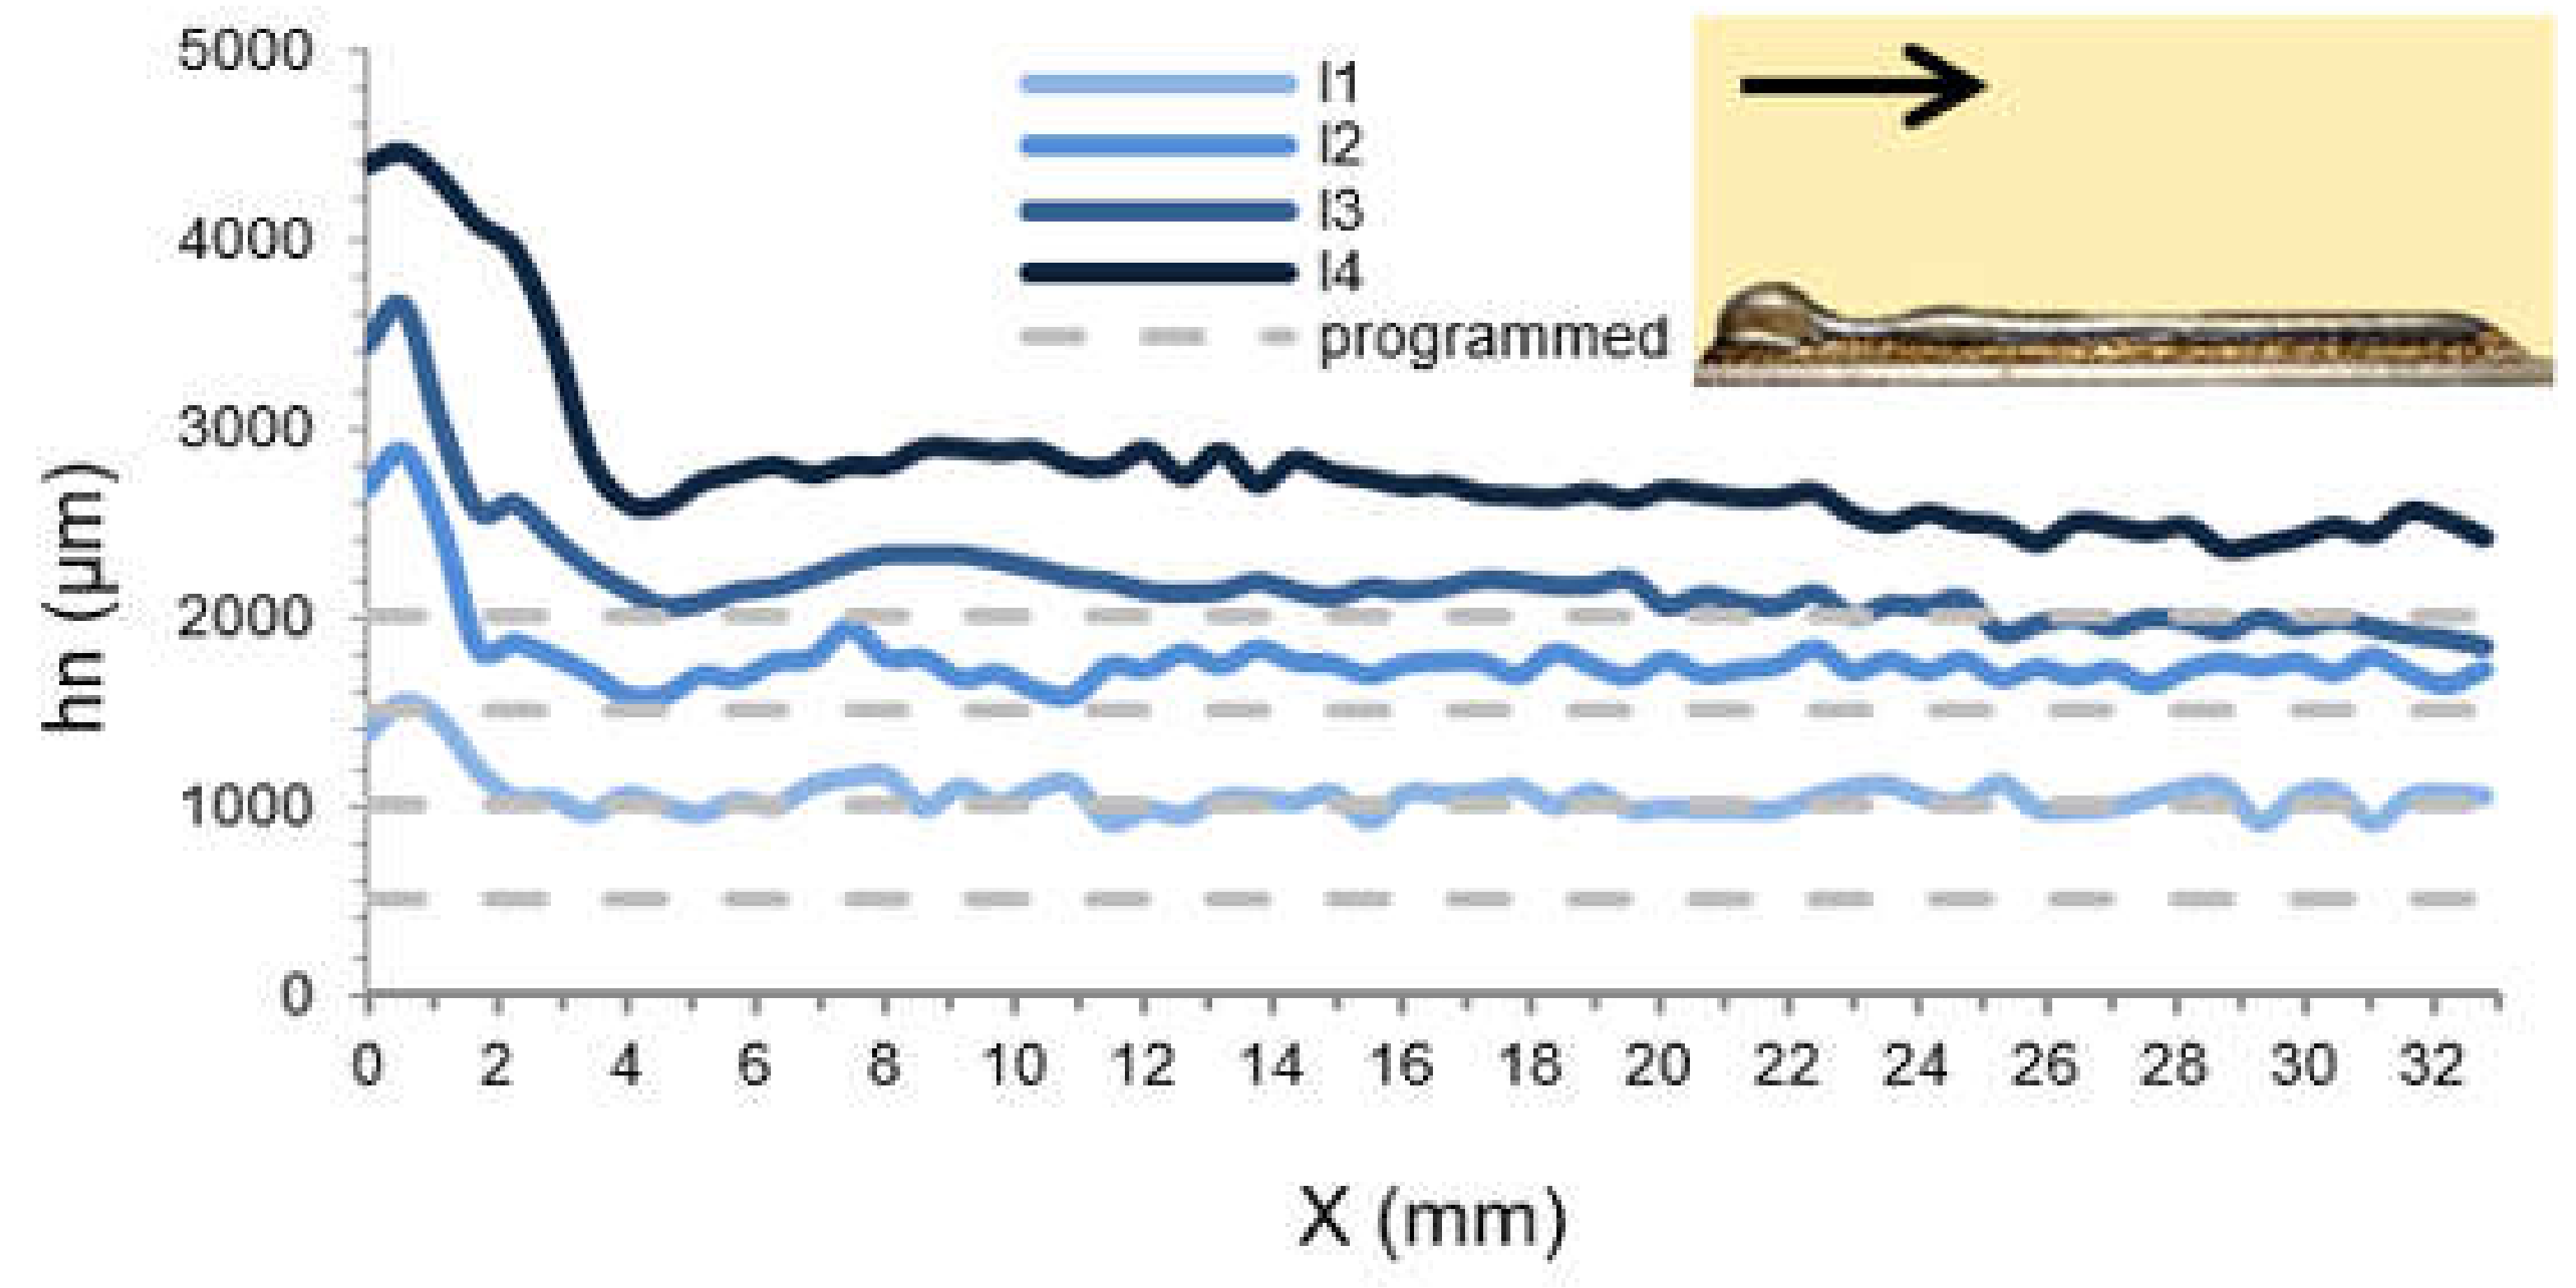
In this paper, a height measurement technique called shape-from-shadow and its implementation have been presented. The technique combines a triangulation principle with machine vision techniques and algorithms, which allows for performing the in-line height measurement of the LMD (single track single-and multi-layer deposits). The validation of the SFS technique was performed through the evaluation of linearity and precision (σ2 (95.45%) = 160 um) in contrast to the conventional 2D laser triangulation scanner. The proposed technique can allow for real-time visual inspection of the deposition process, in-line measurement of the deposition growth, and can complement existing monitoring solutions. A proven feasibility of using SFS in-line measuring in a multilayer LMD shows its potential to use it to control the height of the deposit.
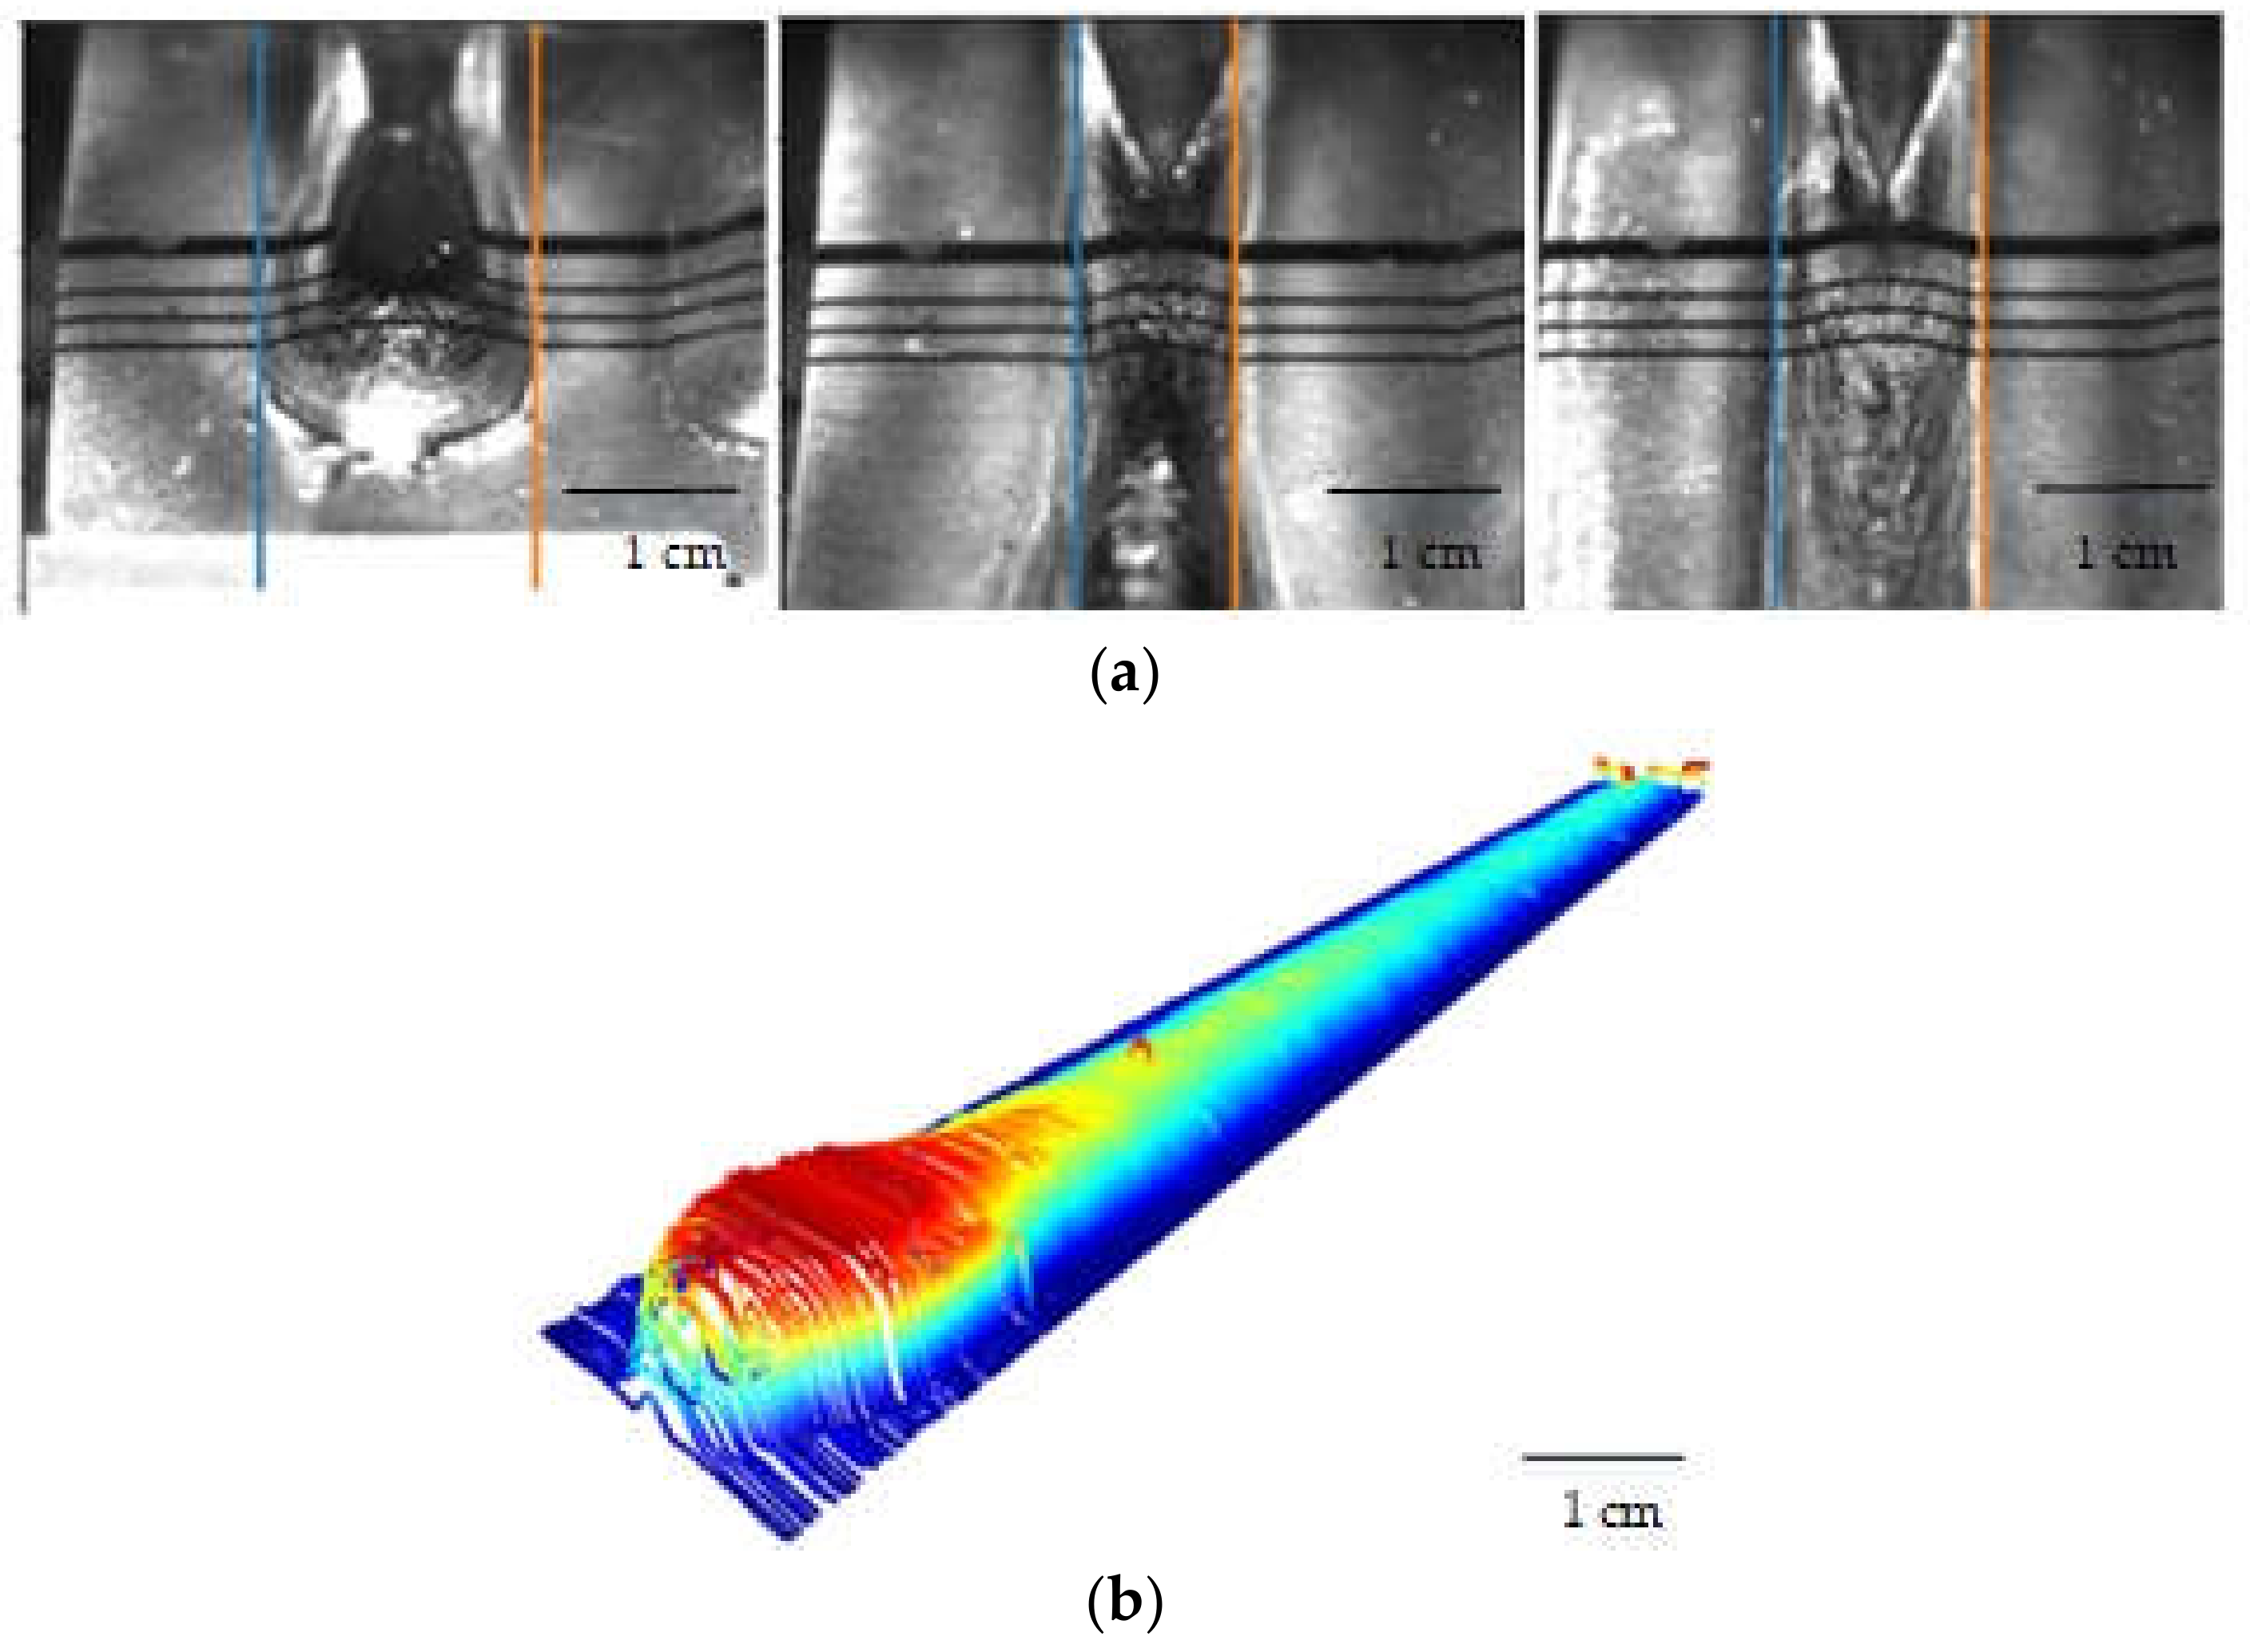
The application of shape-from-shadow was also proven in a WAAM process showing its wider applicability. In this specific case, it may be stated that the shape-from-shadow system presented in this work serves as a good alternative for in-line wetting angle measurement in the first and critical layer of the WAAM process. Not only that, it also provides the width and height related information just after the melt pool has solidified. This brings great benefits with respect to any offline measurements, since the implementation of the shape-from-shadow may allow, in the future, the implementation of corrective measures whenever it is required. Results validity was verified by cutting the welds at specific locations and measuring the same values through microscopy. Both height and width showed good agreement with the maximum differences below 10%. In the case of the wetting angle, SFS tended to provide longer values, which may be due to the impossibility of replicating the same procedure in microscopy. Nevertheless, the same tendency was observed, which indicates that in spite of the difference in the absolute value, SFS captures the wetting angle changes during the process.
It is noteworthy that measurements are affected by some factors such as the variation of lighting conditions due to the different optical properties of the deposited materials, the surface roughness of the substrate and the LMD or WAAM deposits, and the presence of the glare from a melt pool. Due to the shape of the shadow pattern and the use of just one camera, the presented setup is only capable of measuring the LMD and WAAM track in the deposition direction.
Future work will focus on improving the image processing algorithm, the robustness of the height measurement, the width of the LMD and WAAM track, synchronization of the CNC cinematics with height measurement performed by SFS, and omnidirectional height measurement. We reckon that it will allow for the application of SFS to more complex trajectories and real components. Additionally, the usage of the lateral camera of the SFS for track height verification, process flow monitoring, melt pool geometry, and dynamics will be addressed. Further investigation of SFS usage for contact angle measurement is planned for experiments in progress.

6. Patents

Herman Borovkov, Aitor Garcia de la Yedra, Juan Carlos Pereira patent N° 20383119.3-1010 filed on 10 February 2021.

Author Contributions

Conceptualization, H.B. and A.G.d.l.Y.; Data curation, H.B., X.Z., and X.A.; Formal analysis, H.B.; Funding acquisition, A.G.d.l.Y. and F.C.; Investigation, H.B. and F.C.; Methodology, H.B.; Project administration, A.G.d.l.Y., P.A., J.C.P., and F.C.; Resources, A.G.d.l.Y., J.C.P., and F.C.; Software, H.B., X.Z., and X.A.; Supervision, A.G.d.l.Y., P.A., and F.C.; Validation, J.C.P. and F.C.; Visualization, H.B., X.Z., and X.A.; Writing—original draft, H.B.; Writing—review & editing, A.G.d.l.Y., P.A., and J.C.P. All authors have read and agreed to the published version of the manuscript.

Funding

This research was funded by the European Institute of Innovation & Technology (EIT), a body of the European Union, under grant agreement no. 20075.

Data Availability Statement

The data presented in this study are available on request from the corresponding author. The data are not publicly available due to confidential non-disclosure agreement.

Conflicts of Interest

The authors declare no conflict of interest. The funders had no role in the design of the study; in the collection, analyses, or interpretation of data; in the writing of the manuscript, or in the decision to publish the results.

References

  1. International Organization for Standardization. ISO/ASTM 52900:2015 Additive Manufacturing—General Principles—Terminology; NSAI: Leinster, Ireland, 2015. [Google Scholar]
  2. ASTM F3187-16, Standard Guide for Directed Energy Deposition of Metals; ASTM International: West Conshohocken, PA, USA, 2016.
  3. Shamsaei, N.; Yadollahi, A.; Bian, L.; Thompson, S.M. An overview of direct laser deposition for additive manufacturing; part II: Mechanical behavior, process parameter optimization and control. Addit. Manuf. 2015, 8, 12–35. [Google Scholar] [CrossRef]
  4. Dass, A.; Moridi, A. State of the art in directed energy deposition: From additive manufacturing to materials design. Coatings 2019, 9, 418. [Google Scholar] [CrossRef] [Green Version]
  5. Greer, C.; Nycz, A.; Noakes, M.; Richardson, B.; Post, B.; Kurfess, T.; Love, L. Introduction to the design rules for metal big area additive manufacturing. Addit. Manuf. 2019, 27, 159–166. [Google Scholar] [CrossRef]
  6. Pan, Z.; Ding, D.; Wu, B.; Cuiuri, D.; Li, H.; Norrish, J. Arc welding processes for additive manufacturing: A review. In Transactions on Intelligent Welding Manufacturing; Chen, S., Zang, Y., Feng, Z., Eds.; Springer: Singapore, 2018; pp. 3–24. [Google Scholar] [CrossRef]
  7. Kwak, Y.-M.; Doumanidis, C. Geometry regulation of material deposition in near-net shape manufacturing by thermally scanned welding. J. Manuf. Process. 2002, 4, 28–41. [Google Scholar] [CrossRef]
  8. Xiong, J.; Zhang, G.; Qiu, Z.; Li, Y. Vision-sensing and bead width control of a single-bead multi-layer part: Material and energy savings in GMAW-based rapid manufacturing. J. Clean. Prod. 2013, 41, 82–88. [Google Scholar] [CrossRef]
  9. Xiong, J.; Yin, Z.; Zhang, W. Closed-loop control of variable layer width for thin-walled parts in wire and arc additive manufacturing. J. Mater. Process. Technol. 2016, 233, 100–106. [Google Scholar] [CrossRef]
  10. Xiong, J.; Zhang, G. Adaptive control of deposited height in GMAW-based layer additive manufacturing. J. Mater. Process. Technol. 2014, 214, 962–968. [Google Scholar] [CrossRef]
  11. Chabot, A.; Rauch, M.; Hascoët, J.Y. Towards a multi-sensor monitoring methodology for AM metallic processes. Weld World 2019, 63, 759–769. [Google Scholar] [CrossRef]
  12. Xu, F.; Dhokia, V.; Colegrove, P.; McAndrew, A.; Williams, S.; Henstridge, A.; Newman, S.T. Realisation of a multi-sensor framework for process monitoring of the wire arc additive manufacturing in producing Ti-6Al-4V parts. Int. J. Comput. Integr. Manuf. 2018, 31, 785–798. [Google Scholar] [CrossRef]
  13. Lindskog, A. Precise calibration and reliable operation of laser process tools—Focus position system. In Proceedings of the Lasers in Manufacturing 2003, Munich, Germany, 24–26 June 2003; pp. 247–251. [Google Scholar]
  14. Meriaudeau, F.; Truchetet, F. Control and optimization of the laser cladding process using matrix cameras and image processing. J. Laser Appl. 1996, 8, 317–324. [Google Scholar] [CrossRef]
  15. Toyserkani, E.; Khajepour, A. A mechatronics approach to laser powder deposition process. Mechatronics 2006, 16, 631–641. [Google Scholar] [CrossRef]
  16. Iravani-Tabrizipour, M.; Toyserkani, E. An image-based feature tracking algorithm for real-time measurement of clad height. Mach. Vis. Appl. 2007, 18, 343–354. [Google Scholar] [CrossRef]
  17. Asselin, M.; Toyserkani, E.; Iravani-Tabrizipour, M.; Khajepour, A. Development of trinocular CCD-based optical detector for real-time monitoring of laser cladding. In Proceedings of the IEEE International Conference Mechatronics and Automation, Niagara Falls, ON, Canada, 29 July–1 August 2005; Volume 4, pp. 1190–1196. [Google Scholar]
  18. Han, L.; Phatak, K.M.; Liou, F.W. Modeling of laser cladding with powder injection. Met. Mater. Trans. B 2004, 35, 1139–1150. [Google Scholar] [CrossRef]
  19. Mehrdad, I.; Asselin, M.; Toyserkani, E. Development of an image-based feature tracking algorithm for real-time clad height detection. IFAC Proc. Vol. 2006, 39, 914–920. [Google Scholar]
  20. Davis, T.A.; Shin, Y.C. Vision-based clad height measurement. Mach. Vis. Appl. 2011, 22, 129–136. [Google Scholar] [CrossRef]
  21. Bi, G.J.; Gasser, A.; Wissenbach, K.; Drenker, A.; Poprawe, R. Investigation on the direct laser metallic powder deposition process via temperature measurement. Appl. Surf. Sci. 2006, 253, 1411–1416. [Google Scholar] [CrossRef]
  22. Bi, G.J.; Schurmann, B.; Gasser, A.; Wissenbach, K.; Poprawe, R. Development and qualification of a novel laser-cladding head with integrated sensors. Int. J. Mach. Tools Manuf. 2007, 47, 555–561. [Google Scholar] [CrossRef]
  23. Tang, L.; Ruan, J.; Sparks, T.E.; Landers, R.G.; Liou, F. Layer-to-layer height control of laser metal deposition processes. In Proceedings of the American Control Conference, St. Louis, MO, USA, 10–12 June 2009; pp. 5582–5587. [Google Scholar]
  24. Heralić, A.; Christiansson, A.K.; Ottosson, M.; Lennartson, B. Increased stability in laser metal wire deposition through feedback from optical measurements. Opt. Lasers Eng. 2010, 48, 478–485. [Google Scholar] [CrossRef]
  25. Heralić, A.; Christiansson, A.-K.; Lennartson, B. Height control of laser metal-wire deposition based on iterative learning control and 3D scanning. Opt. Lasers Eng. 2012, 50, 1230–1241. [Google Scholar] [CrossRef]
  26. Denlinger, E.R.; Heigel, J.C.; Michaleris, P.; Palmer, T.A. Effect of inter-layer dwell time on distortion and residual stress in additive manufacturing of titanium and nickel alloys. J. Mater. Process. Technol. 2015, 215, 123–131. [Google Scholar] [CrossRef]
  27. Heigel, J.C.; Michaleris, P.; Palmer, T.A. In Situ monitoring and characterization of distortion during laser cladding of Inconel® 625. J. Mater. Process. Technol. 2015, 220, 135–145. [Google Scholar] [CrossRef]
  28. Segerstark, A.; Andersson, J.; Svensson, L.-E. Investigation of laser metal deposited Alloy 718 onto an EN 1.4401 stainless steel substrate. Opt. Laser Technol. 2017, 97, 144–153. [Google Scholar] [CrossRef]
  29. Aubry, P.; Guiraud, M.; Malot, T.; Verdier, K. Process control on laser cladding by coaxial vision for direct manufacturing of 3D metallic structures. In Proceedings of the Pacific International Conference on Applications of Lasers and Optics, Beijing, China, 16–18 April 2008; pp. 402–407. [Google Scholar] [CrossRef]
  30. Garmendia, I.; Leunda, J.; Pujana, J.; Lamikiz, A. In-process height control during laser metal deposition based on structured light 3D scanning. Procedia CIRP 2018, 68, 375–380. [Google Scholar] [CrossRef]
  31. Gardner, M.R.; Lewis, A.; Park, J.; McElroy, A.B.; Estrada, A.D.; Fish, S.; Beaman, J.J., Jr.; Milner, T.E. In situ process monitoring in selective laser sintering using optical coherence tomography. Opt. Eng. 2018, 57, 041407. [Google Scholar] [CrossRef] [PubMed] [Green Version]
  32. Guan, G.; Hirsch, M.; Lu, Z.H.; Childs, D.T.; Matcher, S.J.; Goodridge, R.; Groom, K.; Clare, A.T. Evaluation of selective laser sintering processes by optical coherence tomography. Mater. Des. 2015, 88, 837–846. [Google Scholar] [CrossRef]
  33. Song, L.; Bagavath-Singh, V.; Dutta, B.; Mazumder, J. Control of melt pool temperature and deposition height during direct metal deposition process. Int. J. Adv. Manuf. Technol. 2012, 58, 247–256. [Google Scholar] [CrossRef]
  34. Tang, Z.J.; Liu, W.W.; Wang, Y.W.; Saleheen, K.M.; Liu, Z.C.; Peng, S.T.; Zhang, H.C. A review on In Situ monitoring technology for directed energy deposition of metals. Int. J. Adv. Manuf. Technol. 2020, 1–27. [Google Scholar] [CrossRef]
  35. Wang, Q.; Li, J.; Nassar, A.R.; Reutzel, E.W.; Mitchell, W.F. Model-based feedforward control of part height in directed energy deposition. Materials 2021, 14, 337. [Google Scholar]
  36. Arana, M.; Ukar, E.; Rodriguez, I.; Iturrioz, A.; Alvarez, P. Strategies to reduce porosity in Al-Mg WAAM parts and their impact on mechanical properties. Metals 2021, 11, 524. [Google Scholar] [CrossRef]
Figure 1. Wetting angle variable in detail of the bead cross-section.
Jmmp 05 00085 g001
Figure 2. Schematic depiction of the SFS height measurement principle.
Jmmp 05 00085 g002
Figure 3. Schematic depiction of the LMD powder nozzle with the geometrical arrangement of the SFS.
Jmmp 05 00085 g003
Figure 4. Set-up employed for the wetting angle measurement.
Jmmp 05 00085 g004
Figure 5. Two different configurations for the wetting angle measurement; (a) measurement at molten metal (image on the right) and (b) measurement at the just solidified weld bead.
Jmmp 05 00085 g005
Figure 6. Height measurement data of the region of interest of single track and single layer. (a) Performed by the SFS and the laser scanner, (b) feeler gauges used for the linearity test.
Jmmp 05 00085 g006
Figure 7. Height measurement data of the region of interest of the LMD single layer single track performed by the SFS and the laser scanner.
Jmmp 05 00085 g007
Figure 8. Error distribution histogram.
Jmmp 05 00085 g008
Figure 9. Height measurement data of the region of interest of LMD thin-wall fabrication performed by the SFS and the laser scanner.
Jmmp 05 00085 g009
Figure 10. Error distribution histogram.
Jmmp 05 00085 g010
Figure 11. SFS raw image camera (a) and the processed image with detected shadow line (b).
Jmmp 05 00085 g011
Figure 12. Results of LMD in-line layer height measurements from SFS images acquired by the lateral camera.
Jmmp 05 00085 g012
Figure 13. Shape-from-shadow measurement system. (a) Example of image sequence of the (upper image) and (b) 3D weld reconstruction (lower image).
Jmmp 05 00085 g013
Figure 14. Results of WOC height and wetting angle measurements. (a) Height distribution along the weld (image on the upper side) and (b) contact angle for high current sample (130 A, image on the lower side).
Jmmp 05 00085 g014aJmmp 05 00085 g014b
Table 1. LMD setup parameters.
Process Laser SourceTRUMPF Trudisk 6002
Maximum laser power5 kW
Emission wavelength1030 nm
Beam spot diameter1.2–4 mm
Standoff distance (SOD)12 mm
Process focal lengthf1 = 200 mm
Deposited materialInconel 718 powder (45–90 µm PSD)
Table 2. Shape-from-shadow setup parameters for LMD and WOC.
LMDWOC
Illuminated area diameter≃20 mm≃60 mm
Acquisition rate30 Hz60 Hz
Imaging focal lengthf1 = 150 mmf1 = 50 mm
Exposure time5 μs5 μs
Measuring range4 mm20 mm
Angle θ85°17°
Table 3. Error statistics.
Laser Scanner (µm)SFS (µm)
mean2313
std16.59.1
min174
max6047
Table 4. LMD process parameters for trials.
Laser Power
(W)
Scanning Speed
(mm/min)
Powder Feed
(g/min)
Laser Spot Diameter
(mm)
28001000264
Table 5. Error statistics (µm).
Counts250
mean35.18
std47.72
min−99.70
25%7.07
50%37.40
75%61.15
max250.00
Quantiles (µm)
σ1 (68.27%)55
σ2 (95.45%)109.8
σ3 (99.73%)207
Table 6. Single layer single track process parameters for the precision test.
Laser Power
(W)
Scanning Speed
(mm/min)
Powder Feed
(g/min)
Laser Spot Diameter
(mm)
4501000151.2
Table 7. Error statistics (µm).
Counts300
mean71.05
std59.47
min−131.90
25%33.1
50%72.50
75%111.30
max231.70
Quantiles (µm)
σ1 (68.27%)98
σ2 (95.45%)160
σ3 (99.73%)206
Table 8. Single layer single track process parameters for the precision test.
Laser Power
(W)
Scanning Speed
(mm/min)
Powder Feed
(g/min)
Laser Spot Diameter
(mm)
10001000152
Table 9. Comparison of the low and high energy WOC samples (low and high heat inputs).
Low Energy Input(115 A)High Energy Input (130 A)
Weld location (mm)1525607015256070
Width (mm)6.607.217.537.587.568.258.288.25
Height (mm)2.152.452.422.412.672.401.751.80
Contact Angle, left
(° deg)
122.43122.94130.41127.92112.59137.52138.76149.93
Contact Angle, right
(° deg)
120.14113.67125.05125.74112.88133.06142.82142.61
Table 10. Shape-from-shadow vs. cross-section measurement comparison.
Low Energy Input(115 A)High Energy Input (130 A)
Weld location (mm)1525607015256070
Error width (mm)−0.32−0.51−0.66−0.73−0.41−0.210.330.21
Error height (mm)0.130.150.090.03−0.170.100.070.12
Error Contact Angle, left
(° deg)
−1.34−3.65−3.23−7.17−10.34−4.17−5.271.90
Error Contact Angle, right
(° deg)
−1.36−11.83−7.32−6.37−11.93−5.87−2.45−6.68
Publisher’s Note: MDPI stays neutral with regard to jurisdictional claims in published maps and institutional affiliations.

