Article

Prediction of Orthotropic Hygroscopic Swelling of Fiber-Reinforced Composites from Isotropic Swelling of Matrix Polymer

by
Andrey E. Krauklis
*,
Abedin I. Gagani
and
Andreas T. Echtermeyer
Department of Mechanical and Industrial Engineering (past: Department of Engineering Design and Materials), Norwegian University of Science and Technology, 7491 Trondheim, Norway
*
Author to whom correspondence should be addressed.
Submission received: 12 December 2018 / Revised: 20 December 2018 / Accepted: 8 January 2019 / Published: 12 January 2019

Abstract

:
Swelling in fiber-reinforced composites is anisotropic. In this work, dealing with glass fiber epoxy composite immersed in distilled water, swelling coefficients are obtained in each direction experimentally. Swelling behaviour in the fiber direction was constrained by the non-swelling fibers and was close to null, while swelling in the transverse directions was found to occur freely—similar to the unconstrained polymer. An analytical method for predicting anisotropic swelling in composites from the swelling of the matrix polymer is reported in this work. The method has an advantage that it is simple to use in practice and requires only a swelling coefficient of the matrix polymer, elastic constants of the matrix and fibers, and a known fiber volume fraction of the composite. The method was validated using finite element analysis. Good agreement was obtained and is reported between experimental hygroscopic swelling data, analytical and numerical results for composite laminates, indicating the validity of this predictive approach.

1. Introduction

Fiber-reinforced composite (fiber-reinforced polymer; FRP) laminates are used for structural applications in marine, offshore and oil and gas industries due to their light weight and corrosion resistance [1,2,3]. Composites offshore have been implemented in such applications as risers, tethers, repair patches and ship hulls [4,5,6,7,8]. In these applications, FRPs are exposed to water and experience subsequent water-induced or hygroscopic swelling [1,2,3].
One of the main effects of water on the mechanical property deterioration of polymers is swelling, even more so if the polymer is not affected by hydrolysis or chain scission, such as the epoxy in this study [1,9]. Swelling is a specific response accompanying moisture diffusion in polymers and polymer-based composites [2]. Susceptibility of polymers to swelling results in a two-fold effect on FRPs: on the one hand, it causes a decrease in mechanical strength of the polymeric matrix [9], while on the other, it results in swelling stresses when the hygroscopic swelling is restrained [10].
In FRPs, the matrix is constricted by fibers, and as a result, this affects the swelling behaviour. What complicates the phenomenon even more is the orthotropic nature of swelling of composites—fibers, such as glass or carbon, do not swell, while the polymer does [3,10]. Such incompatible swelling behaviour in FRPs leads to swelling stresses at the interfaces, which may lead to microcrack formation, especially under transient conditions (non-uniform moisture content distribution) [3,11]. Hygroscopic swelling may affect the mechanical properties of FRPs significantly [2,9,12,13]. Thus, it is important to know not only the moisture diffusion behaviour, but also the swelling behaviour, in order to properly characterize the FRP material property change, i.e., strength or modulus, resulting from moisture absorption. The focus of this work is on swelling and its orthotropic nature in FRPs.
The amount of hygroscopic strain found from dimensional change is normally assumed to be linearly proportional to the moisture concentration as follows (Equation (1)) [14]:
ε h = β W
where ε h is the hygroscopic strain, β is the coefficient of hygroscopic expansion (CHE), and W is the moisture concentration.
Linear strain behaviour has been observed experimentally with increasing moisture concentration for both composites and polymers [13,14]. For orthotropic laminates, three CHEs ( β x , β y , β z ) are needed in order to predict swelling. Strains in longitudinal (along-the-fibers) direction are often assumed to be null for composites with moisture-insensitive fibers, i.e., glass or carbon [15].
Quantification of the orthotropic CHEs can be performed experimentally using samples with different fiber orientations. However, it is a time-consuming and tedious process that also tends to involve quite high experimental scatters. The industrial interest lies in the reduction of testing time and testing-related expenses. Thus, a modelling approach to swelling of FRPs due to the effects of water (and also other liquids, such as oil) is of interest [16].
Various studies have been performed on swelling of FRPs [10,13,17,18,19,20,21,22,23,24,25] and, more recently, on hygroscopic swelling in textile composites [26,27]. The works available in the literature have addressed several aspects of hygroscopic swelling in composites, from the nature of swelling in polymeric matrix [3,10,28,29], to the influence of swelling on the fluid diffusion in polymers [13,16,23,30,31], to the development of micromechanical models to predict transverse swelling [17,26,27].
Ashton et al. [18] suggested the use of thermal expansion theory when dealing with hygroscopic swelling: in particular the Halpin-Tsai equation [19] for fluid diffusion and Schapery equation [20] for hygroscopic swelling of composites. Coran et al. [21] and Daniels [22] analyzed swelling of reinforced rubbers by means of thermodynamic theory of elasticity, confirming an orthotropic swelling behaviour and relating the elastic constants to the swelling constants of the rubber composite. Fan et al. [23] modelled a coupled diffusion and swelling of fiber-reinforced composites. Meng et al. [25] developed a multiscale model for coupled moisture diffusion and swelling in FRPs by means of finite element (FE) analysis. The model enabled evaluation of the fiber-matrix interfacial stresses [25]. Sinchuk et al. [26] developed a realistic voxel-model simulating fluid diffusion and hygroscopic swelling in a textile composite using a mesoscale approach of modelling the orthotropic tows and the resin-rich areas. In a later work, Sinchuk et al. [27] developed a hierarchical multiscale model for the prediction of hygroscopic swelling-induced stresses in textile composites.
An interesting opportunity would be the possibility to predict the orthotropic swelling constants (CHEs) of the composite from the CHE of the matrix polymer, which is isotropic. The matrix properties are easy to measure. Furthermore, they also may be found in literature for various polymers [28,32]. However, in some cases, the interfacial effects may not be negligible [33], many of the moisture-related properties of composites are known to be traceable to those of the matrix material [12,13]. Swelling strains of a composite and a matrix polymer should also be related to each other through a proper analysis [13,34]. Since swelling in polymers does not follow the ideal mixing law [2], i.e., the volume increase of the polymer is not equal to the volume of the absorbed water, and it is necessary to perform swelling experiments for the matrix polymer itself, or to find polymer CHE in the literature [28,32]. The composite swelling can then be analytically or numerically predicted from the swelling of the matrix polymer, as shown in this work.
Few works have investigated the anisotropic nature of swelling in unidirectional FRPs. In this work, the authors developed an analytical model based on linear elasticity. Both the analytical model and a finite element analysis employing a periodic representative volume element (RVE) were able to predict the orthotropic hygroscopic swelling of fiber-reinforced composites from the isotropic swelling of the polymer used as a matrix. The model was validated with experiments on glass fiber-reinforced epoxy composites, using the matrix isotropic CHE to predict directional swelling of the composite, and yielded a good agreement. To the best knowledge of the authors, this is the first micromechanical model that predicts the anisotropic swelling of composites from isotropic swelling of the polymer.

2. Materials and Methods
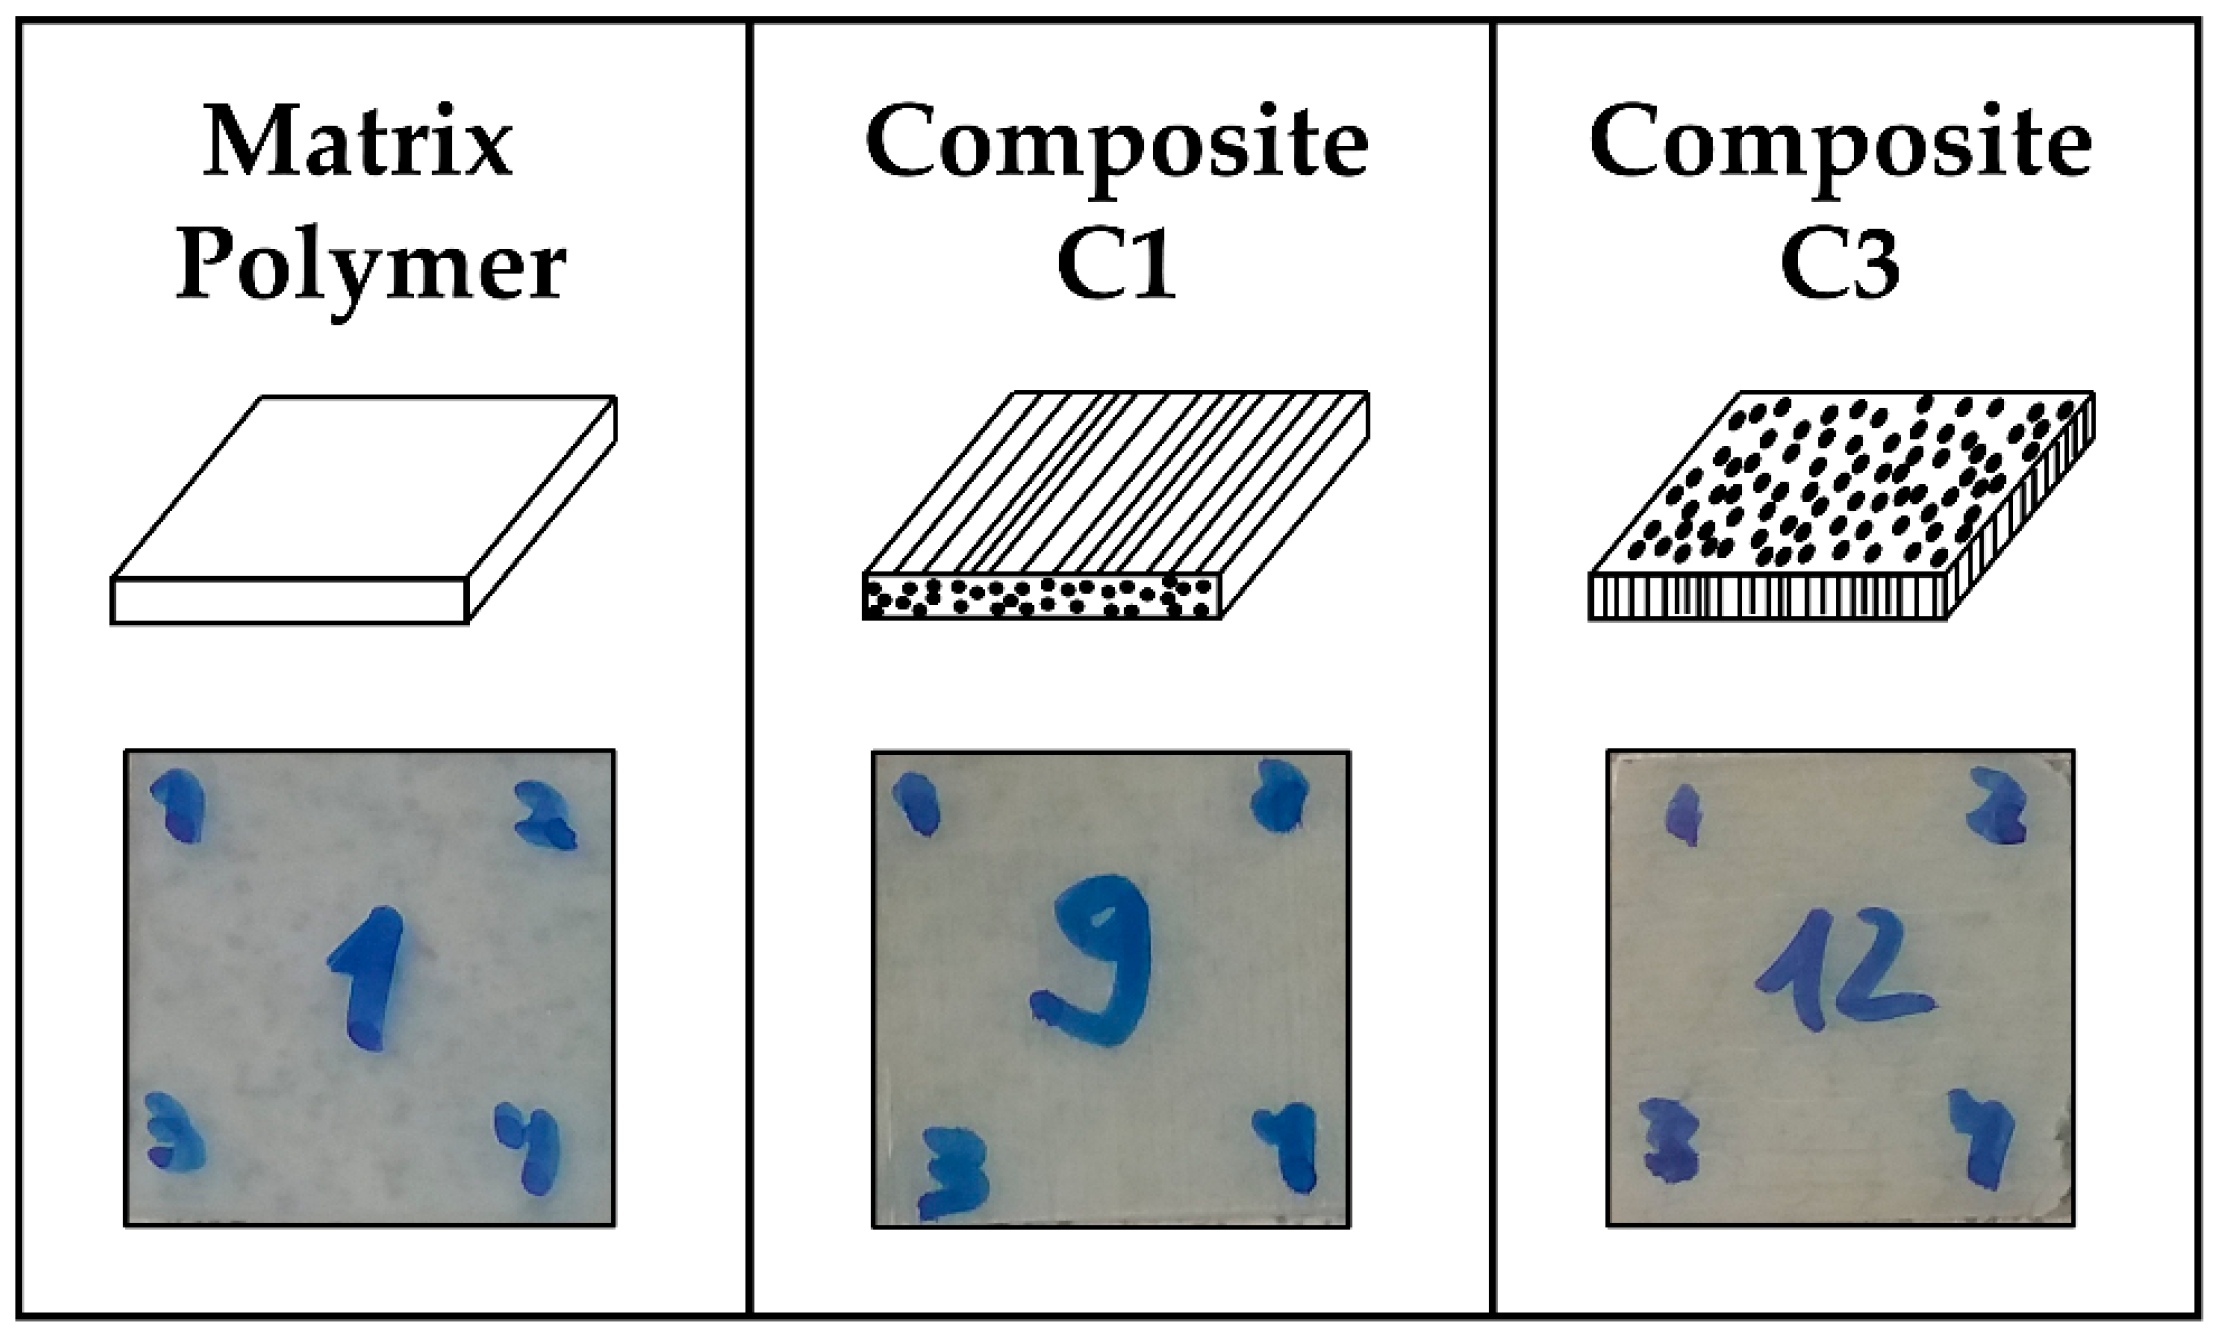
2.1. Materials

A typical glass fiber epoxy used for marine and oil and gas applications was selected for this study. HiPer-TexTM fabrics weaved by 3B Fibreglass (Birkeland, Norway) were used as a glass fiber reinforcement with an average fiber diameter of 17 μm. The density of glass ( ρ f ) was 2.54 g/cm3. HexionTM (Columbus, OH, USA) epoxy resin RIMR135TM and amine hardener RIMH137TM were used for preparing the matrix polymer by mixing in a stoichiometric ratio of 100:30 by weight. The resin and the curing agent consisted of the following compounds: bisphenol A diglycidyl ether (DGEBA), 1,6-hexanediol diglycidyl ether (HDDGE), poly(oxypropylene)diamine (POPA) and isophorondiamine (IPDA). The density of the polymer ( ρ m ) was 1.1 g/cm3. Before pouring, the mixture was degassed in a vacuum chamber for 0.5 h in order to remove bubbles. Degassed resin was moulded into rectangular-shaped moulds, followed by curing at room temperature for 24 h and post-curing in an air oven (Lehmkuhls Verksteder, Norway) at 80 °C for 16 h. After samples were post-cured, the polymer was cut into rectangular bars and then further cut into plates using a vertical bandsaw. The final dimensions of plates were 25 mm × 25 mm × 2 mm. The desired thickness was obtained using PHOENIX 2000 (Jean Wirtz, Germany) and SiC grinding discs (Struers, Cleveland, OH, USA; FEPA P500, grain size 30 µm). The sufficient thickness control, correct length and width was ensured within a 5% tolerance.
Glass fiber-reinforced epoxy composite laminates were prepared using vacuum assisted resin transfer moulding (VARTM). The same epoxy resin was used as for preparation of polymer samples. The composite laminate was cut into rectangular bars and subsequently into plates with different fiber orientations (C1 and C3 as shown in Figure 1). The dimensions of plates were 25 mm × 25 mm × 2 mm. The thickness was adjusted to 2 mm within 5% tolerance via grinding with a super fine sandpaper (FEPA P800, grain size 21.8 µm). The specified dimensions were achieved within 5% tolerance.
Distilled water (0.5–1.0 MΩ·cm) was used for conditioning matrix polymer and composite samples, produced via water purification system Aquatron A4000 (Cole-Parmer, Vernon Hills, IL, USA).

2.2. Methods

Fiber volume fractions were obtained by density measurements. The polymer and composite plates were exposed to water. The resulting changes in plate dimensions were measured using digital microscopy, allowing swelling-induced linear strains to be obtained at various water contents for matrix polymers ( ε m ) and for composites in 3 different directions ( ε x , ε y , ε z ).
The density of matrix polymer ( ρ m ) and glass fiber ( ρ f ) was 1.1 g/cm3 and 2.54 g/cm3, respectively. The density of the composite ( ρ c o m p o s i t e ) was determined to be 1.97 g/cm3 by measuring mass and dimensions of a large composite block. The volume and mass fractions of matrix polymer were calculated using Equations (2) and (3), respectively.
V f = ρ c o m p o s i t e ρ m ρ f ρ m
m f = ρ f · V f ρ m · ( 1 V f ) + ρ f · V f
The volume and mass fraction of the fibers were V f = 0.606 and m f = 0.780, respectively. The void content is ignored, because it was very low (less than 0.02 %—calculated from true water content [12]) and could be neglected. The true water content of a composite should be calculated according to [12]. If the void content is high, it should be considered.
Water uptake experiments were conducted using a batch system. A heated distilled water (60 ± 1 °C) bath was used for conditioning the polymer and composite plates. Samples were conditioned for a period of about two months up to reaching equilibrium. During this time, samples were taken out of the water bath at various times and weighed using analytical scales AG204 (± 0.1 mg; Mettler Toledo, Columbus, OH, USA). The moisture content (true water content) was calculated from experimental gravimetric data using a method described in more detail in another work that allows to obtain the mass of an absolutely dry plate [12]. The definition of moisture content used in this work is given in Equation (4):
W = m w a t e r m d r y   p l a t e · 100 % = m p l a t e m d r y   p l a t e m d r y   p l a t e · 100 %
where m p l a t e is the mass of epoxy or composite plate sample; m d r y   p l a t e is the mass of an absolutely dry epoxy or composite plate sample; m w a t e r is the mass of moisture uptaken by the plate.
The moisture content in composite plates was scaled by the mass matrix fraction as shown in Equation (5), since fibers do not take up moisture:
W m = W 1 m f
This operation is useful for easier comparison of swelling-induced strains between the matrix polymer and the composite laminates, since it is only the polymer part which is affected by swelling in composites.
Optical microscopy was performed using a digital microscope RH-2000 (Hirox, Tokyo, Japan) equipped with lens MXB-2500REZ with a magnification of 140 and resolution of 1.06 µm. Changes in the length and width of the plates were measured using the edge dimensions of the plates. The strains and swelling coefficients were obtained using Equations (6) and (7) for matrix polymer and composites, respectively:
ε m = l l 0 l 0 = β m W
ε i = l l 0 l 0 = β i W m
where i stands for x , y and z for respective swelling directions. Composite C1 was used to obtain swelling coefficients in the direction parallel to fibers ( β x ) and transverse to fibers ( β y ), while composite C3 also provided transverse-to-fibers swelling ( β z ) which was similar to and consistent with β y .

3. Model

3.1. Swelling Analytical Model

The swelling behaviour of a fiber-reinforced polymer composite can be estimated using a simple scheme where fiber and matrix are schematized as rectangular, in a cubic cell having unit dimensions 1 × 1 × 1, shown in Figure 2.
The RVE represented in Figure 2 is the result of periodicity and symmetry considerations. In fact, the RVE can be imagined as half model of a RVE comprised by matrix surrounded by fibers. Consequently, localized differential deformations and strains may arise in the RVE, but the global deformed shape does not bend, due to the symmetry along its lateral plane.
Composite transverse swelling, which occurs in direction y in Figure 2, can be predicted as a serial connection of fiber and matrix, hence:
ε y = V f ε f + ( 1 V f ) ε m
where ε y is the composite transverse swelling strain, V f the fiber volume fraction, ε f is the fiber swelling strain and ε m is the matrix swelling strain. For many engineering reinforcements (carbon fibers, glass fibers, etc.) the swelling is null, ε f = 0. In these cases, Equation (8) can be simplified as follows:
ε y = ( 1 V f ) ε m
The transverse swelling coefficient is defined in Equation (10) [35]:
β y = ε y W c = ( 1 V f ) ε m W c = ( 1 V f ) W W c β m
where W is the moisture content in the matrix and W c the moisture content in the composite.
Composite axial swelling, which occurs in direction x in Figure 2, can be predicted employing a parallel connection model of fiber and matrix. The swelling of the matrix in this case is strongly constrained by the stiffness of the fibers. The constrained swelling strain in the matrix ε m generates a stress equal to:
σ m = E m ε m
where σ m is the stress in the matrix and E m is the stiffness of the matrix.
The load transferred from the matrix to the fibers, L can be estimated as:
L = σ m A m = σ m A ( 1 V f ) = σ f A f = σ f A V f
where A is the cubic cell lateral surface area (in the x z plane), A m = A ( 1 V f ) is the matrix part of the cubic cell lateral surface area and A f = A V f is the fiber part of the cubic cell lateral surface area, as shown in Figure 2.
From Equation (12) it is possible to estimate the stress transferred to the fiber, σ f :
σ f = σ m   1 V f V f
Finally, the composite axial strain, ε x , can be predicted as equal to the fiber axial strain, ε f , as the axial swelling of the cubic cell is governed by its behaviour:
ε x = ε f = σ f E f = σ m E f 1 V f V f
where E f is the fiber stiffness.
The transverse swelling coefficient is defined as [35]:
β x = ε x W c = σ m W c E f 1 V f V f = E m ε m W c E f 1 V f V f = E m β m E f W W c 1 V f V f

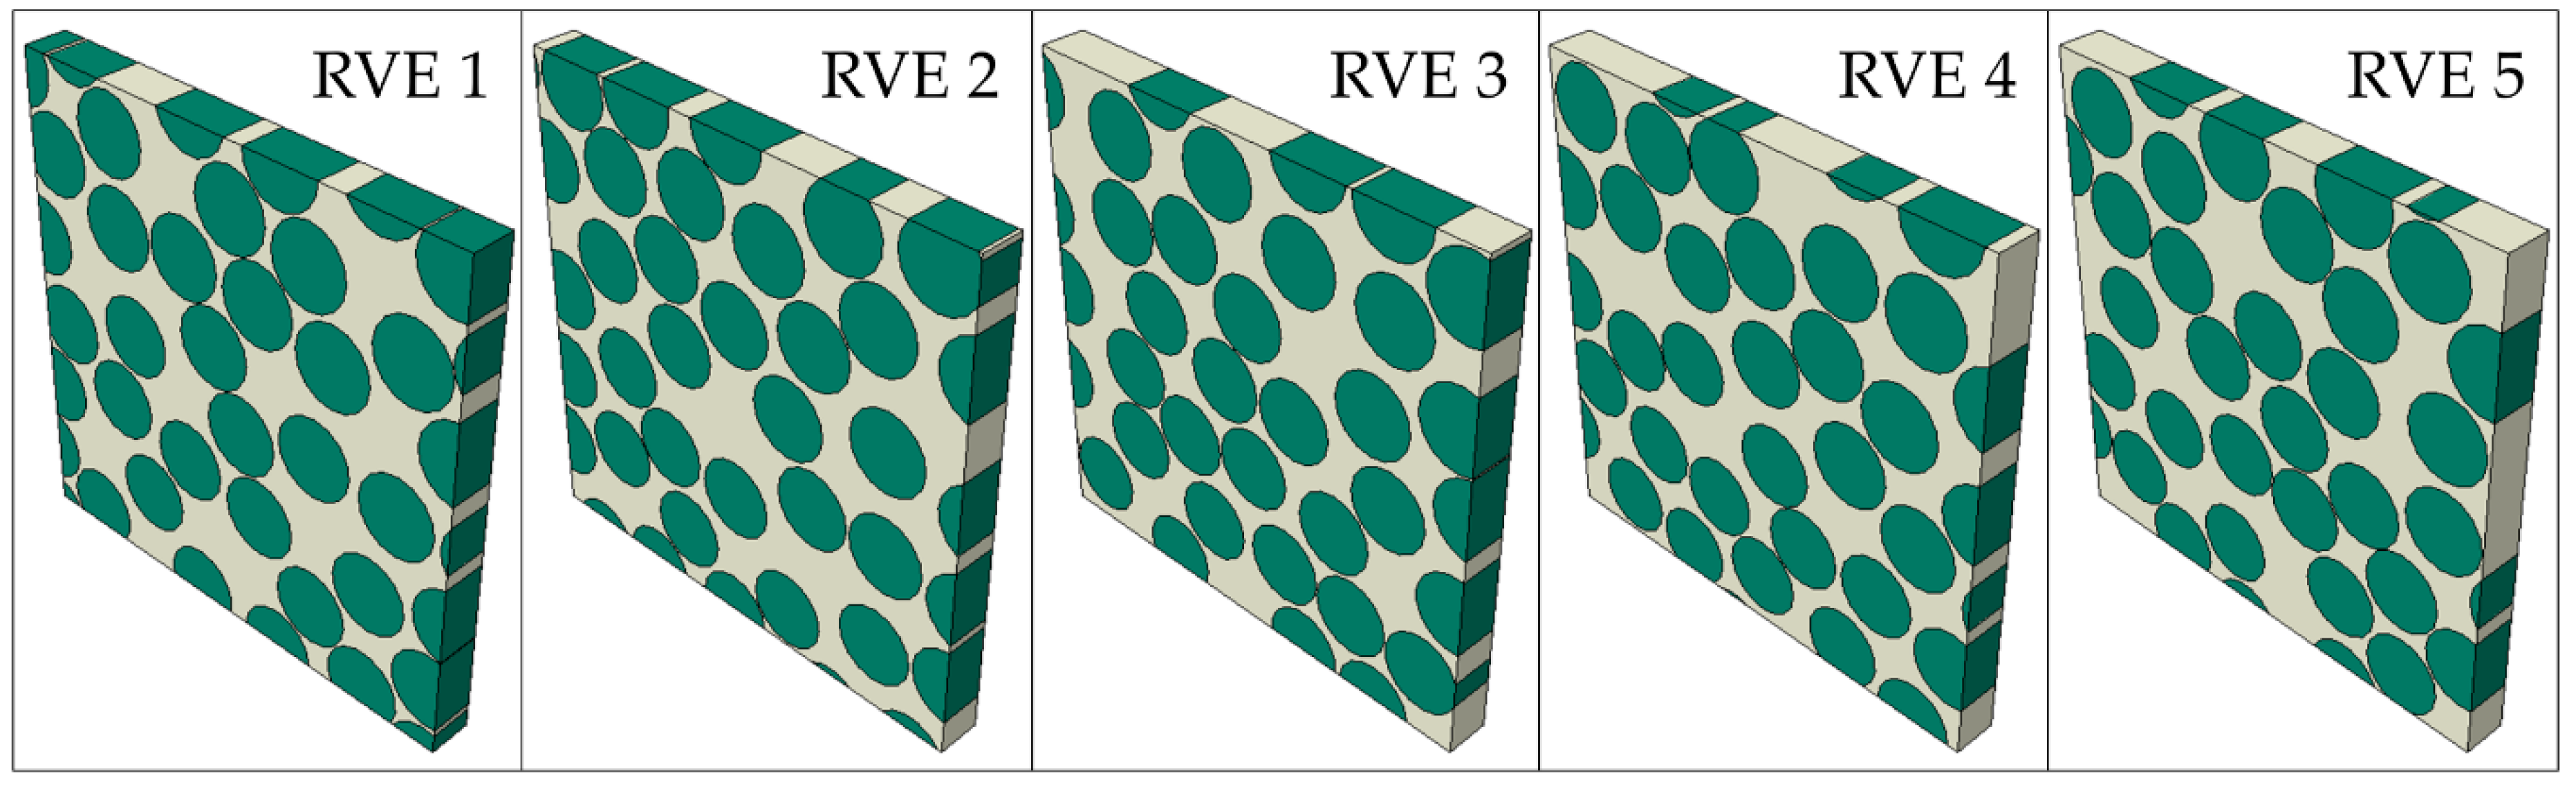
3.2. Finite Element Model

The swelling behaviour of a fiber-reinforced polymer composite can be estimated using a three-dimensional periodic RVE comprised of matrix and randomly placed fibers.
An RVE was modelled in AbaqusTM, (Abaqus Inc., Johnston, RI, USA) having dimensions 110 µm × 110 µm × 10 µm. The fibers radius is 9 µm, as measured experimentally. These RVE dimensions enable having several fibers in the RVE, predicting the composite properties with a good fidelity [36,37]. The thickness of the RVE enables axial swelling to be captured accurately while reducing the total number of elements required for the analysis. A sensitivity analysis was performed employing a thicker RVE (110 µm × 110 µm × 55 µm), the results deviation was below 1%. The elements used are C3D6 for the fibers (6-node linear triangular prism) and C3D8R for the matrix (8-node linear brick, reduced integration). The element size chosen was 1.5 µm. A mesh sensitivity analysis was also performed in order to verify the convergence of the results.
The mesh of the model is shown in Figure 3. The constituents of the composite are modelled as linear elastic. The elastic constants of the matrix polymer are E m = 2.908 GPa and ν m = 0.35 [9]. The elastic constants of the fibers are E f = 72.4 GPa and ν f = 0.22 [35].
In order to account for the deviations in the swelling coefficients due to the random fiber distribution in the RVE, five RVEs having the same fiber volume fraction were modelled, as shown in Figure 4. This allows the deviation in swelling coefficient due to the fiber random arrangement to be quantified.
Hygrothermal swelling was simulated in AbaqusTM using a heat-mass transfer laws analogy, defining a coefficient of hygrothermal expansion β instead of the thermal expansion coefficient α and a concentration field W ( x , y , z ) instead of the temperature field T ( x , y , z ) .
ε = α Δ T ε = β Δ W
During the simulation, periodic boundary conditions were applied on the surfaces of the RVE. These are applied as relative displacements of opposite faces of the RVE, vectors u x , u y and u z .
u   ( L x ,   y ,   z ) u   ( 0 ,   y ,   z ) = u x u   ( x ,   L y ,   z ) u   ( x ,   0 ,   z ) = u y u   ( x ,   y ,   L z ) u   ( x ,   y ,   0 ) = u z
where x ,   y and z are Cartesian coordinates, u ( x ,   y ,   z ) the displacement vector at a point having coordinates ( x ,   y ,   z ) and L x , L y and L z the dimensions of the RVE in directions x ,   y and z , respectively. Displacements on one node of the RVE were constrained in order to avoid rigid translations. Fluid saturation was modelled using a predefined field of initially dry and later saturated material.
The homogenized strain components of the RVE were obtained as:
ε i j ¯ = 1 V V ε i j   d V
where ε i j ¯ is the homogenized strain component of the RVE and ε i j and V are the strain component and the volume of each point in the RVE, respectively.
The swelling coefficients are defined as [35]:
β i j = ε i j ¯ Δ W
where W is the moisture content.

4. Results

4.1. Swelling Measurements

Hygroscopic strains were measured after various exposure times to water for both matrix polymer and composite samples (C1 and C3). The experimentally obtained evolution of linear strains with increasing water contents for the polymer and composites, is shown in Figure 5 and Figure 6, respectively.
Linear regression of experimental data was performed via the least squares approach to obtain a coefficient of hygroscopic expansion of the matrix polymer β m and for composite plates in directions transverse ( β y , β z ) and parallel to fibers ( β x ). The determination coefficient R2 obtained for the matrix polymer via linear regression of experimental data was 0.9534 with an average β m of 0.332. The linear regression included 112 observations with a standard deviation of 0.021 for the β m . The average slope for composite experimental data in the transverse-to-fibers directions was found to be 0.571 with a determination coefficient of R2 = 0.9750. A similar value of 0.6 was reported by Tsai for Kevlar/epoxy composite [15]. The linear regression included 129 observations with a standard deviation of 0.063 for the slope. The average slope β x for experimental data obtained in the parallel-to-fibers direction was found to be non-zero and equal to 0.060 with a determination coefficient of R2 = 0.3110. The linear regression included 77 observations with a standard deviation of 0.018 for the slope. The experimental scatter is reported with one standard deviation in Table 1.

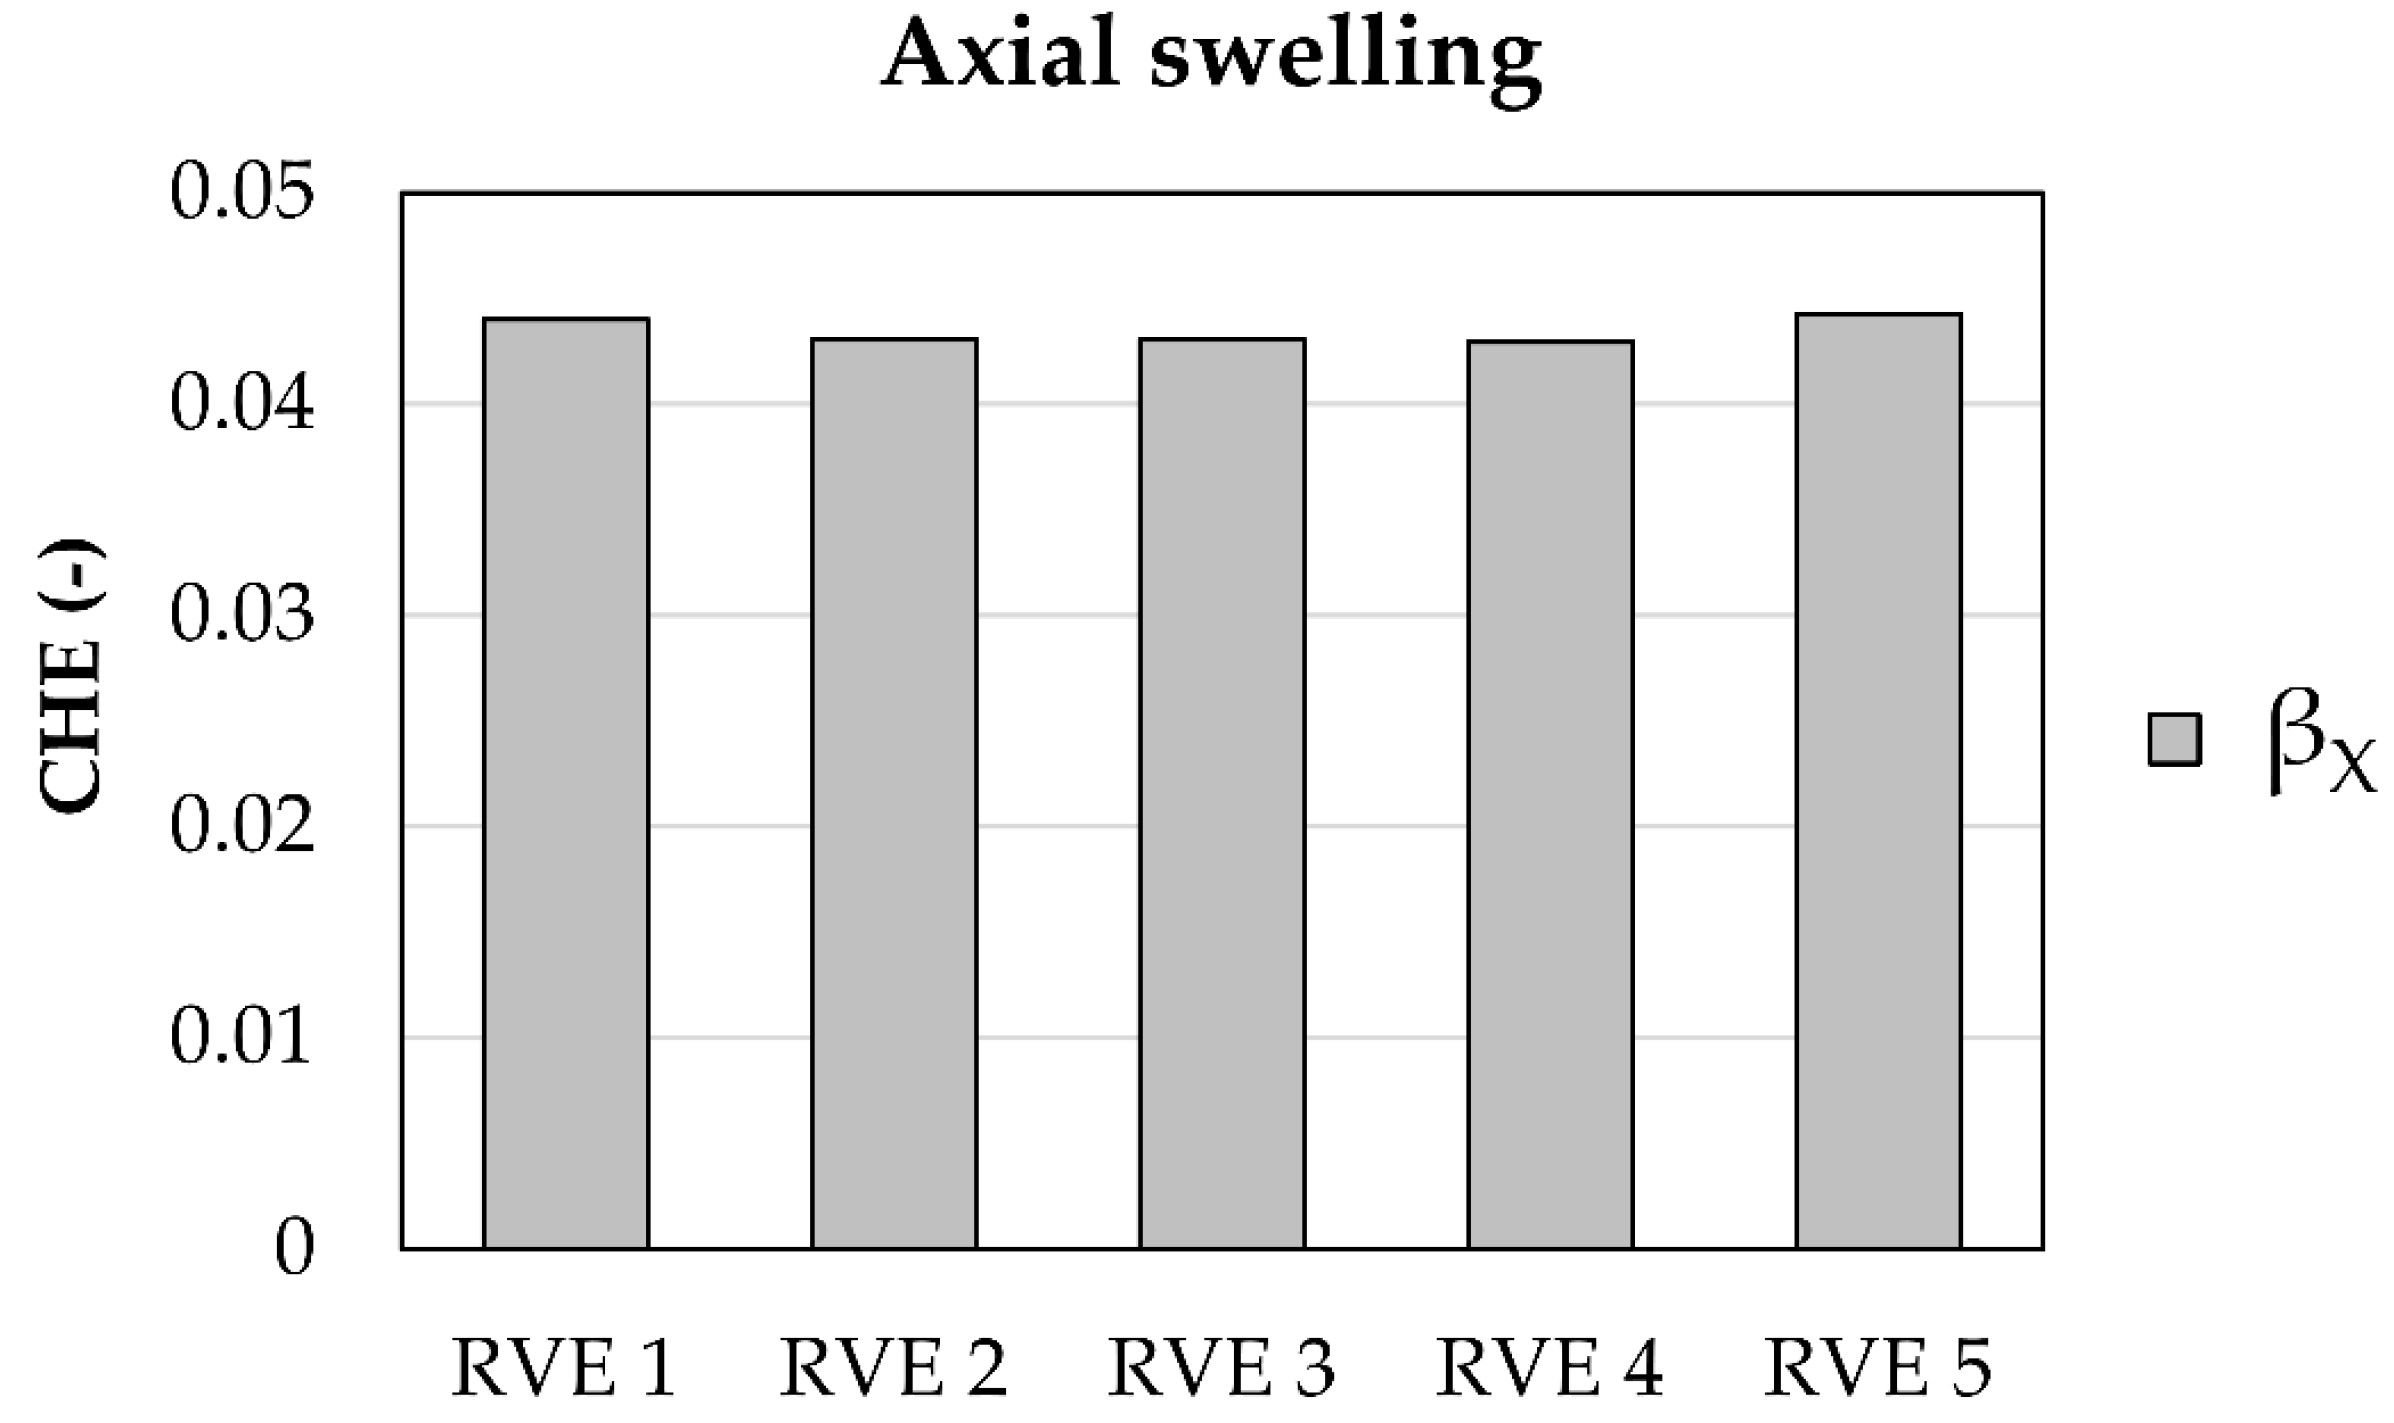
4.2. Analytical and Finite Element Predictions

Experiments validate both analytical and numerical models. Both numerical and analytical results are shown in Figure 7. They show a good fit with the experimental swelling data of composites. The analytically predicted coefficient 0.546 (both β y and β z ) of hygroscopic swelling in transverse-to-fibers directions ( y and z ) is close to the numerically predicted values of 0.552 and 0.573 for β y and β z , respectively, and all predicted values fall within the experimental scatter of 0.571 ± 0.063 (both β y and β z ).
In the fiber direction, both analytically and numerically obtained coefficients of hygroscopic swelling β x are close, 0.036 and 0.044, respectively. Both values are slightly higher than the experimental value obtained via linear regression 0.060 ± 0.018. Such discrepancy is reasonable considering the low determination coefficient in the linear regression of experimental data (0.3110) and low strains involved resulting in larger experimental data scatter.
Numerical FE and analytical prediction as well as experimental results are shown in Table 1 and Figure 7.
The numerical scatter was obtained using five RVEs of the same fiber volume fraction with random fiber distribution to assess swelling on the local scale. On the global scale, these effects are averaged out. The predicted numerical scatter 0.552 ± 0.036 and 0.573 ± 0.049 for numerically obtained β y and β z , respectively.
It is possible to notice that axial swelling coefficients obtained numerically, β x , have quite low scatters on a local scale due to various fiber arrangements, while transverse coefficients, β y and β z , have higher scatters. This suggests that axial swelling is not strongly influenced by the fiber arrangement, while transverse swelling is sensible to the fiber distribution.
Variability of numerically predicted CHE values due to random fiber orientation is shown in Figure 8 and Figure 9.
Figure 10 shows the hygrothermal strains in RVE1. For the transverse directions, y and z , the swelling strains arise mainly in the matrix and are negligible in the fibers, since these do not swell. For the axial direction, however, it is possible to notice a very homogeneous strain field in the whole RVE, matrix and fibers are displaced together. This observation shows the validity of the assumption in the analytical section, where axial swelling is modelled as a parallel connection of fiber and matrix.

5. Discussion

From the experimentally obtained hygroscopic swelling data (Figure 5), it can be deduced that the isotropic coefficient of hygroscopic swelling of the polymer matrix β m is 0.322. For composite plates hygroscopic swelling occurred freely in the transverse-to-the-fibers direction. As expected, obtained values of β y (0.569 ± 0.066) and β z (0.576 ± 0.059) for both composite plates C1 and C3 were very similar. These values can be predicted from the matrix polymer ( β m = 0.322), considering that fibers are not affected by swelling and the volume fraction of the matrix in these composites was 0.394. Hygroscopic strains determined in the direction of the fibers are considered to be consistent with the hypothesis that hygroscopic strains in the fiber direction in composites are very low, but nevertheless they were found to be non-zero.
Furthermore, analytical and numerical approaches show a good agreement. The analytical model predicts the coefficient of hygroscopic swelling well within the experimental scatter. The experimental scatter includes errors due to (1) weighing, (2) determination of dimensional change and (3) variations between the samples. The experimental fit curve is a mean of all these considerations. Analytical results are based on the mean values of V f , β m ,   E f , E m . It fits the experimental mean curve fairly well, and is clearly within the experimental scatter.
The analytical model, however, does not consider the effect of fiber distribution for a known fiber fraction. The effect of fiber distribution on the coefficient of hygroscopic swelling can be accessed via FE simulations and the numerical scatter can be obtained. However, when a simplified and faster approach is needed, the analytical model is able provide a good prediction of hygroscopic swelling of composites using the properties of the polymer ( β m and E m ) and fibers ( E f ). The observation that the simple analytical model gives practically the same results on swelling strains as experiments and more sophisticated FE analysis shows as a first approximation that the stiff fibers do not restrain expansion of the matrix transverse to the fibers. Furthermore, the effect of fiber distribution is important mostly on the local scale and would average out on the global scale. Such global results along with local numerical scatters are shown and compared with the experimental and analytical results in Figure 7. FE results were very similar to experimental and analytical results.
To the best understanding of the authors, there is no limitation to apply the model at various humidity levels. This is due to the fact that swelling behaviour is predicted from the microconstituent properties. The water uptake behaviour of a polymer matrix may be affected by different humidity levels. This would affect the concentration of water in the polymer, but to the best knowledge of the authors this does not change the method of predicting the swelling of the composite from the swelling of the polymer.
The imperfections of the fiber–matrix interface are neglected in this model. While this is an assumption, the good agreement between experimental, numerical and analytical results indicates that this effect is negligible for the material system studied. For a more advanced model, there should be additional studies concerning this aspect.
In addition, the authors believe that it would be of interest to develop analytical models based on the same approach shown here not only for the fiber-reinforced composites, but also for other novel material systems such as polymer/clay composites [38] and multilayer nanocomposites of halloysite and biopolymers [39], that also possess a high mismatch in elastic properties of constituent materials.

6. Conclusions

Orthotropic water-induced or hygroscopic swelling of fiber-reinforced composite laminates can be predicted from the isotropic swelling data of the polymer (the matrix material of a composite). Swelling in composites shows a strong anisotropy, where swelling in the fiber direction is close to null, being constricted by non-expanding fibers, while swelling transverse to fibers behaves similarly to that of the unconstrained polymer. Good agreement was obtained and is reported between experimental swelling data, and analytical and numerical results for composite laminates, indicating the validity of this predictive approach. The analytical approach for predictions is the simplest to use, and good agreement with finite element analysis validates the use of this analytical tool for applications.

Author Contributions

Conceptualization, A.E.K., A.I.G. and A.T.E.; methodology, A.E.K. and A.I.G.; formal analysis, A.E.K. and A.I.G.; investigation, A.E.K.; resources, A.E.K. and A.T.E.; data curation, A.E.K., A.I.G. and A.T.E.; writing—original draft preparation, A.E.K. and A.I.G.; writing—review and editing, A.E.K., A.I.G. and A.T.E.; validation, A.E.K. and A.I.G.; visualization, A.E.K. and A.I.G.; supervision, A.T.E.; project administration, A.T.E.; funding acquisition, A.T.E.

Funding

This research was funded by the Research Council of Norway (Project 245606/E30 in the Petromaks 2 programme).

Acknowledgments

This work is part of the DNV GL led Joint Industry Project “Affordable Composites” with 19 industrial partners and the Norwegian University of Science and Technology (NTNU). The authors would like to express their thanks for the financial support from The Research Council of Norway (Project 245606/E30 in the Petromaks 2 programme). Andrey is especially grateful to Oksana V. Golubova.

Conflicts of Interest

The authors declare no conflict of interest.

References

  1. Krauklis, A.; Echtermeyer, A. Mechanism of yellowing: Carbonyl formation during hygrothermal aging in a common amine epoxy. Polymers 2018, 10, 1017. [Google Scholar] [CrossRef]
  2. Xiao, G.Z.; Shanahan, M.E.R. Swelling of DGEBA/DDA epoxy resin during hygrothermal ageing. Polymer 1998, 39, 3253–3260. [Google Scholar] [CrossRef]
  3. Toscano, A.; Pitarresi, G.; Scafidi, M.; Di Filippo, M.; Spadaro, G.; Alessi, S. Water diffusion and swelling stresses in highly crosslinked epoxy matrices. Polym. Degrad. STable 2016, 133, 255–263. [Google Scholar] [CrossRef] [Green Version]
  4. Grabovac, I.; Whittaker, D. Application of bonded composites in the repair of ships structures—A 15-year service experience. Compos. Part A 2009, 40, 1381–1398. [Google Scholar] [CrossRef]
  5. McGeorge, D.; Echtermeyer, A.T.; Leong, K.H.; Melve, B.; Robinson, M.; Fischer, K.P. Repair of floating offshore units using bonded fibre composite materials. Compos. Part A 2009, 40, 1364–1380. [Google Scholar] [CrossRef]
  6. Gustafson, C.G.; Echtermeyer, A. Long-term properties of carbon fibre composite tethers. Int. J. Fatigue. 2006, 28, 1353–1362. [Google Scholar] [CrossRef]
  7. Salama, M.M.; Stjern, G.; Storhaug, T.; Spencer, B.; Echtermeyer, A. The First Offshore Field Installation for a Composite Riser Joint. OTC-14018-MS. In Proceedings of the Offshore Technology Conference, Houston, TX, USA, 6–9 May 2002; Offshore Technology Conference: Houston, TX, USA, 2002. [Google Scholar] [CrossRef]
  8. Echtermeyer, A.T.; Gagani, A.I.; Krauklis, A.E.; Mazan, T. Multiscale Modelling of Environmental Degradation—First Steps. In Durability of Composites in a Marine Environment 2. Solid Mechanics and Its Applications; Davies, P., Rajapakse, Y.D.S., Eds.; Springer: Cham, Switzerland, 2018; Volume 245, pp. 135–149. ISBN 978-3-319-65145-3. [Google Scholar]
  9. Krauklis, A.E.; Gagani, A.I.; Echtermeyer, A.T. Hygrothermal aging of amine epoxy: Reversible static and fatigue properties. Open Eng. 2018, 8, 447–454. [Google Scholar] [CrossRef]
  10. Ibarra, L.; Chamorro, C. Short fiber–elastomer composites. Effects of matrix and fiber level on swelling and mechanical and dynamic properties. J. Appl. Polym. Sci. 1991, 43, 1805–1819. [Google Scholar] [CrossRef]
  11. Zhou, J. Transient analysis on hygroscopic swelling characterization using sequentially coupled moisture diffusion and hygroscopic stress modeling method. Microelectron. Reliab. 2008, 48, 805–810. [Google Scholar] [CrossRef]
  12. Krauklis, A.E.; Gagani, A.I.; Echtermeyer, A.T. Near-Infrared spectroscopic method for monitoring water content in epoxy resins and fiber-reinforced composites. Materials 2018, 11, 586. [Google Scholar] [CrossRef]
  13. Hahn, H.T.; Kim, R.Y. Swelling of Composite Laminates. In Advanced Composite Materials: Environmental Effects; ASTM STP 658; American Society for Testing and Materials: Philadelphia, PA, USA, 1978; pp. 98–120. [Google Scholar]
  14. Shirangi, M.H.; Michel, B. Mechanism of moisture diffusion, hygroscopic swelling, and adhesion degradation in epoxy molding compounds. In Moisture Sensitivity of Plastic Packages of IC Devices; Fan, X.J., Suhir, E., Eds.; Springer: New York, NY, USA, 2010; pp. 29–69. ISBN 978-1-4419-5719-1. [Google Scholar]
  15. Tsai, S.W. Composites Design, 4th ed.; Think Composites: Dayton, OH, USA, 1988; ISBN 0-9618090-2-7. [Google Scholar]
  16. Obeid, H.; Clément, A.; Fréour, S.; Jacquemin, F.; Casari, P. On the identification of the coefficient of moisture expansion of polyamide-6: Accounting differential swelling strains and plasticization. Mech. Mater. 2018, 118, 1–10. [Google Scholar] [CrossRef]
  17. Cairns, D.S.; Adams, D.F. Moisture and thermal expansion properties of unidirectional composite materials and the epoxy matrix. J. Reinf. Plast. Compos. 1983, 2, 239–255. [Google Scholar] [CrossRef]
  18. Ashton, J.E.; Halpin, J.C.; Petit, P.H. Primer on Composite Materials Analysis; Technomic Pub. Co.: Stamford, CT, USA, 1969; ISBN 978-0-8776-2754-8. [Google Scholar]
  19. Halpin, J.C. Effects of Environmental Factors on Composite Materials; Technical report AFML-TR-67–423; Air Force Materials Laboratory: Dayton, OH, USA, 1969. [Google Scholar]
  20. Schapery, R.A. Thermal expansion coefficients of composite materials based on energy principles. J. Compos. Mater. 1968, 2, 380–404. [Google Scholar] [CrossRef]
  21. Coran, A.Y.; Boustany, K.; Hamed, P. Unidirectional fiber-polymer composites: Swelling and modulus anisotropy. J. Appl. Polym. Sci. 1971, 15, 2471–2485. [Google Scholar] [CrossRef]
  22. Daniels, B.K. Orthotropic swelling and simplified elasticity laws with special reference to cord-reinforced rubber. J. Appl. Polym. Sci. 1973, 17, 2847–2853. [Google Scholar] [CrossRef]
  23. Fan, Y.; Gomez, A.; Ferraro, S.; Pinto, B.; Muliana, A.; La Saponara, V. Diffusion of water in glass fiber reinforced polymer composites at different temperatures. J. Compos. Mater. 2018, 1–14. [Google Scholar] [CrossRef]
  24. Jacquemin, F.; Fréour, S.; Guillén, R. Analytical modeling of transient hygro-elastic stress concentration—Application to embedded optical fiber in a non-uniform transient strain field. Compos. Sci. Technol. 2006, 66, 397–406. [Google Scholar] [CrossRef]
  25. Meng, M.; Rizvi, M.J.; Le, H.R.; Grove, S.M. Multi-scale modelling of moisture diffusion coupled with stress distribution in CFRP laminated composites. Compos. Struct. 2016, 138, 295–304. [Google Scholar] [CrossRef] [Green Version]
  26. Sinchuk, Y.; Pannier, Y.; Gueguen, M.; Tandiang, D.; Gigliotti, M. Computed-tomography based modeling and simulation of moisture diffusion and induced swelling in textile composite materials. Int. J. Solids Struct. 2018, 154, 88–96. [Google Scholar] [CrossRef]
  27. Sinchuk, Y.; Pannier, Y.; Gueguen, M.; Gigliotti, M. Image-based modeling of moisture-induced swelling nd stress in 2D textile composite materials using a global-local approach. Proc. Inst. Mech. Eng. Part C J. Mech. Eng. Sci. 2018, 232, 1505–1519. [Google Scholar] [CrossRef]
  28. Weitsman, Y.J. Fluid Effects in Polymers and Polymeric Composites; Springer: New York, NY, USA, 2012; ISBN 978-1-4614-1059-1. [Google Scholar]
  29. Weitsman, Y.J.; Elahi, M. Effects of fluids on the deformation, strength and durability of polymeric composites—An overview. Mech. Time-Depend. Mater. 2000, 4, 107–126. [Google Scholar] [CrossRef]
  30. Sar, B.E.; Fréour, S.; Davies, P.; Jacquemin, F. Accounting for differential swelling in the multi-physics modelling of the diffusive behaviour of polymers. J. Appl. Math. Mech. 2014, 94, 452–460. [Google Scholar] [CrossRef]
  31. Fan, Y.; Gomez, A.; Ferraro, S.; Pinto, B.; Muliana, A.; La Saponara, V. The effects of temperatures and volumetric expansion on the diffusion of fluids through solid polymers. J. Appl. Polym. Sci. 2017, 134, 45151–45165. [Google Scholar] [CrossRef]
  32. Kappert, E.J.; Raaijmakers, M.J.T.; Tempelman, K.; Cuperus, F.P.; Ogieglo, W.; Benes, N.E. Swelling of 9 polymers commonly employed for solvent-resistant nanofiltration membranes: A comprehensive dataset. J. Membr. Sci. 2019, 569, 177–199. [Google Scholar] [CrossRef]
  33. Ramirez, F.A.; Carlsson, L.A.; Acha, B.A. Evaluation of water degradation of vinylester and epoxy matrix composites by single fiber and composite tests. J. Mater. Sci. 2008, 43, 5230–5242. [Google Scholar] [CrossRef]
  34. Shirell, C.D.; Halpin, J. Moisture Absorption in Epoxy Composite Materials. In Proceedings of the Composite Materials: Testing and Design (Fourth Conference), ASTM STP617, Valley Forge, PA, USA, 3–4 May 1977; American Society for Testing and Materials: Philadelphia, PA, USA, 1979; pp. 514–528. [Google Scholar] [CrossRef]
  35. Agarwal, B.D.; Broutman, L.J. Analysis and Performance of Fiber Composites, 2nd ed.; John Wiley & Sons, Inc.: Hoboken, NJ, USA, 1990; ISBN 978-0-4715-1152-6. [Google Scholar]
  36. González, C.; Llorca, J. Mechanical behavior of unidirectional fiber-reinforced polymers under transverse compression: Microscopic mechanisms and modeling. Compos. Sci. Technol. 2007, 67, 2795–2806. [Google Scholar] [CrossRef]
  37. Yang, L.; Yan, Y.; Ma, J.; Liu, B. Effects of inter-fiber spacing and thermal residual stress on transverse failure of fiber-reinforced polymer–matrix composites. Comput. Mater. Sci. 2013, 68, 255–262. [Google Scholar] [CrossRef]
  38. Yamabe, K.; Goto, H. Synthesis and surface observation of montmorillonite/polyaniline composites. J. Comp. Sci. 2018, 2, 15. [Google Scholar] [CrossRef]
  39. Bertolino, V.; Cavallaro, G.; Milioto, S.; Parisi, F.; Lazzara, G. Thermal properties of multilayer nanocomposites based on halloysite nanotubes and biopolymers. J. Comp. Sci. 2018, 2, 41. [Google Scholar] [CrossRef]
Figure 1. Matrix polymer and composite plates used for swelling measurements.
Jcs 03 00010 g001
Figure 2. Schematic fiber-reinforced composite (cubic unit cell with dimensions 1 × 1 × 1).
Jcs 03 00010 g002
Figure 3. Finite element model of the representative volume element (RVE): fiber and matrix properties are also shown.
Jcs 03 00010 g003
Figure 4. Finite element model of the RVE.
Jcs 03 00010 g004
Figure 5. Experimental data and linear regression of hygroscopic swelling of epoxy polymer.
Jcs 03 00010 g005
Figure 6. Experimental data and linear regression of orthotropic swelling for composites.
Jcs 03 00010 g006
Figure 7. Numerical and analytical fit of swelling with the experimental data for composites. Analytical results are shown in red lines; global averaged out numerical results are shown in blue lines, while a numerical scatter is shown with blue sectors indicating scatter on the local scale due to various fiber arrangements.
Jcs 03 00010 g007
Figure 8. Swelling coefficients in transverse directions y and x for the five RVEs used in the simulations.
Jcs 03 00010 g008
Figure 9. Swelling coefficient in axial direction, z, for the five RVEs used in the simulations.
Jcs 03 00010 g009
Figure 10. Swelling coefficient in axial direction, z, for the five RVEs used in the simulations.
Jcs 03 00010 g010
Table 1. Coefficients of hygroscopic expansion. Experimental scatter is reported with one standard deviation for the coefficient of hygroscopic expansion (CHE). * indicates an input parameter for the models.
CHEExperimentalAnalyticalNumerical
βm0.332 ± 0.0210.332 *0.332 *
βX0.060 ± 0.0180.0360.044
βY0.569 ± 0.0660.5460.552
βZ0.576 ± 0.0590.5460.573

