Review of Through-the-Thickness Reinforced z-Pinned Composites

1
Department of Mechanical Engineering & Aeronautics, University of Patras, Patras University Campus, 26504 Patras, Greece
2
Institute of Chemical Engineering Sciences, Foundation for Research and Technology Hellas, 26504 Patras, Greece
*
Author to whom correspondence should be addressed.
J. Compos. Sci. 2020, 4(1), 31; https://0-doi-org.brum.beds.ac.uk/10.3390/jcs4010031
Submission received: 31 December 2019
/
Revised: 16 March 2020
/
Accepted: 17 March 2020
/
Published: 20 March 2020
(This article belongs to the Special Issue Feature Papers in Journal of Composites Science in 2019)
Abstract
:This work reviews the effects of z-Pins used in composite laminates as through-the-thickness reinforcement to increase the composite’s properties in the out-of-plane direction. The paper presents the manufacture and microstructure of this reinforcement type while also incorporating the impact of z-Pins on the mechanical properties of the composite. Mechanical properties include tensile, compression, flexure properties in static, dynamic and fatigue loads. Additionally, mode I and mode II properties in both static and fatigue loading are presented, as well as hygrothermal, impact and compression after impact properties.
1. Introduction
z-Pinning was first introduced in the 1970s as a through-the-thickness toughening method for fiber-reinforced composites, to improve their weak interlaminar fracture toughness, impact damage resistance and out-of-plane properties [1]. Moreover, another application was z-Pins being introduced as a core material in conjunction with foam in foam sandwiches, to enhance the shear properties of the core [2]. However, recently, with the advance of additive manufacturing technologies, z-Pinning has also been applied in composite-metal and composite-composite joints [3,4,5]. Thus, z-Pins have the potential to be used in three applications: (1) as through-the-thickness reinforcement of composites, (2) as a core material in sandwich panels and (3) as joint connectors in the through the thickness direction.
z-Pins are thin pins (typically 200–1000 μm in diameter) made of high stiffness, high strength material, such as carbon composite, or steel, or titanium alloys [1]. Generally, a small percentage of z-Pins is needed to increase the through-the-thickness properties in a laminate (typically 0.5–4.0 vol%) [1].
In the case of aerospace structures, where weight is an important factor, z-Pins were preferred to stitching and 3D weaving as z-reinforcement in laminates, because they are capable of enhancing the properties of pre-preg laminates and because of their simple insertion method [1]. Historically, z-Pins have been used in the F/A-18E/F Super Hornet, where they were used to replace titanium fasteners in air inlet ducts and engine bay doors [1,2,3,4,5,6,7]. Moreover, they have been used in the C-17 heavy lift transporter and in Formula-1 cars in the roll-over protective bars [8], though all applications have been used in secondary structures.
Mouritz, in his review of z-pinned composite laminates in 2007 [1], covered extensively the properties of z-Pinned composites and all the work on z-Pinning until then, which was primarily focused on through-the-thickness reinforcement. In this review, the work of Mouritz is recited, summarized and then complemented with the continued work on z-Pins performed until today.
This review also covers extensively the use of z-Pins in joints. For that purpose, the effects of z-Pins as z-reinforcement are presented here, for a better understanding of the general strengthening mechanism of z-Pins, to superimpose the general conclusions in joints. Primarily, the manufacture of z-Pins is presented, followed by the changes in the microstructure of the laminate. The review continues with the presentation of the effects of z-Pinning in composite laminates, and then in joints. Finally, the paper concludes and presents the advantages and disadvantages of z-Pinning in each case, as well as remarks and recommendations for future research.
2. Manufacture of z-Pinned Composites
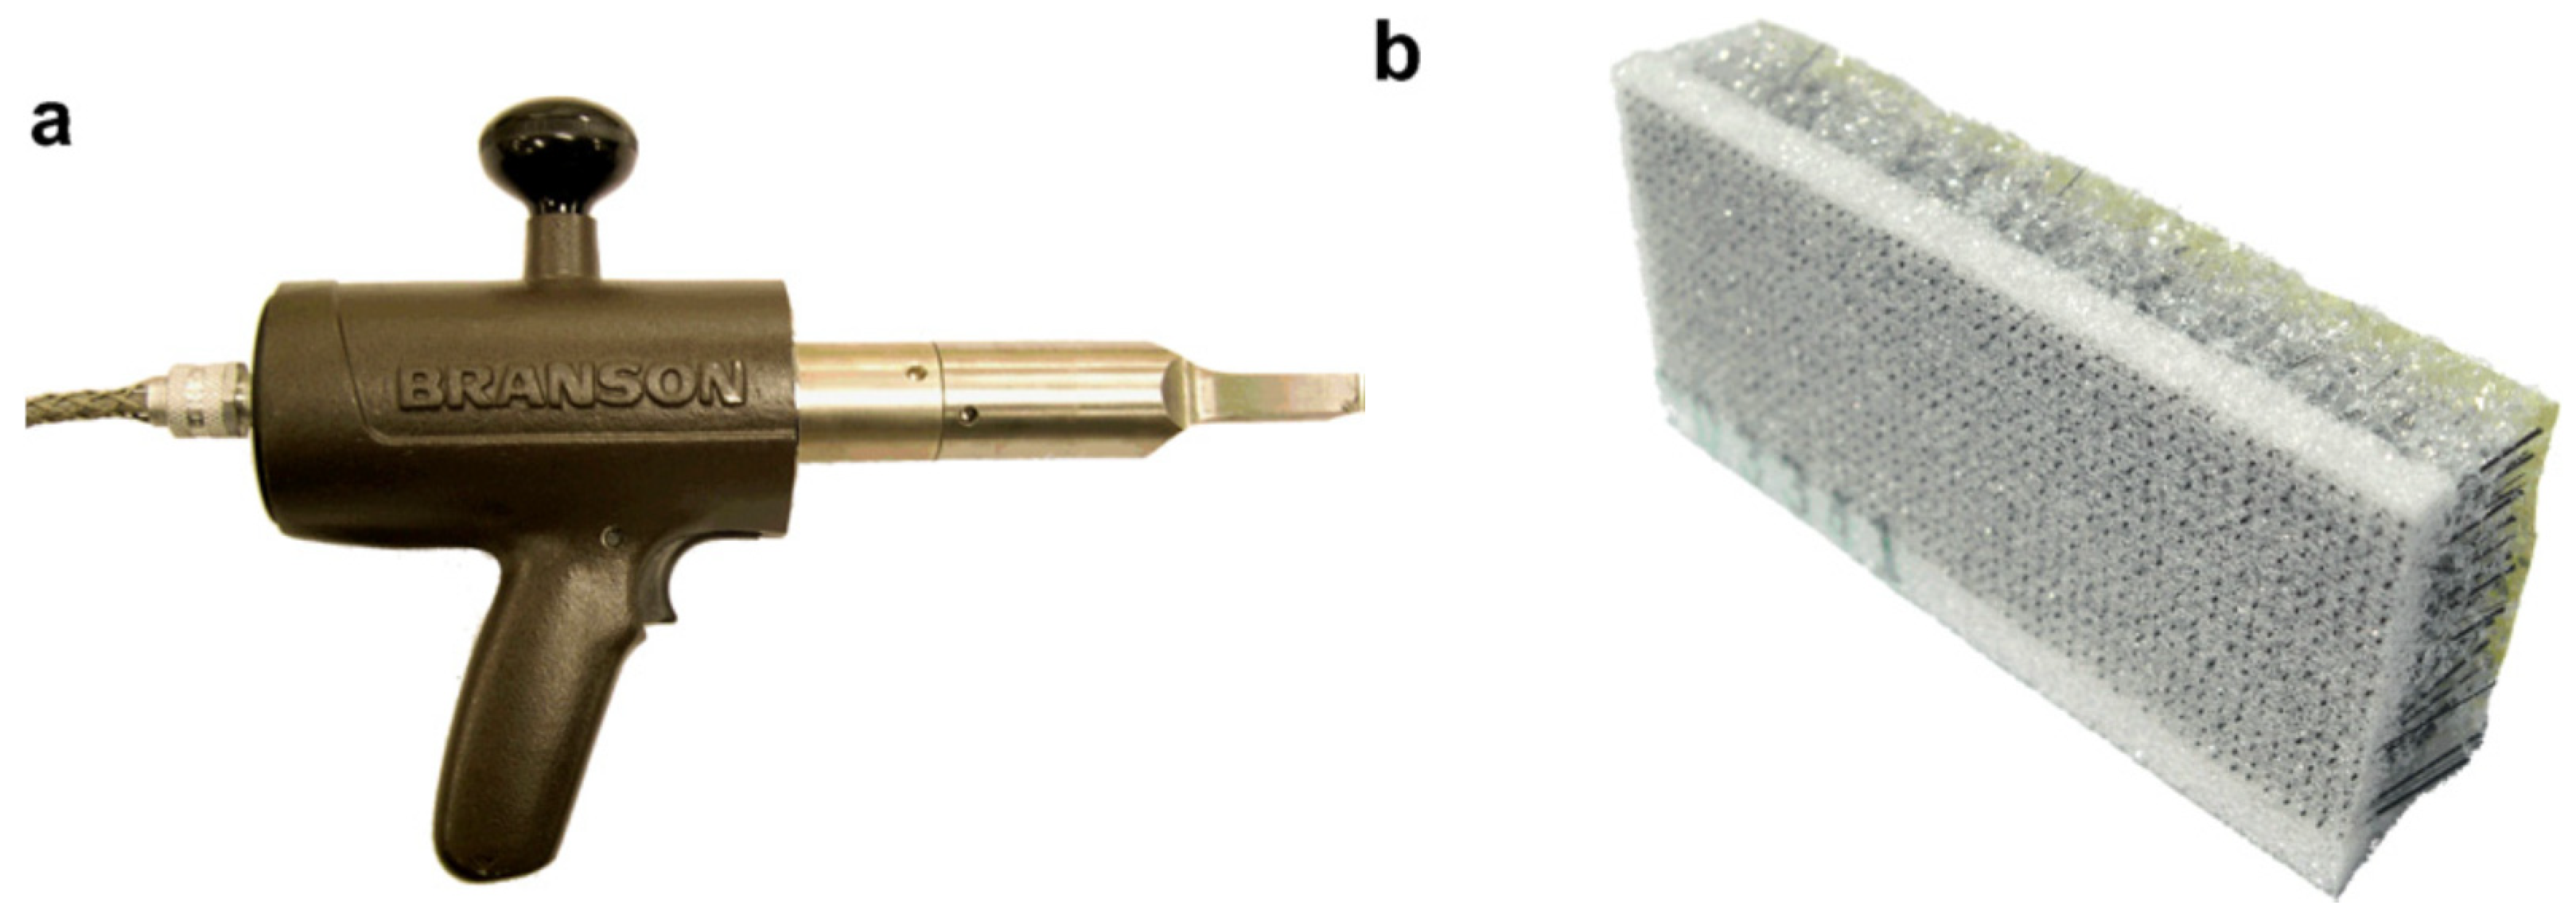
Back in 1989, the first z-Pinning concept was proposed and registered as a USA patent [8]. This concept was initially proposed in a Russian research work [9]. According to this concept, a kind of foam material is used, called ‘pre-form’, which is partially collapsible and contains z-Pins to be inserted in the laminates. The upper part of the pre-form is placed over the laminated prepregs and it is easily collapsed by curing pressure applied by the autoclave. In this way, the z-Pins are inserted to the laminate during the curing process. After curing, the remaining compacted pre-form and the not used parts of the z-Pins over upper surface of the cured laminate are removed. Currently, the most common method for z-Pinned composite laminates is the UAZ® (Ultrasonic Assisted Z-fiber) procedure, which utilizes a hand-held ultrasonic horn to insert z-Pins from inside a collapsible foam carrier to an uncured pre-preg laminate, as shown in Figure 1 [1]. Typical characteristics for an Ultrasonic gun used for z-Pinning are: 20 kHz frequency with a solid metal contact surface is used to drive Z-pins from the foam preform into the green stage composite. The high frequency ultrasonic vibrations reduce the force required to insert the pins. An output power rating of 500 W is normally used.
The first step in the procedure is the creation of the z-Pins, which are mostly made from extruded metal or by fibrous composites produced by pulling a continuous fiber tow through a resin bath and then pultruding it through a circular die [1]. Afterwards, the z-Pins are inserted into the foam carrier. The foam block is of varying density, depended upon the z-Pin characteristics, to facilitate insertion, while being cut to the appropriate length [6]. The foam exists to support the z-Pins prior to and during insertion and to ensure even spacing between them, and for that purpose it is discarded after z-Pin insertion [1,6]. The second step in the procedure is to integrate the z-Pins to the laminate layup pre-curing. As shown in Figure 2, the manufacturing steps are: (a) the foam preform containing the z-Pins is placed on top of the laminate; (b) the ultrasonic horn is passed over the preform, generating high frequency compressive waves that collapse the foam and drive the z-Pins into the laminate; (c) all the foam is crushed, and z-Pin integration is complete; (d) the excess z-Pins with the crushed foam are sheared away and removed, leaving the z-Pinned laminate ready to be cured. The advantages of using an ultrasonic horn is the limitation of damage to the pre-preg. This is achieved by the pulsating waves that slowly push the z-Pin into the laminate. The high frequency ultrasonic vibrations reduce the required force to insert the pins into the laminate. Furthermore, the heat generated during this process facilitates the insertion of pins by slightly softening the matrix resin in the prepreg. The insertion process does not affect the final properties of the laminate [10].
Subsequently to the z-Pinning, the laminate generated can be cured following the same standard processes for unpinned laminates. In addition, z-Pinning requires access only to one side of the uncured pre-preg laminate, in contrast with stitching and 3D weaving [1].
From the scope of 3D printed metallic z-Pins, during the last few years with the advances in additive manufacturing, z-Pins are also created by methods such as laser/heat sintering or EBM (electron beam melting) [3]. Usually the metallic z-Pins created via additive manufacturing are mainly focused on metal to composite joints or on composites joining and are printed onto a metallic sheet or part that will be part of the joint.
3. Microstructure of z-Pinned Composites
The insertion of z-Pins in the composite leads to changes in the microstructure of the laminate. Fiber waviness, resin-rich zones, cure stresses and microcracking, swelling of the laminate and offset of z-Pins are the basic changes in the laminate [1].
3.1. Fiber Waviness
The introduction of z-Pins in a composite laminate results in a deflection of fibers around the z-Pin, as shown in Figure 3. The z-Pin pushes aside and distorts the fibers in its proximity region, causing them to bend and introducing a waviness angle (θ) which is greatest on the flanks of the resin-rich region [1]. The fibers are not symmetrically deflected, due to irregularities in the z-Pinning process and pre-existing fiber waviness [1]. Fiber waviness reduces the in-plane properties (compressive strength in particular by microbuckling and kinking) and is linearly dependent on the percent volume content of z-Pins, as shown in Figure 4 [1]. In addition, the waviness angle (θ) and waviness length (wx) are also linearly dependent on the z-Pin diameter [1]. Moreover, fiber waviness is dependent on pre-preg factors, such as fiber stiffness, fiber packing density and resin viscosity [1].
3.2. Resin-Rich Zones
Resin-rich zones are created in the proximity area of the z-Pin, which have an eyelet shape elongated in the fiber direction [1,12]. These resin-rich zones are created when the voids created by the deflection of fibers due to the z-Pin insertion are filled with resin during the curing of the laminate [1]. In addition, in the case of a high-density z-Pinned laminate, where the z-Pins are closely spaced, the resin-rich zones overlap, creating a resin channel that extends parallel to the fiber direction, as shown in Figure 5 [1].
In a multi-directional fiber laminate, each ply’s resin-rich zone main axis is positioned in a different angle, creating a cross-like structure (for cross-ply laminates), or a star-like structure (for quasi-isotropic) [12].
3.3. Cure Stresses
During the curing process, stresses develop at the interface of the z-Pin with the laminate, due to the difference in the thermal expansion coefficients [1,13]. In particular, in the case of carbon fiber z-Pins which have a low axial thermal expansion coefficient compared to the through-the-thickness coefficient of the laminate, large stresses are generated during the cooling down of the laminate [1,13]. It is estimated from finite element analysis for a fibrous z-Pin that the stresses in the proximity area can be up to four times higher than the far-field residual stress [1]. Due to the high local stresses, which are higher than the failure stress of the resin/interface, microcracking is highly probable to be caused in the interface of the z-Pin with the laminate [1]. Figure 6 demonstrates the debonding of a fibrous z-Pin due to residual stresses in the host composite [1].
3.4. Swelling
Swelling is caused in the laminate with the insertion of z-Pins due to two primal effects: (1) expansion of the laminate to accommodate the z-Pins and (2) resistance against compaction of the pre-preg laminate due to the stiff z-Pins propping the mold surfaces [1,15]. As a general observation in the research performed by Mouritz et al. [16], the increase in z-Pin volume content increases the swelling of the laminate.
Ultimately, swelling of the laminate causes the fiber volume content of the laminate to be slightly reduced, as shown in Table 1, thus reducing the mechanical properties of the laminate [1,15]. However, this slight reduction (ex. <3% for 4.0 vol% z-Pins) applies only when the preform is constrained during the insertion and curing process [15]. In an unconstrained preform, the reduction in the fiber volume content may be as much as 25% for a 4.0 vol% z-Pin content, as shown in Figure 7 [15].
3.5. z-Pin Offset
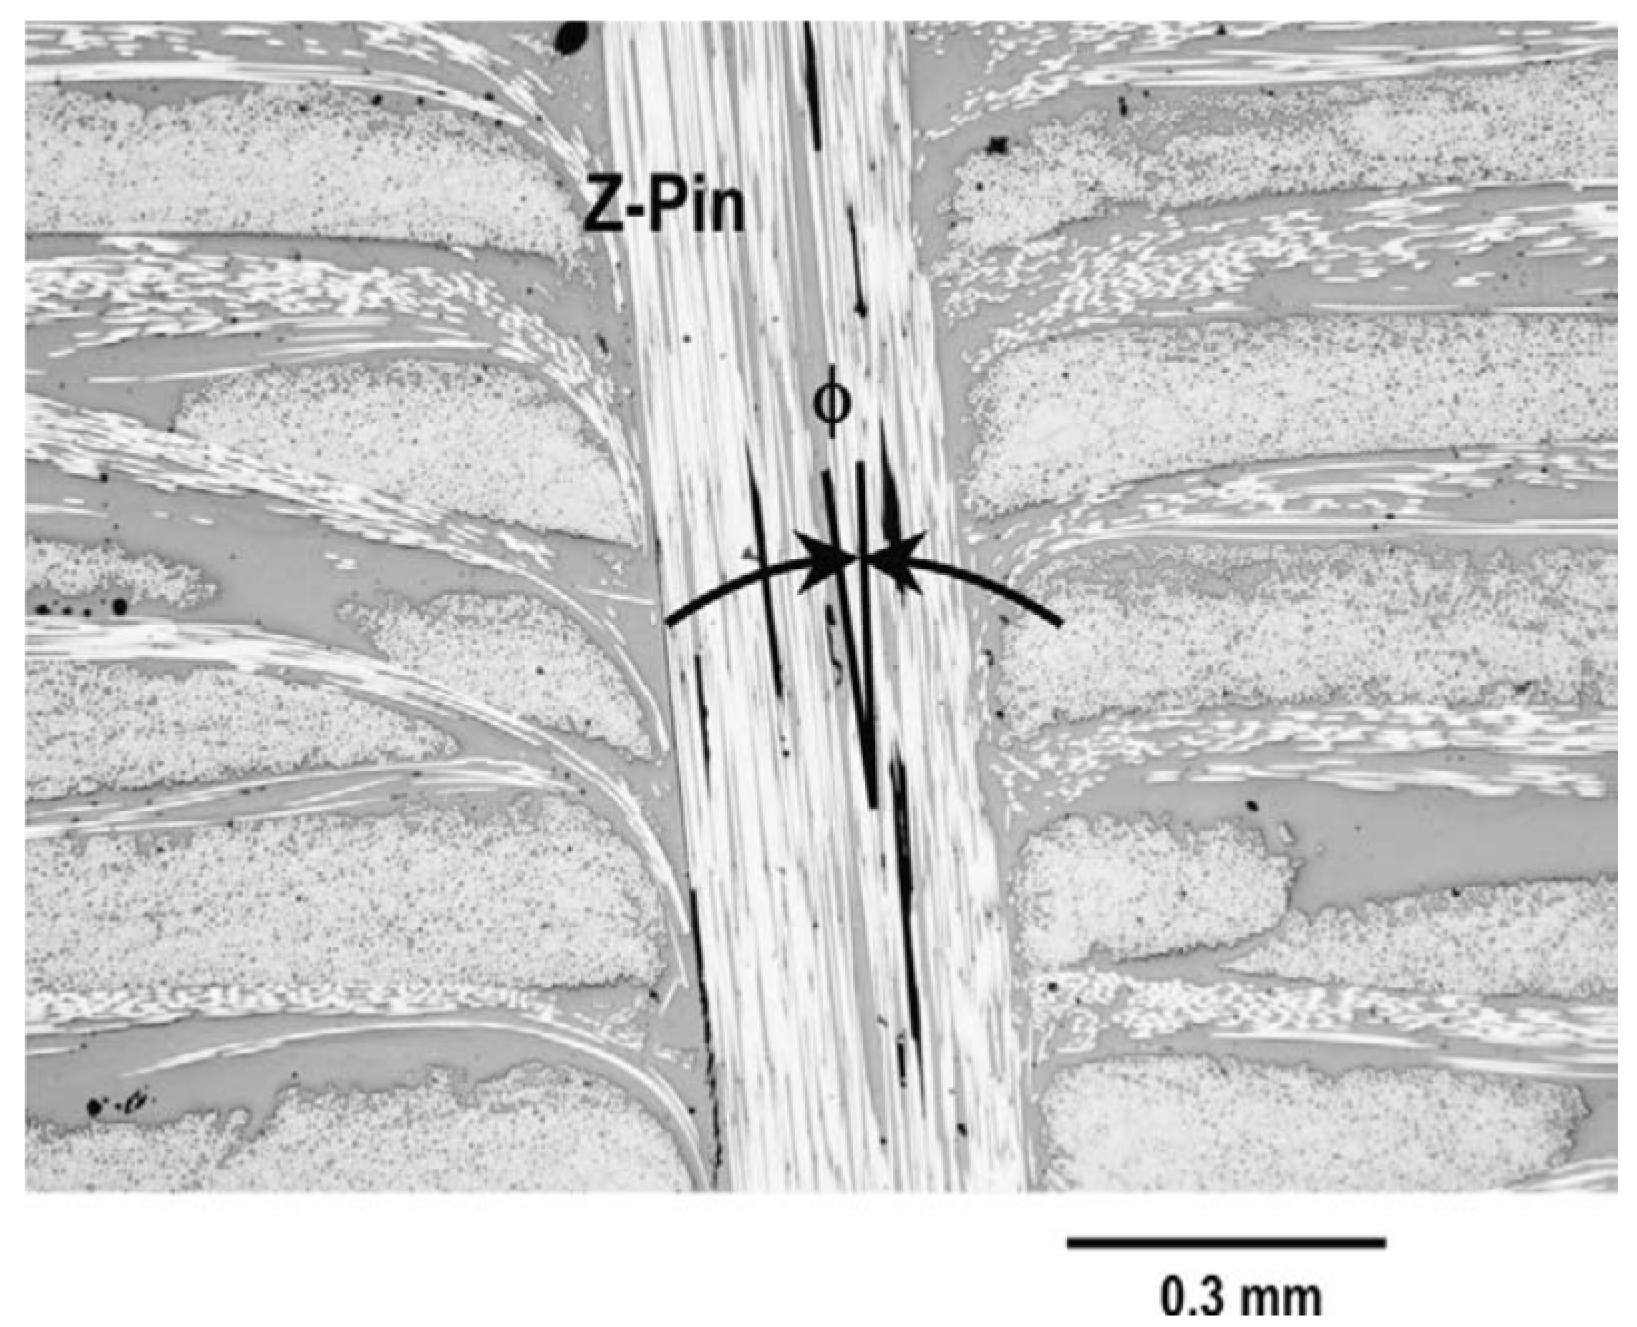
During the insertion process, z-Pins are inclined from the orthogonal direction to a typical offset angle of 5–15° [1,16,17]. This is caused primarily by the manual insertion process, which involves using a hand-held ultrasonic horn to push the z-Pins into the laminate. A typical picture of a z-Pin inserted into the laminate by the manual insertion process is given in Figure 8, where the offset angle is also defined. Figure 9 shows the typical distribution plot of percentage of z-Pins inclined at various angles from the orthogonal direction following the manual insertion process. The use of an automated process, where the horn would be guided by a robotic arm, could minimize the offset of the z-Pins [1,15]. Also, during consolidation of the preform, curing strains may change the angle of the z-Pins [15]. Furthermore, another factor that could affect the angle of the z-Pins is the shaving process of excess length of z-Pins during manufacture, that slightly rotates and translates the z-Pins inside the laminate [12].
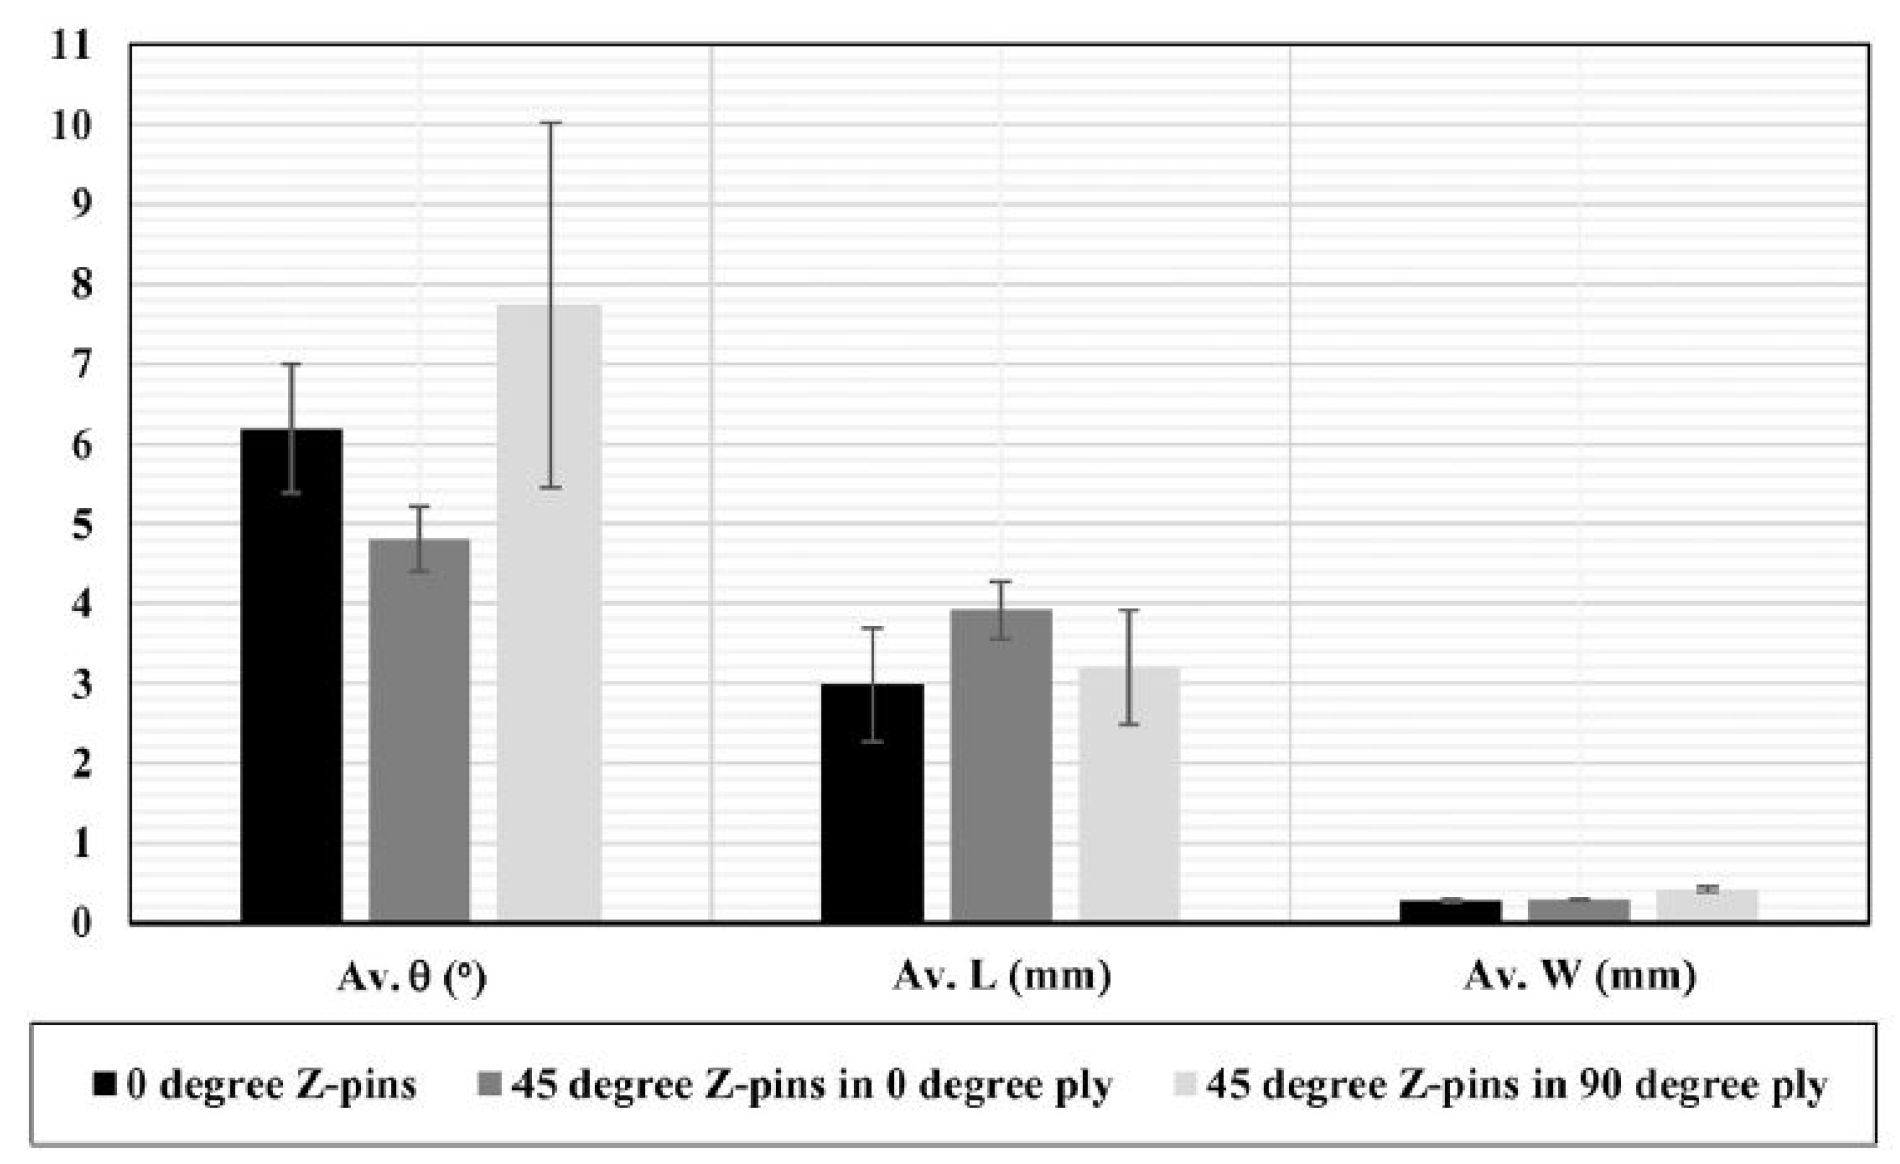
The z-Pin offset angle has a direct impact on the dimensions of the resin zone around the z-Pin [16]. As shown in Figure 10, inclined z-Pins in 0° plies reduce fiber waviness (θ) and increase the length of the resin pocket (L), while the width (w) remains constant (it should be noted that an increase in L is synonymous with a reduction in θ). However, inclined z-Pins in 90° plies increase fiber waviness and the length and width of the resin pocket remain approximately constant. The effect of z-Pin inclination can be observed in Figure 11.
The slight inclination of z-Pins has a beneficial effect under mode I loading and leads to a mixed mode loading of the z-Pins under mode II. In any case, the presence of z-Pins either orthogonally or inclined placed leads to an inclined z-Pins configuration and results in large scale crack bridging.
4. Single Pin Response
The main pin macro-strengthening mechanism is bridging of the delaminated surfaces in a laminate composite. However, each individual pin in a z-Pinned laminate or joint may behave differently depending on a variety of factors.
The single z-Pin responses can be divided into two main categories: pin pull-out and pin fracture. The mechanisms at work in both can be summarized into: (a) elastic deformation [2,13,19,20,21,22,23,24], (b) debonding [13,16,20,21,22,23,24,25], (c) frictional sliding [13,19,20,21,22,23,24,25], (d) axial fracture [22,24,25,26], (e) snubbing [12,25,27] and (f) pin splitting [12,25,27,28,29].
The z-Pin response path is primarily dependent on the following factors: (a) mode mixicity ratio of loading [29,30,31], (b) offset z-Pin angle [17], (c) infiltration depth [13,32], (d) z-Pin diameter [19,27,33] and (e) z-Pin surface roughness [34,35].
4.1. Single Pin Response – Pull-out
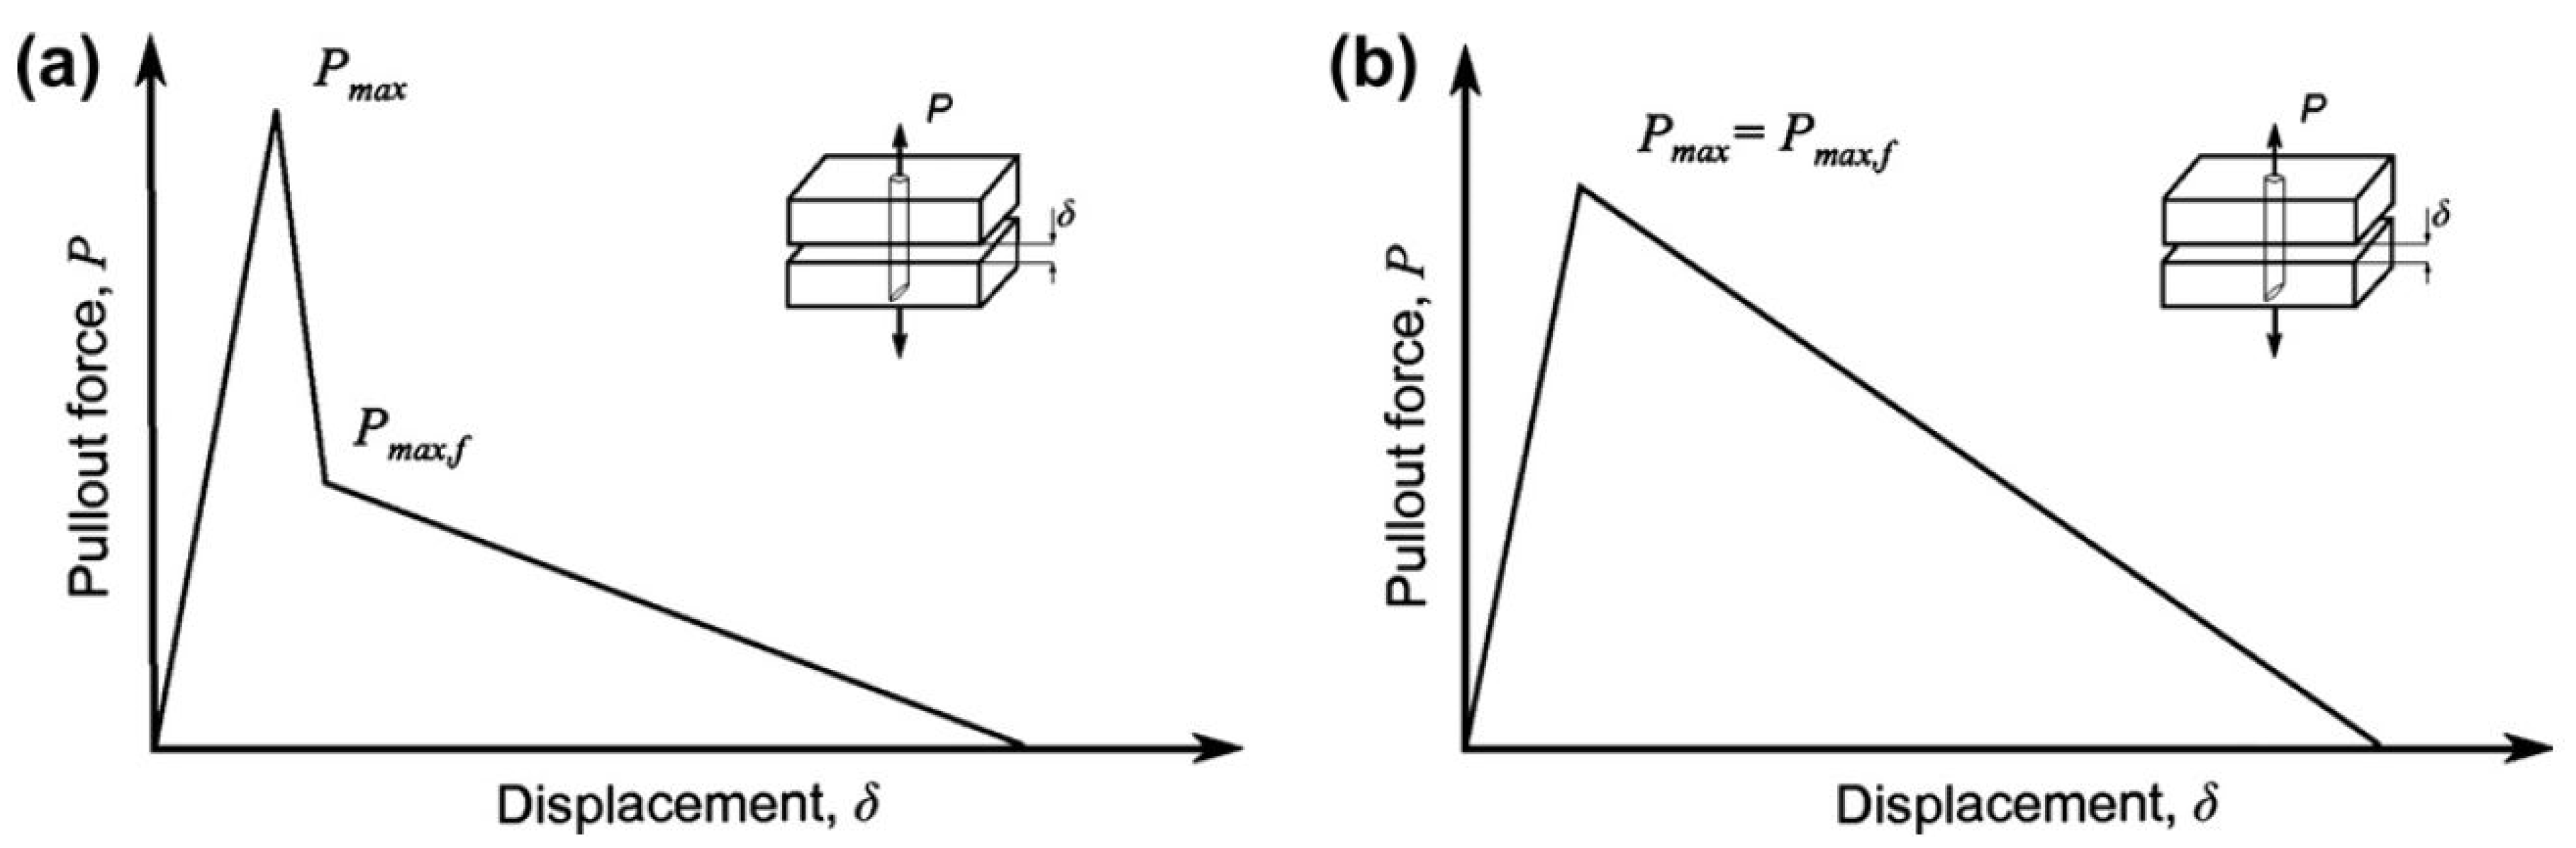
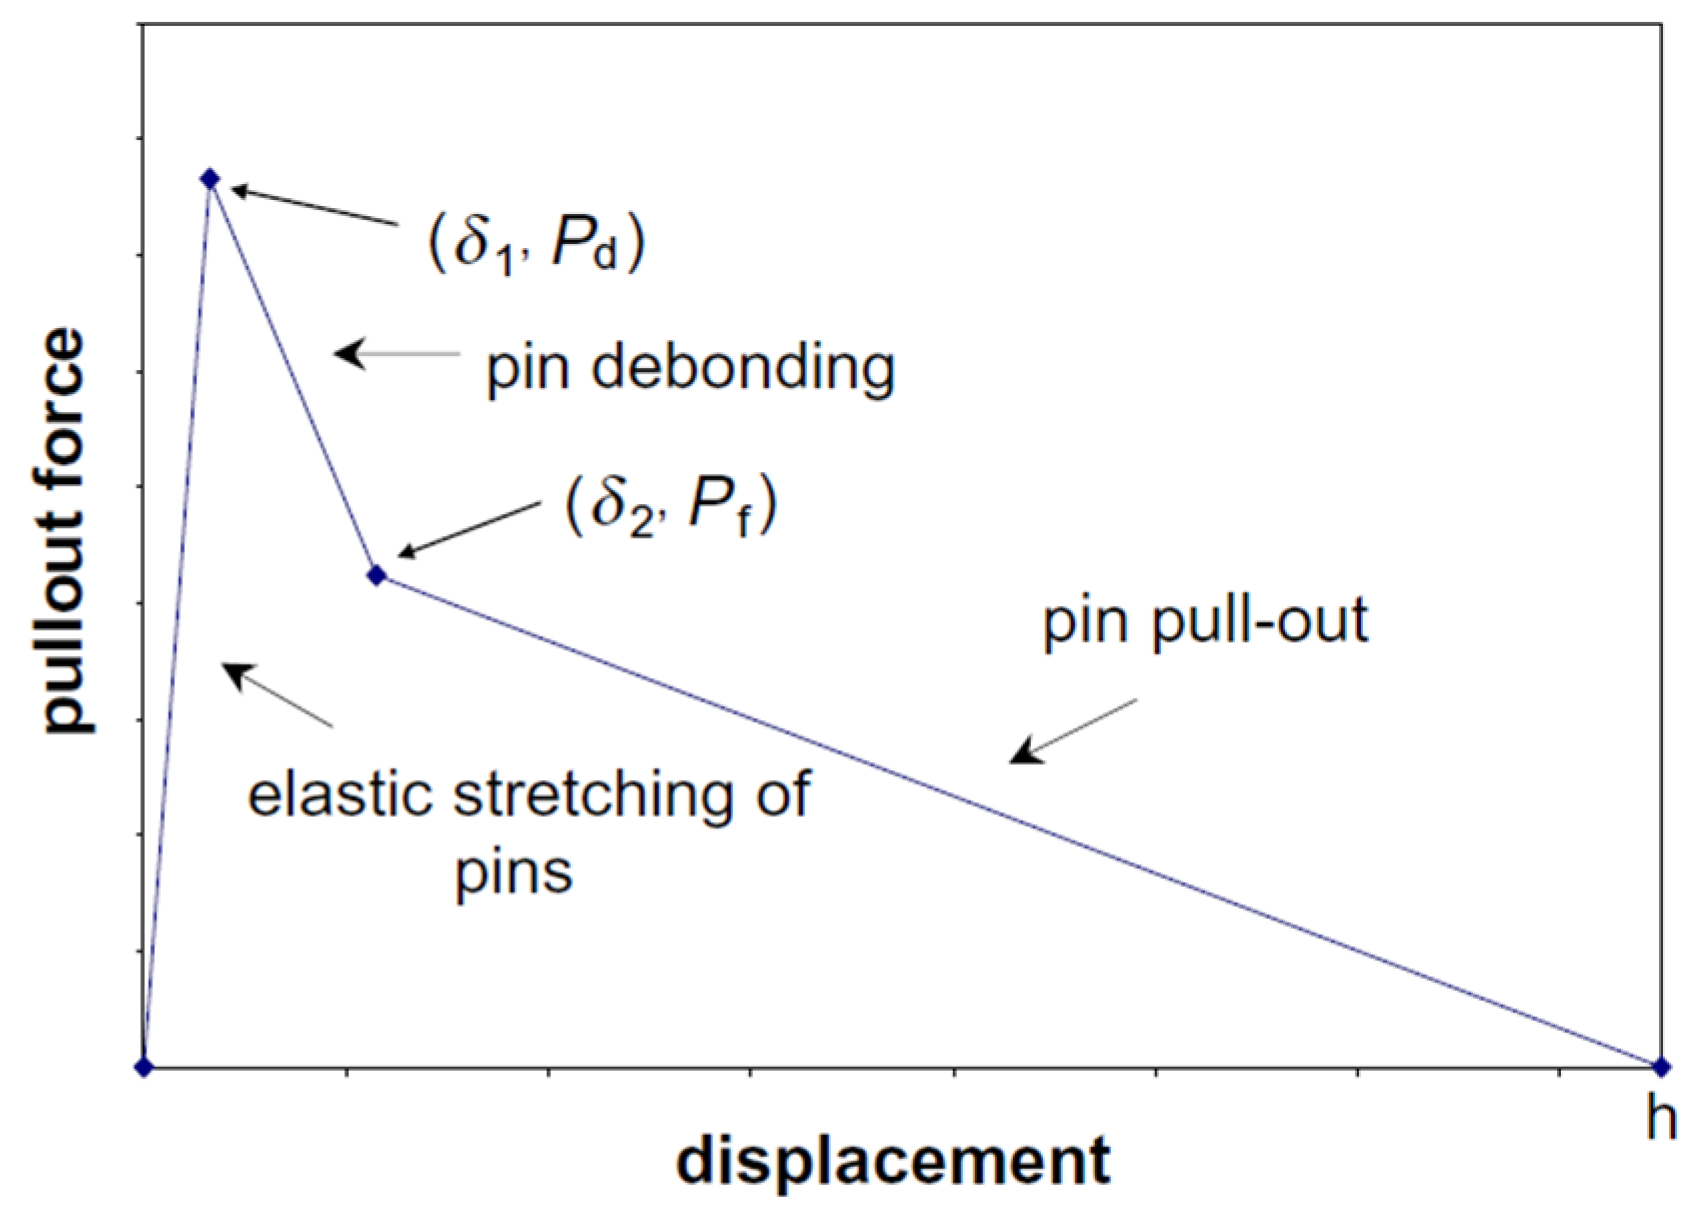
In the case of single pin pull-out, the first mechanism that takes place is elastic deformation of the z-Pin, followed by debonding from the composite and frictional pull-out of the z-Pin until complete pull-out [21,25]. This response occurs when the z-Pin interfacial bonding load with the composite is lower than the z-Pin rupture load. Sometimes the debonding mechanism is absent when the z-Pins have been completely debonded from the composite after curing due to cure stresses. Typically, the debonding and frictional pull-out response is represented by a bi-linear or tri-linear curve, as shown in Figure 12.
If the loading angle with the z-Pin’s longitudinal axis is large, snubbing and pin splitting may occur. Snubbing will occur when there are large crack sliding displacements that force the pin to laterally deflect into the laminate. This technique greatly increases friction between the pin and laminate and increases resistance against shear-induced pull-out. Also, pin splitting occurs under the same conditions as snubbing, sometimes coexisting, and is a process under which the z-Pin splits into several strands parallel to its main axis, due to internal shear failure [28].
In the case of pin fracture, the first mechanism that takes place is elastic deformation of the z-Pin until the loading reaches the axial rupture load of the z-Pin. This response occurs when the z-Pin interfacial bonding load with the composite is higher than the z-Pin rupture load.
In the case of a significant shear loading while pulling out, the snubbing mechanism takes into effect. Snubbing occurs when the z-Pin laterally deflects into the laminate, locally plastically deforming it and creating a high friction zone. However, a shear loading threshold exists, that, when surpassed, results in shear rupture of the z-Pin. In 2011, Cui et al. [25] through numerical modeling of the snubbing mechanism concluded that in conjunction with increasing the bridging force, it also increases the energy dissipation.
In 2010, Cartie et al. [20] showed that the pull-out response of a single pin that can be characterized by a tri-linear curve can be divided into two subcategories: (a) instant debonding and (b) debonding over time, as shown in Figure 13 and Figure 14. In the case of instant debonding, the debonding curve of the tri-linear response is vertical, causing an instant drop in force with constant displacement.
In the case of debonding over time, the debonding occurs over a small time period, with a linear drop in force over an increase in displacement. This occurs when the z-Pin does not debond instantly but over a period of time, during which energy is consumed both by debonding and frictional sliding. After complete interfacial debonding, the only mechanism that works is frictional sliding until the z-Pin is completely pulled-out of the laminate. Furthermore, in 2011, H. Cui et al. [25] supported the theory that debonding occurs over time, during which the interface bonding degrades, while the frictional sliding mechanism emerges. In that effect, the interfacial stress was concluded as being a combination of bonding and frictional stresses.
In 2011, Toral Vazquez et al. [22] performed single pin (z-Pin) testing and tested the pin embedment depth effect on the pin response. The results, presented in Figure 15, show that with increasing embedment depth, the pin strength response in pull-out was improved by raising both the crack initiation and debonding load. However, both loads increased until a certain threshold of approximately 6–8 mm of depth, after which no significant increase was noted.
In 2011, Bianchi et al. [21] concluded that the numerical modeling of z-Pins includes two main approaches: (a) averaging of z-Pin forces over the bridging area using traction elements and (b) representing the z-Pin as a concentrated force governed by a non-linear response. In addition, it was noted that the z-Pin was most likely to be debonded and pulled-out from the side with the chamfered edge (utilized for ease of insertion).
Numerical mode I results of a meso-scale model, produced the following stress distributions for single z-Pin pull-out, are shown in Figure 16 and Figure 17. It is observed from the figures that the normal residual stress compresses the z-Pin in the radial direction, while the shear residual stress also tends to compress the z-Pin (and tension the laminate) in the axial direction. When the pull-out load is applied, both the maximum normal and shear stress is observed near the z-Pin end.
In 2012, Bianchi et al. [23] applied mode II numerical analysis in a meso-scale model and observed that z-Pin embedment and diameter affected the z-Pin response, as shown in Figure 18 and Figure 19 With increasing z-Pin embedment and diameter, the maximum z-Pin load increases. In addition, small diameter and deeply embedded z-Pins are more likely to fail by rupture than pull-out. Finally, it was noted that larger diameter z-Pins had higher stiffness and elastic force.
This study correlated with the experimental findings of A.P. Mouritz in 2015 [32], which reveal that with greater z-Pin embedment, the elastic deformation and frictional sliding load increased.
In 2013, Mouritz et al. [13] displayed the effects of z-Pin void content, offset angle, z-Pin interface and embedment depth in mode I z-Pin response. In an analytical solution, the average z-Pin modulus was calculated taking into consideration the offset angle (θ) and void content (φ) of the z-Pins, and was plotted as shown in Figure 20. It is clearly noted that void content affects the traction stiffness in a much less significant quantity than the z-Pin offset angle.
The z-Pin interface with the laminate has an important role in the z-Pin maximum traction load and frictional sliding response. It was displayed that interfacial cracking, caused by misalignment in the thermal expansion coefficients, reduced in a linear trend the maximum traction load. Also, the snubbing mechanism, which is generated when the z-Pin laterally deforms into the laminate, increased the friction induced during sliding, thus increasing the pull-out traction load. It was reported that the snubbing friction of a slightly inclined z-Pin can be 3 to 10 times greater than a z-Pin placed normal to the laminate. Finally, it was shown that the models predict the z-Pin response more accurately when taking into consideration the snubbing effect.
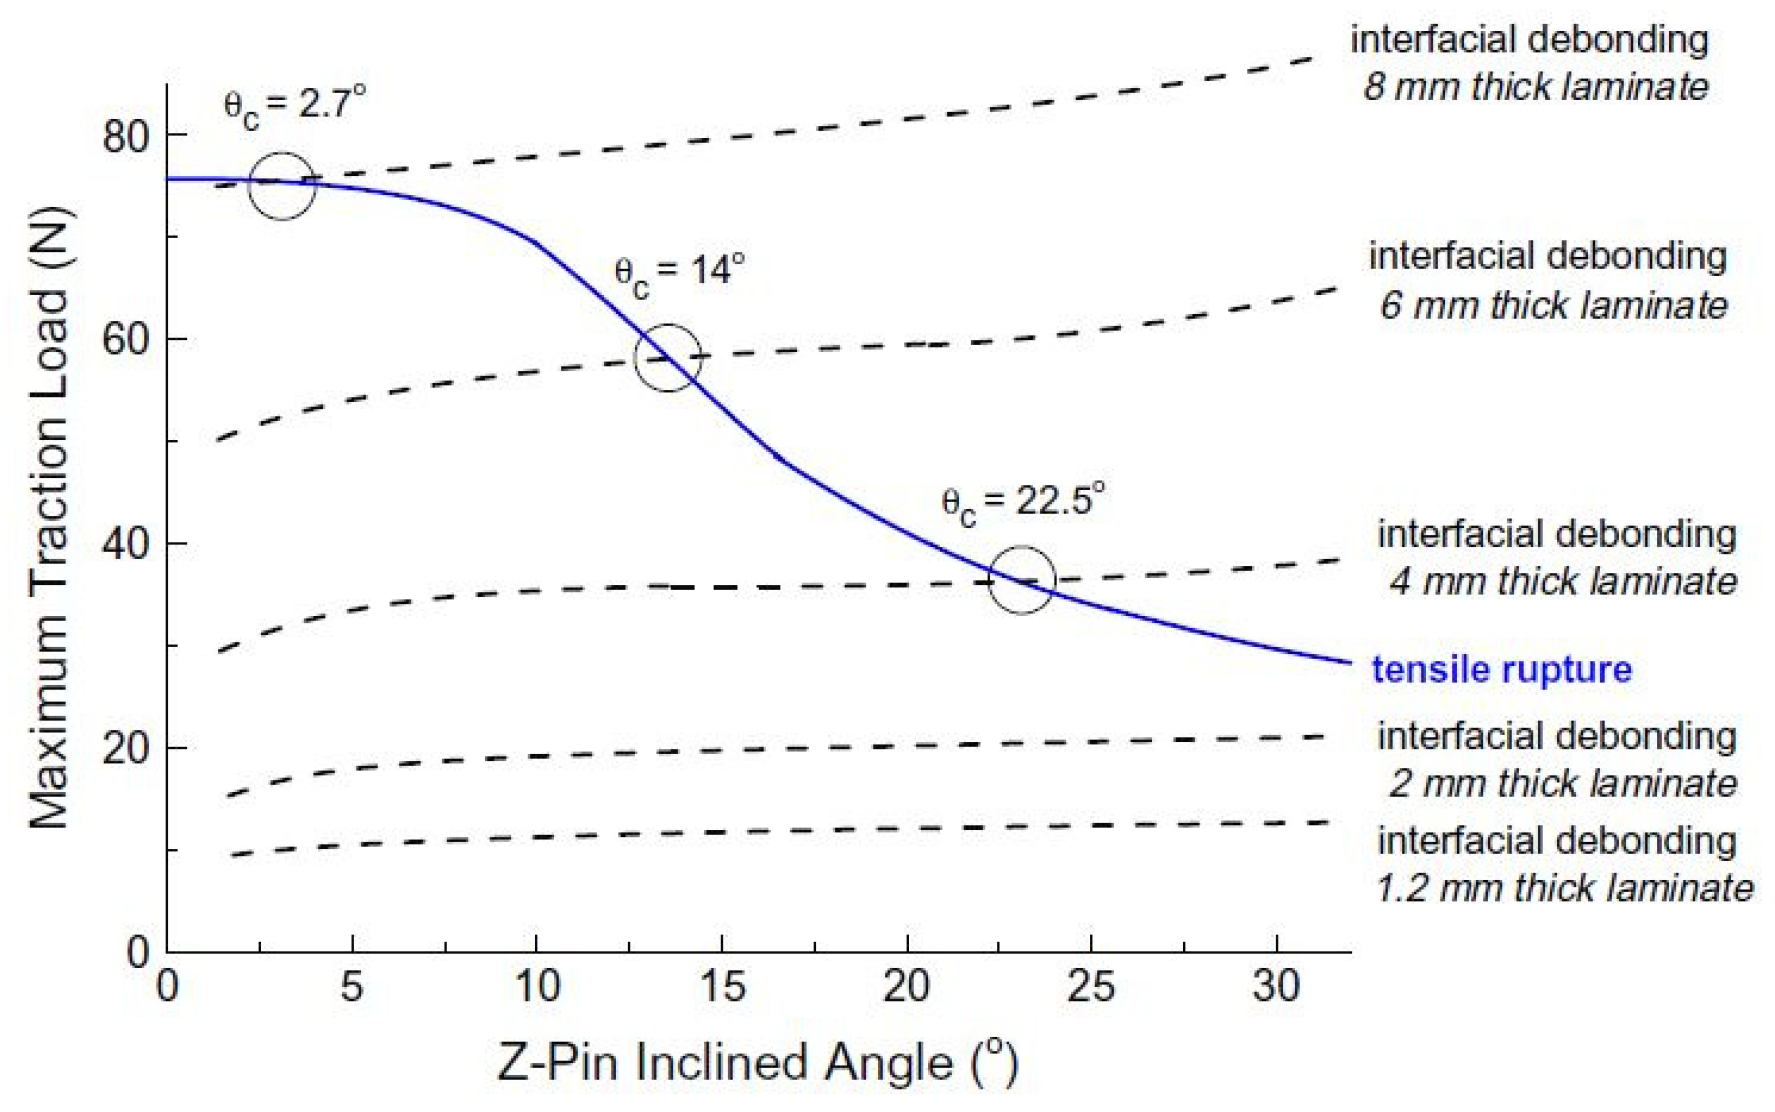
Analysis of the z-Pin response in dependence with embedment showed a transition from z-Pin debonding and pull-out to rupture at a critical depth. As has been shown by Mouritz and Koh [13], and as presented in Figure 21, the transition point is also dependent on the z-Pin offset angle, in addition to embedment depth. Higher embedment depth increases the debonding load, while a higher offset angle reduces the critical rupture load.
In 2013, Pingkarawat and Mouritz [33] displayed the effects of z-Pin embedment in z-Pin response under mode I loading, as shown in Figure 22. This response agreed with the mode I pull-out loading predicted by Mouritz and Koh [13] and with mode II response predicted by Bianchi et al. [20]. The response showed that the maximum z-Pin load increases with z-Pin embedment and that over a critical embedment threshold between 4 and 8 mm, the z-Pin failure mechanism changes from debonding and pull-out to rupture (t ≈ 6.4 mm was the critical embedment calculated in Ref. [13]).
In 2014, Yasaee et al. [31] performed mixed mode experiments on single z-Pin laminate specimens, while taking into consideration the offset angle in respect to the mode mixicity angle. Experiments were performed in both unidirectional and quasi-isotropic z-Pinned laminates.
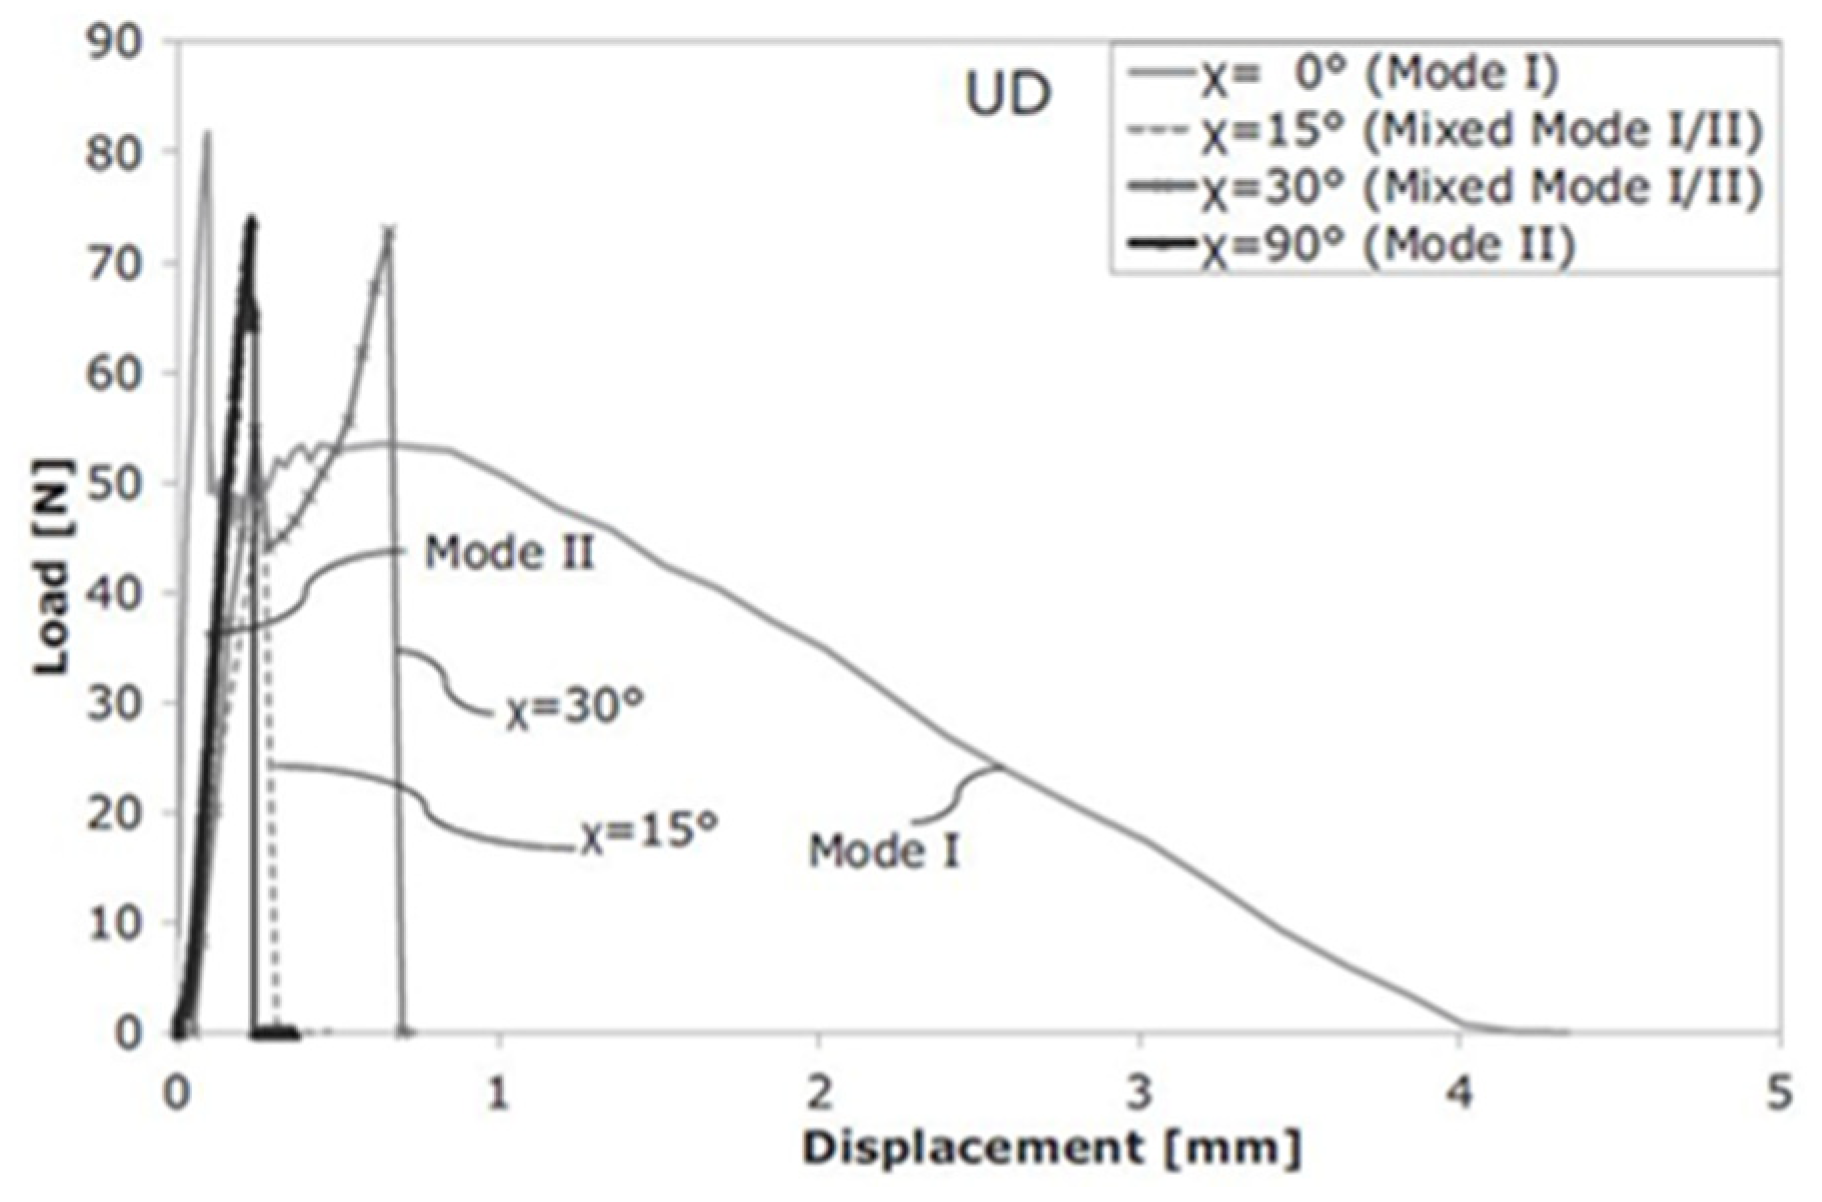
It was observed that with increasing mode mixicity ratio from pure mode I to pure mode II, the unidirectional specimens clearly displayed debonding from the laminate, while in quasi-isotropic specimens there was no clear distinguishing transition from the elastic to the frictional slipping response. This observation is attributed to the weakened z-Pin interface due to the residual stresses generated by the multiple ply orientations inhibiting the contraction of the laminate. Figure 23 presents the load versus displacement plot for various load mixicity ratios in the case of a unidirectional (UD) laminate, while Figure 24 provides the energy absorbed by the single z-Pin for different mixed mode angle loadings in the case of UD laminate, and correlate it with the failure mode of the z-Pin.
There was observed a transition region between the pull-out and rupture response, dependent upon the mixed mode angle. The unidirectional specimens exhibited a transition region at 11°–18° mixed mode angle, while the quasi-isotropic at 33°–37°. At smaller angles, the z-Pins failed by pull-out, while at greater angles they failed by rupture. This study showed the clear dependence of z-Pin response on the laminate stacking sequence.
In 2016, Mouritz et al. [37] performed a comparative testing for metal and composite z-Pins of strengthened composites in pull-out response.
As shown in Figure 25, the CFRP z-Pins performed better in terms of peak load than the metallic ones, followed in performance by the steel, titanium and copper z-Pins, in that order. In terms of traction energy, the CFRP, steel and titanium z-Pins had approximately the same traction energy, while the copper z-Pins had significantly lower. This is proven by the fact that pull-out was observed for all z-Pins except the copper ones, which failed prior to pull-out by rupture. It is concluded that the z-Pins interfacial strength does not significantly affect the friction sliding response when pull-out occurs. It was also added that the peak traction load is dependent upon the residual stresses at the z-Pin interface, which is expected to differ with each different material z-Pins due to the difference in respective coefficient of thermal expansion.
In 2014, Allegri et al. [12] performed mixed mode single z-Pin experiments and, following the work of Yasaee et al. [31], the z-Pin offset angle in respect to the mode mixicity angle was taken into consideration. As shown in Figure 26, the apparent fracture toughness varies with mode mixicity ratio. The mode mixicity is defined as the ratio of the delamination sliding displacement to the total displacement. For increasing the mixicity ratio from 0 to 0.4 (mode I dominated), the apparent toughness increased linearly, because of snubbing. In mode mixicity ratios from 0.4 to 0.8, a transition region was observed, where the z-Pin failure mechanism slowly changed from pull-out to rupture with increasing angle. Finally, in mode mixicity ratios from 0.8 to 1 (mode II dominated) all z-Pins failed by shear rupture. In this study, it was shown that the optimal performance of z-Pins is located at a mixicity ratio loading up until 0.4, right before the transition region. In that case, the z-Pin pull-out mechanisms are fully exploited without premature failure due to rupture.
The z-Pin mixed mode response was analytically modeled and loaded in mixed mode, with the z-Pin represented as a Euler–Bernoulli beam and using the Weibull failure criterion. The z-Pin laminate interface was modeled as an elastic foundation with three types of distributed forces, namely: (a) Winkler’s foundation forces, (b) residual frictional forces and (c) Coulomb frictional forces. The analytical results correlate well with the experimental observations.
In the case of mode mixicity ratio 0.55, the normal and shear stresses of the z-Pin were calculated and are presented in Figure 27 and Figure 28 respectively. The stress peaks in the normal stress diagram are in the embedded part of the z-Pin close to the delaminated surfaces, which are essentially due to the bending moment. Thus, it is concluded that the z-Pin is more likely to fail from rupturing within the laminate near the delaminated surfaces, which is where most z-Pins also fail in experiments.
From Figure 28, it is observed that the stress peaks in the shear stress diagram are located exactly on the delaminated surface. At these points splitting of the z-Pin in two or multiple strands is more likely to occur. Splitting is not a critical failure mode; however, the z-Pin bending stiffness is decreased. Through analytical implementation, it is concluded that no splitting occurs before 0.3 mode mixicity and after 0.7 (in the mode I and II dominated regions). However, within the span 0.3 to 0.7 of mixicity ratio (transition region), splitting occurs and results in a small increase in the apparent fracture toughness. From the macroscopic perception, splitting causes a drop in stiffness in respect to the unsplit z-Pin.
In 2015, Allegri et al. [29] continued the research on mixed mode single z-Pin loading response. In this study, the residual thermal stresses during manufacture were accounted for in numerical modeling. It was observed that the interface is loaded mainly in its radial direction due to the thermal stresses. This results in a weakening of the interface, leading to the absence of the load drop due to debonding in many cases. It was noted that the z-Pin response is also dependent on stacking sequence of the laminate, the z-Pin splitting and on the z-Pin bonding interface, as shown in Figure 29, Figure 30 and Figure 31. In Figure 29, it is observed that multiple splitting will shift transition region towards higher mixed mode ratios. Additionally, in Figure 30, higher residual stress increases the apparent fracture toughness for low and moderate mixed mode ratios, but also shifts the transition region to slightly lower ratios. Finally, in Figure 31, it is observed that a higher interface bonding toughness will increase the apparent fracture toughness of the laminate.
In 2016, M’membe et al. [17] performed static mode II tests on single z-Pinned specimens to observe the impact of z-Pin offset angle on the toughening effect. As shown in Figure 32, for z-Pins inclined with the nap, with increasing inclination, the maximum load and also energy absorbed are increased in a linear trend [17]. However, for z-Pins inclined against the nap, increasing inclination exhibits the opposite impact, showing a linear trend reduction in maximum load and energy. With greater nap angles in mode II loading, the z-Pins are loaded in a misalignment angle less than 90° (as in pure mode II loading of orthogonal z-Pins), which favors z-Pin pull-out over rupture. Additionally, a greater z-Pin angle increases the embedment depth of the z-Pin. Finally, with increasing z-Pin angle against the nap, the z-Pin is loaded in compression and shear, resulting in early failure by rupture.
4.2. Single Pin Response – Hygrothermal
The response of a single z-Pin in a hygrothermal environment changes significantly as correlated by experiments and models, primarily by the degradation of the elastic response.
In 2012, Mouritz et al. [38] performed pull-out testing of specimens aged by 1 year in: (a) ambient atmospheric conditions (20 °C and 50% humid), (b) high-temperature and humidity (70 °C and 85% humid), (c) immersed in 20 °C water and (d) immersed in 70 °C water. The water absorption rate for the z-Pinned specimens was higher than the unpinned for all cases, and for the water immersion cases an acceleration of water absorption was also observed, as shown in Figure 33. The higher water absorption rate was attributed mainly to the interfacial cracks between the z-Pins and the laminate and to the existence of voids within the z-Pins, by providing a pathway for the infiltration of water in the laminate. In addition, the diffusion coefficient along the z-Pin axis is much greater than in the transverse direction, raising the absorption rate even higher.
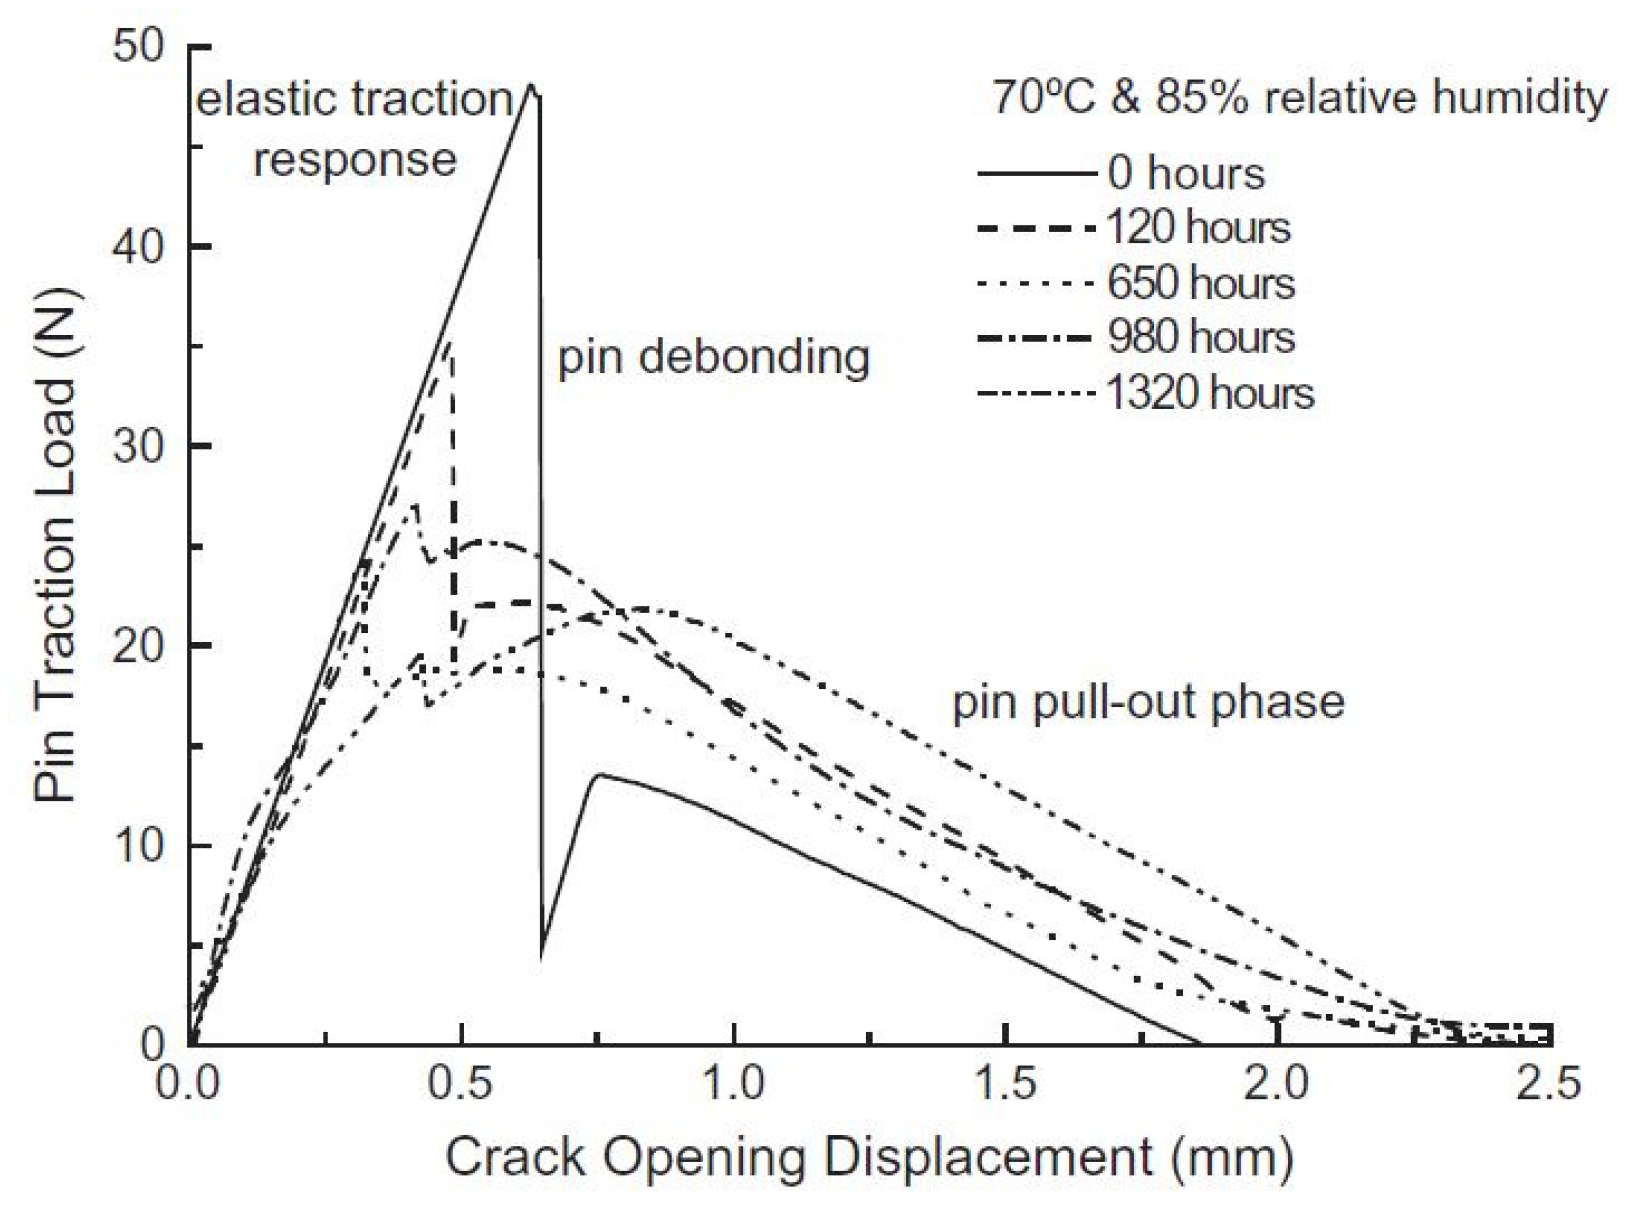
The pull-out response of z-Pins in hygrothermal environment is presented in Figure 34 and Figure 35. Both displayed a degradation of the maximum z-Pin traction load and energy with time of exposure in their respective hygrothermal environment.
In 2013, Mouritz [24] continued the research on the hydrothermal impact of z-Pinning. It was presented that hot-wet conditioning (70 °C and 85% humid experiment) over time significantly affected only the elastic response of the z-Pin, while the pull-out sliding energy remained the same, as shown in Figure 36.
4.3. Single Pin Response – Fatigue Pull-out
In 2007, Zhang et al. [36] studied the response of z-Pins embedded in a cross-ply laminate that were imposed to a cycle fatigue test with a fatigue displacement ratio (δmax = maximum displacement/δ1 = debonding displacement) of 0.5, as shown in Figure 37 and Figure 38. It was shown that cyclic fatigue does not affect the elastic modulus of the z-Pins for loads significantly lower than their static axial strength. However, the maximum debonding force is degraded with an increase in the number of cycles (N). On the other hand, the frictional force clearly degrades in a high number of cycles (over 18,500 cycles), while for a medium number (5000 cycles) the effect is not obvious.
In the same study [36], the normalized residual debonding force and normalized frictional force degradation with number of cycles were registered [36]. It was derived that the maximum debonding force decreases more rapidly with an increasing fatigue displacement ratio. For both z-Pin diameter sizes, the degradation is the same until 103 cycles [36]. For large diameter z-Pins (type 4), the degradation is more rapid for cycles over 103, in contrast with small diameter (type 1) [36]. This degradation is associated with the larger interfacial area of the large diameter z-Pins, which may contain more and larger pre-loading flaws [36].
The friction force was normalized to the friction pull-out force under monotonic loading (Pfs). The frictional force degraded more rapidly in contrast with the residual debonding force in respect to the number of cycles, showing that damage accumulates faster after the debonding of the z-Pin [36]. It was also shown that with increasing corresponding displacement (δs), the frictional force degradation occurs sooner [36].
5. z-Pinned Laminate Properties
5.1. In-plane Properties
In general, the in-plane properties of z-Pinned composites are slightly degraded by an average percentage of 10%–15%, for a 2.0 vol% z-Pin content laminate composite [1,39,40]. In addition, it is shown that the reduction in the in-plane properties of z-Pinned laminates is more predictable than the other z-reinforcement types, with z-Pinning having a decreasing linear trend [1,15,39,40].
5.1.1. Tension Properties
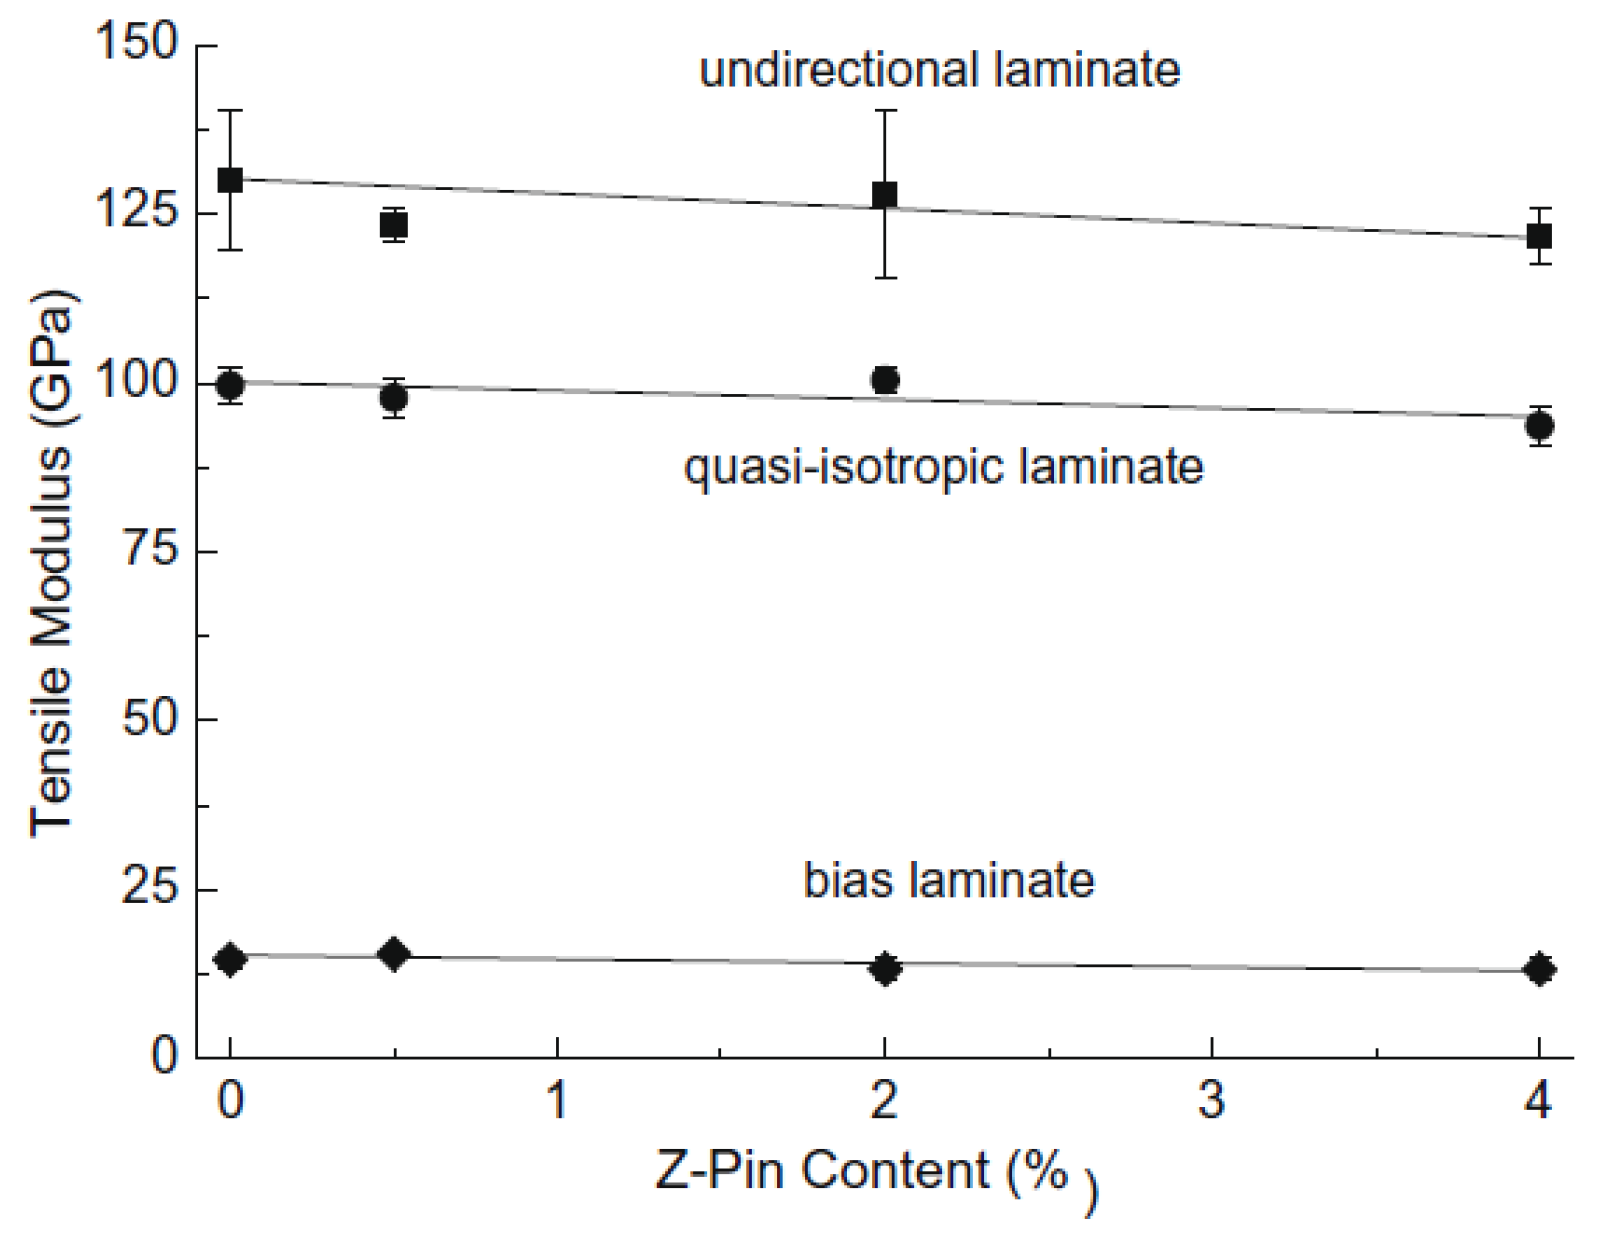
Most studies have shown either reduction in the tensile modulus of z-Pinned composites [1,15,40], or no significant change [16]. Until the z-Pin volume content of 4%, the tensile modulus suffers no significant change [16]. Generally, with increasing z-Pins volume content and diameter, the tensile modulus is reduced in a linear trend [1,40]. In addition, with the reduction in load bearing fibers (0°) in the laminate, the loss is less severe [1,16]. Thus, in a quasi-isotropic (or biased) laminate, the loss is expected to be less than for a unidirectional one [1,16]. Moreover, fiber waviness, crimping and swelling of the laminate can contribute to the loss of tensile modulus [1,16].
Furthermore, z-Pinning lowers the tensile strength of a laminate imposing a decreasing linear trend, with increasing z-Pins volume content and diameter [1,16]. The reduction is mainly attributed to the fiber breakage and swelling occurring during z-Pin insertion [1]. Fiber breakage creates sites for splitting cracks and tensile failure of laminate fibers, while swelling reduces the fiber volume content of the laminate [1]. The above-mentioned trends are clearly demonstrated in Figure 39 and Figure 40.
Both the fatigue life and strength of laminates is lowered by z-Pinning, under tensile cyclic loading [1,15,16,40]. Increasing z-Pin volume content and diameter leads to reduction in fatigue life and strength [1,12,38]. This occurs due to the acceleration of fatigue-induced damage at the clusters of broken fibers, due to the presence of z-Pins [1].
Figure 41 and Figure 42 shows the effect of z-Pinning under fatigue loading conditions in UD and cross ply laminates, respectively. In agreement with the monotonic behavior, the fatigue-induced damage is accelerated with the increasing presence of load bearing fibers (0°) in the laminate [16].
In 2009, Mouritz et al. [16] published that the fatigue failure mechanisms vary in relation to the fiber lay-up of the laminate. The results show that load bearing fiber plies had longitudinal cracks developed in the resin-rich zone of the z-Pin proximity area, due to transverse tensile strain caused by the wavy fibers under loading. In addition, clusters of broken fibers were developed in the contact area of the z-Pin with the laminate, and expanded with cyclic loading as broken fibers exhibit poor stress transfer.
In contrast, the ±45° plies in a quasi-isotropic laminate had the z-Pin debonded from the laminate by the propagation along the interface, of a preexisting crack due to residual stresses. Finally, the crack propagates through the resin-rich zone parallel to its main axis, as shown in Figure 43, until it travels to the neighboring z-Pin and merges with another local crack, creating a single long crack.
In 2014, Chun et al. [41] predicted through numerical modeling the in-plane properties of z-Pinned woven laminates in respect to the z-Pin diameter, the size of the resin-rich zone and the thickness of the woven plies. The results show that z-Pin diameter was the factor that affected the in-plane properties the most, by slightly degrading them with increasing diameter. The size of the resin-rich zone and the thickness of yarn affected the in-plane properties significantly less, with slight increases or decreases of less than 10% with increasing size.
5.1.2. Compression Properties
It is concluded that z-Pinning affects and degrades unidirectional laminates compressive modulus and strength, in a greater degree than cross-ply and quasi-isotropic laminates, and biased laminates even less, as shown in Figure 44 and Figure 45 [39]. From these results, it can be derived that the loss in modulus and strength is greater when the majority of the fibers are in the load bearing direction (0°) [1,39,42].
As was stated earlier, by increasing the z-Pin volume content and diameter, the tensile modulus is reduced in a linear trend [1,43,44]. Moreover, fiber waviness, crimping and swelling of the laminate can contribute to the loss of tensile modulus, with dominating factor the reduced fiber volume ratio [1,39].
Like tensile properties, z-Pinning lowers the compression strength of a laminate by a decreasing linear trend, with increasing z-Pin volume content [1,15,39,43,44,45] and diameter (with fixed z-Pin volume content) [1,39,44]. However, the reduction is mainly attributed to fiber waviness and crimping caused by the z-Pin, which results in microbuckling and kinking of the laminate fibers during compression [1,7,39,42,43]. Likewise, as in tension, the reduced fiber volume content due to swelling is found to be the main factor in the reduction in compression strength [1,42]. It is calculated that an increase in the z-Pin density (for constant diameter) caused greater strength reduction than increasing z-Pin diameter (for constant density) [1,44].
In 2009, Waas et al. [43] created and analyzed a z-Pinned composite laminate finite element model in tow kinking and microbuckling failure. Simulations showed that a global initial geometrical imperfection (Figure 46) reduced the compressive strength of the laminate, as shown in Figure 47, by the creation of a kink band.
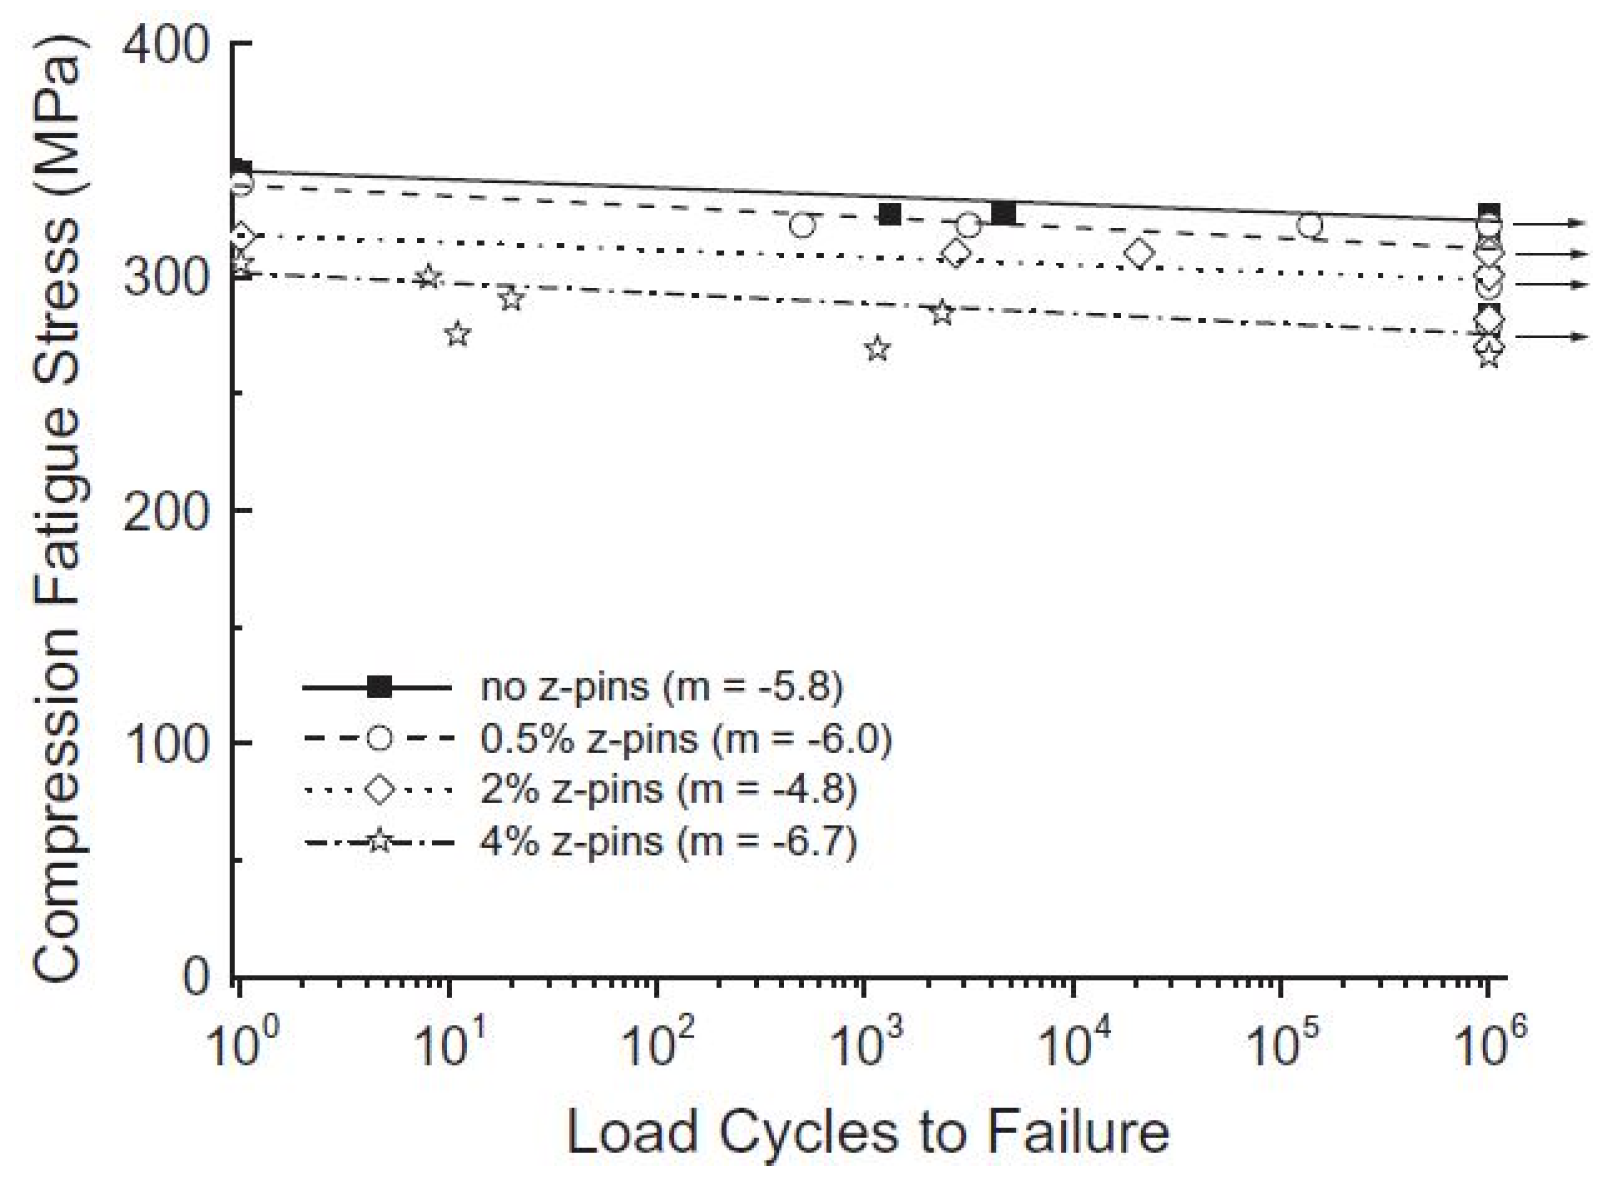
Likewise, in tension, both the fatigue life and strength of laminates is lowered by z-Pinning, under compressive cyclic loading [1,15]. Fatigue curves of z-Pinned composites show that the fatigue life and S–N curve drop to lower levels with increasing z-Pin content and diameter [1,39], as shown in Figure 48 and Figure 49 for UD and quasi-isotropic laminates respectively. The degradation mechanism is mainly attributed on the progressive rotation of wavy fibers due to matrix plastic flow, which accelerates failure by microbuckling and kinking [1,15,39].
The recent work of J. Hoffmann, G. Scharr [46] confirmed the above observations. They investigated the static and fatigue compression behavior of unidirectional (UD) and quasi-isotropic CFRP laminates reinforced with rectangular and circular z-Pins. The use of z-Pins did not alter the compression modulus of the tested coupons. In contrast to this finding, all z-pinned laminates demonstrated an important reduction in compressive strength compared to unpinned samples. Furthermore, the use of rectangular shaped z-Pins led to less reduction in the compression strength in both CFRP laminates (UD and quasi-isotropic). Under fatigue loading, the insertion of both rectangular and circular z-Pins resulted in the decrease in the fatigue performance of both UD and quasi-isotropic laminates.
5.1.3. Flexure Properties
The flexural modulus and strength are reduced by increasing the z-Pin volume content, a trend that follows the tensile and compressive properties of z-Pinned composites [15]. As shown in Figure 50 and Figure 51, the reduction is linear with z-Pin volume content and is dependent on the laminate lay-up [15]. The reduction is greater for unidirectional laminates, followed by cross-ply and quasi-isotropic laminates [15].
In the case of flexural fatigue, with increasing z-Pin volume content, the fatigue strength of the laminate is slightly decreased [15]. However, the loss of strength compared to the initial monotonic strength is negligible, while the S–N curves remain parallel, independent of z-Pin volume content, something which does not occur for tensile and compressive fatigue [15]. It should be noted that a change in the angle of the slope in a S–N curve suggests a change in the fatigue mechanism [15].
5.2. Interlaminar Properties
z-Pinning significantly increases the interlaminar properties of composite laminates. It improves the delamination toughness, provides high energy impact resistance, damage tolerance and joint strength [1,46]. Generally, z-Pinning is not effective in resisting the initiation of delamination cracks and growth of short ones; however, it is very effective in resisting the growth of large delamination cracks [1]. In addition, the presence of z-Pins changes the crack propagation behavior from an unstable one in unpinned laminates, to a stable one in most z-Pinned cases [1,46]. From Figure 52 it can be derived that the apparent mode I interlaminar toughness rises more rapidly with increasing z-Pin volume content [1]. It is proven that z-Pins are more effective at suppressing mode I cracks than mode II [1,46].
Furthermore, z-Pinning significantly increases the through-the-thickness properties of laminates [1]. Finite element studies show an increase of 23% in the tensile through-the-thickness modulus in carbon/epoxy laminate with a 1.9 vol% z-Pins, and 60% with 4.9 vol% z-Pins [1]. However, this has not been verified with testing [1]. In addition, no data exist on the effect of z-Pinning in the tensile through-the-thickness strength [1].
5.2.1. Mode I
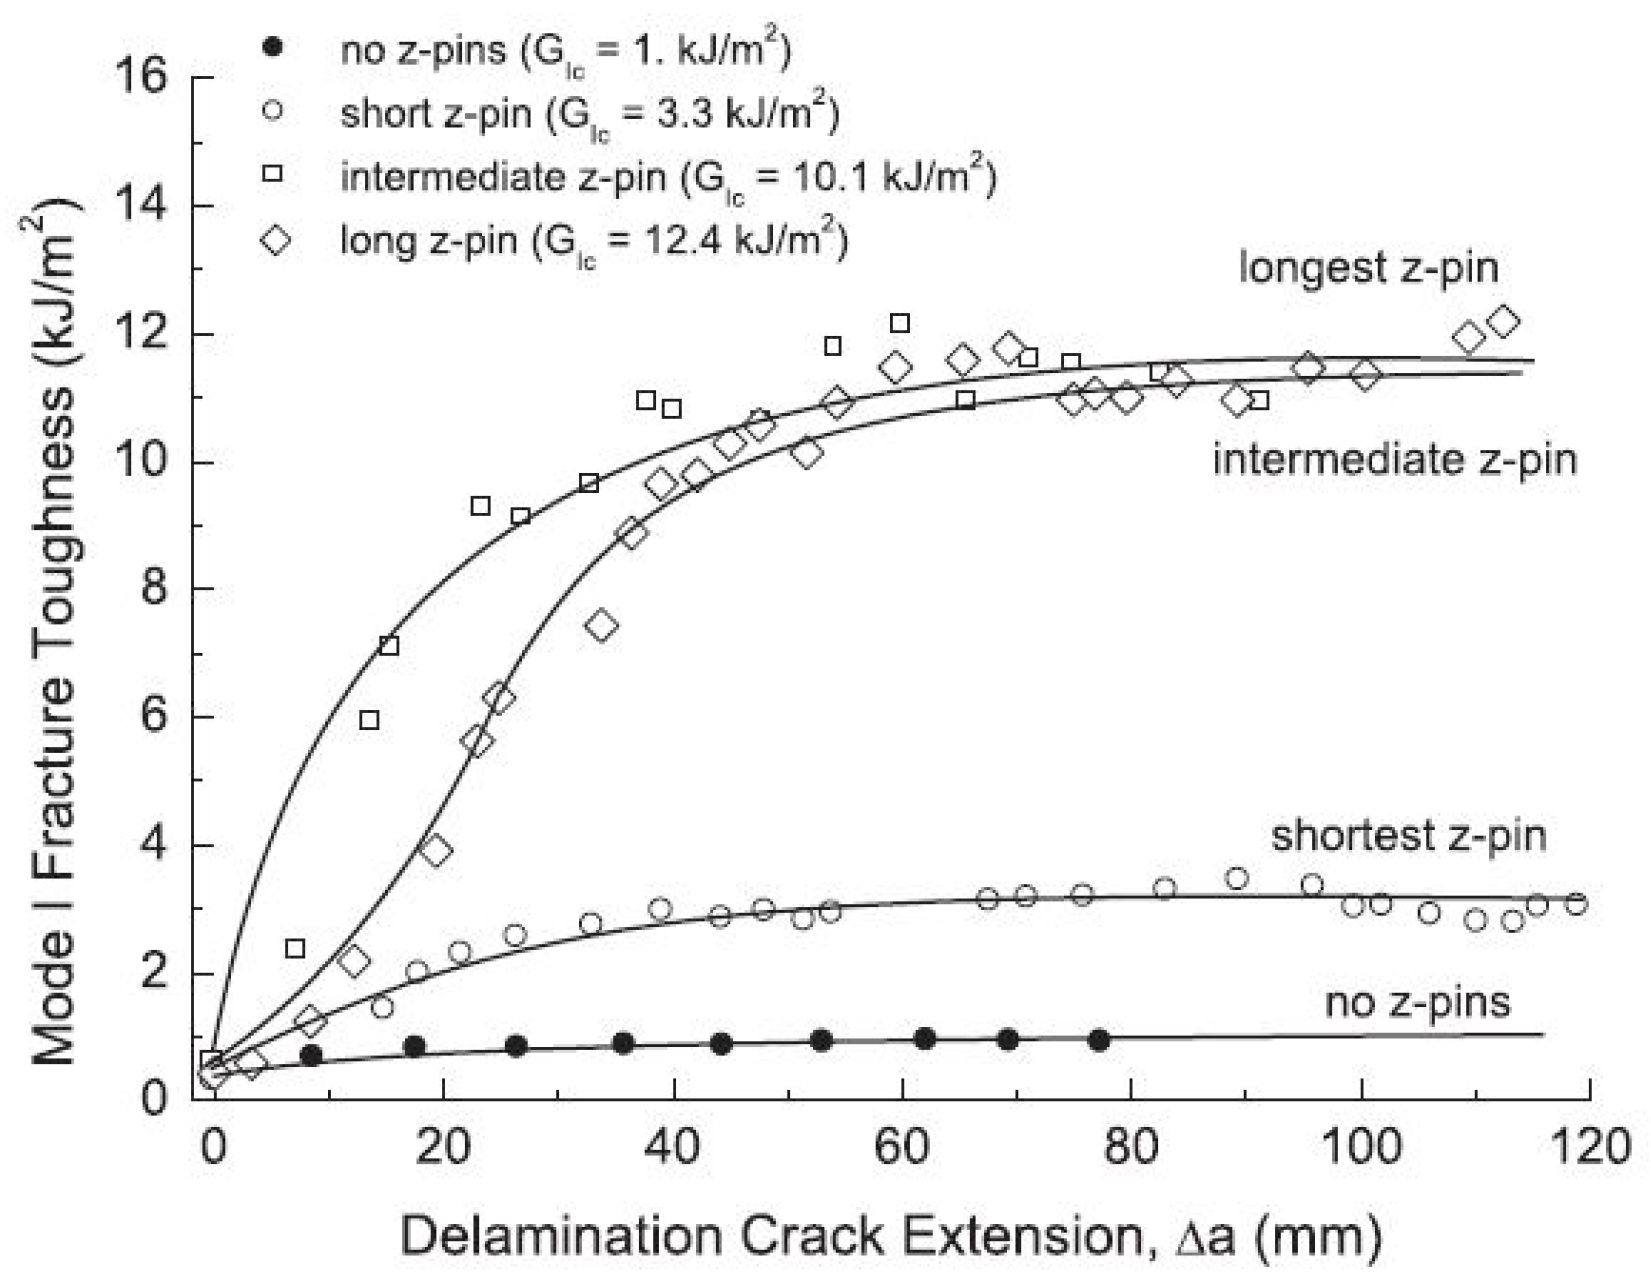
In 2013, Mouritz et al. [33] performed z-Pinned specimen testing to display the effects of z-Pin content, diameter and embedment depth on mode I interlaminar fracture toughness. The experiments presented the increase in interlaminar fracture toughness of z-Pinned composites with increasing z-Pin content, as shown in Figure 53. In the R-curve, it is clearly shown that the interlaminar fracture toughness increases in an initial crack extension region until it reaches a threshold, where the bridging area is fully developed, and self-similar crack propagation is concluded. In addition, thin z-Pins (0.28 mm) performed better in interlaminar fracture toughness compared to thick z-Pins (0.51 mm) for the same z-Pin content. Finally, with greater z-Pin embedment depth, the interlaminar fracture toughness also increased.
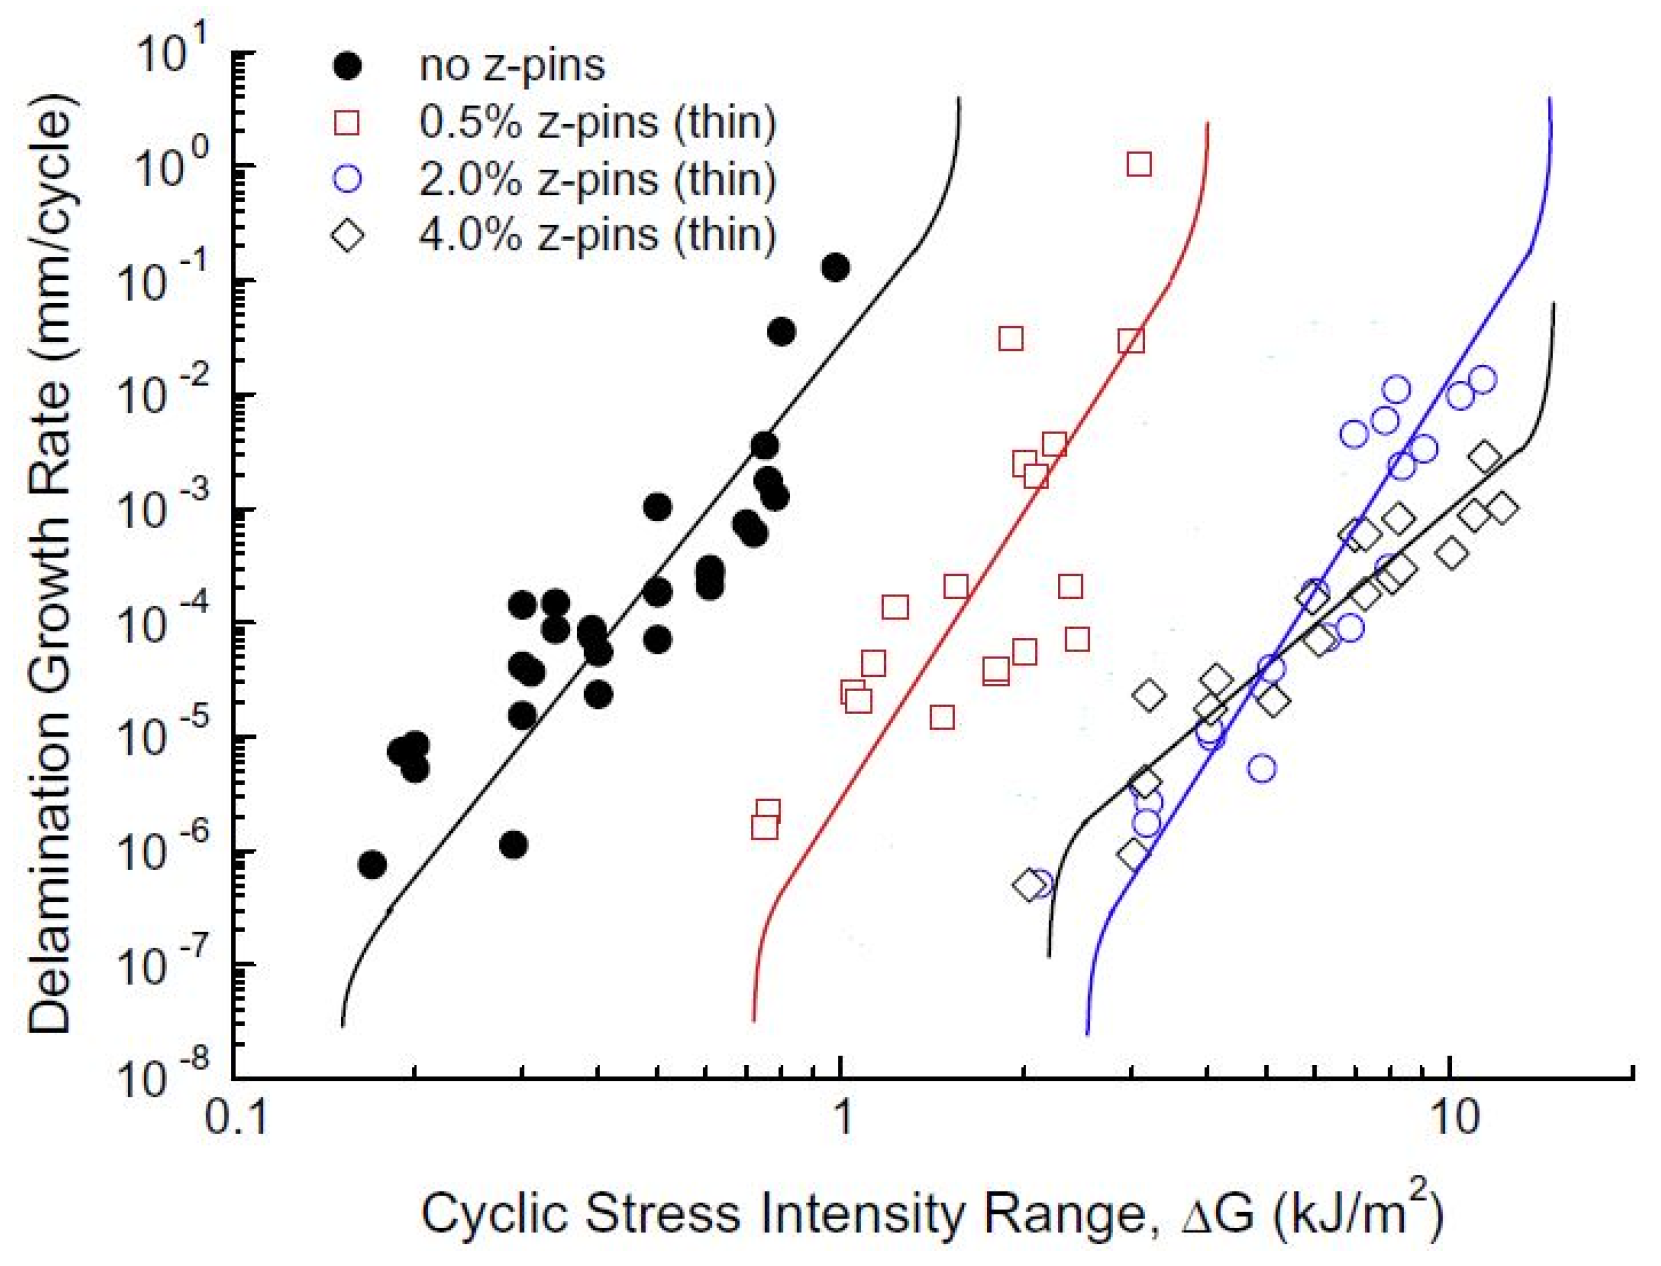
Fatigue testing under mode I displayed the effects of z-Pin volume content, diameter and embedment depth on crack growth rate. As shown in Figure 54, greater z-Pin content increased the fatigue resistance up to the threshold of 2.0 vol% content, after which no further increase was noted. It was also observed that thin z-Pins showed better fatigue resistance versus thick z-Pins. Finally, greater z-Pin embedment depth increased fatigue performance up to the 4 mm z-Pin length.
In 2015, Mouritz et al. [32] tested the effect of z-Pin embedment on mode I and II delamination. In mode I, the apparent fracture toughness increased with z-Pin embedment, as shown in Figure 55. However, over a specific embedment (4 to 8 mm), the increase was much smaller. Testing showed that for the highest embedment of z-Pins, interlaminar toughness was so high that it was more energy favorable for new cracks to be initiated than for the initial one to propagate. Mode I fatigue behavior displayed an increase in fatigue resistance with z-Pin embedment until the threshold of 4 mm z-Pins was reached, after which no further increase was noted.
In 2016, Mouritz et al. [37] performed comparative testing for metal and composite z-Pins of strengthened composites in mode I static and fatigue testing. In Figure 56 the R-curves for different material z-Pins are presented. It is noted that the fracture toughness for the CFRP, steel and titanium z-Pins is similar, while the copper z-Pins perform worse. In addition, the failure modes were similar for the CFRP, steel and titanium, which all failed by pull-out. Copper z-Pins failed by rupture prior to pull-out. Thus, it is concluded that the delamination toughening is dependent on the strength of the z-Pin and the interfacial strength.
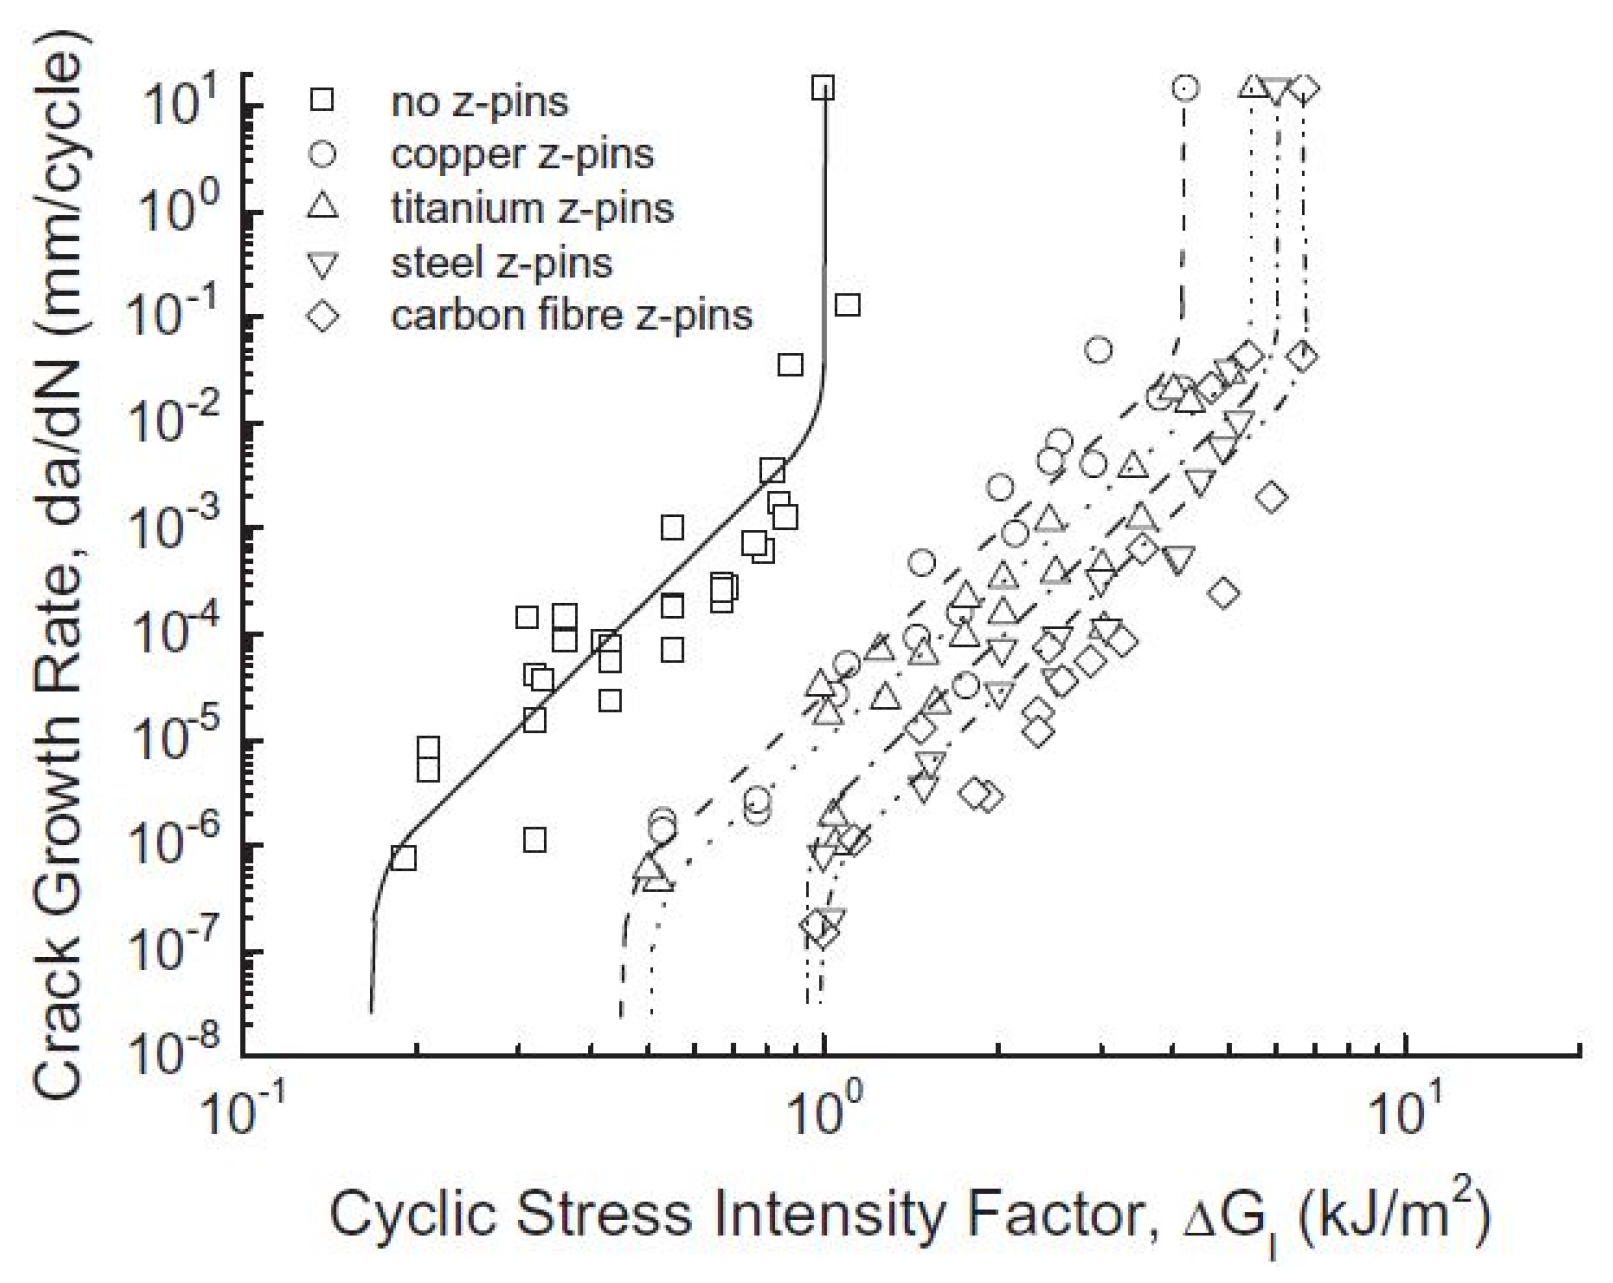
The fatigue response under mode I remote loading for the different material z-Pins were similar to the static one, with the CFRP z-Pins providing the greater delamination growth rate resistance, followed by the steel, titanium and copper z-Pins, as shown in Figure 57. Additionally, the failure mechanism for the CFRP z-Pins was different from the metallic ones. CFRP z-Pins failed by debonding and gradual pull-out, while the metallic ones failed by fatigue cracking along the delamination plane. Thus, it is concluded that the fatigue strength of the z-Pinned composite is dependent on the individual strength of the material used for the z-Pins.
In 2011, Bianchi et al. [21] performed a comparison between experiment and simulation in mode I loading of unpinned and pinned DCB specimens. The mode I strengthening mechanism is shown in Figure 58, which mainly involves the creation of a bridging area, where several active rows of z-Pins connect the two delaminated surfaces of the laminate [21]. Under mode I loading, the initial crack starts propagating at the same load level for both unpinned and pinned specimens, showing that the initial delamination load is dependent solely upon the matrix properties [21]. However, as soon as the crack reaches the z-Pins and the bridging effect starts to grow, the load carrying capability quickly recovers for the pinned composite, while the unpinned loses its capability [21].
In 2012, Song et al. [47] performed numerical analysis of DCB samples under mode I loading. They introduced simplified linear response modeling for z-Pins. Comparison with analytical, experimental and tri-linear z-Pin response FEM data displayed good correlation for the global model, indicating that details in the bridging law do not greatly affect the global behavior.
5.2.2. Mode II
In 2014, Huang and Waas [48] performed experiments in z-Pinned composites under mode II loading, on unidirectional and quasi-isotropic laminates. The results display that with increasing z-Pin volume content, the fracture toughness increased in a linear manner, as shown in Figure 59. In addition, smaller diameter z-Pins provided slightly better fracture toughness in contrast to larger ones, due to higher contact area.
In 2014, Mouritz et al. [27] performed mode II experiments on z-Pinned specimens and measured the fracture toughness and fatigue behavior versus the z-Pin volume content and diameter. With increasing z-Pin content and decreasing z-Pin diameter, the apparent fracture toughness increases, as shown in Figure 60 and Figure 61. Apparent fracture toughness increases with the crack extension until it reaches a threshold, which is higher with the increasing z-Pin volume content. Considering the effect of the z-Pin diameter, it is observed that with increasing delamination crack extension, the thin z-Pins (0.28 mm) reach a toughness threshold, while the thick z-Pins (0.51 mm) increase the toughness in a linear trend. This behavior indicates that the shear bridging zone for thick z-Pins never fully develops.
As shown in Figure 62, fatigue testing under mode II loading conditions of the specimens showed that with greater z-Pin volume content, the delamination fatigue resistance increased, until reaching the threshold of 2.0 vol% content, after which no further significant increase was noted. At 4.0 vol% z-Pin volume content, the fatigue mechanism transitioned from a single crack to multiple cracks propagation. A linear correlation between increasing z-Pin content and cyclic stress intensity value for mode II crack initiation was observed. In the fatigue testing of varying diameter z-Pins, it was shown that the thick z-Pins are more effective in delamination growth resistance under fatigue than the thin z-Pins.
Under mode II fatigue loading, the z-Pins that were ruptured at the end of the bridging zone continued to provide fatigue resistance by generating bridging traction loads dissipating energy.
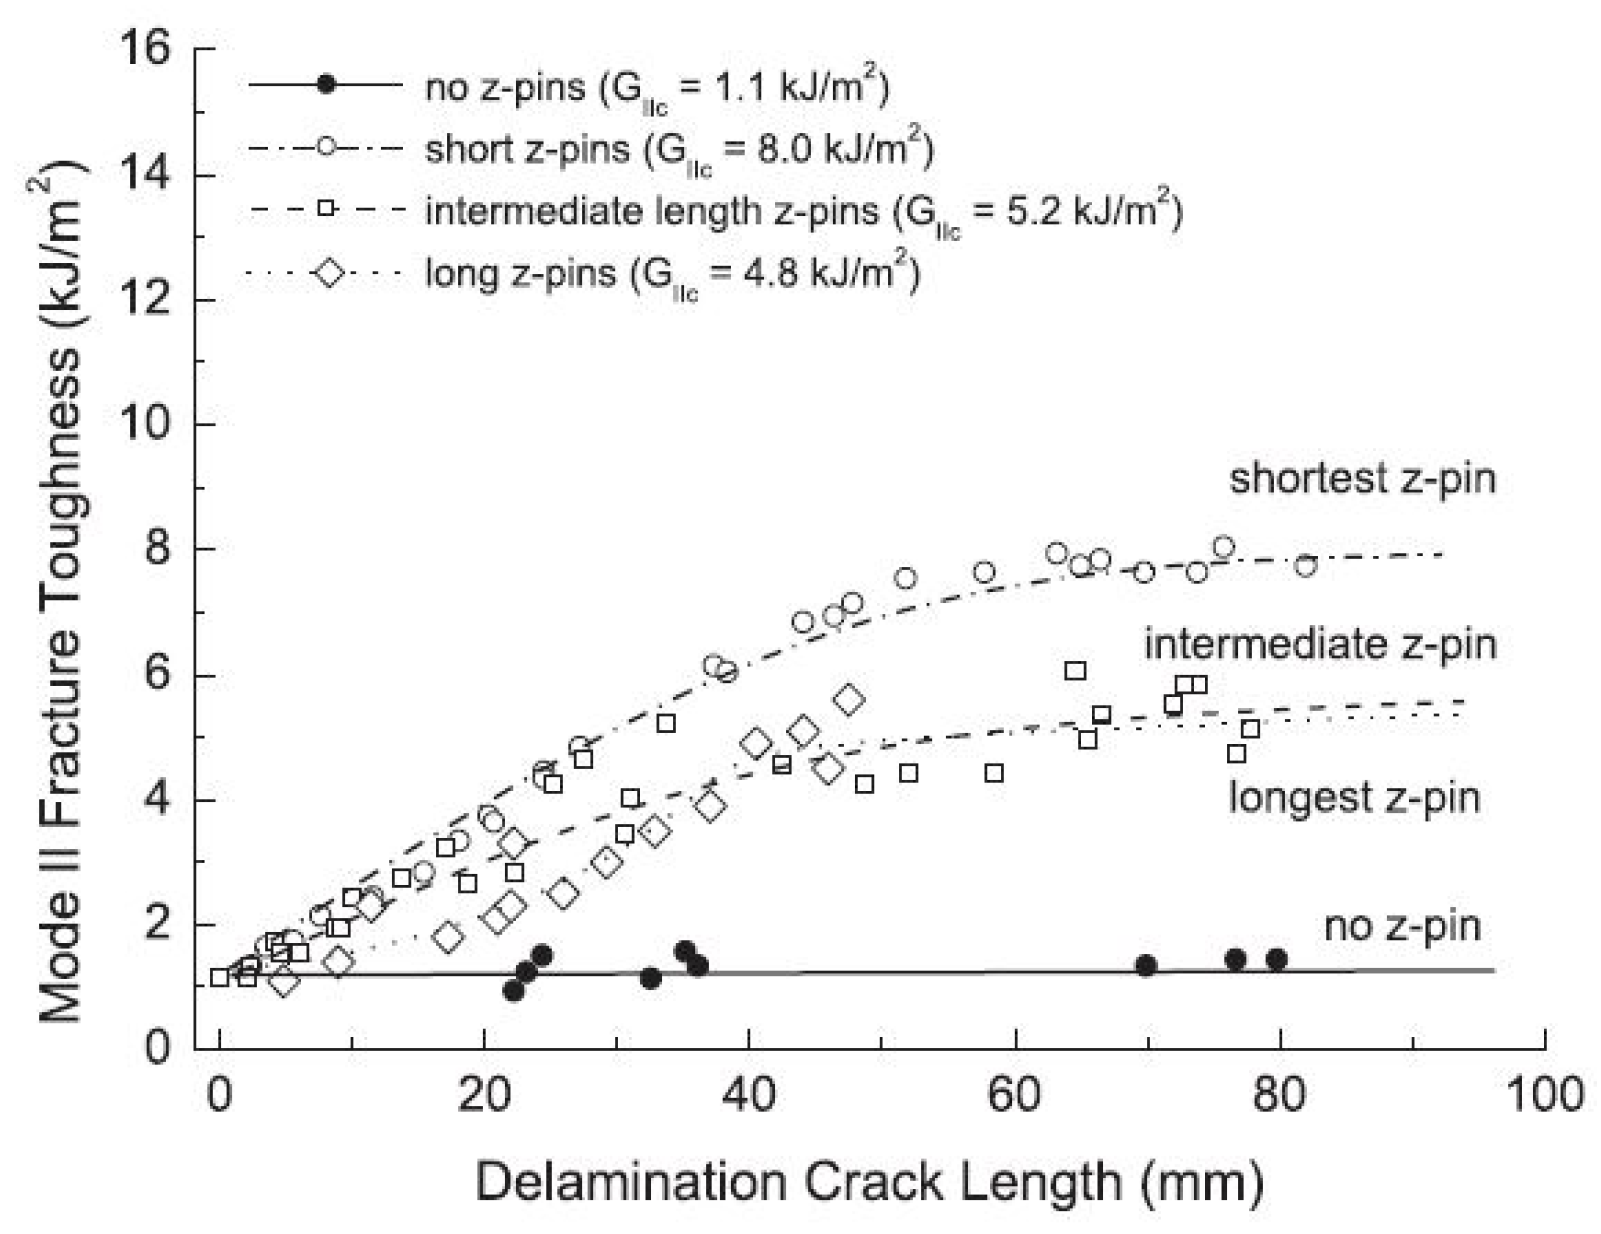
In 2015, Mouritz et al. [32] tested the effect of z-Pin embedment on mode I and II delamination resistance. Experiments on mode II fracture toughness showed that the increasein z-Pin embedment reduces the fracture toughness, as shown in Figure 63. This was the result of the change of z-Pin failure mechanism from pull-out for short z-Pins to shear rupture for longer z-Pins. Fatigue testing displayed that shorter z-Pins also provide better fatigue delamination resistance than the longer ones, following the same failure mechanism as shown in the case of static tests.
In 2016, M’membe et al. [17] performed quasi-static mode II fracture toughness tests on z-Pinned specimens in order to observe the impact of z-Pin offset angle on the toughening effect. As shown in Figure 64, z-Pins inclined with the nap (45°) greatly increased the mode II apparent fracture toughness through the development of the bridging zone. However, the bridging zone was never fully developed in these tests. On the other hand, z-Pins inclined against the nap (−45°) resulted in unstable crack propagation and brittle failure of the specimens, thus producing inconclusive results.
Specimens with z-Pins inclined both against and with the nap (±45°) resulted in an increase in apparent fracture toughness greater than the fracture toughness demonstrated by the same volume content of z-Pins placed normal to the specimen direction [17]. From these results it can be concluded that z-Pins enhance the laminate properties more effectively when they are inclined in an angle that is close to the loading vector.
In 2012, Bianchi et al. [23] modeled the z-Pins in the case of an ENF specimen under mode II loading, in two distinctive ways: (a) as a nonlinear spring element following a user-defined force-displacement material model response and (b) as cohesive elements governed by a bilinear response. Both models displayed similar results following the trend of the experiment, with the cohesive model predicting a little higher force and shorter crack extension, however, needing much less computational time, as shown in Figure 65.
5.2.3. Mixed Mode
In 2011, Cui et al. [25] performed numerical model analysis under mixed mode loading of z-Pinned composites. They showed that the response is heavily dependent upon the mode II debonding toughness of the laminate (GIIC) and the residual thermal stress of the z-Pin interface (σT). In a mixicity mode ratio (of mode I/II) of 1.00, an increase in both afore-mentioned parameters also increases the energy required for complete debonding of the z-Pin. In addition, it was shown that a low mixicity mode ratio (mode II dominated) will lead to the splitting of a fibrous z-Pin in many thin beams, due to the high shear stresses generated.
Considering the bridging response of a number of different mode mixicity ratios, it was concluded that the bridging force in the shear direction increases with increasing mode mixicity ratio, while the bridging force in the normal direction is slightly reduced. However, it was noted that after z-Pin debonding, the bridging force in the normal direction is not reduced as in a pure mode I case, an effect that could be attributed to snubbing.
Analysis of the effect of different lay-up in mixed mode loading of z-Pinned laminates showed that z-Pinning is more effective in multi-directional laminates than in unidirectional ones at mode II and mixed mode loading.
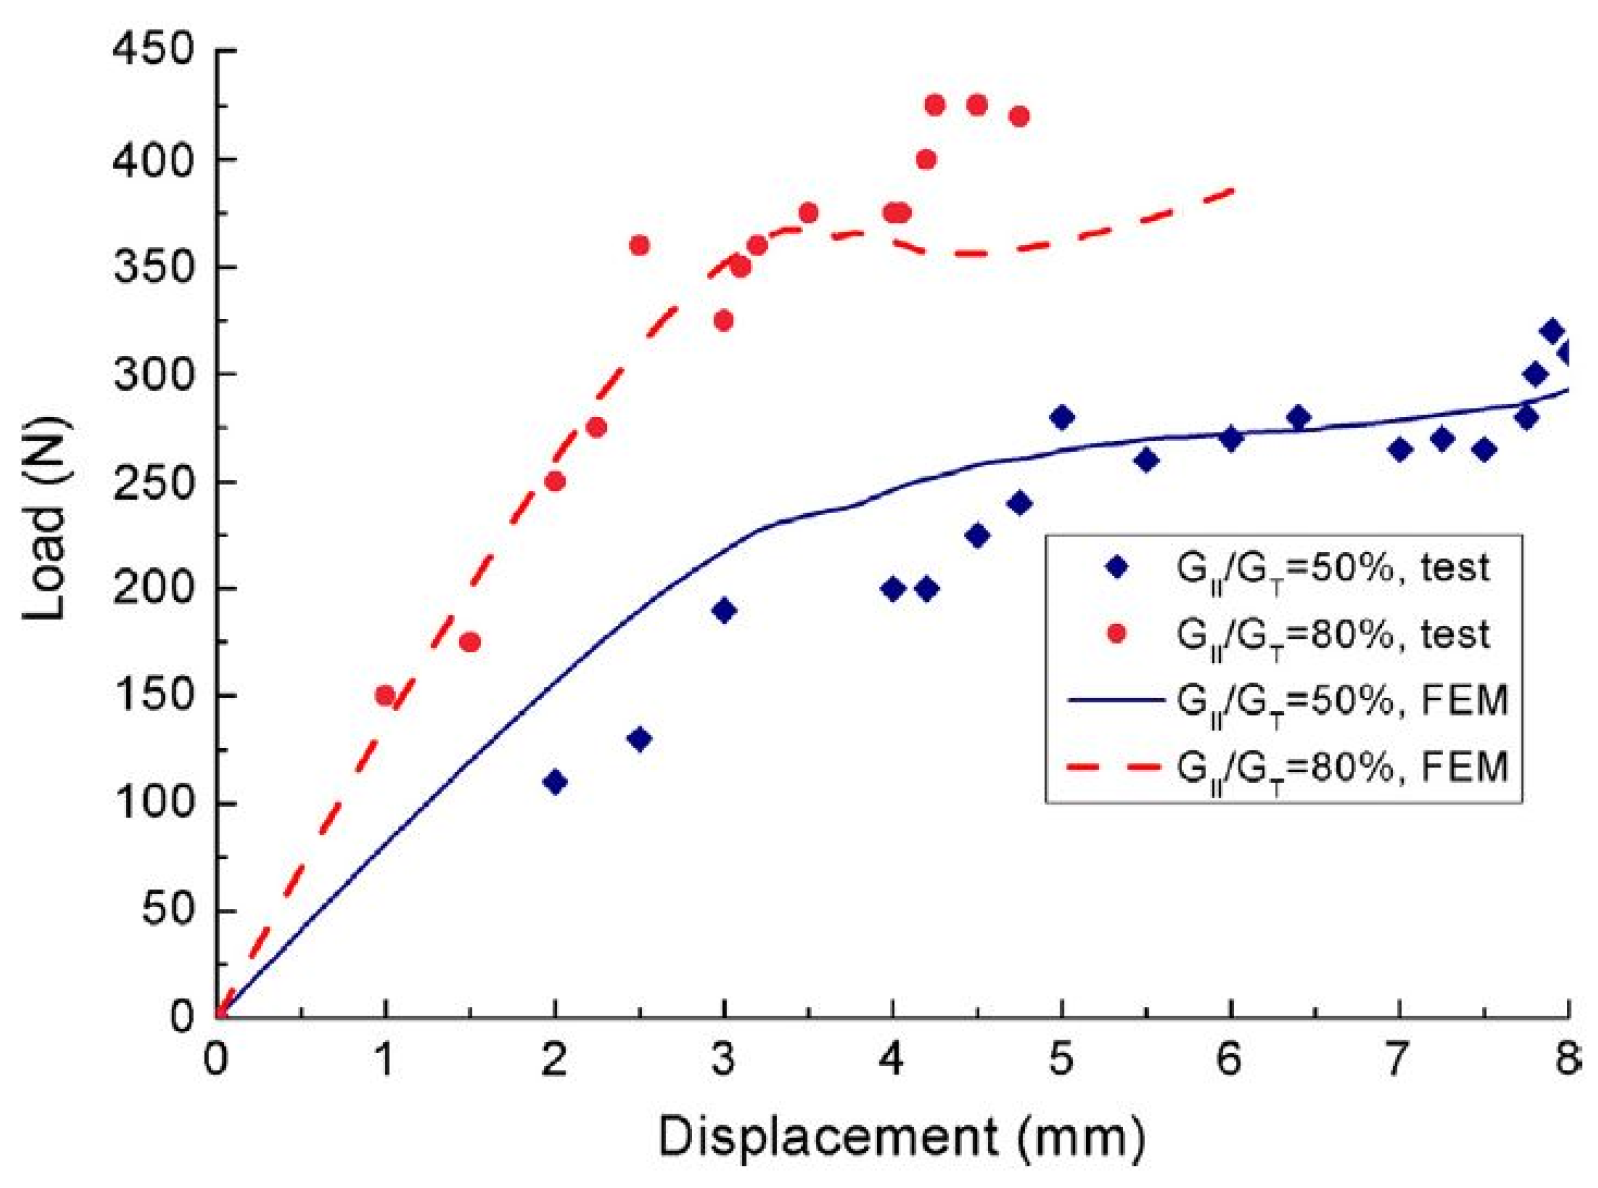
In 2013, Cui et al. [30] developed a novel cohesive law for z-Pinned laminates in mixed mode loading that incorporates two different bilinear cohesive laws, one for the mode I and one for mode II response, to represent the z-Pin in the numerical model. The results display a good correlation between the experimental data and the simulation, as shown in Figure 66 and Figure 67, except in the case of mode II dominated mixed mode loading for large displacement. It is observed that both cohesive elements used for the z-Pin response suffer initiation of damage simultaneously.
The mode I and II and mixed-mode delamination under high loading rate for both unpinned and Z-pinned coupons to study the effect of rate of loading was investigated by H. Cui et al. [49,50] It was shown that the Z-pin effectiveness in dynamic tests is lower than that in quasi-static tests and the difference was more significant whenever mode I delamination prevails than that where mode II is the dominant case.
5.3. Hygrothermal Response
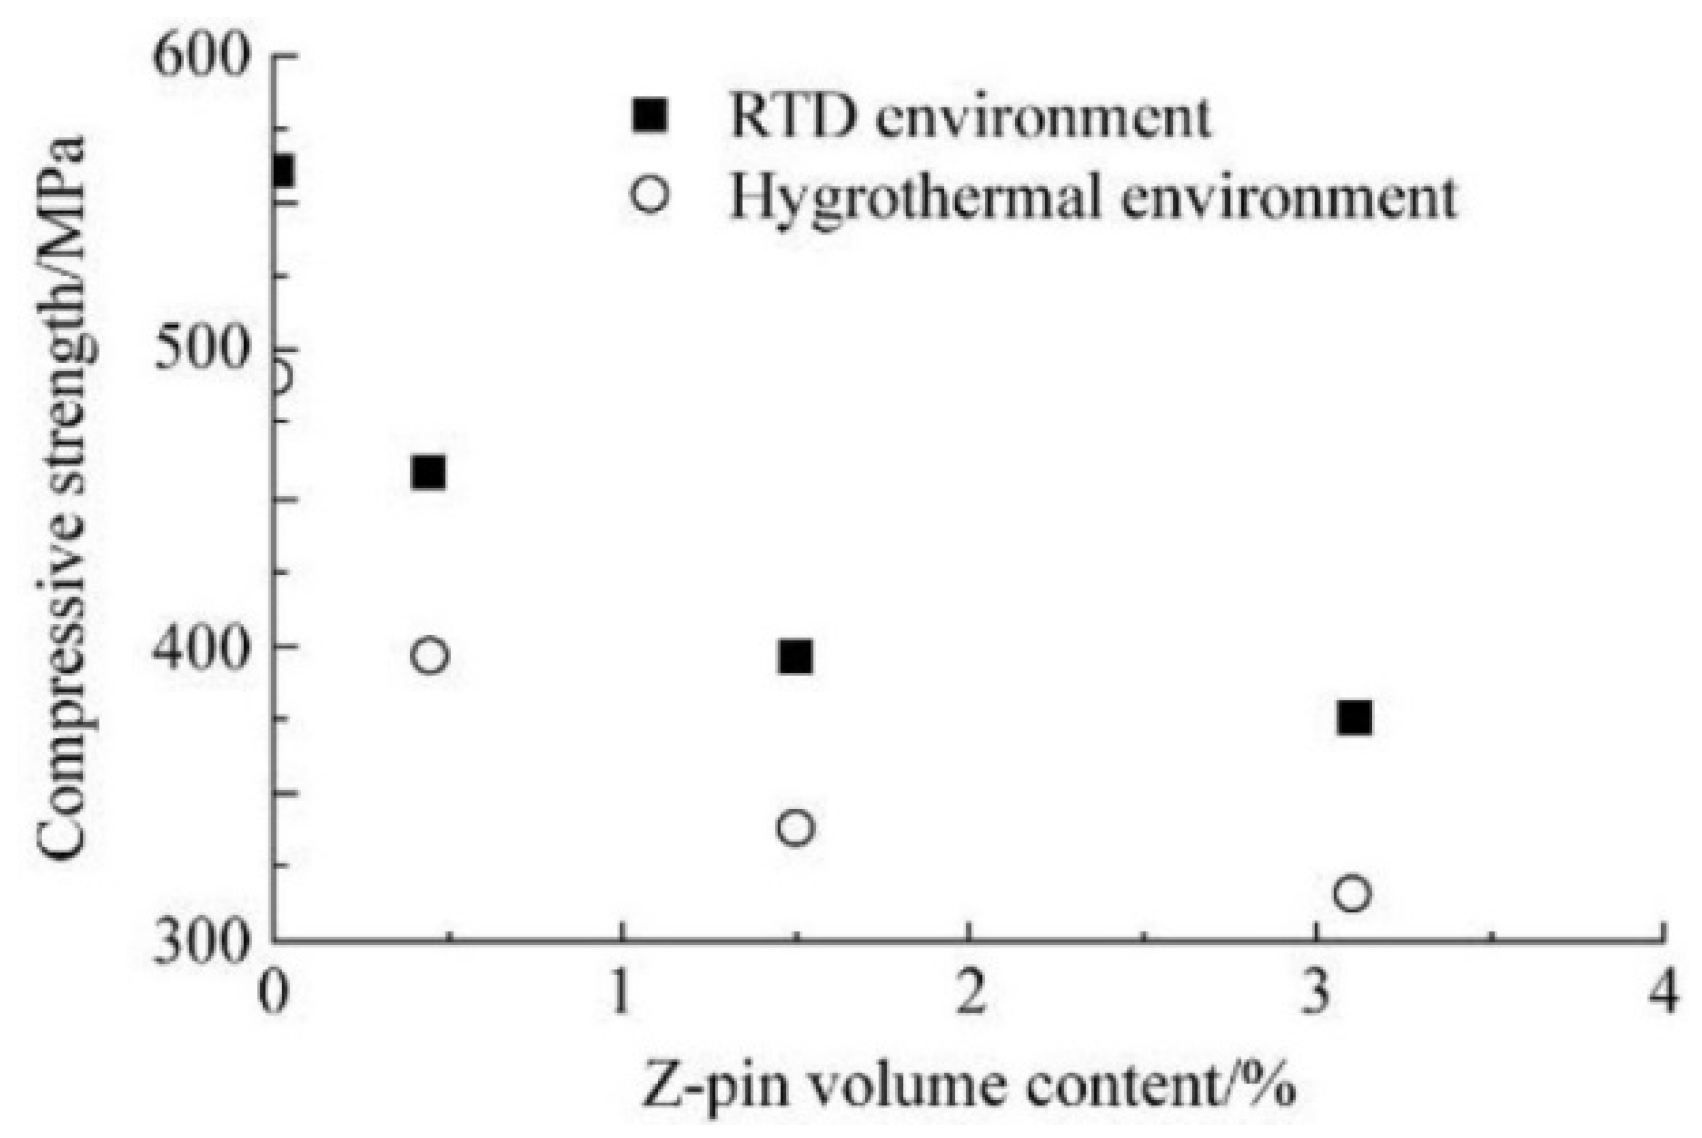
In 2011, Chenghua et al. [42] performed a study of z-Pinned laminates in room temperature and dry (RTD) and hygrothermal environments (75 °C immersed in water). It was concluded that z-Pinning increases the moisture absorption ratio for all laminates and it was dependent on the laminate lay-up, as shown in Figure 68. The increase in moisture absorption is attributed to the interface cracks between the z-Pins and the laminate, due to the mismatch of the coefficients of expansion. A methodology to prevent this is, after the z-Pinning procedure, to add an additional ply on each end of the laminate prior to curing. The results show that with increasing z-Pin content, the compressive strength of quasi-isotropic laminates is reduced in a non-linear trend for both RTD and hygrothermal environments, as shown in Figure 69.
In 2013, Mouritz [24] showed that hot-wet conditioning (70 °C and 85% humid) degraded the z-Pinned composite’s mode I interlaminar fracture toughness over time, as shown in Figure 70.
Furthermore, in both low-energy (12J) and high-energy (24J) impact, the hot-wet conditioned z-Pinned composite, exhibited less damage than the unpinned control specimens, as also shown for the high-energy only in Figure 71. Specifically, the z-Pinned specimens retained their impact resistance after hot-wet conditioning, while the unpinned specimens’ impact resistance degraded over hot-wet exposure time.
5.4. Impact Toughness
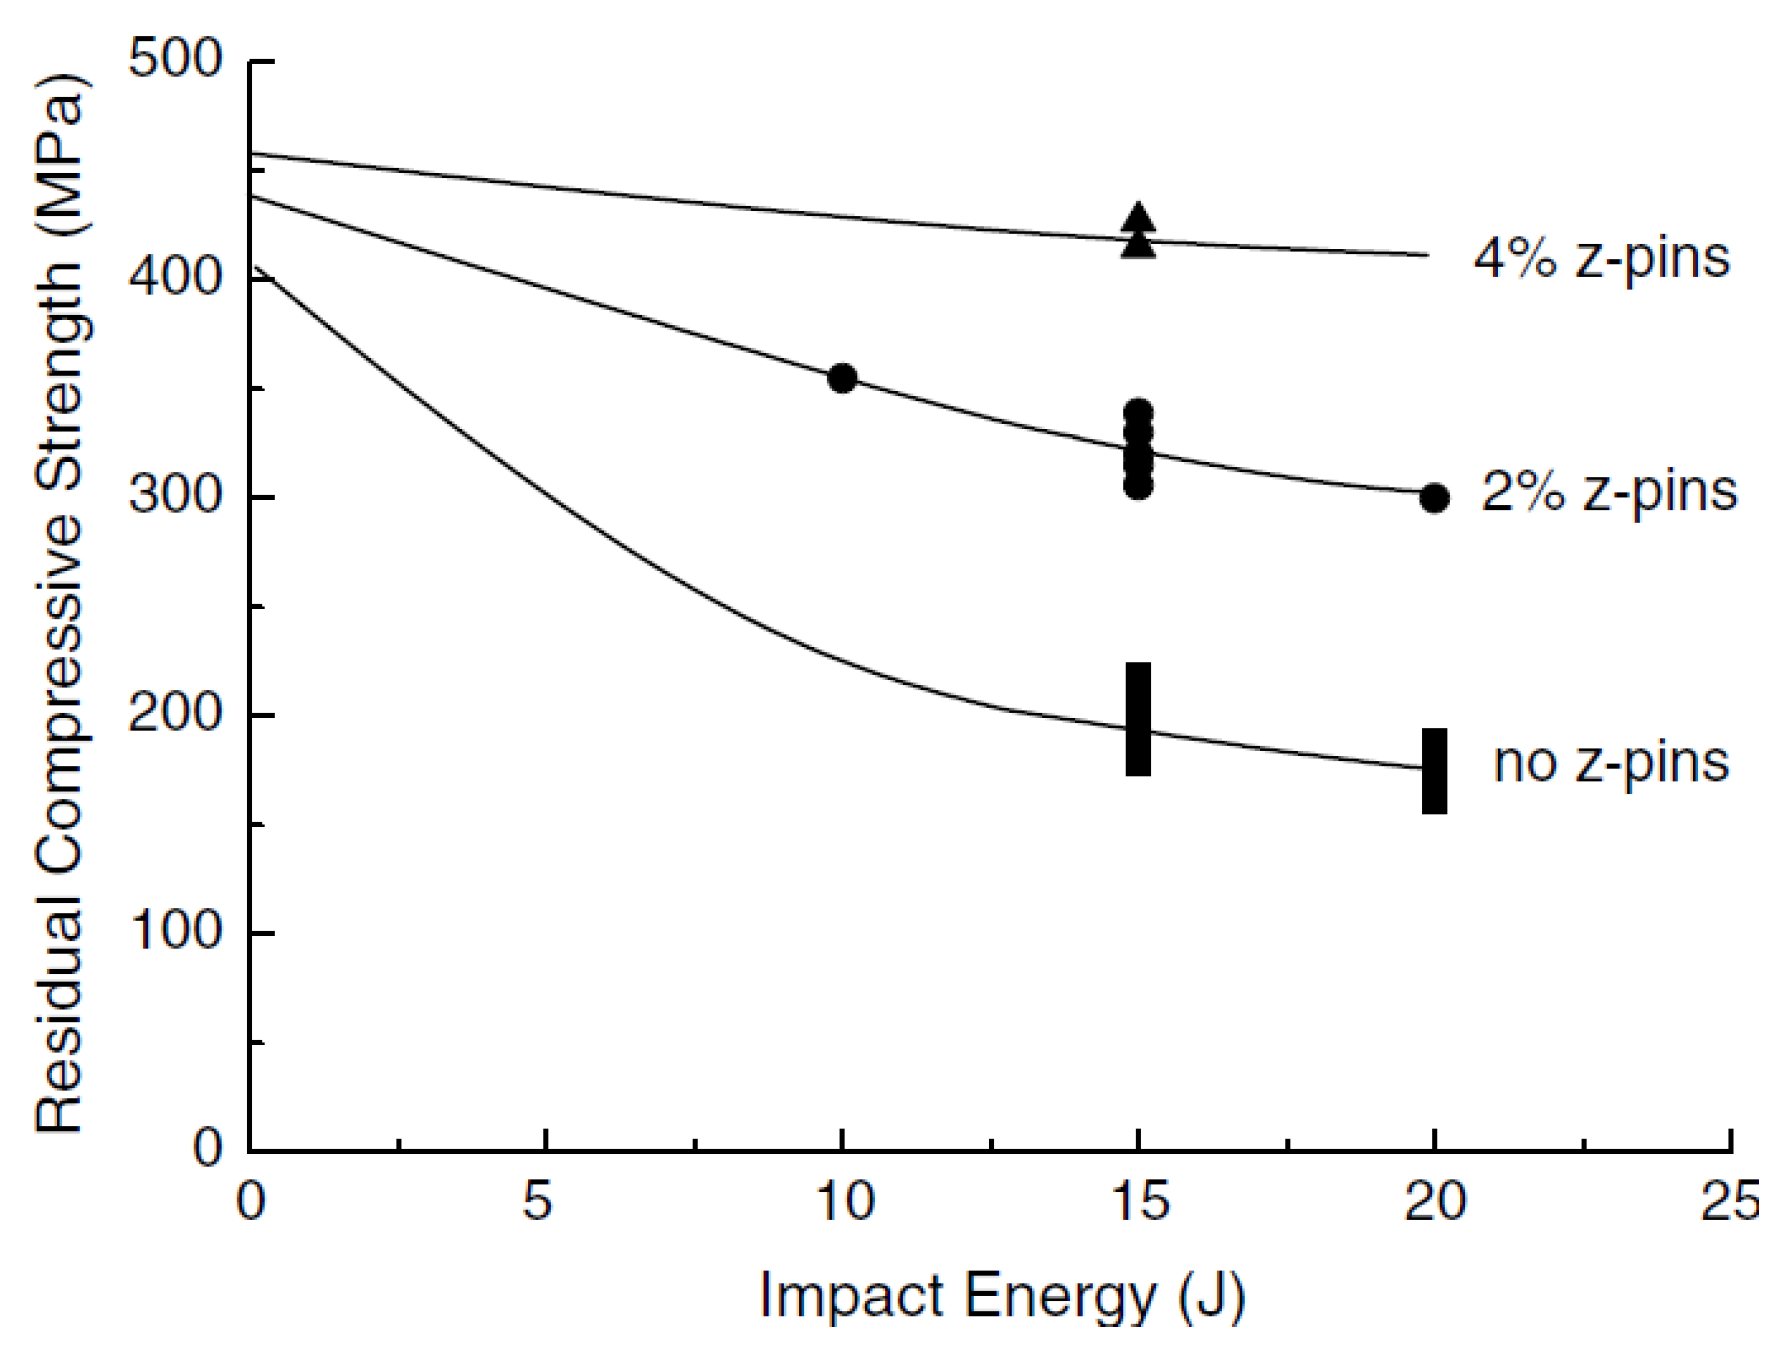
It has been proven that z-Pinning increases the damage resistance of a laminate composite under impact but only in high energy events at which the delamination is large enough for the bridging zone to develop [1,7]. Thus, z-Pinning does not increase the initial delamination threshold [1]. The higher the z-Pin volume content is, the greater the post-impact compressive strength of the laminate, as shown in the Figure 72 [1].
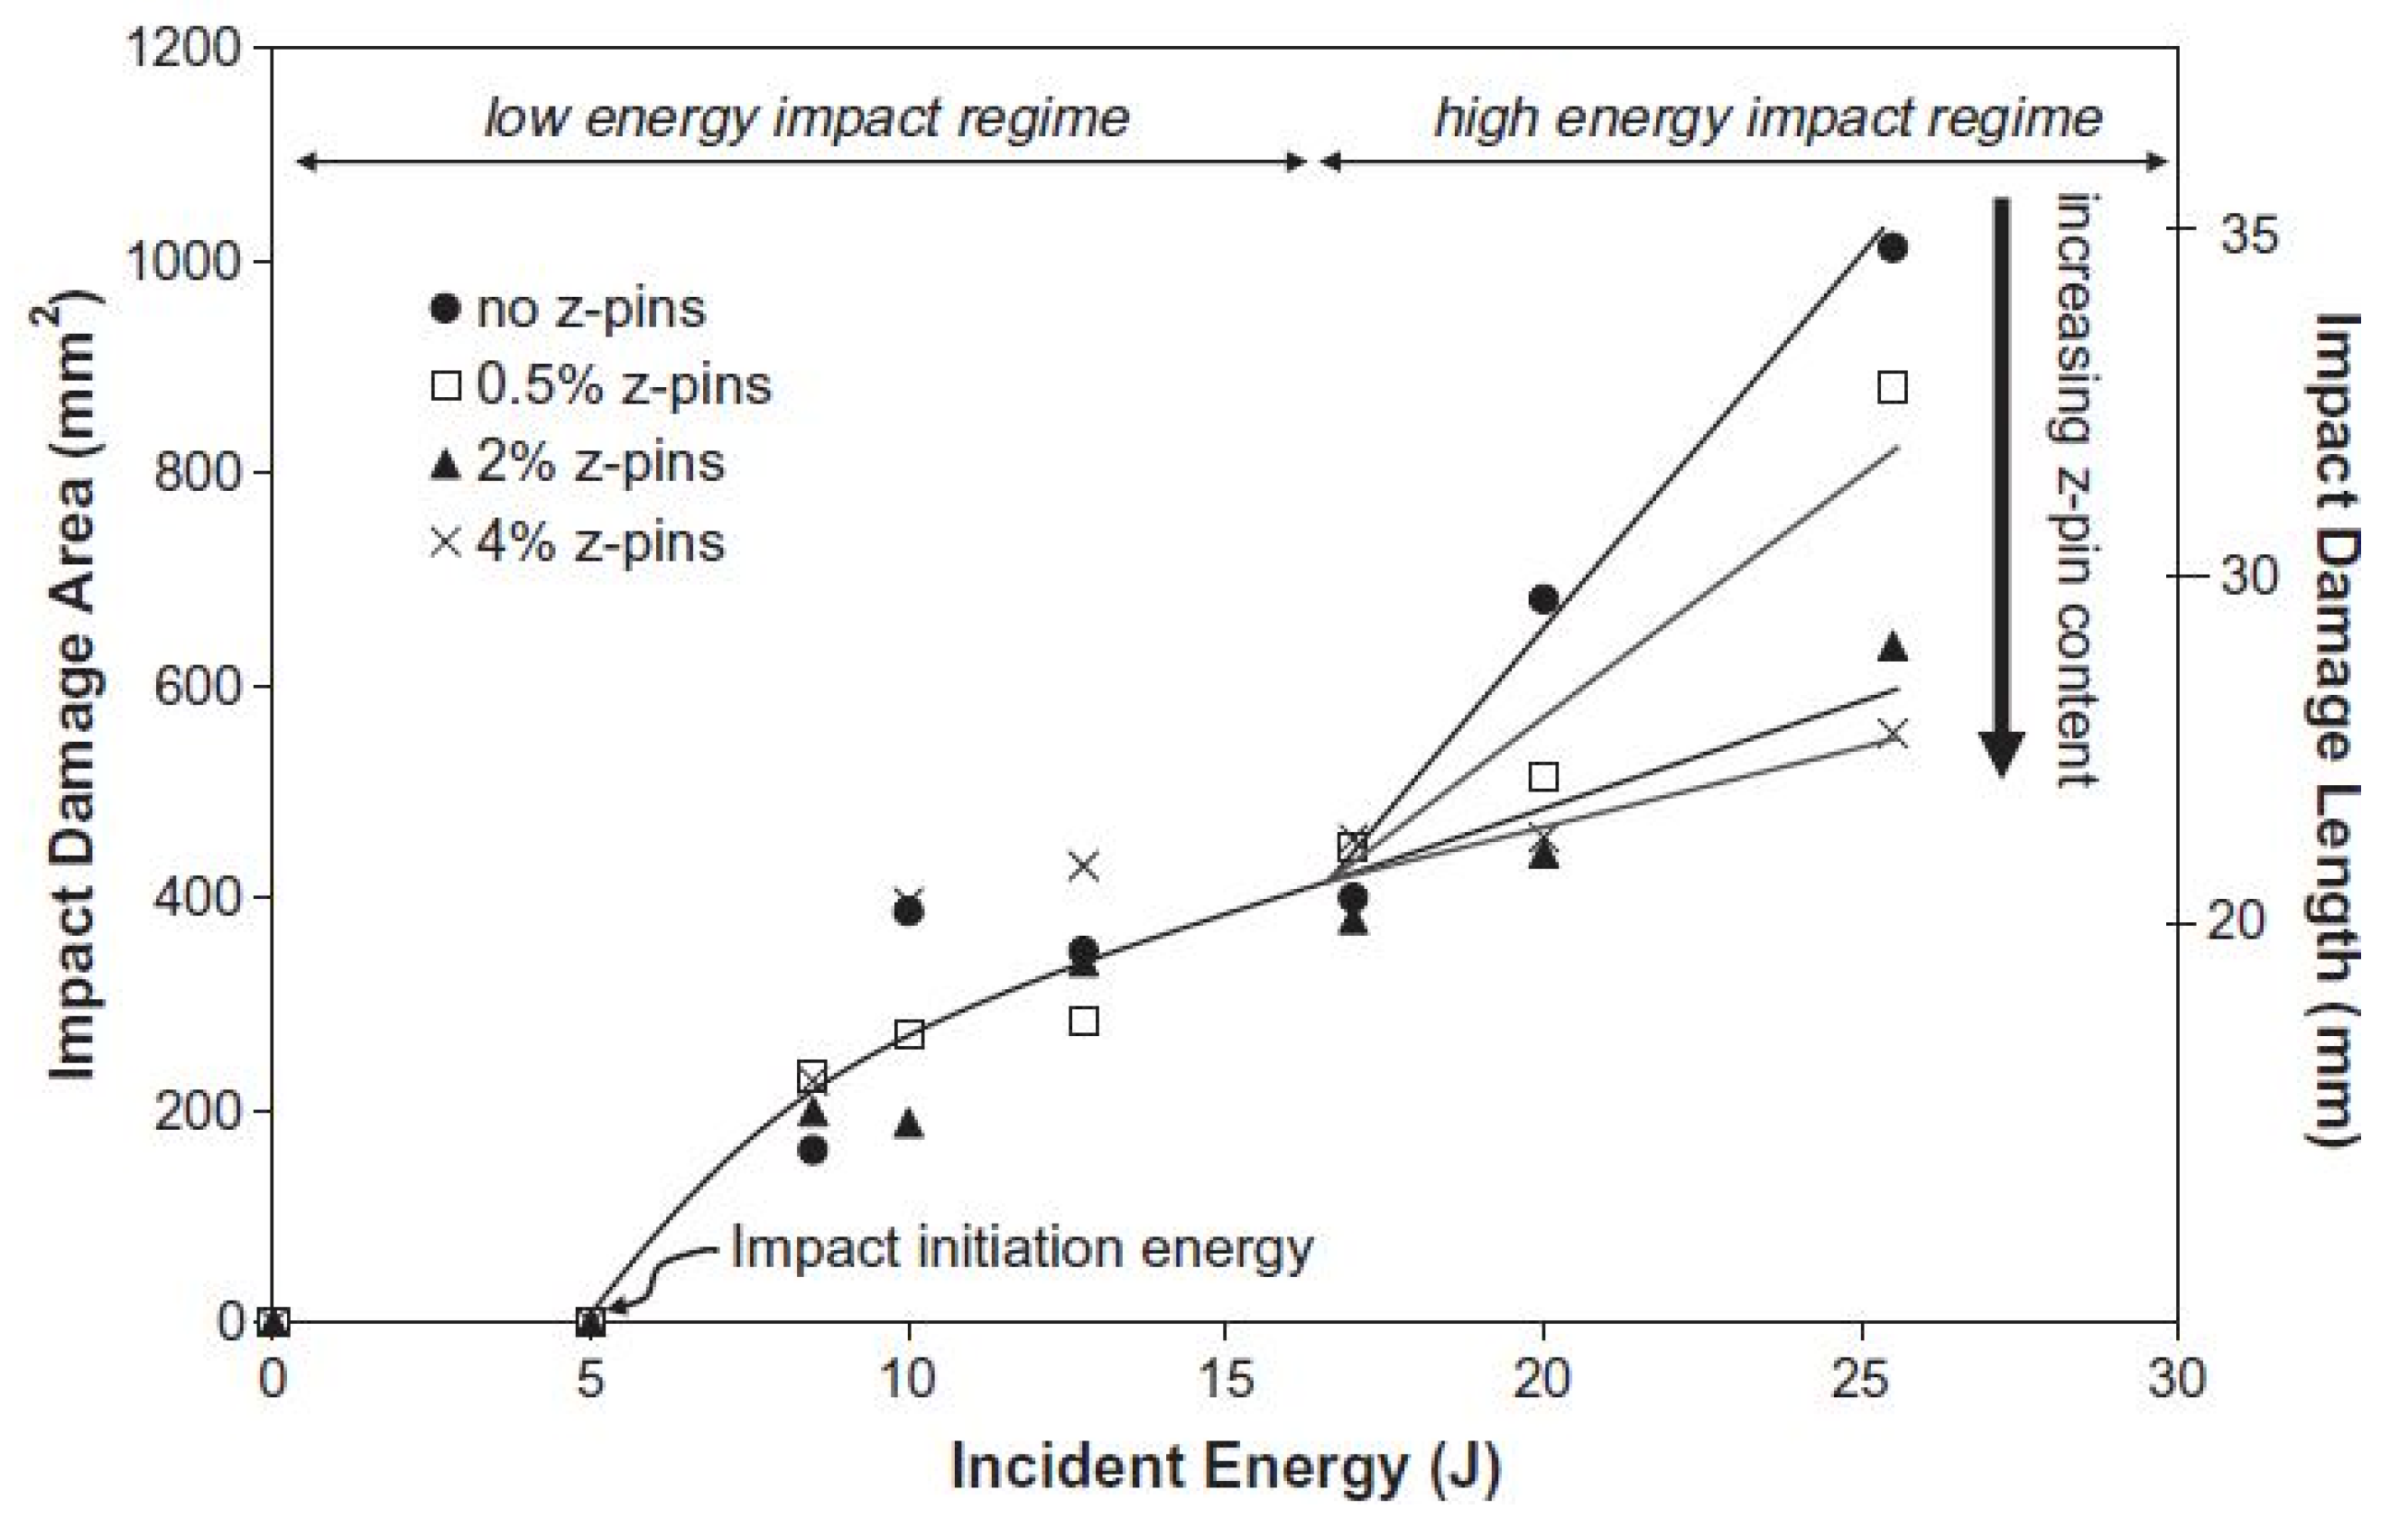
In 2011, Mouritz et al. [7] showed experimentally at various impact energy levels that z-Pinning reduces the damage area of the composite only in the case of high energy impact events. As shown in Figure 73, at low energy impact levels z-Pinning does not reduce the impact damage area. However, above the threshold of 17J impact energy, where the shift to the high-energy levels occurs, z-Pinning significantly reduces the impact damage area with increasing z-Pin content, up to a threshold at 2.0 vol%, after which there is no further improvement.
z-Pins offer impact damage resistance solely in the high energy regime, since delamination is required to occur for unfolding their main strengthening mechanism. In addition, micromechanical analysis shows that the energy needed for a delamination crack to grow is lower than the energy needed to elastically deform, debond and pull-out the z-Pins for the formation of a bridging zone. Compression after high energy impact experiments displayed a loss of post-impact modulus and an increase in post-impact strength with increasing z-Pin content, as shown in Figure 74. As expected, the reduced delamination area and the increased resistance to delamination growth of Z-pinned laminates leads to the improvement in the compression after impact strength [51].
From the study, the post low-energy impact S–N curve does not show an increase in fatigue properties of the z-Pinned composite [7]. On the other hand, the post high-energy impact S–N curve displays an increase in fatigue life and strength with increasing z-Pin volume content [7]. It is noted that the improvement of fatigue properties in the case of high energy impact is not attributed to a change in the fatigue process, but to a reduction in the impact’s initial damage of the laminate.
5.5. Behavior of T-joints with low Z-pin
In a recent study of M. Li et al. [52] investigated the reinforcing capacities of Z-pins in improving the tensile performance of T-joints. Among others the influence of the distance of Z-pin to the symmetry plane of the T-joint, Z-pin spacing, and Z-pin diameter was examined. It was found that Z-Pining may improve the maximum load capacity of T-joint by up to 45%. In parallel, the initial load drop of the Z-pinned T-joint samples was smoother compared to that of unpinned samples. Furthermore, the tensile performance of the Z-pinned T-joint was closely connected to the distance of the Z-Pin to the symmetry plane of the T-joint and Z-pin diameter, while it was independent of the Z-Pin spacing. Finally, the tensile performance of the T-joints with Z-Pin diameter of 0.5 mm was much higher to that with a diameter of 0.3 mm in terms of peak load, initial load drop, maximum deformation. In conclusion, bigger Z-Pin diameters should be used in the reinforcing of T-joints.
6. Conclusions
For many years, the effects of z-Pinning on the properties of composite laminates have been investigated. Even though the effects on the out-of-plane and in-plane macroscopic properties were well-known, the microscopic response of the z-Pin and the detailed microstructure mechanisms at work for each loading case had not been extensively investigated until recent years.
It should be noted that all research on z-Pinned laminates was performed with mostly CFRP z-Pins of thin rod geometry and constant diameter and shape. Although a substantial number of research papers have been published on laminates reinforced with metal z-pins (e.g., titanium, steel), and good improvements to the interlaminar fracture toughness have been achieved, the present work is mainly focused on CFRP z-Pins that minimize the induced thermal stresses.
In addition, an important note that requires being made is on the researching method of z-Pin density and diameter parameter effects. Two different approaches were made when testing the effect of diameter: (a) keeping the number of z-Pins constant and (b) keeping the z-Pin density constant. From the primary approach, it is derived that increasing the z-Pin diameter while keeping the number of z-Pins constant leads to greater z-Pin density in the composite laminate. In the secondary approach, keeping constant the z-Pin density leads to greater number of z-Pins for smaller diameter z-Pins and a lower number for greater diameter ones. Thus, some conflicting data and results concerning the z-Pin diameter between studies are explained.
To summarize, the main advantages of z-Pinning include improved delamination resistance in both modes I and II, damage tolerance in high impact loads and increased stiffness and strength in the out-of-plane direction. On the other hand, the main disadvantages of z-Pinning included degrading of the in-plane properties, like stiffness and strength in both static and fatigue loads. Both the advantages and disadvantages are directly dependable on the z-Pin density of the pins, the diameter, the embedment depth and the offset angle. For a specific increase in out-of-plane properties, a proportional decrease in the in-plane properties is observed.
As the microscopic behavior of z-Pin was researched in recent years, the individual mechanisms at work during a z-Pin loading were observed and quantified, and their impact on the macroscopic behavior of the composite laminate was registered. These mechanisms include elastic deformation, debonding, frictional sliding, axial fracture, snubbing and pin splitting and are mostly affected by the angle at which the z-Pin is loaded.
In conclusion, z-Pinning exhibits more advantages than disadvantages for use in damage-tolerant structures. However, they face other through-the-thickness reinforcement techniques as stitching and 3D-weaved composite laminates, which in some cases exhibit better attributes compared to z-Pinning, by having less impact on the in-plane properties. Thus, z-Pinning is slowly being turned away from use in the total composite laminate and is being turned towards local use as in joints, where a huge interest has developed during the last few years for composite-composite joints in conjunction with adhesive joining.
Author Contributions
Conceptualization, V.K. and N.S.; methodology, V.K. and N.S.; investigation, V.K. and N.S.; resources, V.K. and N.S.; writing—original draft preparation, V.K. and N.S.; writing—review and editing, V.K., N.S. and S.T.; visualization, V.K., N.S. and S.T.; supervision, V.K. and S.T.; project administration, V.K. All authors have read and agreed to the published version of the manuscript.
Funding
This study has not been funded by any contributor.
Conflicts of Interest
The authors declare that they have no conflict of interest.
References
- Mouritz, A.P. Review of z-pinned composite laminates. Compos. Part A Appl. Sci. Manuf. 2007, 38, 2383–2397. [Google Scholar] [CrossRef]
- Nanayakkara, A.; Feih, S.; Mouritz, A.P. Experimental analysis of the through-thickness compression properties of z-pinned sandwich composites. Compos. Part A Appl. Sci. Manuf. 2011, 42, 1673–1680. [Google Scholar] [CrossRef]
- Parkes, P.N.; Butler, R.; Meyer, J.; De Oliveira, A. Static strength of metal-composite joints with penetrative reinforcement. Compos. Struct. 2014, 118, 250–256. [Google Scholar] [CrossRef] [Green Version]
- Li, N.; Chen, P.H.; Liu, X.Y.; Ma, W.; Wang, X.C. A micro-macro finite element model for failure prediction of ComeldTM joints. Compos. Sci. Technol. 2015, 117, 334–341. [Google Scholar] [CrossRef]
- Park, Y.-B.; Lee, B.-H.; Kweon, J.-H.; Choi, J.H.; Choi, I.H. The strength of composite bonded T-joints transversely reinforced by carbon pins. Compos. Struct. 2011, 94, 625–634. [Google Scholar] [CrossRef]
- Song, Q.; Li, Y.; Qi, J.; Wen, L.; Xiao, J.; Ni, J. Study on an automatic multi-pin insertion system for preparing Z-pin composite laminates. Chin. J. Aeronaut. 2013, 27, 413–419. [Google Scholar] [CrossRef] [Green Version]
- Isa, M.D.; Feih, S.; Mouritz, A.P. Compression fatigue properties of z-pinned quasi-isotropic carbon/epoxy laminate with barely visible impact damage. Compos. Struct. 2011, 93, 2269–2276. [Google Scholar] [CrossRef]
- Foster-Miller, Inc. Composite Structure Reinforcement. U.S. Patent 4,808,461, 28 February 1989. [Google Scholar]
- Dickinson, L.C.; Farley, G.L.; Hinders, M.K. Translaminar reinforced composites: A review. J. Compos. Technol. Res. 1999, 21, 3–15. [Google Scholar]
- Mukesh, V.; Jagannathan, N.; Gaddikeri, K.M.; Sundaram, R.; Bharath, T.; Manjunath, D.M. Development of z-pinning technique for laminated composites. In Proceedings of the 14th ISAMPE, Hyderabad, India, 22–23 January 2016. [Google Scholar]
- Chang, P.; Mouritz, A.P.; Cox, B.N. Properties and failure mechanisms of z-pinned laminates in monotonic and cyclic tension. Compos. Part A Appl. Sci. Manuf. 2006, 37, 1501–1513. [Google Scholar] [CrossRef]
- Allegri, G.; Yasaee, M.; Partridge, I.K.; Hallett, S.R. A novel model of delamination bridging via Z-pins in composite laminates. Int. J. Solids Struct. 2014, 51, 3314–3332. [Google Scholar] [CrossRef] [Green Version]
- Mouritz, A.P.; Koh, T.M. Re-evaluation of mode I bridging traction modelling for Z-pinned laminates based on experimental analysis. Compos. Part B Eng. 2013, 56, 797–807. [Google Scholar] [CrossRef]
- Sweeting, R.D.; Thomson, R.S. The effect of thermal mismatch on Z-pinned laminated composite structures. Compos. Struct. 2004, 66, 189–195. [Google Scholar] [CrossRef]
- Mouritz, A.P.; Cox, B.N. A mechanistic interpretation of the comparative in-plane mechanical properties of 3D woven, stitched and pinned composites. Compos. Part A Appl. Sci. Manuf. 2010, 41, 709–728. [Google Scholar] [CrossRef] [Green Version]
- Mouritz, A.P.; Chang, P. Tension fatigue of fibre-dominated and matrix-dominated laminates reinforced with Z-pins. Int. J. Fatigue 2009, 32, 650–658. [Google Scholar] [CrossRef]
- M’membe, B.; Gannon, S.; Yasaee, M.; Hallett, S.R.; Partridge, I.K. Mode II delamination resistance of composites reinforced with inclined Z-pins. Mater. Des. 2016, 94, 565–572. [Google Scholar] [CrossRef] [Green Version]
- Chang, P.; Mouritz, A.P.; Cox, B.N. Properties and failure mechanisms of pinned composite lap joints in monotonic and cyclic tension. Compos. Sci. Technol. 2006, 66, 2163–2176. [Google Scholar] [CrossRef]
- Tao, Y.; Jiao, G.; Wang, B.; Chang, Y. Effect of Z-pins’ diameter, spacing and overlap length on connecting performance of CMC single lap joint. Acta Mech. Solida Sin. 2008, 21, 461–471. [Google Scholar] [CrossRef]
- Cartie, D.R.; Gornet, L.; Ijaz, H. Inelastic interface damage modeling with friction effects: Application to Z-pinning reinforcement in carbon fiber epoxy matrix laminates. J. Compos. Mater. 2010, 44, 2067–2081. [Google Scholar]
- Bianchi, F.; Zhang, X. A cohesive zone model for predicting delamination suppression in Z-pinned laminates. Compos. Sci. Technol. 2011, 71, 1898–1907. [Google Scholar] [CrossRef] [Green Version]
- Vazquez, J.T.; Castanié, B.; Barrau, J.-J.; Swiergiel, N. Multi-level analysis of low-cost Z-pinned composite joints. Part 1: Single Z-pin behaviour. Compos. Part A Appl. Sci. Manuf. 2011, 42, 2070–2081. [Google Scholar] [CrossRef]
- Bianchi, F.; Zhang, X. Predicting mode-II delamination suppression in Z-pinned laminates. Compos. Sci. Technol. 2012, 72, 924–932. [Google Scholar] [CrossRef] [Green Version]
- Mouritz, A.P. Delamination properties of Z-pinned composites in hot-wet environment. Compos. Part A Appl. Sci. Manuf. 2013, 52, 134–142. [Google Scholar] [CrossRef]
- Cui, H.; Li, Y.; Koussios, S.; Zub, L.; Beukers, A. Bridging micromechanisms of Z-pin in mixed mode delamination. Compos. Struct. 2011, 93, 2685–2695. [Google Scholar] [CrossRef]
- Ucsnik, S.; Scheerer, M.; Zaremba, S.; Pahr, D.H. Experimental investigation of a novel hybrid metal-composite joining technology. Compos. Part A Appl. Sci. Manuf. 2009, 41, 369–374. [Google Scholar] [CrossRef]
- Pegorin, F.; Pingkarawat, K.; Daynes, S.; Mouritz, A.P. Mode II interlaminar fatigue properties of Z-pinned carbon fibre reinforced epoxy composites. Compos. Part A Appl. Sci. Manuf. 2014, 67, 8–15. [Google Scholar] [CrossRef]
- Legarth, B.N. Debonding analyses of closely spaced Z-pins bridging an unbonded interface. Mater. Des. 2009, 30, 3743–3751. [Google Scholar] [CrossRef]
- Zhang, B.; Allegri, G.; Yasaee, M.; Hallett, S.R. Micro-mechanical finite element analysis of Z-pins under mixed-mode loading. Compos. Part A Appl. Sci. Manuf. 2015, 78, 424–435. [Google Scholar] [CrossRef]
- Cui, H.; Li, Y.; Koussios, S.; Beukers, A. Mixed mode cohesive law for Z-pinned composite analyses. Comput. Mater. Sci. 2013, 75, 60–68. [Google Scholar] [CrossRef]
- Yasaee, M.; Lander, J.K.; Allegri, G.; Hallett, S.R. Experimental characterisation of mixed mode traction-displacement relationships for a single carbon composite Z-pin. Compos. Sci. Technol. 2014, 94, 123–131. [Google Scholar] [CrossRef] [Green Version]
- Pegorin, F.; Pingkarawat, K.; Daynes, S.; Mouritz, A.P. Influence of z-pin length on the delamination fracture toughness and fatigue resistance of pinned composites. Compos. Part B Eng. 2015, 78, 298–307. [Google Scholar] [CrossRef]
- Pingkarawat, K.; Mouritz, A.P. Improving the mode I delamination fatigue resistance of composites using z-pins. Compos. Sci. Technol. 2013, 92, 70–76. [Google Scholar] [CrossRef]
- Son, H.-G.; Park, Y.-B.; Kweon, J.-H.; Choi, J.-H. Fatigue behaviour of metal pin-reinforced composite single-lap joints in a hygrothermal environment. Compos. Struct. 2013, 108, 151–160. [Google Scholar] [CrossRef]
- Ko, M.-G.; Kweon, J.-H.; Choi, J.-H. Fatigue characteristics of jagged pin-reinforced composite single-lap joints in hygrothermal environments. Compos. Struct. 2014, 119, 59–66. [Google Scholar] [CrossRef]
- Zhang, A.-Y.; Liu, H.-Y.; Mouritz, A.P.; Mai, Y.-W. Experimental study and computer simulation on degradation of Z-pin reinforcement under cyclic fatigue. Compos. Part A Appl. Sci. Manuf. 2007, 39, 406–414. [Google Scholar] [CrossRef]
- Pingkarawat, K.; Mouritz, A.P. Comparative study of metal and composite z-pins for delamination fracture and fatigue strengthening of composites. Eng. Fract. Mech. 2016, 154, 180–190. [Google Scholar] [CrossRef]
- Mouritz, A.P. Environmental durability of Z-pinned carbon fibre-epoxy laminate exposed to water. Compos. Sci. Technol. 2012, 72, 1568–1574. [Google Scholar] [CrossRef] [Green Version]
- Mouritz, A.P. Compression properties of Z-pinned composite laminates. Compos. Sci. Technol. 2007, 67, 3110–3120. [Google Scholar] [CrossRef]
- Mouritz, A.P. Tensile fatigue properties of 3D composites with through-thickness reinforcement. Compos. Sci. Technol. 2008, 68, 2503–2510. [Google Scholar] [CrossRef]
- Chun, H.-J.; Son, J.; Kang, K.-T.; Byun, J.-H.; Umb, M.-K.; Lee, S.-K. Prediction of elastic properties for woven Z-pinned composites. Compos. Part B Eng. 2014, 64, 59–71. [Google Scholar] [CrossRef]
- Li, C.; Yan, Y.; Wang, P.; Qi, D.; Wen, Y. Study on compressive properties of z-pinned laminates in RTD and hygrothermal environment. Chin. J. Aeronaut. 2011, 25, 64–70. [Google Scholar] [CrossRef] [Green Version]
- Huang, H.J.; Waas, A.M. Modeling and predicting the compression strength limiting mechanisms in Z-pinned textile composites. Compos. Part B Eng. 2009, 40, 530–539. [Google Scholar] [CrossRef]
- Huang, H.; Waas, A.M. Compressive response of Z-pinned woven glass fiber textile composite laminates: Experiments. Compos. Sci. Technol. 2008, 69, 2331–2337. [Google Scholar] [CrossRef]
- Huang, H.; Waas, A.M. Compressive response of Z-pinned woven glass fiber textile composite laminates: Modeling and computations. Compos. Sci. Technol. 2009, 69, 2338–2344. [Google Scholar] [CrossRef]
- Hoffmann, J.; Scharr, G. Compression properties of composite laminates reinforced with rectangular Z-pins. Compos. Sci. Technol. 2018, 167, 463–469. [Google Scholar] [CrossRef]
- Song, M.C.; Sankar, B.V.; Subhash, G.; Yen, C.F. Analysis of mode I delamination of z-pinned composites using a non-dimensional analytical model. Compos. Part B Eng. 2012, 43, 1776–1784. [Google Scholar] [CrossRef]
- Huang, H.S.; Waas, A.M. Quasi-static mode II fracture tests and simulations of Z-pinned woven composites. Eng. Fract. Mech. 2014, 126, 155–165. [Google Scholar] [CrossRef]
- Cui, H.; Yasaee, M.; Hallett, S.R.; Partridge, I.K.; Allegri, G.; Petrinic, N. Dynamic bridging mechanisms of through-thickness reinforced composite laminates in mixed mode delamination. Compos. Part A Appl. Sci. Manuf. 2018, 106, 24–33. [Google Scholar] [CrossRef] [Green Version]
- Cui, H.; Mahadik, Y.; Hallett, S.R.; Partridge, I.K.; Allegri, G.; Ponnusami, S.A.; Petrinic, N. Coupon scale Z-pinned IM7/8552 delamination tests under dynamic loading. Compos. Part A Appl. Sci. Manuf. 2019, 125, 105565. [Google Scholar] [CrossRef]
- Francesconi, L.; Aymerich, F. Effect of Z-pinning on the impact resistance of composite laminates with different layups. Compos. Part A Appl. Sci. Manuf. 2018, 114, 136–148. [Google Scholar] [CrossRef]
- Li, M.; Chen, P.; Li, X.; Gong, N. Experimental and numerical study on the tensile properties of T-joints with low Z-pin volume density. Polymer Composites 2020, 41. [Google Scholar] [CrossRef]
Figure 1.
(a) Hand-held ultrasonic horn and (b) collapsible foam carrier containing z-Pins [1].
Figure 1.
(a) Hand-held ultrasonic horn and (b) collapsible foam carrier containing z-Pins [1].

Figure 2.
Schematic of the UAZ® process [11].
Figure 2.
Schematic of the UAZ® process [11].

Figure 3.
Region of wavy fibers and resin-rich zones at a z-Pin [1].
Figure 3.
Region of wavy fibers and resin-rich zones at a z-Pin [1].

Figure 4.
Plot of z-Pin diameter on the deflection angle and length of wavy region in a unidirectional carbon/epoxy composite [1].
Figure 4.
Plot of z-Pin diameter on the deflection angle and length of wavy region in a unidirectional carbon/epoxy composite [1].

Figure 5.
Resin channel along a row of closely spaced z-Pins [11].
Figure 5.
Resin channel along a row of closely spaced z-Pins [11].

Figure 6.
Debonding of a fibrous z-Pin due to residual stresses in the host composite [14].
Figure 6.
Debonding of a fibrous z-Pin due to residual stresses in the host composite [14].

Figure 7.
Effect of z-Pin content on the percentage reduction in fiber volume content of a unidirectional carbon-epoxy. The preform was either constrained or not constrained during the pinning process [15].
Figure 7.
Effect of z-Pin content on the percentage reduction in fiber volume content of a unidirectional carbon-epoxy. The preform was either constrained or not constrained during the pinning process [15].

Figure 8.
Fiber crimp and z-Pin offset angle (defined as φ) [18].
Figure 8.
Fiber crimp and z-Pin offset angle (defined as φ) [18].

Figure 9.
Distribution plot of percentage of z-Pins inclined at various angles from the orthogonal direction (defined as θ / θ = 0°) [11].
Figure 9.
Distribution plot of percentage of z-Pins inclined at various angles from the orthogonal direction (defined as θ / θ = 0°) [11].

Figure 10.
Effect of z-Pin offset angle on fiber waviness, length and width of the resin rich zone [17].
Figure 10.
Effect of z-Pin offset angle on fiber waviness, length and width of the resin rich zone [17].

Figure 11.
Resin rich zone of z-Pin inserted in quasi-isotropic laminate (left to right): (a) 0° offset z-Pin, (b) 45° inclined z-Pin on a 0° ply and (c) 45° inclined z-Pin on a 90° ply [17].
Figure 11.
Resin rich zone of z-Pin inserted in quasi-isotropic laminate (left to right): (a) 0° offset z-Pin, (b) 45° inclined z-Pin on a 0° ply and (c) 45° inclined z-Pin on a 90° ply [17].

Figure 12.
(a) Tri-linear z-Pin response and (b) bi-linear z-Pin response [21].
Figure 12.
(a) Tri-linear z-Pin response and (b) bi-linear z-Pin response [21].

Figure 13.
Instant debonding [13].
Figure 13.
Instant debonding [13].

Figure 14.
Debonding over time [36].
Figure 14.
Debonding over time [36].

Figure 15.
Effect of embedment depth on z-Pin maximum pull-out force, for vertical and parallel embedment [22].
Figure 15.
Effect of embedment depth on z-Pin maximum pull-out force, for vertical and parallel embedment [22].

Figure 16.
Normal (radial) stress distribution along the z-Pin/laminate interface (CFRP z-Pins, d = 0.51 mm, [0] pre-preg, t = 4 mm) [21].
Figure 16.
Normal (radial) stress distribution along the z-Pin/laminate interface (CFRP z-Pins, d = 0.51 mm, [0] pre-preg, t = 4 mm) [21].

Figure 17.
Shear stress distribution along the z-Pin/laminate interface (CFRP z-Pin, d = 0.51 mm, [0] pre-preg, t = 4 mm) [21].
Figure 17.
Shear stress distribution along the z-Pin/laminate interface (CFRP z-Pin, d = 0.51 mm, [0] pre-preg, t = 4 mm) [21].

Figure 18.
Effect of z-Pin diameter on mode II z-Pin response (CFRP z-Pins, t = 2 h = 4 mm, [0] pre-preg) [23].
Figure 18.
Effect of z-Pin diameter on mode II z-Pin response (CFRP z-Pins, t = 2 h = 4 mm, [0] pre-preg) [23].

Figure 19.
Effect of z-Pin embedment depth on mode II z-Pin response (CFRP z-Pins, d = 0.3 mm, [0] pre-preg) [23].
Figure 19.
Effect of z-Pin embedment depth on mode II z-Pin response (CFRP z-Pins, d = 0.3 mm, [0] pre-preg) [23].

Figure 20.
Effect of z-Pin offset angle (θ) and void content (φ) on the normalized z-Pin traction stiffness [13].
Figure 20.
Effect of z-Pin offset angle (θ) and void content (φ) on the normalized z-Pin traction stiffness [13].

Figure 21.
Effect of z-Pin embedment depth and offset angle on transition point from pull-out to rupture (CFRP z-Pins, d = 0.28 mm, [0/90] pre-preg) [13].
Figure 21.
Effect of z-Pin embedment depth and offset angle on transition point from pull-out to rupture (CFRP z-Pins, d = 0.28 mm, [0/90] pre-preg) [13].

Figure 22.
Effect of z-Pin embedment depth on mode I z-Pin response (CFRP z-Pins) [33].
Figure 22.
Effect of z-Pin embedment depth on mode I z-Pin response (CFRP z-Pins) [33].

Figure 23.
Effect of mode mixicity angle on single z-Pin response (CFRP z-Pin, d = 0.28mm, [0] pre-preg) [31].
Figure 23.
Effect of mode mixicity angle on single z-Pin response (CFRP z-Pin, d = 0.28mm, [0] pre-preg) [31].

Figure 24.
Effect of mode mixicity angle on single z-Pin failure (CFRP z-Pin, d = 0.28 mm, [0] pre-preg) [31].
Figure 24.
Effect of mode mixicity angle on single z-Pin failure (CFRP z-Pin, d = 0.28 mm, [0] pre-preg) [31].

Figure 25.
Effect of z-Pin material on mode I z-Pin response (d = 0.51 mm, 2.0 vol%, t = 4 mm, [06[90/0]4]s pre-preg) [37].
Figure 25.
Effect of z-Pin material on mode I z-Pin response (d = 0.51 mm, 2.0 vol%, t = 4 mm, [06[90/0]4]s pre-preg) [37].

Figure 26.
Effect of mode mixicity ratio on single z-Pin apparent fracture toughness (CFRP z-Pin, 2.0 vol%, d = 0.28 mm, quasi-isotropic pre-preg) [12].
Figure 26.
Effect of mode mixicity ratio on single z-Pin apparent fracture toughness (CFRP z-Pin, 2.0 vol%, d = 0.28 mm, quasi-isotropic pre-preg) [12].

Figure 27.
Predicted maximum normal stress distribution along the z-Pin for mode mixity ratio 0.55 [12].
Figure 27.
Predicted maximum normal stress distribution along the z-Pin for mode mixity ratio 0.55 [12].

Figure 28.
Predicted maximum shear stress distribution along the z-Pin for mode mixity ratio 0.55 [12].
Figure 28.
Predicted maximum shear stress distribution along the z-Pin for mode mixity ratio 0.55 [12].

Figure 29.
Effect of splitting density on the apparent fracture toughness of the z-Pinned laminate [29].
Figure 29.
Effect of splitting density on the apparent fracture toughness of the z-Pinned laminate [29].

Figure 30.
Effect of residual thermal stress on apparent fracture toughness of the z-Pinned laminate [29].
Figure 30.
Effect of residual thermal stress on apparent fracture toughness of the z-Pinned laminate [29].

Figure 31.
Effect of z-Pin/laminate interface mode I and II fracture toughness on the mode I apparent fracture toughness of the total z-Pinned laminate [29].
Figure 31.
Effect of z-Pin/laminate interface mode I and II fracture toughness on the mode I apparent fracture toughness of the total z-Pinned laminate [29].

Figure 32.
Effect of z-Pin offset angle on maximum load [17].
Figure 32.
Effect of z-Pin offset angle on maximum load [17].

Figure 33.
Percentage weight gain-exposure time curves for the unpinned and pinned laminates. The exposure conditions were (a) 20 °C in air, (b) 20 °C in water, (c) 70 °C and 85% relative humidity (hot/wet) and (d) 70 °C in water. Three curves for both materials are presented in (a) to show the typical scatter in the weight gain values between samples. The curves in (b)–(d) are the average weight gain curves based on three samples [38].

Figure 34.
Pull-out load-displacement curve of z-Pins with time exposure in 70 °C and 85% humid environment (CFRP z-Pins, 4.0 vol%, d = 0.28 mm, pseudo-quasi-isotropic pre-preg, t = 4.5 mm) [38].
Figure 34.
Pull-out load-displacement curve of z-Pins with time exposure in 70 °C and 85% humid environment (CFRP z-Pins, 4.0 vol%, d = 0.28 mm, pseudo-quasi-isotropic pre-preg, t = 4.5 mm) [38].

Figure 35.
Pull-out load-displacement curve of z-Pins with time exposure in 70 °C water environment (CFRP z-Pins, 4.0 vol%, d = 0.28 mm, pseudo-quasi-isotropic pre-preg, t = 4.5mm) [38].
Figure 35.
Pull-out load-displacement curve of z-Pins with time exposure in 70 °C water environment (CFRP z-Pins, 4.0 vol%, d = 0.28 mm, pseudo-quasi-isotropic pre-preg, t = 4.5mm) [38].

Figure 36.
Effect of hot-wet conditioning (70 °C and 85% humid) on elastic and pull-out traction energy of z-Pins (CFRP z-Pins, 2.0 vol%, d = 0.28 mm, [0/90] pre-preg, t = 4.3 mm) [24]).
Figure 36.
Effect of hot-wet conditioning (70 °C and 85% humid) on elastic and pull-out traction energy of z-Pins (CFRP z-Pins, 2.0 vol%, d = 0.28 mm, [0/90] pre-preg, t = 4.3 mm) [24]).

Figure 37.
Pull-out load-displacement curve with increasing number of cycles (CFRP z-Pins, 4 × 4 array, d = 0.51 mm, [0/90] pre-preg, t = 3 mm) [36].
Figure 37.
Pull-out load-displacement curve with increasing number of cycles (CFRP z-Pins, 4 × 4 array, d = 0.51 mm, [0/90] pre-preg, t = 3 mm) [36].

Figure 38.
Pull-out load-displacement curve with increasing number of cycles (CFRP z-Pins, 7 × 7 array, d = 0.28 mm, [0/90] pre-preg, t = 3 mm) [36].
Figure 38.
Pull-out load-displacement curve with increasing number of cycles (CFRP z-Pins, 7 × 7 array, d = 0.28 mm, [0/90] pre-preg, t = 3 mm) [36].

Figure 39.
Effect of z-Pin content on tensile modulus due to z-Pinning on various lay-up laminates (CFRP z-Pins, d = 0.28 mm, pre-preg) [16].
Figure 39.
Effect of z-Pin content on tensile modulus due to z-Pinning on various lay-up laminates (CFRP z-Pins, d = 0.28 mm, pre-preg) [16].

Figure 40.
Effect of z-Pin content on tensile strength due to z-Pinning on various lay-up laminates (CFRP z-Pins, d = 0.28 mm, pre-preg) [16].
Figure 40.
Effect of z-Pin content on tensile strength due to z-Pinning on various lay-up laminates (CFRP z-Pins, d = 0.28 mm, pre-preg) [16].

Figure 41.
S-N curve for a z-Pinned composite subjected to cyclic tension-tension (CFRP z-Pins, d = 0.28 mm, [0] pre-preg) [1].
Figure 41.
S-N curve for a z-Pinned composite subjected to cyclic tension-tension (CFRP z-Pins, d = 0.28 mm, [0] pre-preg) [1].

Figure 42.
S-N curve for z-Pinned composite subjected to cyclic tension-tension (CFRP z-Pins, d = 0.28 mm, [0/90] pre-preg) [40].
Figure 42.
S-N curve for z-Pinned composite subjected to cyclic tension-tension (CFRP z-Pins, d = 0.28 mm, [0/90] pre-preg) [40].

Figure 43.
Schematic of the fatigue failure mechanism in z-Pinned 0° fiber direction ply [16].
Figure 43.
Schematic of the fatigue failure mechanism in z-Pinned 0° fiber direction ply [16].

Figure 44.
Effect of fiber lay-up on compressive modulus due to z-Pinning (CFRP z-Pins, 2.0 vol%, d = 0.51 mm, pre-preg) [39].
Figure 44.
Effect of fiber lay-up on compressive modulus due to z-Pinning (CFRP z-Pins, 2.0 vol%, d = 0.51 mm, pre-preg) [39].

Figure 45.
Effect of fiber lay-up on compressive strength due to z-Pinning (CFRP z-Pins, 2.0 vol%, d = 0.51 mm, pre-preg) [39].
Figure 45.
Effect of fiber lay-up on compressive strength due to z-Pinning (CFRP z-Pins, 2.0 vol%, d = 0.51 mm, pre-preg) [39].

Figure 46.
Initial imperfection magnitude h/l [43].
Figure 46.
Initial imperfection magnitude h/l [43].

Figure 47.
Effect of imperfection magnitude on compression strength of z-Pin composite (z-Pins, 1.0 vol%, d = 0.51 mm, [0]) [43].
Figure 47.
Effect of imperfection magnitude on compression strength of z-Pin composite (z-Pins, 1.0 vol%, d = 0.51 mm, [0]) [43].

Figure 48.
S-N curve for z-Pinned composite subjected to cyclic compression-compression (CFRP z-Pins, d = 0.28 mm, [0] pre-preg) [1].
Figure 48.
S-N curve for z-Pinned composite subjected to cyclic compression-compression (CFRP z-Pins, d = 0.28 mm, [0] pre-preg) [1].

Figure 49.
S-N curve for z-Pinned composite subjected to cyclic compression-compression (CFRP z-Pins, d = 0.28 mm, [0/±45/90] pre-preg) [7].
Figure 49.
S-N curve for z-Pinned composite subjected to cyclic compression-compression (CFRP z-Pins, d = 0.28 mm, [0/±45/90] pre-preg) [7].

Figure 50.
Effect of z-Pin content on flexural modulus due to z-Pinning on various lay-up laminates (CFRP z-Pins, pre-preg) [15].
Figure 50.
Effect of z-Pin content on flexural modulus due to z-Pinning on various lay-up laminates (CFRP z-Pins, pre-preg) [15].

Figure 51.
Effect of z-Pin content on flexural strength due to z-Pinning on various lay-up laminates (CFRP z-Pins, pre-preg) [15].
Figure 51.
Effect of z-Pin content on flexural strength due to z-Pinning on various lay-up laminates (CFRP z-Pins, pre-preg) [15].

Figure 52.
Effect of z-Pins volume content on the apparent mode I and II interlaminar fracture toughness [1].
Figure 52.
Effect of z-Pins volume content on the apparent mode I and II interlaminar fracture toughness [1].

Figure 53.
Effect of z-Pin content in R-curve on mode I apparent fracture toughness of a z-Pinned laminate (CFRP z-Pins, d = 0.28mm, [0n[0/90]]s pre-preg) [33].
Figure 53.
Effect of z-Pin content in R-curve on mode I apparent fracture toughness of a z-Pinned laminate (CFRP z-Pins, d = 0.28mm, [0n[0/90]]s pre-preg) [33].

Figure 54.
Effect of z-Pin content in Paris curves for mode I z-Pinned laminate (CFRP z-Pins, d = 0.28 mm, l = 4 mm, [0n[0/90]]s pre-preg) [33].
Figure 54.
Effect of z-Pin content in Paris curves for mode I z-Pinned laminate (CFRP z-Pins, d = 0.28 mm, l = 4 mm, [0n[0/90]]s pre-preg) [33].

Figure 55.
Effect of z-Pin embedment on mode I apparent fracture toughness of z-Pinned laminate (CFRP z-Pins, 2.0 vol%, d = 0.28 mm, [0n[0/90]2]s pre-preg) [32].
Figure 55.
Effect of z-Pin embedment on mode I apparent fracture toughness of z-Pinned laminate (CFRP z-Pins, 2.0 vol%, d = 0.28 mm, [0n[0/90]2]s pre-preg) [32].

Figure 56.
Effect of z-Pin material in mode I apparent fracture toughness of a z-Pinned laminate (d = 0.51 mm, 2.0 vol%, t = 4 mm, [06[90/0]4]s pre-preg) [37].
Figure 56.
Effect of z-Pin material in mode I apparent fracture toughness of a z-Pinned laminate (d = 0.51 mm, 2.0 vol%, t = 4 mm, [06[90/0]4]s pre-preg) [37].

Figure 57.
Effect of z-Pin material in Paris curves for mode I z-Pinned laminate (d = 0.51 mm, 2.0 vol%, t = 4 mm, [06[90/0]4]s pre-preg) [37].
Figure 57.
Effect of z-Pin material in Paris curves for mode I z-Pinned laminate (d = 0.51 mm, 2.0 vol%, t = 4 mm, [06[90/0]4]s pre-preg) [37].

Figure 58.
Initiation and development of the bridging effect in a z-Pinned laminate (numerical and experiments) in a Mode I loaded DCB specimen (CFRP z-Pins, 0.5 vol%, d = 0.28 mm, [0] pre-preg) [21].
Figure 58.
Initiation and development of the bridging effect in a z-Pinned laminate (numerical and experiments) in a Mode I loaded DCB specimen (CFRP z-Pins, 0.5 vol%, d = 0.28 mm, [0] pre-preg) [21].

Figure 59.
Effect of increasing z-Pin content and diameter on mode II fracture toughness of z-Pinned laminates (CFRP z-Pins, [±45/0/90] pre-preg) [48].
Figure 59.
Effect of increasing z-Pin content and diameter on mode II fracture toughness of z-Pinned laminates (CFRP z-Pins, [±45/0/90] pre-preg) [48].

Figure 60.
Effect of z-Pin content on the mode II apparent fracture toughness of a z-Pinned laminate (CFRP z-Pins, d = 0.28mm, [06[0/90]2]s pre-preg) [27].
Figure 60.
Effect of z-Pin content on the mode II apparent fracture toughness of a z-Pinned laminate (CFRP z-Pins, d = 0.28mm, [06[0/90]2]s pre-preg) [27].

Figure 61.
Effect of z-Pin diameter on the mode II apparent fracture toughness of a z-Pinned laminate (CFRP z-Pins, 2.0 vol%, [06[0/90]2]s pre-preg) [27].
Figure 61.
Effect of z-Pin diameter on the mode II apparent fracture toughness of a z-Pinned laminate (CFRP z-Pins, 2.0 vol%, [06[0/90]2]s pre-preg) [27].

Figure 62.
Effect of z-Pin content on Paris curves for mode II z-Pinned laminate (CFRP z-Pins, d = 0.28 mm, [06[0/90]2]s pre-preg) [27].
Figure 62.
Effect of z-Pin content on Paris curves for mode II z-Pinned laminate (CFRP z-Pins, d = 0.28 mm, [06[0/90]2]s pre-preg) [27].

Figure 63.
Effect of z-Pin embedment on mode II apparent fracture toughness of z-Pinned laminate (CFRP z-Pins, 2.0 vol%, d = 0.28 mm, [0n[0/90]2]s pre-preg) [32].
Figure 63.
Effect of z-Pin embedment on mode II apparent fracture toughness of z-Pinned laminate (CFRP z-Pins, 2.0 vol%, d = 0.28 mm, [0n[0/90]2]s pre-preg) [32].

Figure 64.
Effect of z-Pin offset angle on mode II apparent fracture toughness of z-Pinned laminate (CFRP z-Pins, 0.4 vol%, d = 0.28 mm, [0/45/90/-45]4s pre-preg) [17].
Figure 64.
Effect of z-Pin offset angle on mode II apparent fracture toughness of z-Pinned laminate (CFRP z-Pins, 0.4 vol%, d = 0.28 mm, [0/45/90/-45]4s pre-preg) [17].

Figure 65.
Force–displacement curve for spring and cohesive model compared with experiment (CFRP z-Pins, 2.0 vol%, d = 0.28 mm, [0] pre-preg) [23].
Figure 65.
Force–displacement curve for spring and cohesive model compared with experiment (CFRP z-Pins, 2.0 vol%, d = 0.28 mm, [0] pre-preg) [23].

Figure 66.
Force–displacement curves for cohesive model compared with experiment (GII/GTotal = 20%, CFRP z-Pins) [30].
Figure 66.
Force–displacement curves for cohesive model compared with experiment (GII/GTotal = 20%, CFRP z-Pins) [30].

Figure 67.
Force–displacement curves for cohesive model compared with experiment (GII/GTotal = 50% and 80%, CFRP z-Pins) [30].
Figure 67.
Force–displacement curves for cohesive model compared with experiment (GII/GTotal = 50% and 80%, CFRP z-Pins) [30].

Figure 68.
Effect of lay-up on moisture absorption ratio of unpinned and z-Pinned laminates [42].
Figure 68.
Effect of lay-up on moisture absorption ratio of unpinned and z-Pinned laminates [42].

Figure 69.
Effect of z-Pin content on compressive strength in quasi-isotropic laminates in both RTD and Hygrothermal environment [42].
Figure 69.
Effect of z-Pin content on compressive strength in quasi-isotropic laminates in both RTD and Hygrothermal environment [42].

Figure 70.
Effect of hot-wet conditioning (70 °C and 85% humid) on mode I delamination toughness z-Pinned composite (CFRP z-Pins, 2.0 vol%, d = 0.28 mm, [0/90] pre-preg, t = 4.3 mm) [24].
Figure 70.
Effect of hot-wet conditioning (70 °C and 85% humid) on mode I delamination toughness z-Pinned composite (CFRP z-Pins, 2.0 vol%, d = 0.28 mm, [0/90] pre-preg, t = 4.3 mm) [24].

Figure 71.
Effect of hot-wet conditioning (70 °C and 85% humid) on high-energy impact damage induced on z-Pinned composite (CFRP z-Pins, 2.0 vol%, d = 0.28 mm, [0/90] pre-preg, t = 4.3 mm) [24].
Figure 71.
Effect of hot-wet conditioning (70 °C and 85% humid) on high-energy impact damage induced on z-Pinned composite (CFRP z-Pins, 2.0 vol%, d = 0.28 mm, [0/90] pre-preg, t = 4.3 mm) [24].

Figure 72.
Post-impact compressive strength of composites with and without z-Pins [1].
Figure 72.
Post-impact compressive strength of composites with and without z-Pins [1].

Figure 73.
Effect of z-Pin content and impact energy level on impact damage area (CFRP z-Pins, d = 0.28 mm, [0/±45/90] pre-preg) [7].
Figure 73.
Effect of z-Pin content and impact energy level on impact damage area (CFRP z-Pins, d = 0.28 mm, [0/±45/90] pre-preg) [7].

Figure 74.
Effect of z-Pin content on post high energy impact (25.5J) compression modulus and strength (CFRP z-Pins, d = 0.28 mm, [0/±45/90] pre-preg) [7].
Figure 74.
Effect of z-Pin content on post high energy impact (25.5J) compression modulus and strength (CFRP z-Pins, d = 0.28 mm, [0/±45/90] pre-preg) [7].

© 2020 by the authors. Licensee MDPI, Basel, Switzerland. This article is an open access article distributed under the terms and conditions of the Creative Commons Attribution (CC BY) license (http://creativecommons.org/licenses/by/4.0/).
Share and Cite
MDPI and ACS Style
Kostopoulos, V.; Sarantinos, N.; Tsantzalis, S. Review of Through-the-Thickness Reinforced z-Pinned Composites. J. Compos. Sci. 2020, 4, 31. https://0-doi-org.brum.beds.ac.uk/10.3390/jcs4010031
AMA Style
Kostopoulos V, Sarantinos N, Tsantzalis S. Review of Through-the-Thickness Reinforced z-Pinned Composites. Journal of Composites Science. 2020; 4(1):31. https://0-doi-org.brum.beds.ac.uk/10.3390/jcs4010031
Chicago/Turabian StyleKostopoulos, Vassilis, Nikolaos Sarantinos, and Stavros Tsantzalis. 2020. "Review of Through-the-Thickness Reinforced z-Pinned Composites" Journal of Composites Science 4, no. 1: 31. https://0-doi-org.brum.beds.ac.uk/10.3390/jcs4010031