Article

UV-Cured Poly(Ethylene Glycol) Diacrylate/Carbon Nanostructure Thin Films. Preparation, Characterization, and Electrical Properties

by
Panagiotis Loginos
,
Anastasios Patsidis
and
Vasilios Georgakilas
*
Department of Materials Science, University of Patras, 26504 Rio, Greece
*
Author to whom correspondence should be addressed.
Submission received: 6 November 2019 / Revised: 19 December 2019 / Accepted: 26 December 2019 / Published: 1 January 2020
(This article belongs to the Special Issue Recent Advances in Conductive Polymer Composites)

Abstract

:
Carbon nanoallotropes such as carbon nanotubes, graphene, and their derivatives have been combined with a plethora of polymers in the last years to develop new composite materials with interesting properties and applications. However, the area of photopolymer composites with carbon nanostructures has not been analogously explored. In the present article, we study the photopolymerization of poly(ethylene glycol)diacrylate (PEGDA) enriched with different carbon nanoallotropes like graphene, pristine and chemically modified carbon nanotubes (CNTs and fCNTs), and a hybrid of graphene and CNTs. The products were characterized by several microscopic and spectroscopic techniques and the electrical conductivity was studied as a function of the concentrations of carbon nanoallotropes. In general, stable thin films were produced with a concentration of carbon nanostructures up to 8.5%, although the addition of carbon nanostructures in PEGDA decreases the degree of photopolymerization, and PEDGA/carbon nanostructure composites showed electrical conductivity at a relatively low percentage.

1. Introduction

Photopolymers are a relatively new class of materials that have been used in several applications among others in the coating and adhesive industry, biomaterials and additive manufactures, and have a remarkable contribution in the development of photoresists in microelectronics and microsystem technology. The rapidly developed 3D imaging technology is also greatly supported by photopolymers [1,2,3,4,5,6]. They consist of organic molecules, oligomers, polymers or their mixture, and, when they are exposed to light, form cross-linked polymeric structures, altering substantially their chemical and mechanical properties. The advantages of photopolymers include fast curing, high corrosion resistance, and being solvent-free with eco-friendly processes [7,8,9]. Photopolymers are also used as matrices in composite materials with enhanced properties to develop multi-functional characteristics [10].
On the other hand, carbon nanostructures, mainly carbon nanotubes, graphene, and their derivatives, have been extensively used as fillers in polymer composites, targeting products with novel and interesting electrical, thermal, and mechanical properties [11,12,13]. In several cases, carbon nanostructures have been combined with photopolymers affording various interesting composites [14,15,16]. The combination of photopolymers with carbon nanofillers involves mainly epoxy or acrylic polymers and graphene oxide (GO) instead of pristine graphene or carbon nanotubes (CNTs). GO is more effectively dispersed in epoxy or acrylic monomers due to the epoxy, hydroxyl, and carboxylates groups that are spread on their surface than pristine graphene or carbon nanotubes, which tend to aggregate due to strong π interactions [17]. However, the use of GO as a nanofiller has one main drawback, especially in the case that electrical conductivity of the polymer composite is needed. GO is an insulator and even after reduction only partially restores the conductivity of pristine graphene [18].
In this article, we combine a photopolymer, poly(ethylene glycol) diacrylate (PEGDA), with pristine graphene and carbon nanotubes to construct polymer nanocomposite thin films by photopolymerization. PEGDA was selected as a nontoxic substance compatible with most common photoinitiators and easily prepared. It is an acrylate-based monomer and thus radical chain-growth polymerization was preferred as more suitable and common in photo-curable procedures. [19,20] Moreover, free radicals can be also added on the double bond of a graphene or CNT surface, enhancing the connectivity between carbon nanofiller and polymer matrix [21,22]. Fabbri et al. have shown that PEGDA can be combined successfully with GO to form transparent and conductive coatings by photopolymerization [20]. Based on this issue, we combined for the first time here pristine graphene and pristine and functionalized CNTs with PEGDA, producing thin films by photopolymerization, to study the role of the different graphenic nanofillers and their contribution to the electrical behavior of the as-produced polymer composites. The obstacle of the poor dispersibility of pristine carbon nanostructures in acrylic monomers like PEGDA was significantly overtaken using a shear stress stirring device, which improved remarkably the homogeneity of the mixture before photopolymerization. Moreover, since additive manufacturing (3D imaging technology) builds constructions in layers, this work examines the feasibility of creating stand-alone, conductive, doped films with an average thickness close to that of one layer in a 3D printed item.

2. Materials and Methods

2.1. Materials

Poly(ethylene glycol) diacrylate (PEGDA, average Mn = 575 g/mol) was provided by Sigma Aldrich (St. Louis, MO, USA).
1-(4-(2-Hydroxyethoxy)-phenyl)-2-hydroxy-2-methyl-1-propane-1-one (Irgacure D2959) was used as photoinitiator and obtained by J&K Scientific (Beijing, China). Multiwalled carbon nanotubes (CNTs) with an average aspect ratio of 100 were purchased by Sigma Aldrich and pristine Graphene grade M (G) with an average diameter of 25 μm by XG sciences (Lansing, MI, USA). Functionalized CNTs were prepared according to Reference [23].

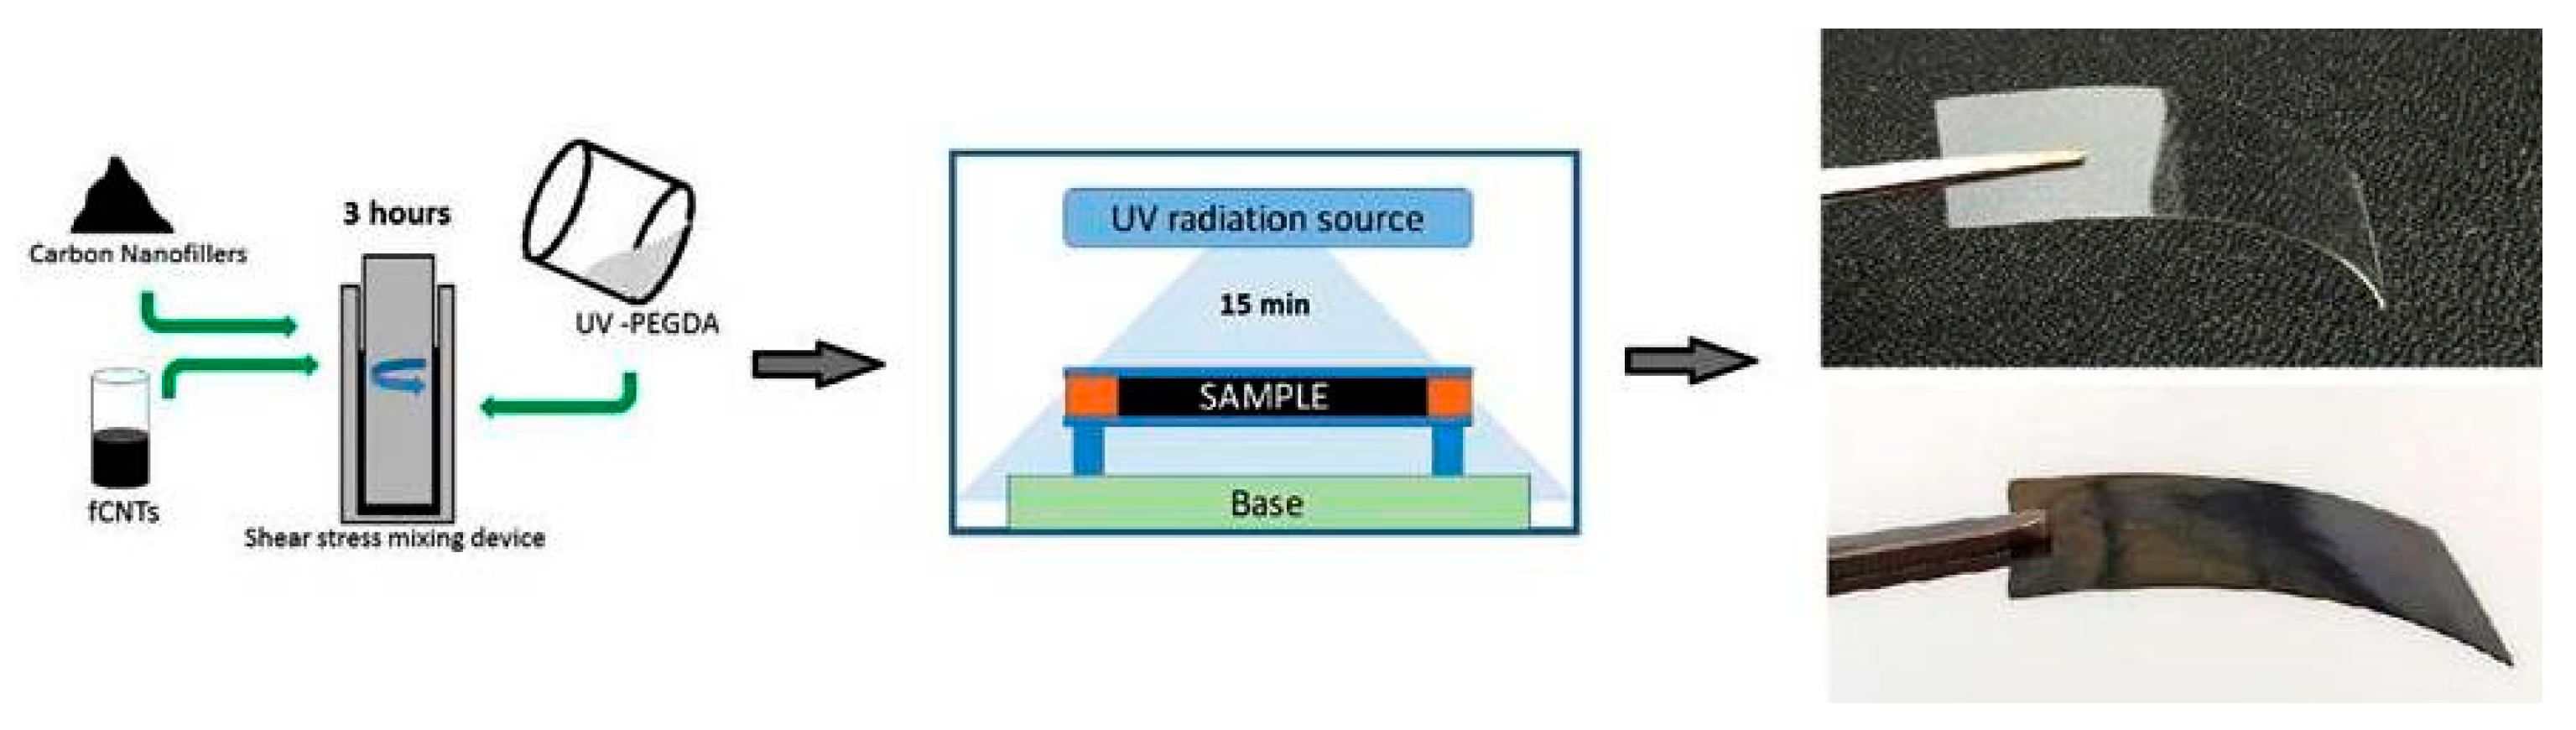
2.2. Sample Preparation

Photoinitiator (PI) was mixed with PEGDA oligomer (2% w/w) and stirred at room temperature until a homogenous transparent liquid was achieved. This mixture was stable for a long time while being stored at 2–8 °C and protected from ultraviolet (UV) radiation. The PEGDA/PI mixture was then mixed with an amount of the carbon nanostructure in several ratios using a handmade shear stress stirring device for 3 h. The mixture was placed between two glass slides with a controlled distance and exposed to UV light of 365 nm for 15 min. The intensity of the lamp was 1273 mW/cm2. The black film produced by this way was washed with acetone to remove unreacted material and air-dried.
fCNTs [23] were added in the mixture with an amount of water that corresponded to 10% of the PEGDA volume. PEGDA with fCNTs was cured as previously and film samples were handled as all the other samples.

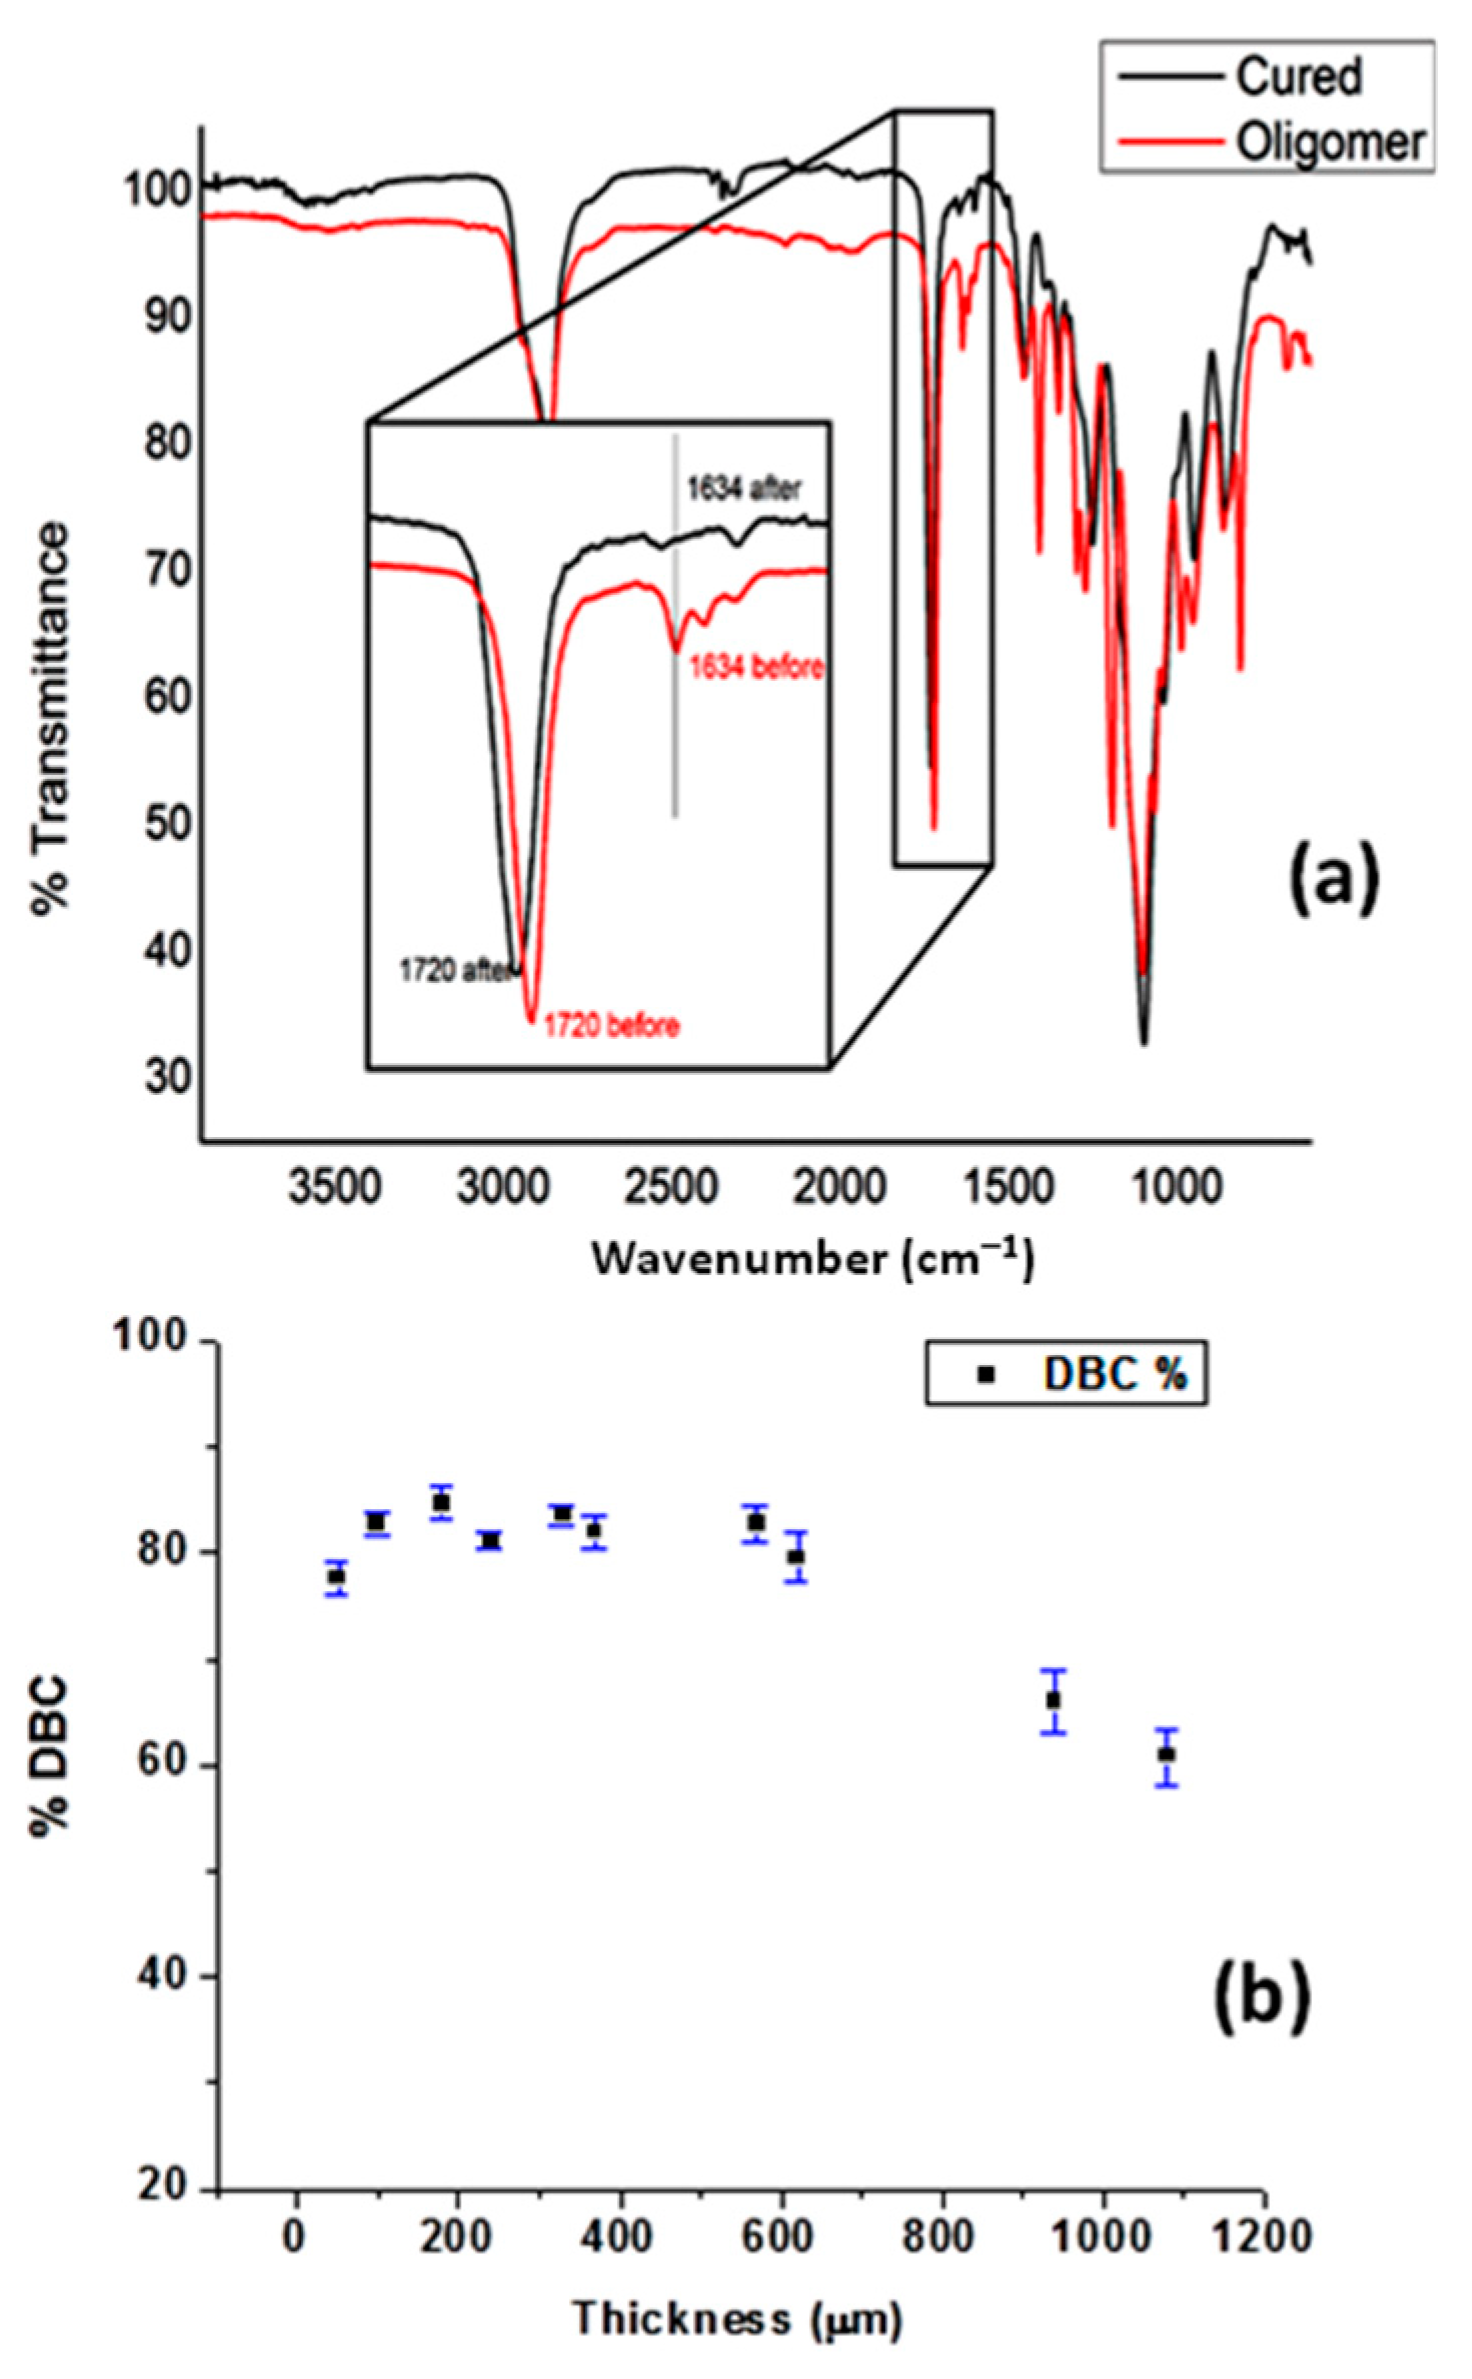
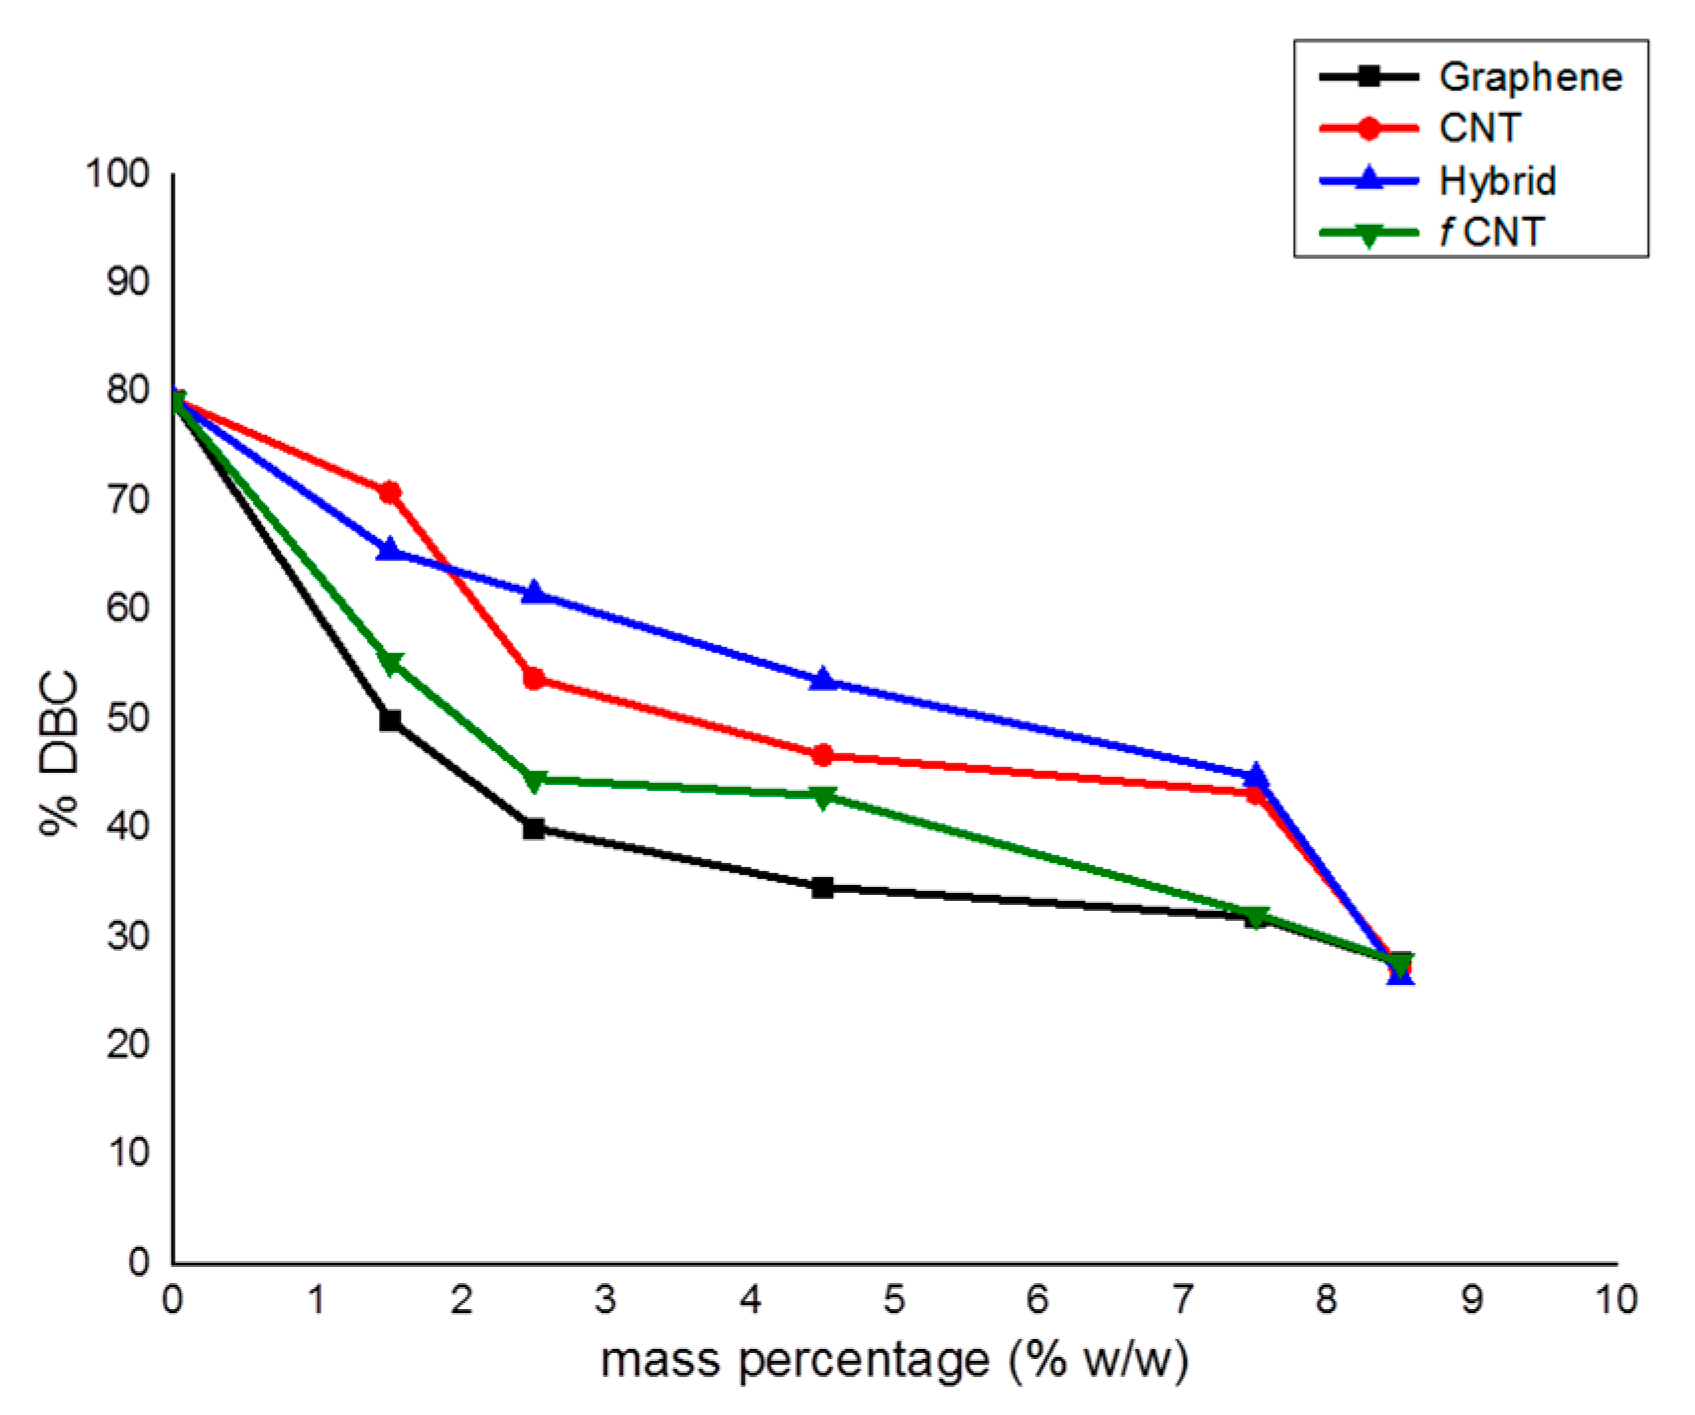
2.3. Samples Characterization

Scanning electron microscopy (SEM) was performed on a Zeiss EVO MA-10 electron microscope (Carl Zeiss AG, Oberkochen, Germany). The double bond conversion (DBC) after curing process for neat and reinforced samples was estimated by Fourier transform infrared spectroscopy (FT-IR, Shimadzu IR Tracer-100 spectrometer, Shimadzu, Kyoto, Japan) in the range of 500–4000 cm−1.
To evaluate the influence of the nanofillers on the curing process, FT-IR analysis was performed to the reinforced samples in comparison with that of neat UV-cured PEGDA film. DBC is the indication of cross-linking and consequently a degree of curing and calculated by Equation (1) and the peaks of C=C bonds at 1634 cm−1 and C=O bonds at 1717 cm−1.
D B C % = ( 1 ( A t / A r a ) A o / A r b ) × 100 %
Ao and At are the absorbance values of 1634 cm−1, while Arb and Ara are the values of 1717 cm−1, before and after curing, respectively [10].

2.4. Electrical Measurements

Sheet resistance (Rs) was measured using a Jandel 4-point probe (Jandel, Linslade, UK) connected with a Keithley 2401 multimeter (Keithley Instruments, Cleveland, OH, USA). Surface conductivity was calculated as following:
σs = Rs−1·t−1
where σs is the surface conductivity in S·m−1, Rs the sheet resistance in Ohm sq−1, and t the thickness of the sample in m. Through thickness conductivity was calculated using Alpha-N Analyzer (High-resolution dielectric analyzer) by Novocontrol (Montabaur, Germany). Samples were subjected to isotherm scans in a frequency band of 10−1 to 107 Hz, at room temperature (30 °C). Conductivity was calculated using WinDeta software (Novocontrol Technologies & Co. KG, Montabaur, Germany).

3. Results

The PI concentration of 2% was selected for fast curing (e.g., few seconds) since, at this percentage, stable stand-alone thin films were produced with up to 8.5% w/w carbon nanofillers. PEGDA/PI and carbon nanofiller mixtures were homogenized successfully using a handmade shear stress stirring device. The mixtures were then placed between two glass slides with a controlled distance to avoid oxygen exposure and irradiated with 365 nm of UV light for 15 min. The black films that were produced this way were washed with acetone to remove unreacted material and dried (see Figure 1). The reinforced PEGDA films appeared reduced with mechanical stability, by which it was further depended on the carbon nanofiller percentage. In Table 1, carbon nanofillers and their mass percentage in the as-prepared polymer composites are depicted. fCNTs were selected for their hydrophilic nature due to the presence of hydroxyl groups on their surface. For this reason, fCNTs were mixed with PEGDA oligomer as a water dispersion (10% v/v with respect to PEGDA) to facilitate the homogenous mixing.

3.1. Scanning Electron Microscopy (SEM)

The morphology of the composite materials is observed in SEM microscopy images depicted in Figure 2. The samples that are presented contain 8.5% w/w of carbon nanofiller and, as it can be observed, the nanofillers are well dispersed in all the samples (Figure 2a–d) as a result of the successful shear stress mixing of the components before photo curing. Both film surfaces are highly smooth without observed nanofillers due to the continuous contact with the glass surfaces during UV curing in contrast with the internal space where abundant carbon nanofillers are visible (Figure 2e–g).
In order to study the effect of the presence of carbon nanofiller in the polymer matrix during the UV curing process, FT-IR spectra of pure and doped PEGDA were examined (see Figure 3a). Based on Equation (1) (see experimental part) and peaks at 1717 and 1634 cm−1 of the neat PEGDA before and after UV curing, an average value of 79.3% for DBC was achieved. The average DBC remained above 70% when the as-prepared films had a thickness up to 600 μm and was decreased gradually when the thickness was between 600 μm and 1 mm (see Figure 3b). The reinforced samples were produced with thickness around 180–200 μm. The average DBC values of neat PEGDA samples were lower than 100% mainly due to the entrapment and deactivation of the radicals as the polymer network became more rigid. Oxygen inhibition, which often contributes to lowering DBC values, has been significantly avoided by protecting the mixture between glass slides during photo curing [24,25].
In Figure 4, the DBC values of the reinforced PEGDA samples were presented in several ratios. DBC was ranged between 26% and 80% and was enough to create stand-alone thin films with a nanofiller percentage from 1.5% to 8.5% w/w. The decrease of DBC for reinforced samples in comparison with neat PEGDA could be explained by considering that carbon nanoparticles absorb UV radiation and block the irradiation of the initiator, leaving more uncured material in the sample. DBC was decreased as the carbon nanofiller percentage was increased and 8.5% w/w of nanofillers was a critical percentage to create stand-alone films. Between different carbon nanofillers, graphene was appeared to have a higher impact in DBC compared with CNTs due to their 2D structure. Considering the sample with fCNTs, the presence of water has not affected remarkably the polymerization process since DBC in this procedure was similar to that of the samples without water.

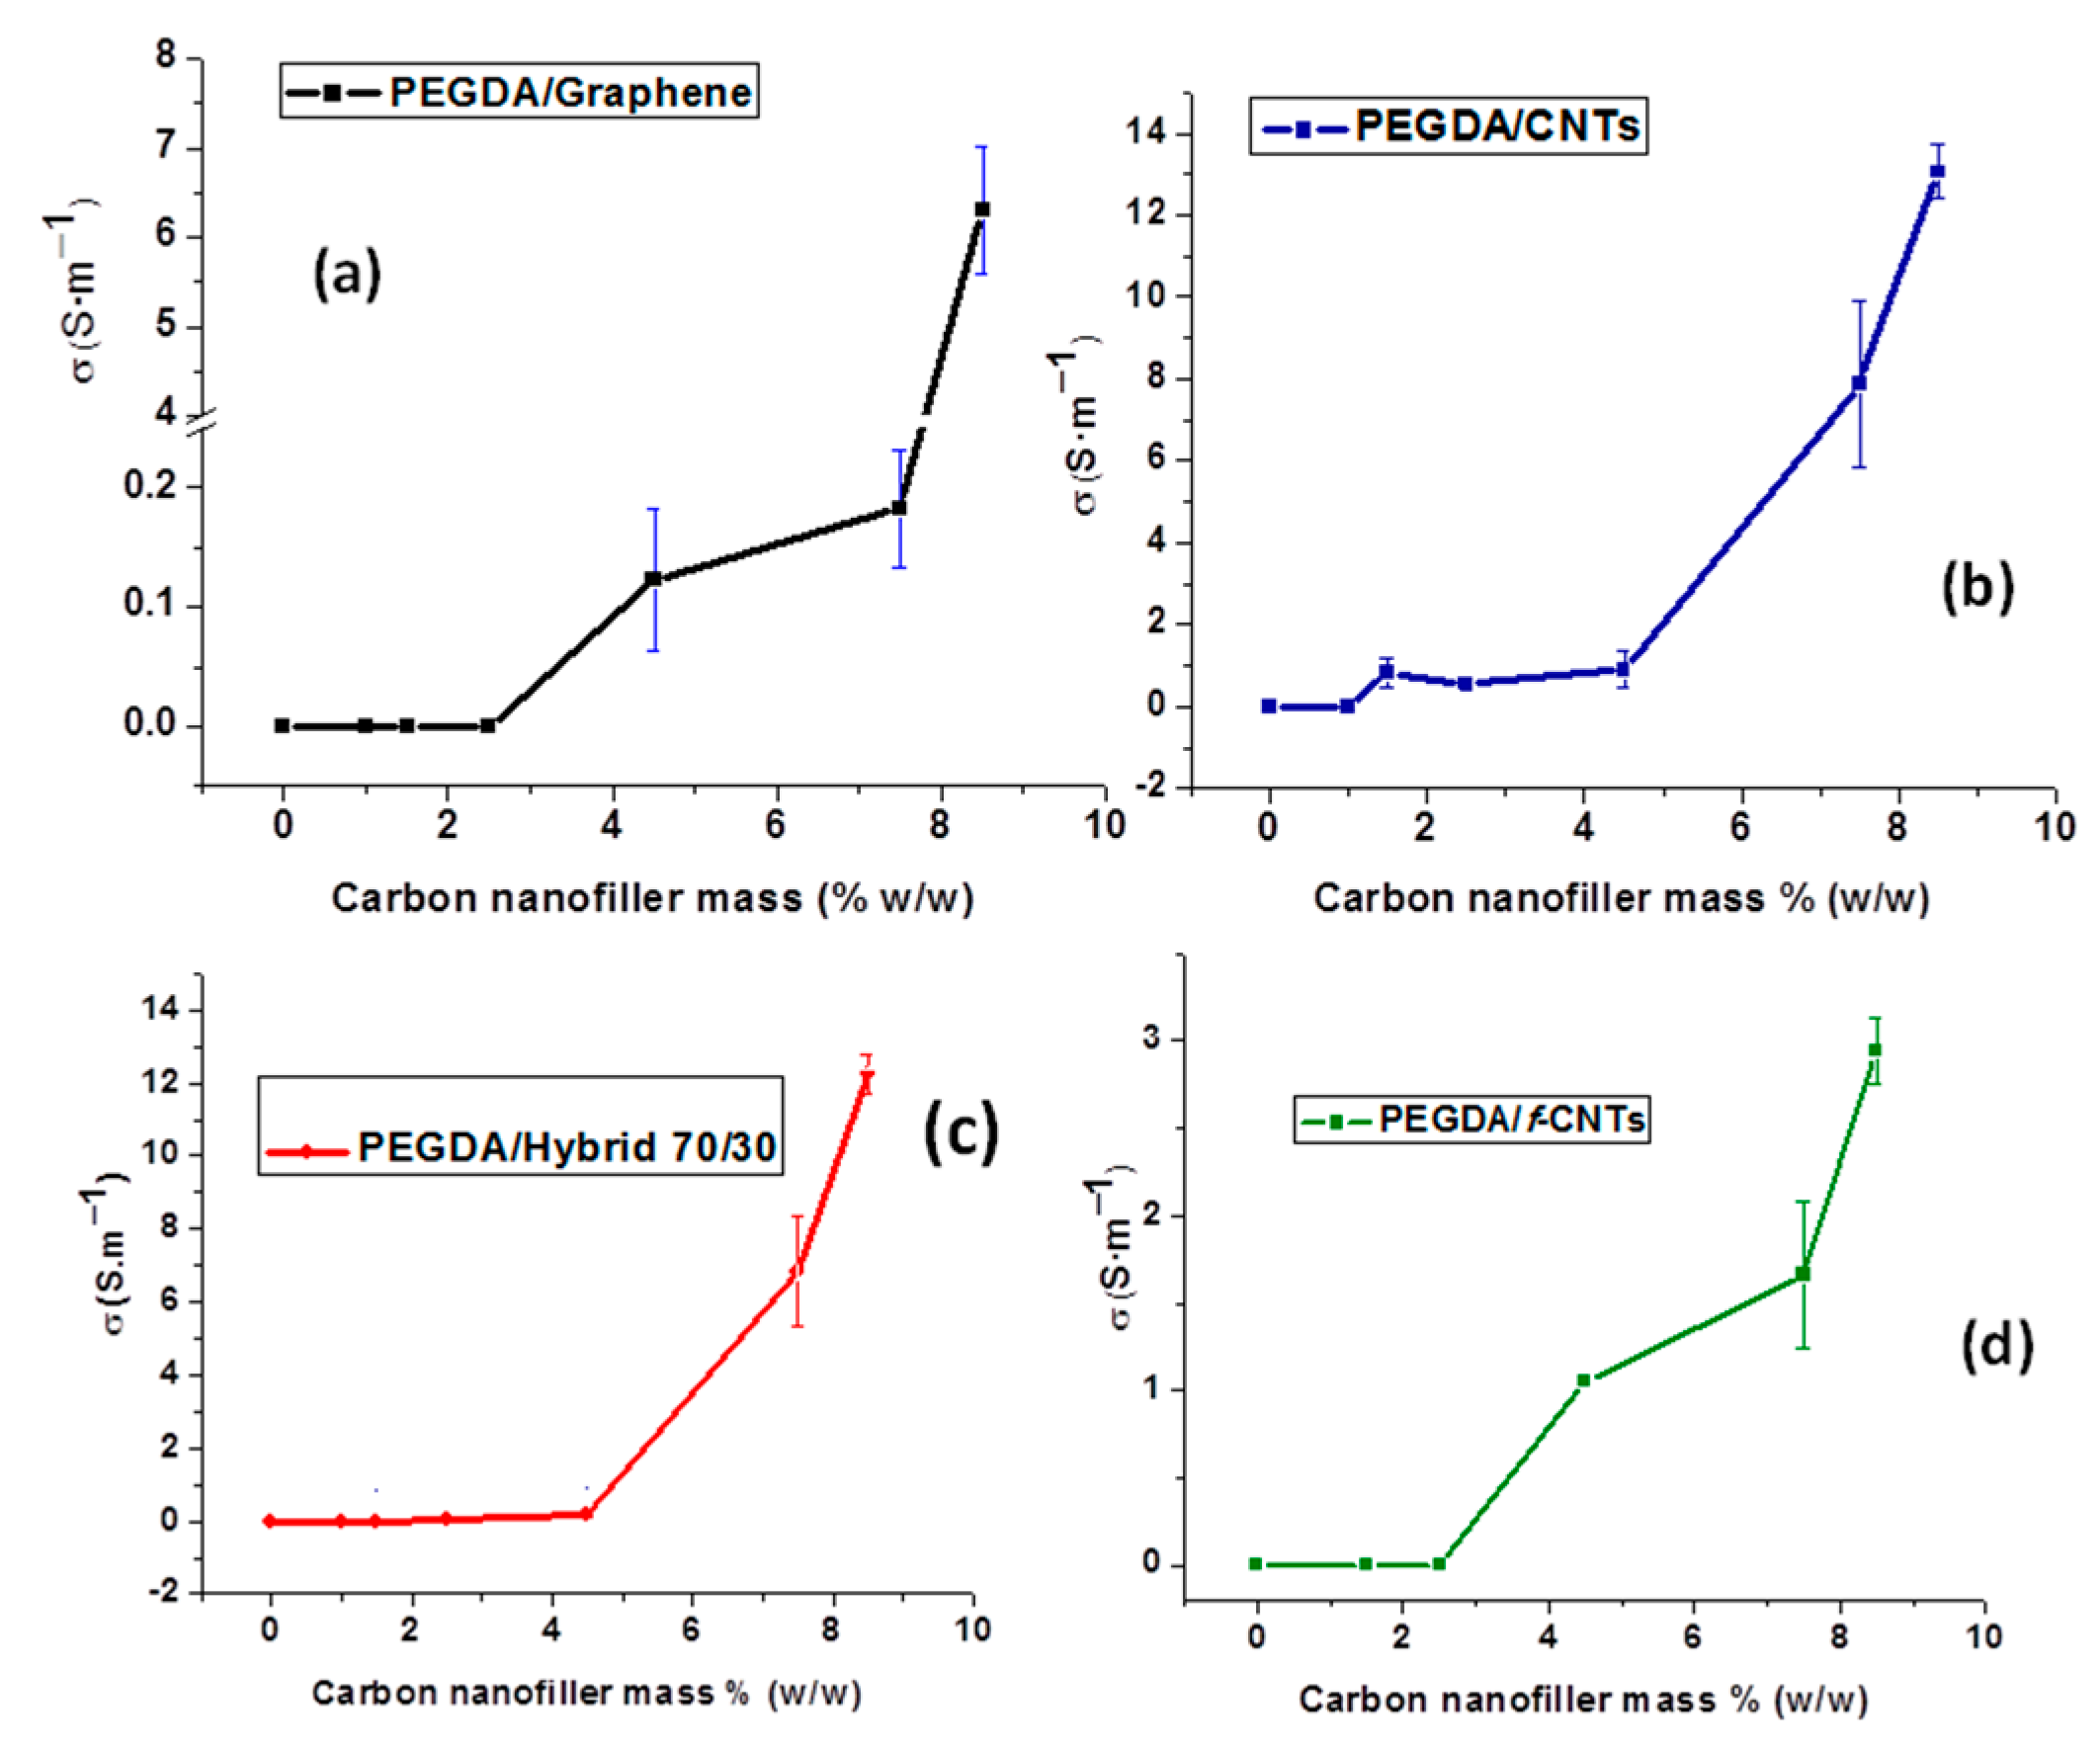
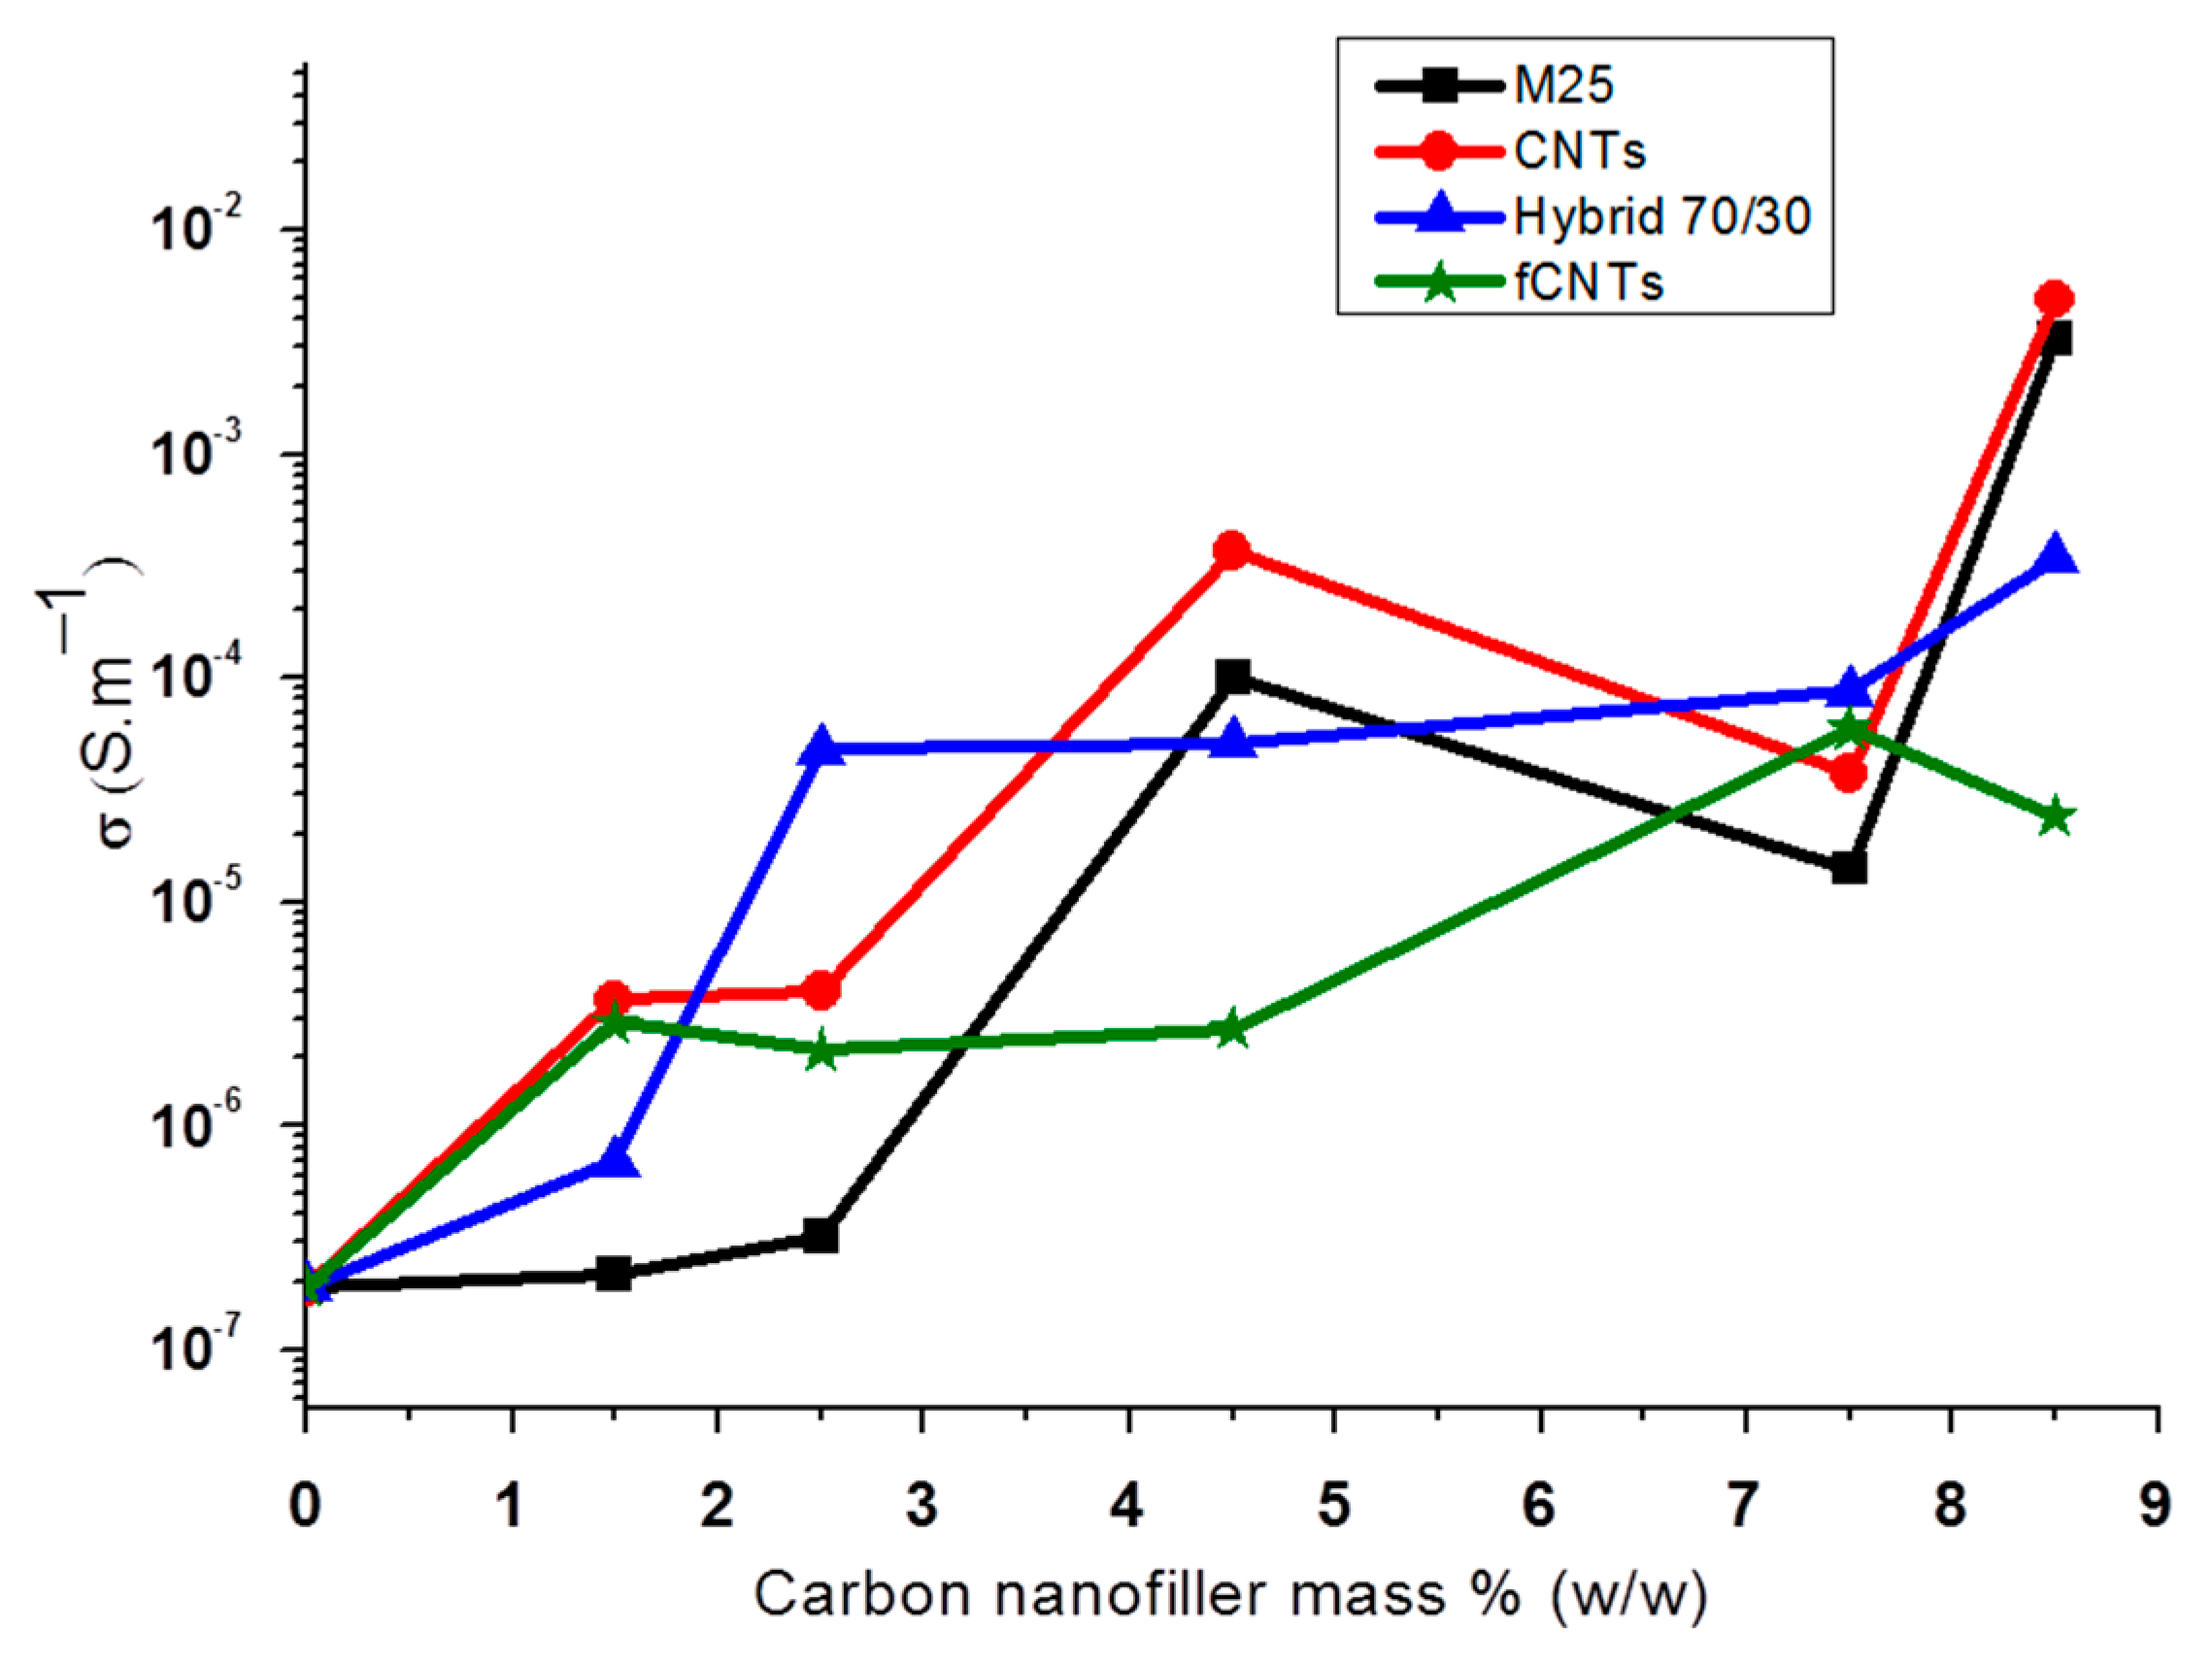
3.2. Electrical Properties

For the electrical measurements, two different methods were selected. Surface conductivity (σs) was estimated by measuring the Rs of the films using the four-point technique and through thickness conductivity (σt) was measured using BDS 1200 cell appliance (Novocontrol).
The σs of all polymer composites with different percentages of carbon nanofiller are presented in Table 2 and in the diagram of Figure 5. Comparing the two pristine materials, the 2D graphene with the 1D CNTs as fillers, the percolation threshold of the conductivity was decreased from 4.5% in PEGDA/graphene composite to 1.5% in PEGDA/CNTs. The σs of PEGDA/graphene at the highest percentage (8.5%) reached 6.3 S·m−1, which was remarkably higher than that at lower percentages.
CNTs filled composite showed at the highest percentage about 100% higher σs compared with that of graphene filled one. This can be attributed to the fact that although graphene nanosheet is in general more conductive than CNT, the latter has the freedom to move in all directions during the mixing or curing process, creating much more interconnections in the composite than graphene. The enrichment of the graphene filler with CNTs or in other words the use of a hybrid filler containing graphene and CNTs in a ratio of 7/3 showed improved electrical properties in comparison with pure graphene. In fact, the percolation threshold of the hybrid enriched composite was about 1.5%, close to that of PEGDA/CNTs. The σs of the PEGDA/hybrid composite at the highest percentage was also 100% higher compared with that of PEGDA/graphene. It is obviously observed that CNTs have an important role in the σs of PEGDA/carbon nanofiller composites.
Additionally, there is an increase of σs for all samples regarding the concentration of the nanofiller, but 8.5% w/w was the upper limit for the 180 μm thick films. Mixtures with filler concentration over 8.5% w/w were unable to be cured properly and to create films with this thickness.
Through thickness conductivity (σt) was also measured for all the as-prepared samples and the results are presented in Figure 6 and Table 3. It is shown that σt follows an increasing trend given the increasing nanofillers content. Lower than expected values of σt in some samples like that of 7.5% CNTs or 7.5% Graphene and 8.5% Hybrid can be attributed to the inhomogeneous thickness of the polymer film or imperfections on the sample surfaces. In general, PEGDA composites with CNTs and Graphene nanofillers showed a similar percolation threshold of σt, around 3% w/w, where σt started to be increased intensely and was stabilized above 5% at values between 10−4 and 10−3 S·m−1. The PEGDA/Hybrid composite showed a lower percolation threshold, around 1.5%, and σt was stabilized at 2.5% w/w close to 5 × 10⁻⁵ S·m−1.

4. Conclusions

Carbon nanoparticles were used as fillers to create photo cured conductive polymer nanocomposite films. PI of 2% w/w was enough to create stand-alone conductive films. DBC showed a decrease in the reinforced composite samples as carbon nanofillers absorb UV radiation and block the polymerization process. This decrease was relative to the amount of mass percentage up to 8.5% w/w, which was the upper limit of the nanofiller content since, with higher percentages, the films were unstable and highly fragile. Morphology examination showed a homogenous dispersion of nanofillers in the inner structure, while a thin polymer layer remained on the surface of the composites. This surface layer may be the reason that the polymer composites appeared to have low conductivities, although they showed increasing conductivity with respect to filler content up to 8.5% w/w in both conductivity measurements. Comparing different nanofiller contributions regarding the electrical properties, CNTs appeared to have a higher impact. Finally, the enrichment of graphene with CNTs in a hybrid composite showed improved conductivity compared to graphene.

Author Contributions

Conceptualization, V.G. and P.L.; methodology, P.L. and A.P.; writing—original draft preparation, V.G., P.L., and A.P.; writing—review and editing, V.G.; supervision, V.G. All authors have read and agreed to the published version of the manuscript.

Funding

This research is co-financed by Greece and the European Union (European Social Fund- ESF) through the Operational Program «Human Resources Development, Education and Lifelong Learning» in the context of the project “Strengthening Human Resources Research Potential via Doctorate Research” (MIS-5000432), implemented by the State Scholarships Foundation (ΙΚΥ).

Conflicts of Interest

The authors declare no conflicts of interest.

References

  1. Cataldi, A.; Corcione, C.E.; Frigione, M.; Pegoretti, A. Photocurable resin/nanocellulose composite coatings for wood protection. Prog. Org. Coat. 2017, 106, 128–136. [Google Scholar] [CrossRef]
  2. Srivastava, R.; Wolska, J.; Walkowiak-Kulikowska, J.H.; Sun, Y. Fluorinated bis-GMA as potential monomers for dental restorative composite materials. Eur. Polym. J. 2017, 90, 334–343. [Google Scholar] [CrossRef]
  3. Matveeva, I.A.; Shashkova, T.; Kotova, V.; Stankevich, O.; Zaichenko, L.; Kondratev, N.V.; Ovechkis, Y.N.; Elkhov, V.A.; Pautova, L.V. Features of using photocurable acrylic composition to create the immersion-formed layer for lenticular lenses. Polym. Sci. Ser. D 2016, 9, 123–132. [Google Scholar] [CrossRef]
  4. Lee, E.K.; Park, C.H.; Lee, J.; Lee, H.R.; Yang, C.; Oh, J.H. Chemically Robust Ambipolar Organic Transistor Array Directly Patterned by Photolithography. Adv. Mater. 2017, 29. [Google Scholar] [CrossRef] [PubMed]
  5. Lin, D.; Jin, S.; Zhang, F.; Wang, C.; Wang, Y.; Zhou, C.; Cheng, G.J. 3D stereolithography printing of graphene oxide reinforced complex architectures. Nanotechnology 2015, 26, 43. [Google Scholar] [CrossRef] [PubMed] [Green Version]
  6. Crivello, J.V.; Reichmanis, E. Photopolymer Materials and Processes for Advanced Technologies. Chem. Mater. 2014, 26, 533–548. [Google Scholar] [CrossRef]
  7. Decker, C. Photoinitiated Crosslinking Photopolymerization. Prog. Polym. Sci. 1996, 21, 593–650. [Google Scholar] [CrossRef]
  8. Fouassier, J.P.; Rabek, J.F. Radiation Curing in Polymer Science and Technology; Springer: Berlin, Germany, 1993. [Google Scholar]
  9. Yagci, Y.; Jockusch, S.; Turro, N.J. Photoinitiated Polymerization: Advances, Challenges, and Opportunities. Macromolecules 2010, 43, 6245–6260. [Google Scholar] [CrossRef]
  10. Li, Z.; Chen, H.; Wang, C.; Chen, L.; Liu, J.; Liu, R. Efficient Photopolymerization of Thick Pigmented Systems Using Upconversion Nanoparticles-Assisted Photochemistry. J. Polym. Sci. Part A Polym. Chem. 2018, 56, 994–1002. [Google Scholar] [CrossRef]
  11. Moniruzzaman, M.; Winey, K.I. Polymer Nanocomposites Containing Carbon Nanotubes. Macromolecules 2006, 39, 5194–5205. [Google Scholar] [CrossRef]
  12. Kinloch, I.A.; Suhr, J.; Lou, J.; Young, R.J.; Ajayan, P.M. Composites with carbon nanotubes and graphene: An outlook. Science 2018, 362, 547–553. [Google Scholar] [CrossRef] [PubMed] [Green Version]
  13. Silva, M.; Alves, N.M.; Paiva, M.C. Graphene-polymer nanocomposites for biomedical applications. Polym. Adv. Technol. 2018, 29, 687–700. [Google Scholar] [CrossRef]
  14. Jeong, Y.G.; An, J.E. UV-cured epoxy/graphene nanocomposite films: Preparation, structure and electric heating performance. Polym. Int. 2014, 63, 1895–1901. [Google Scholar] [CrossRef]
  15. Martin-Gallego, M.; Verdejo, R.; Lopez-Manchado, M.A.; Sangermano, M. Epoxy-Graphene UV-cured nanocomposites. Polymer 2011, 52, 4664–4669. [Google Scholar] [CrossRef] [Green Version]
  16. Yu, B.; Wang, X.; Xing, W.; Yang, H.; Wang, X.; Song, L. Enhanced thermal and mechanical properties of functionalized graphene/thiolene systems by photopolymerization technology. Chem. Eng. J. 2013, 228, 318–326. [Google Scholar] [CrossRef] [Green Version]
  17. Fabbri, P.; Valentini, L.; Bon, L.B.; Foix, D.; Pasquali, L.; Montecchi, M.; Sangermano, M. In-situ graphene oxide reduction during UV-photopolymerization of graphene oxide/acrylic resins mixtures. Polymer 2012, 53, 6039–6044. [Google Scholar] [CrossRef]
  18. Pei, S.; Cheng, H.M. The reduction of graphene oxide. Carbon 2012, 50, 3210–3228. [Google Scholar] [CrossRef]
  19. Krutkramelis, K.; Xia, B.; Oakey, J. Monodisperse polyethylene glycol diacrylate hydrogel microsphere formation by oxygen-controlled photopolymerization in a microfluidic device. Lab Chip 2016, 16, 1457–1465. [Google Scholar] [CrossRef]
  20. Sangermano, M.; Marchi, S.; Valentini, L.; Bon, S.B.; Fabbri, P. Transparent and conductive graphene oxide/poly (ethylene glycol) diacrylate coatings obtained by photopolymerization. Macromol. Mater. Eng. 2011, 296, 401–407. [Google Scholar] [CrossRef]
  21. Liu, H.; Ryu, S.; Chen, Z.; Steigerwald, M.L.; Nuckolls, C.; Brus, L.E. Photochemical Reactivity of Graphene. J. Am. Chem. Soc. 2009, 131, 17099–17101. [Google Scholar] [CrossRef] [Green Version]
  22. Yunming Ying, Y.; Saini, R.K.; Liang, F.; Sadana, A.K.; Billups, W.E. Functionalization of Carbon Nanotubes by Free Radicals. Org. Lett. 2003, 5, 1471–1473. [Google Scholar] [CrossRef] [PubMed]
  23. Georgakilas, V.; Bourlinos, A.; Gournis, D.; Tsoufis, T.; Trapalis, C.; Mateo Alonso, A.; Prato, M. Multi-Purposed Organically Modified Carbon Nanotubes: From functionalization to nanotube composites. J. Am. Chem. Soc. 2008, 130, 8733–8740. [Google Scholar] [CrossRef] [PubMed]
  24. Ligon-Auer, S.C.; Schwentenwein, M.; Gorsche, C.; Stampfl, J.; Liska, R. Toughening of photo-curable polymer networks: A review. Polym. Chem. 2016, 7, 257. [Google Scholar] [CrossRef]
  25. Ligon, S.C.; Husár, B.; Wutzel, H.; Holman, R.; Liska, R. Strategies to Reduce Oxygen Inhibition in Photoinduced Polymerization. Chem. Rev. 2014, 114, 557–589. [Google Scholar] [CrossRef]
Figure 1. The sample preparation process and the photos of the final products of a transparent neat poly(ethylene glycol)diacrylate (PEGDA) polymer (upper) and PEGDA/carbon nanofiller black opaque thin film (lower).
Jcs 04 00004 g001
Figure 2. Scanning electron microscopy (SEM) images from the internal space of (a) PEGDA/graphene, (b) PEGDA/carbon nanotubes (CNTs), (c) PEGDA/Hybrid 70/30, and (d) PEGDA/fCNTs polymer composites. (e,g) The smooth surface of the polymer composite films and the appearance of nanofillers in cross-sections. (f) Sample of polymer composite, where the surface is partly removed, revealing the difference between the smooth surface and the rough internal. (h) The smooth surface and a cross-section of neat PEGDA polymer. The nanofiller percentage in all reinforced samples was 8.5% w/w.
Jcs 04 00004 g002
Figure 3. (a) Fourier transform infrared (FT-IR) spectra of neat PEGDA before and after ultraviolet (UV) curing. (b) The % DBC (double bond conversion) of neat PEGDA as a function of the film thickness.
Jcs 04 00004 g003
Figure 4. % DBC of the reinforced PEGDA composites in several mass percentages.
Jcs 04 00004 g004
Figure 5. The σs of (a) PEGDA/graphene, (b) PEGDA/CNTs, (c) PEGDA/Hybrid, and (d) PEGDA/fCNTs composites as a function of carbon nanofiller percentage.
Jcs 04 00004 g005
Figure 6. σt measurements of PEGDA/carbon nanofiller composites in several mass percentage according to Table 3.
Jcs 04 00004 g006
Table 1. Carbon nanofillers and their mass percentages (% w/w) in the as-prepared polymer composites.
Carbon NanofillersGraphene M25CNTsHybrid 70/30 Graphene M25/CNTsfCNTs
Mass
percentage
% w/w
1.51.51.51.5
2.52.52.52.5
4.54.54.54.5
7.57.57.57.5
8.58.58.58.5
Table 2. The σs of PEGDA/carbon nanofiller composites in various carbon nanofiller percentage.
σs (S·m−1)
w/wGraphene M25CNTsHybrid 70/30fCNTs
10000
1.500.81 (0.37)1.23 × 10⁻³ (7.5 × 10⁻⁴)0
2.500.55 (0.13)7.75 × 10⁻³ (0.006)7.75 × 10⁻⁶ (6.5 × 10⁻⁶)
4.50.12 (0.06)0.90 (0.44)0.16 (0.09)8.75 × 10⁻³ (0.013)
7.50.18 (0.05)7.88 (2.05)6.83 (1.51)1.66 (0.42)
8.56.31 (0.71)13.1 (0.65)12.3 (0.52)2.94 (0.19)
Table 3. The σt of PEGDA/carbon nanofiller composites in several carbon nanofiller percentages.
σt (S·m−1)
% w/wGraphene M25CNTsHybrid 70/30fCNTs
01.88 × 10−71.88 × 10−71.88 × 10−71.88 × 10−7
1.52.17 × 10−73.63 × 10−66.88 × 10−72.86 × 10⁻⁶
2.53.16 × 10−74.01 × 10−64.78 × 10−52.15 × 10⁻⁶
4.59.88 × 10−53.70 × 10−45.08 × 10−52.71 × 10⁻⁶
7.51.40 × 10−53.75 × 10−58.71 × 10−55.89 × 10⁻⁵
8.53.25 × 10−34.87 × 10−33.39 × 10−42.38 × 10⁻⁵

