1. Introduction
Fiber-reinforced plastics (FRP) provide excellent mass specific stiffness and strength and are therefore used in a wide range of industrial applications, e.g., in aeronautic, space, and automotive sectors. Due to their inhomogeneous and anisotropic nature, the damage behavior of FRP is complex and requires different modeling strategies compared to metals. Damage and failure in FRP is a multi-scale phenomenon: In a laminate made of several unidirectional (UD) plies with different fiber orientations, matrix damage initiates in the transversally loaded plies [
1]. This matrix cracking can be traced back to the failure of the fiber-matrix-interface and a resulting fiber-matrix-debonding. When increasing the load, the debonded areas coalesce to form a through-ply matrix crack [
1]. The properties of the fiber-matrix-interface, tailored by the fiber’s surface treatment, may have a high impact on the stress transfer between fiber and matrix and on the damage initiation, as concluded in the review by Jones [
2]. This leads to the conclusion that the interface influences the effective properties of the composite (e.g., [
3,
4]).
As the micromechanical damage mechanism in transversally loaded UD plies is a key aspect of the damage of laminates, researchers have focused on the modeling of these phenomena in recent years (e.g., [
5,
6,
7,
8,
9,
10,
11,
12,
13,
14,
15,
16]). While having insight into the micro-scale damage mechanisms, micromechanical modeling is used for predicting the composite stiffnesses and strengths of FRP based on the known material behavior of the fibers and the matrix. Different homogenization techniques are available for the micromechanical modeling of heterogeneous materials and to obtain an effective response influenced by the specific microstructure. Micromechanical homogenization techniques and its application to composite materials are reviewed by [
17]. The application of mathematical homogenization is discussed in [
18] and the mathematical asymptotic homogenization technique is applied to FRP by [
19]. Most approaches to model the progressive damage behavior on the micro-scale are based on numerical homogenization that use the finite element method (FEM) and the representative volume element (RVE) approach.The more general numerical homogenization allows the application to every material model without the need to re-derive the homogenization equations for each material model and, therefore, is also used within the presented study.
The current micromechanical simulations (e.g., [
5,
6,
7,
8,
9,
10,
11,
12,
13,
14,
15,
16]) yield the highest stresses at the fiber-matrix-interface. Consequently, the damage initiates at these interfaces. Simulations by Asp [
6] reveal that the exact position of the damage initiation regarding the fiber circumference depends on the fiber-to-fiber-distance which is related to the fiber volume fraction and the local fiber distribution [
20]. For transversally loaded FRP the matrix behavior highly influences the global composite response. Thus, one challenging aspect of the micromechanical simulation is the modeling of the constitutive and damage behavior of the polymeric matrix. The behavior of polymers is characterized by nonlinearity and a different behavior in tension, compression and shear (e.g., [
21]). Assuming the matrix behavior to be linear-elastic and isotropic yields reasonably good prediction results for the micro-scale damage and the effective response of UD composites under transverse tension load [
5,
6,
14,
22,
23,
24]. Composites tend to behave more nonlinearly when loaded under transverse compression and shear. Additionally, the absolute transverse stresses differ depending on whether the composite is subjected to a tensile or compressive loading. To predict the composite behavior, it thus seems relevant to incorporate both the nonlinearity as well as the tension/compression-asymmetry of the pure resin. For modeling these material characteristics, plasticity [
7,
8,
9,
10,
11,
25,
26], visco-elasticity [
15] and visco-plasticity [
12,
13,
27,
28] are used in recent micromechanical simulations of FRP. In addition to the plastic deformations [
29,
30], nonlinear-elastic and viscous effects also contribute to the stress–strain behavior of polymeric resins [
15,
28,
29]. Haupt [
31] provides a schematic illustration of the effects of (non)linear elasticity, plasticity and rate-dependency on the stress–strain behavior. It is also illustrated that nonlinearity can also arise from (nonlinear) elasticity and is not necessarily a result of plasticity. Haupt [
31] suggests an experimental program to differentiate the named effects. In addition to the monotonic tests, this includes several additional test types like intermediate relaxation tests. As the proposed test program is very costly, only Kästner [
28] and Krause [
15] characterize the resin in such a way that the various material effects—(non)linear elasticity, plasticity, rate-dependent behavior—can be differentiated. In most cases, only monotonic tests are conducted and the nonlinearity observed in the stress-strain-curves of the pure resin material is attributed completely to plastic effects and is modeled with pressure-dependent elasto-plastic material models. As the different material effects cannot be differentiated from the monotonic tests alone [
31], the assumption that the nonlinearity of the resin is purely elastic in nature is just as valid as the assumption that the nonlinearity is entirely due to plastic effects.
Plasticity models are numerically more complex and expensive than elastic models. Additionally to the global iteration steps needed for simulating nonlinear material behavior, extra iterations are needed on an integration point basis when using common plastic material models.Therefore, a pure elastic constitutive modeling can offer advantages concerning computation time and numerical convergence.
Up to now, the nonlinearity and the tension/compression-asymmetry of the constitutive resin behavior are not captured by the purely elastic models that are used for predicting the behavior of UD composites [
5,
6,
14,
22,
23,
24]. In the present contribution a purely elastic model is presented that captures the nonlinearity and the tension/compression-asymmetry by a strain-depended and orthotropic constitutive formulation. To assess the predictive capability of this modeling approach, micromechanical FEM simulations of UD composites with focus on matrix-dominated load cases are conducted. The simulation results are compared to experimental data and the prediction error of the micromechanical simulation is compared to that of other models from the literature. The investigation is performed using a carbon fiber-reinforced plastic (CFRP) made of IM7-fiber and an epoxy resin.
3. Micromechanical Modeling Using a Representative Volume Element
For the FEM simulations, the microstructure of the UD composite is in this work simplified to be a regular, hexagonal array despite the actually randomized fiber arrangement. This approach is used by many researchers [
9,
12,
25,
26,
28]. In contrast to randomized fiber arrangements, the RVE size of regular arrangements can be chosen significantly smaller and there is no need for statistically validating the simulation results as there is no statistic variation of the geometry.
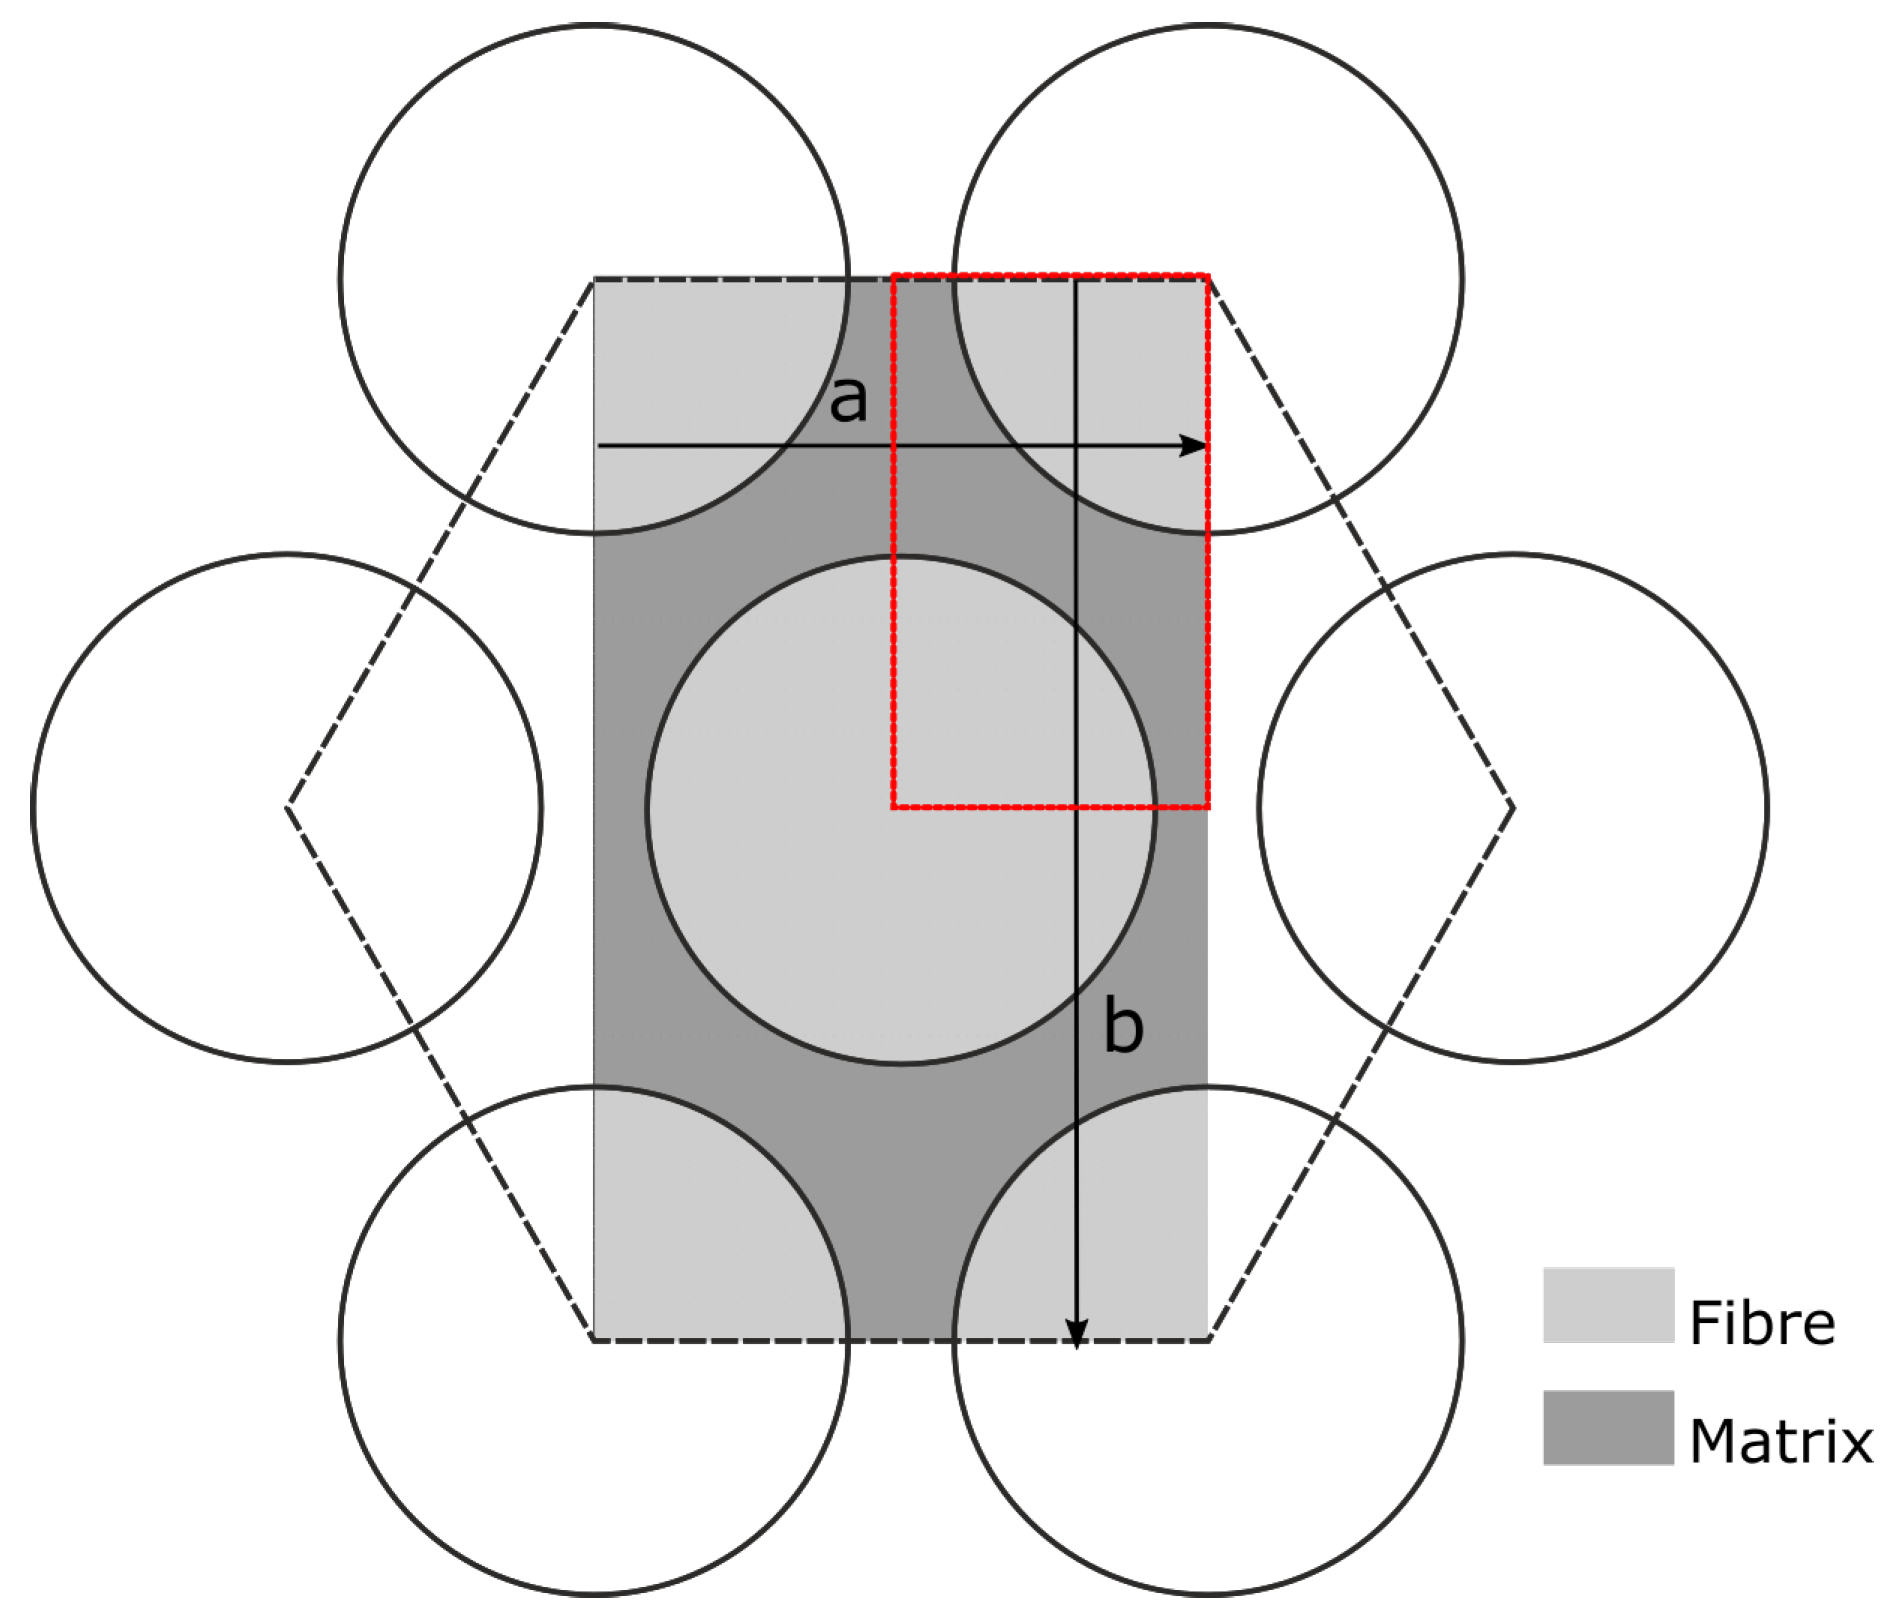
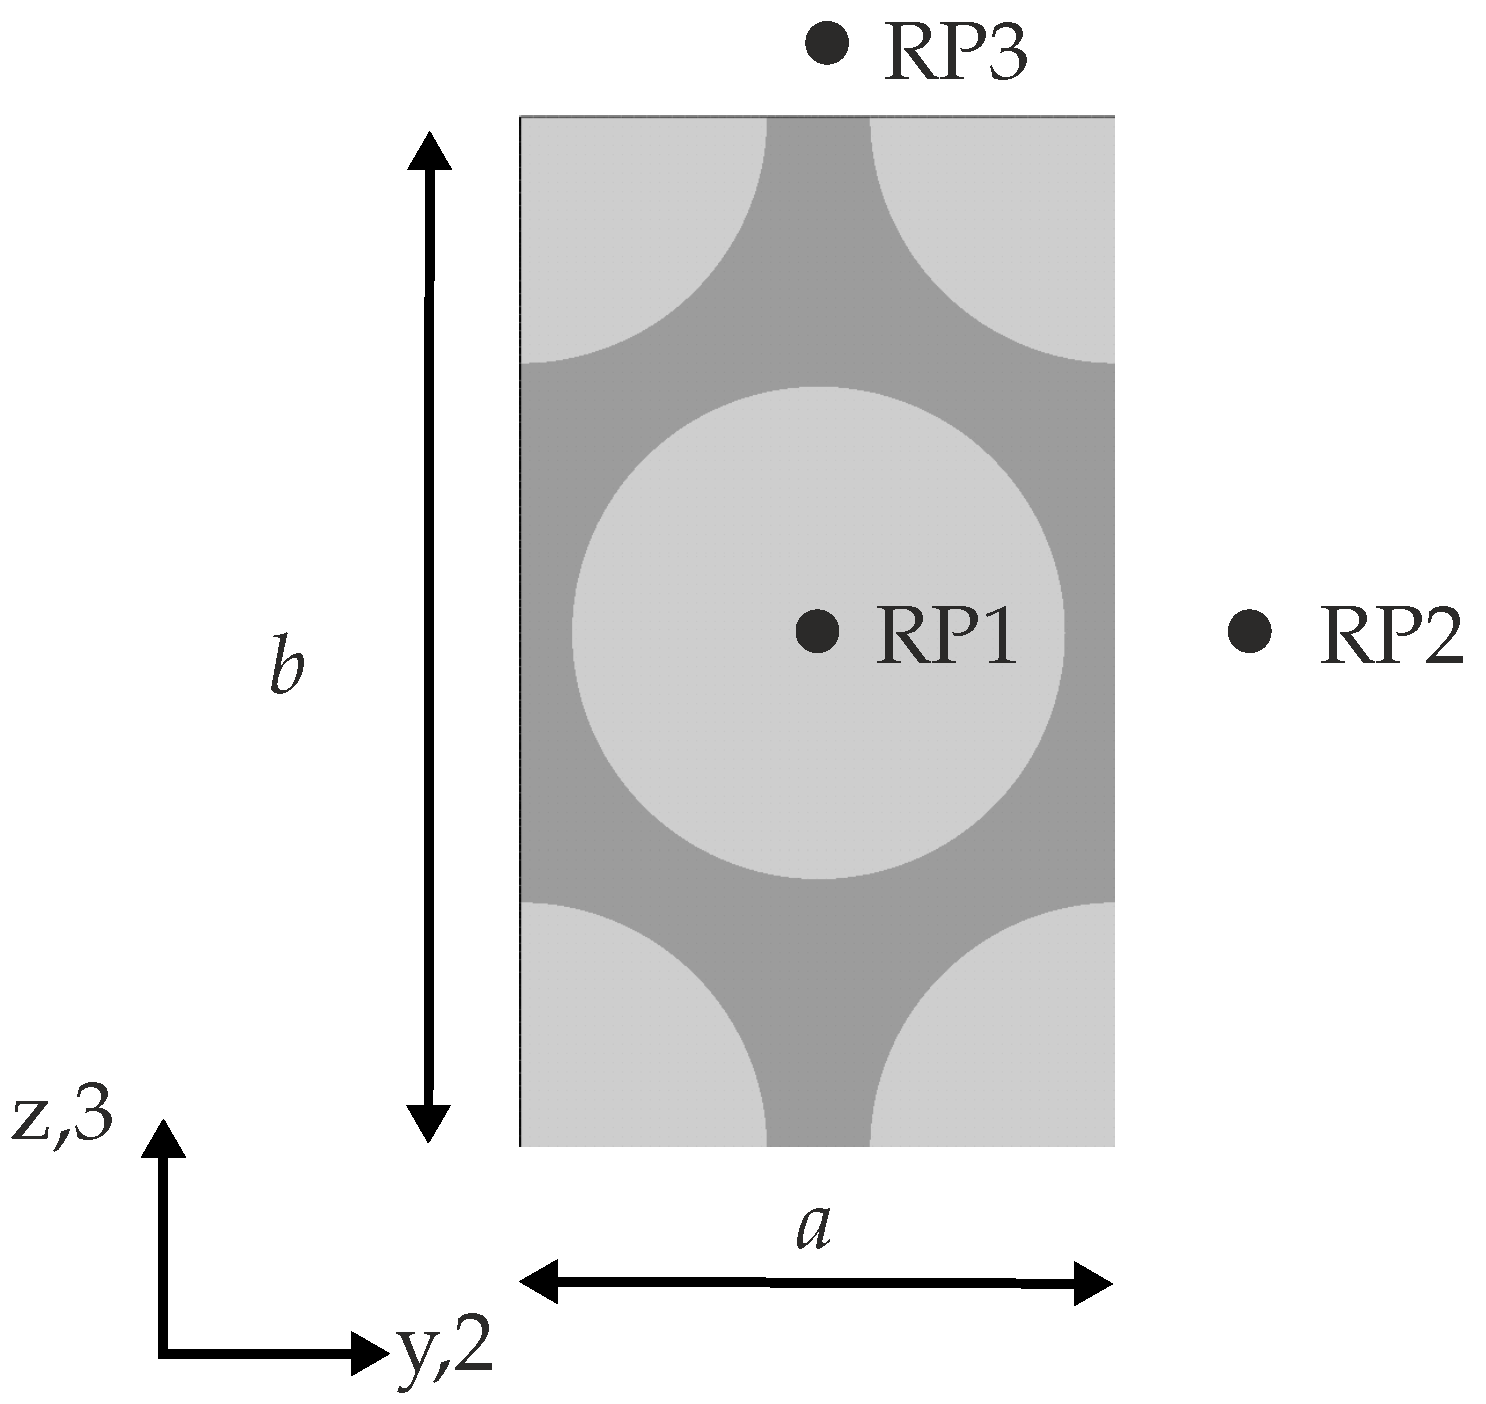
Figure 6 shows a regular hexagonal fiber arrangement and the resulting RVE model with a fiber volume fraction (FVF) of 62%. Since periodic boundary conditions are applied, using the implementation by [
15] (a short description is given in
Appendix A), the model is not reduced to the smallest representative unit (red border). Instead, the hexagonal RVE consists of four unit cells.
With the fiber diameter of the IM7-fiber (
= 5.2
m) and the fiber volume fraction (62%) the outer dimensions
a and
b of the hexagonal RVE are obtained from
For meshing, 8-node brick elements with reduced integration are used. 180 elements around the fiber circumference has proven to be a suitable compromise between accuracy and computation time. This results in an element size of 0.9 m, which is also given for the meshing of the matrix. The dimension c of the hexagonal RVE in the fiber direction is equal to the thickness of three elements, which is 2.7 m.
Due to the symmetrical morphology of the hexagonal fiber arrangement, a symmetrical load—such as transverse tension or transverse compression—produces a symmetrical stress distribution in the matrix. This leads to damage initiation at all geometrically critical positions and to a symmetric crack pattern. To trigger the development of experimentally observed pronounced cracks [
35] also in the simulation, model imperfections need to be incorporated. Please note that this would not be necessary for irregular fiber arrangements. For the regular hexagonal RVE this imperfection is introduced by a variation of the matrix strength in the range of ±2% over all material points.
5. Micromechanical Stiffness and Strength Prediction
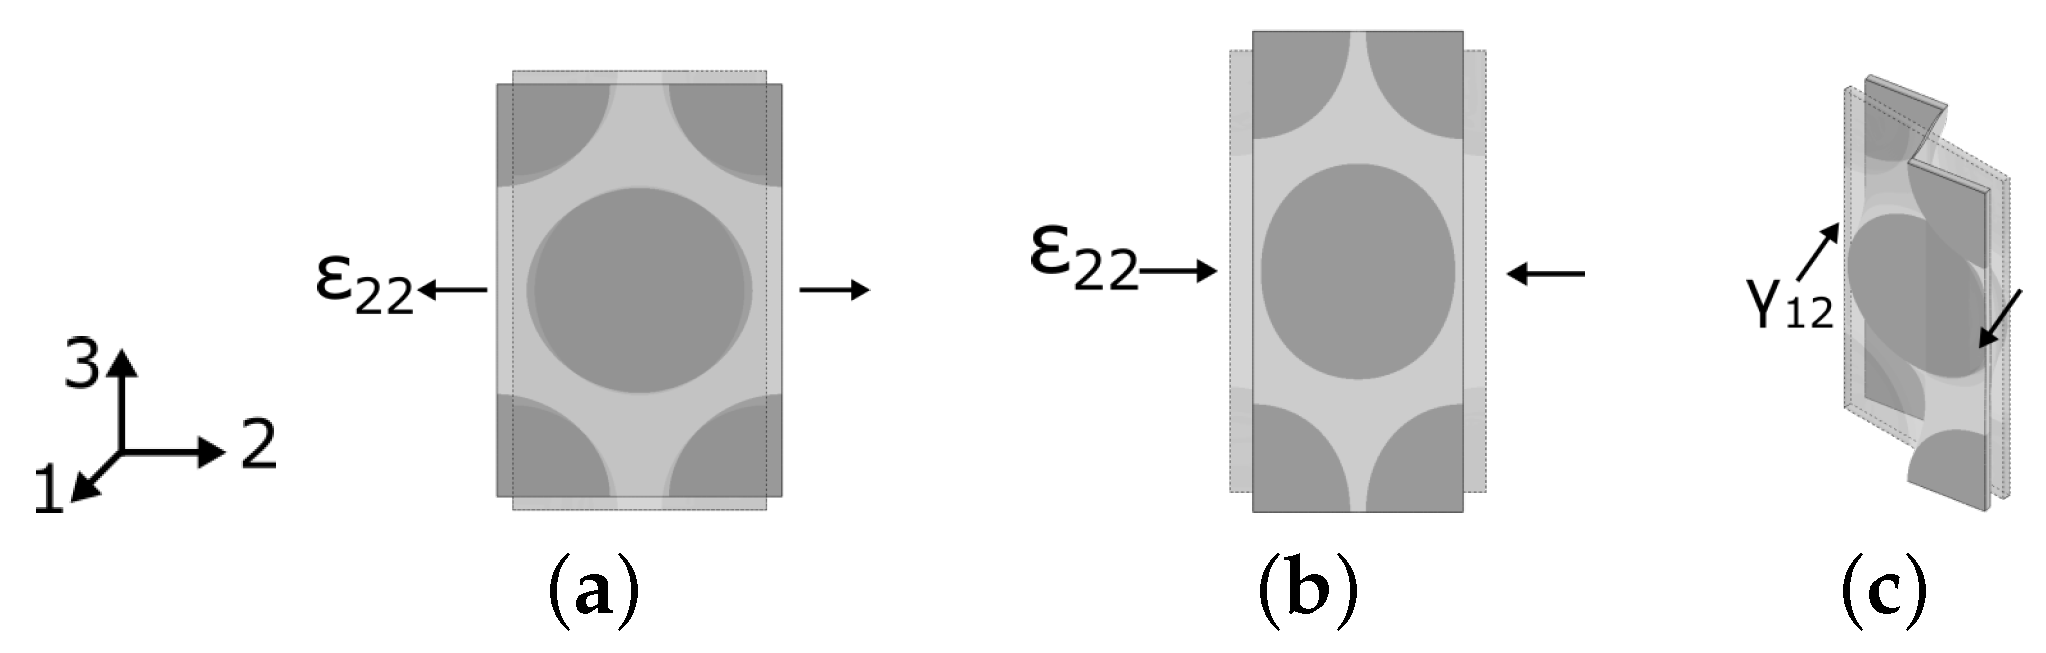
The ability of the proposed micromechanical model to predict the effective composite behavior is verified for the load cases shown in
Figure 10. Under transverse tension, transverse compression and
12-shear the matrix behavior has a significant influence on the effective composite behavior. Therefore, they are suitable test cases for the assessment of the matrix modeling approach. Additionally, experimental data are available for these load cases (
Section 2) and provide a validation data base.
The simulations are performed quasi-static (without considering inertial forces) and using an implicit solver. The load is applied to the RVE as a global strain condition. Details about applying this global strain condition and about the extraction of the effective composite stress from the micromechanical simulations results can be found in
Appendix A.
For the simulation of the transverse tension load case, convergence is achieved without a viscous regularization. For transverse compression and 12-shear, the viscosity parameter must be set to = 0.1 or = 0.01, respectively.
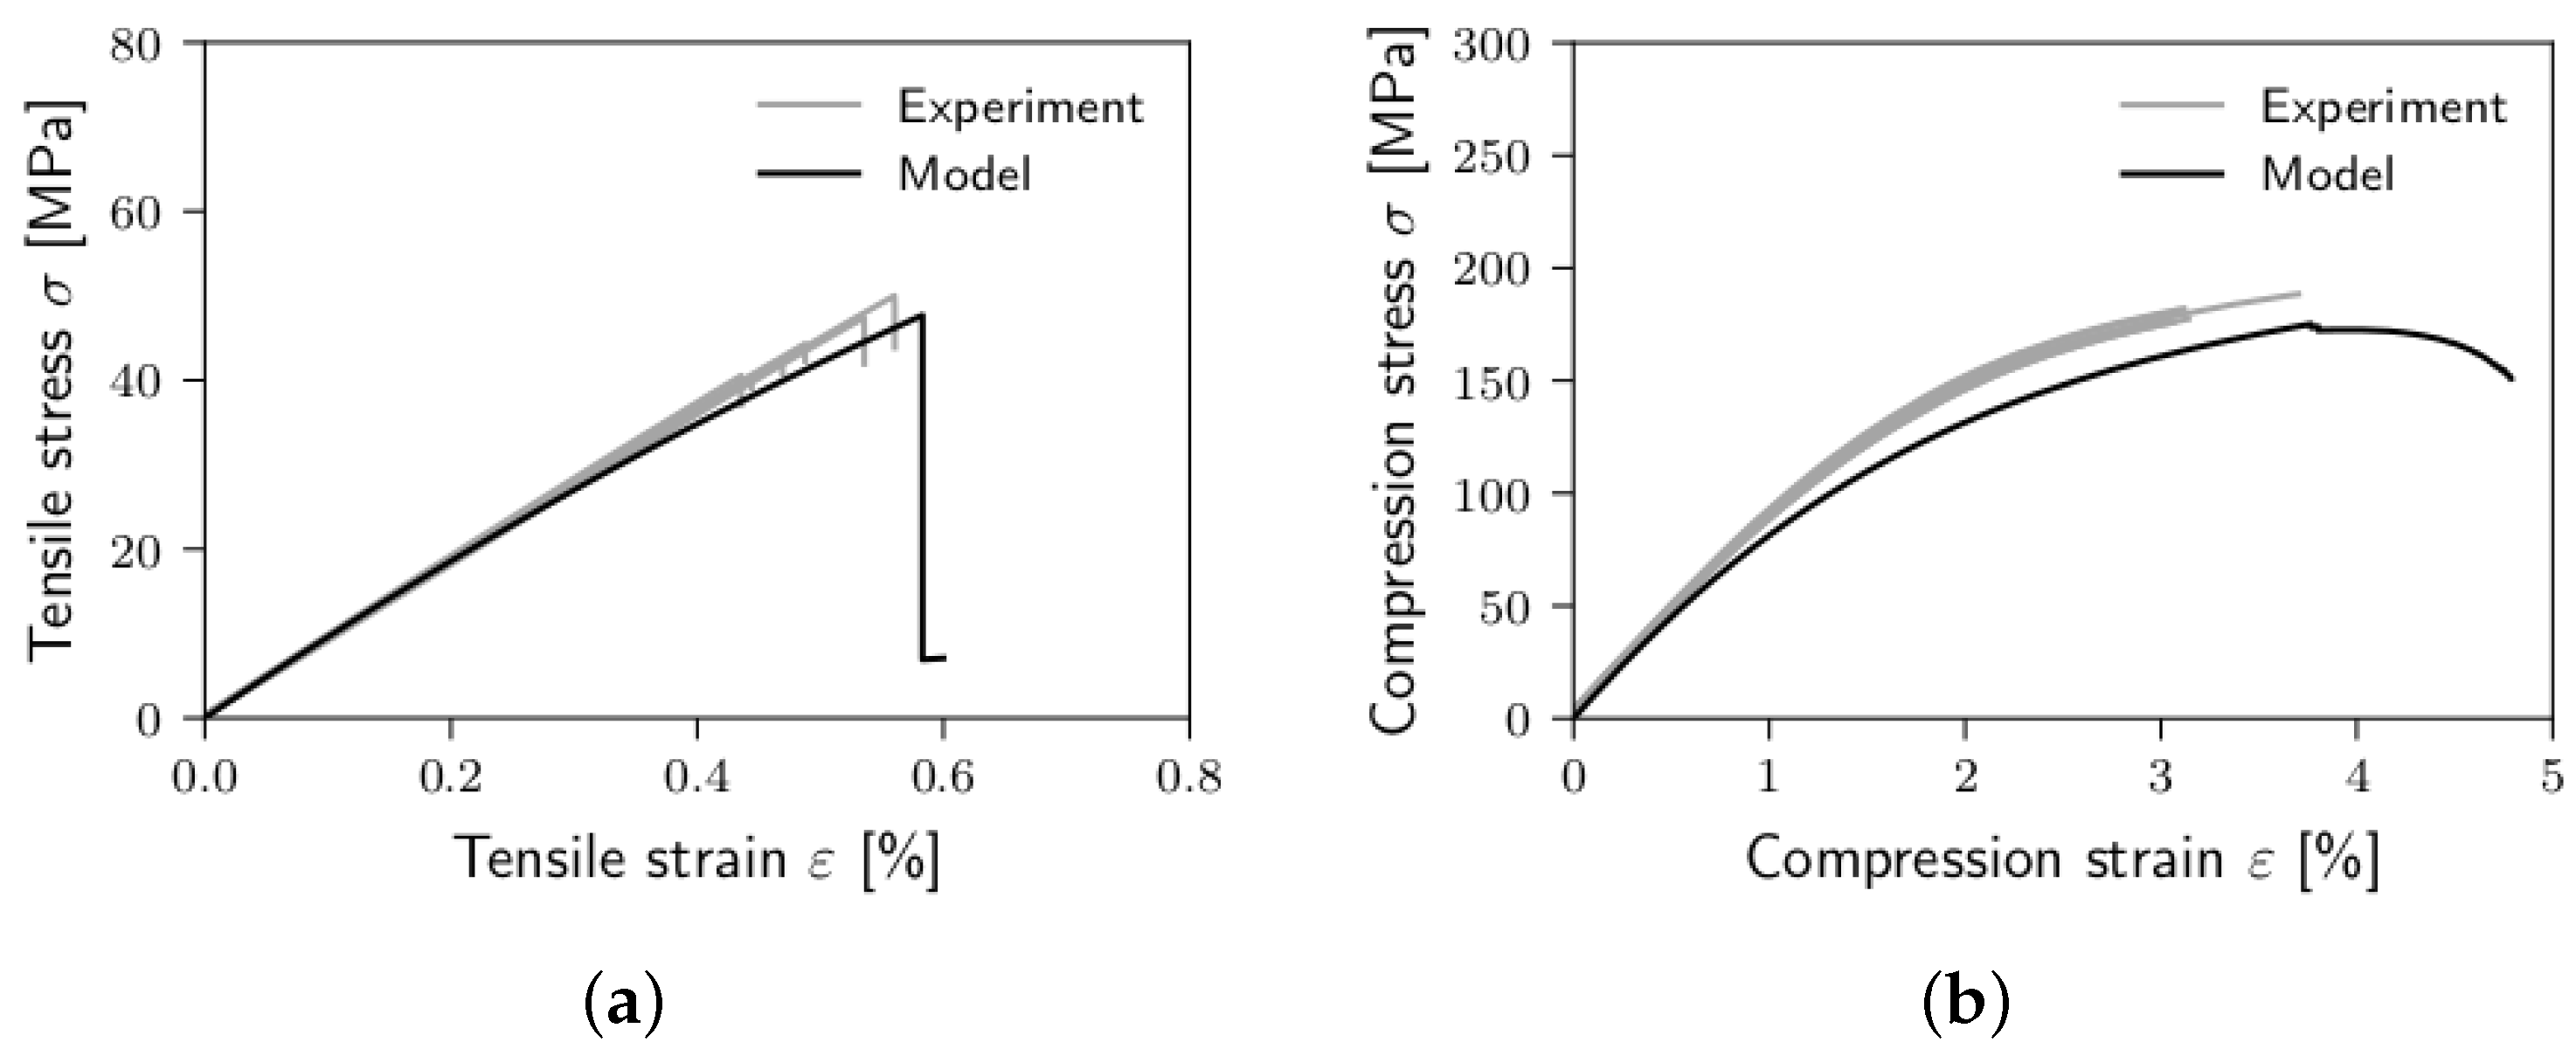
The micromechanical prediction of the effective transverse behavior of the composite is graphically compared to the experiments in
Figure 11. The figure shows the obtained effective (global) composite stress composite versus the effective (global) composite strain. The same is given for
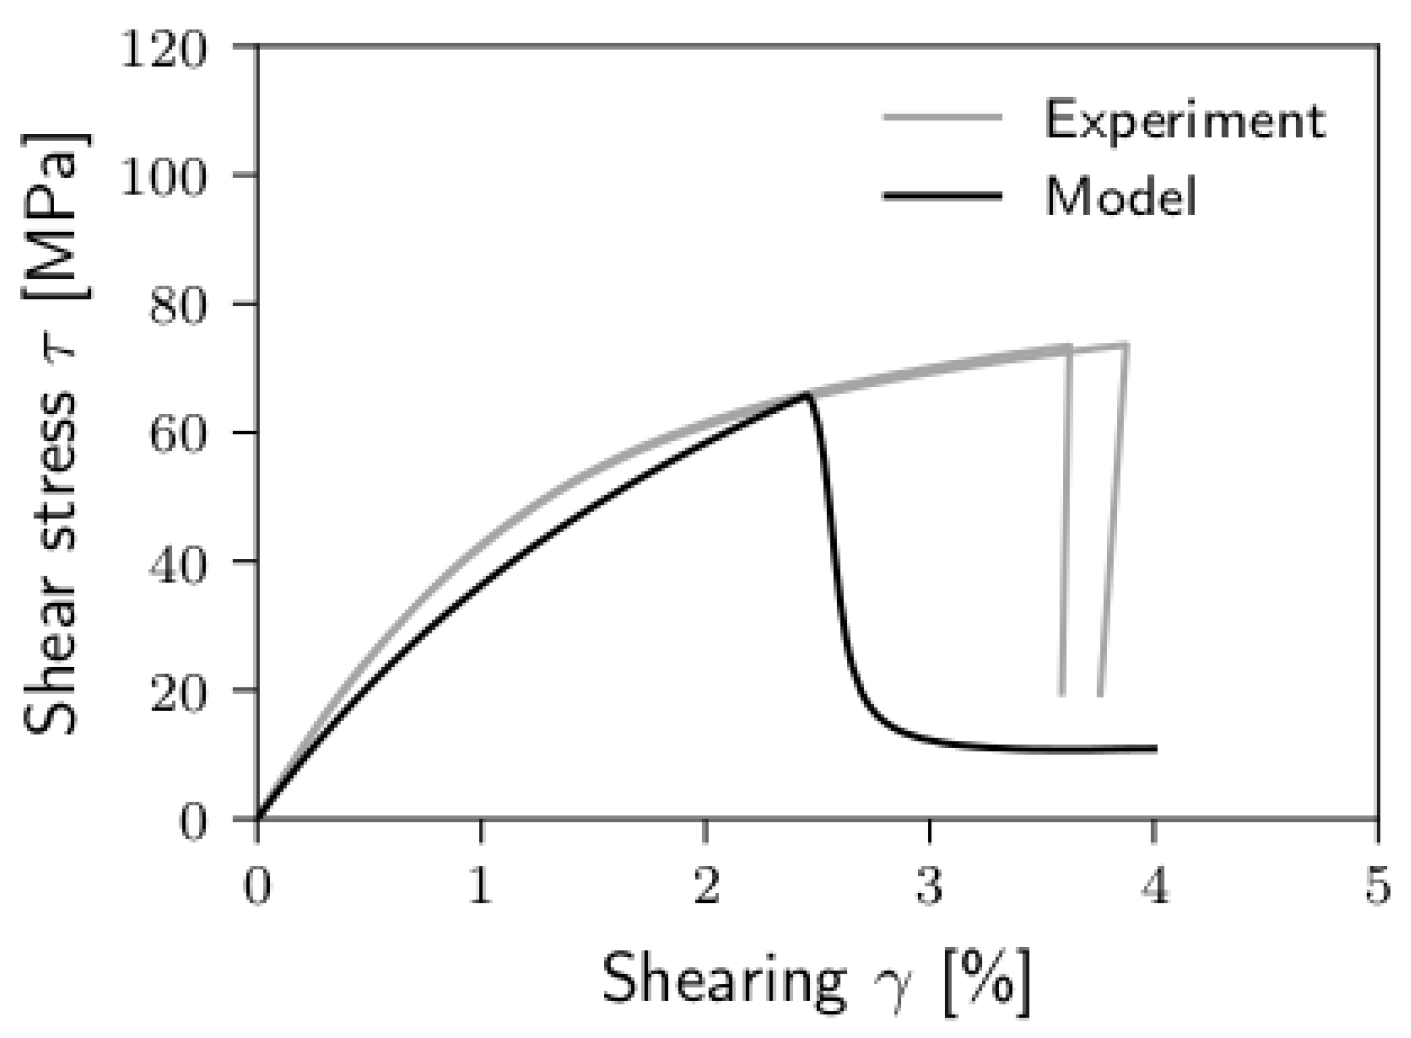
12-shear in
Figure 12. The predicted and measured composite properties and the relative errors of the predictions are given in
Table 4.
Quantitative assessment of the prediction quality of micromechanical simulations is often limited to the error calculation for the composite properties as initial moduli, strengths and failure strains.
To evaluate the prediction quality for the overall nonlinear stress–strain behavior of the composite, at 100 discrete strain points within the strain range of the stress-strain-curves, the relative error of the corresponding simulated stress to the average experimental stress is calculated. This point-wise evaluation is done for the pre-damage part of the stress-strain-curve and is limited to the strain range which is covered by both simulation and experiment. In
Table 4 the mean and maximum value of these point-wise evaluated relative errors is given for each load case by their amounts.
The initial moduli are captured well for all load cases. The maximum relative error of 12% is obtained for the 12-shear modulus. The nonlinearity of the stress–strain behavior is systematically overestimated for transverse tension and transverse compression.
The best fit of the experimentally and the numerically obtained stress-strain-curves is obtained for transverse tension. The relative mean and maximum deviation of the numerical and experimental curves are quite low (3% and 8%, resp.). The deviation is higher for transverse compression behavior and for the
12-shear load case, ref.
Table 4, but the model prediction is still within an acceptable range (maximum error of 18%).
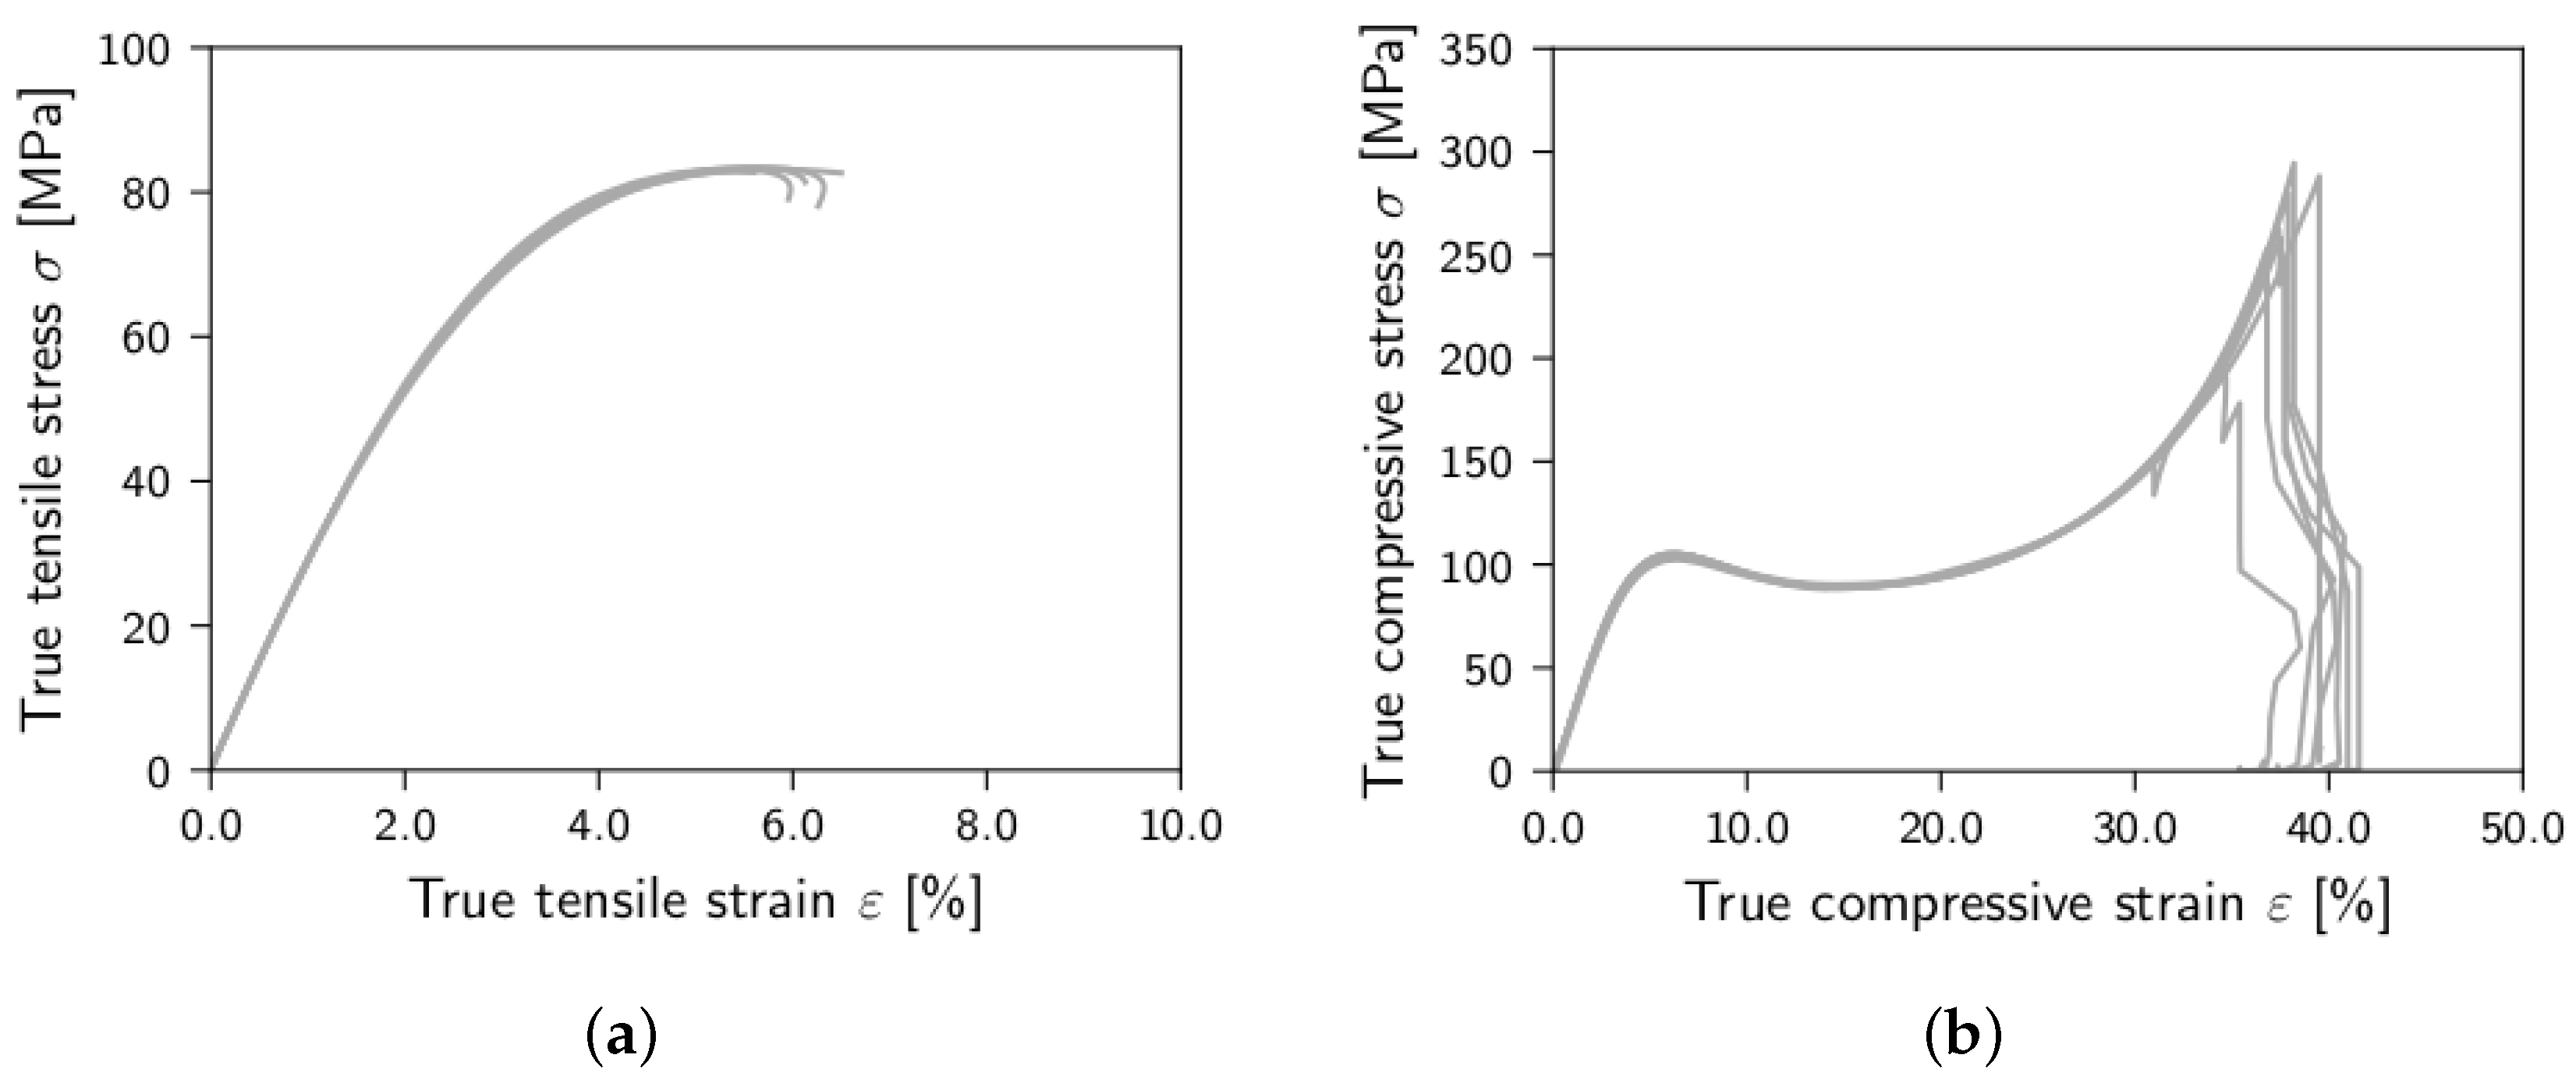
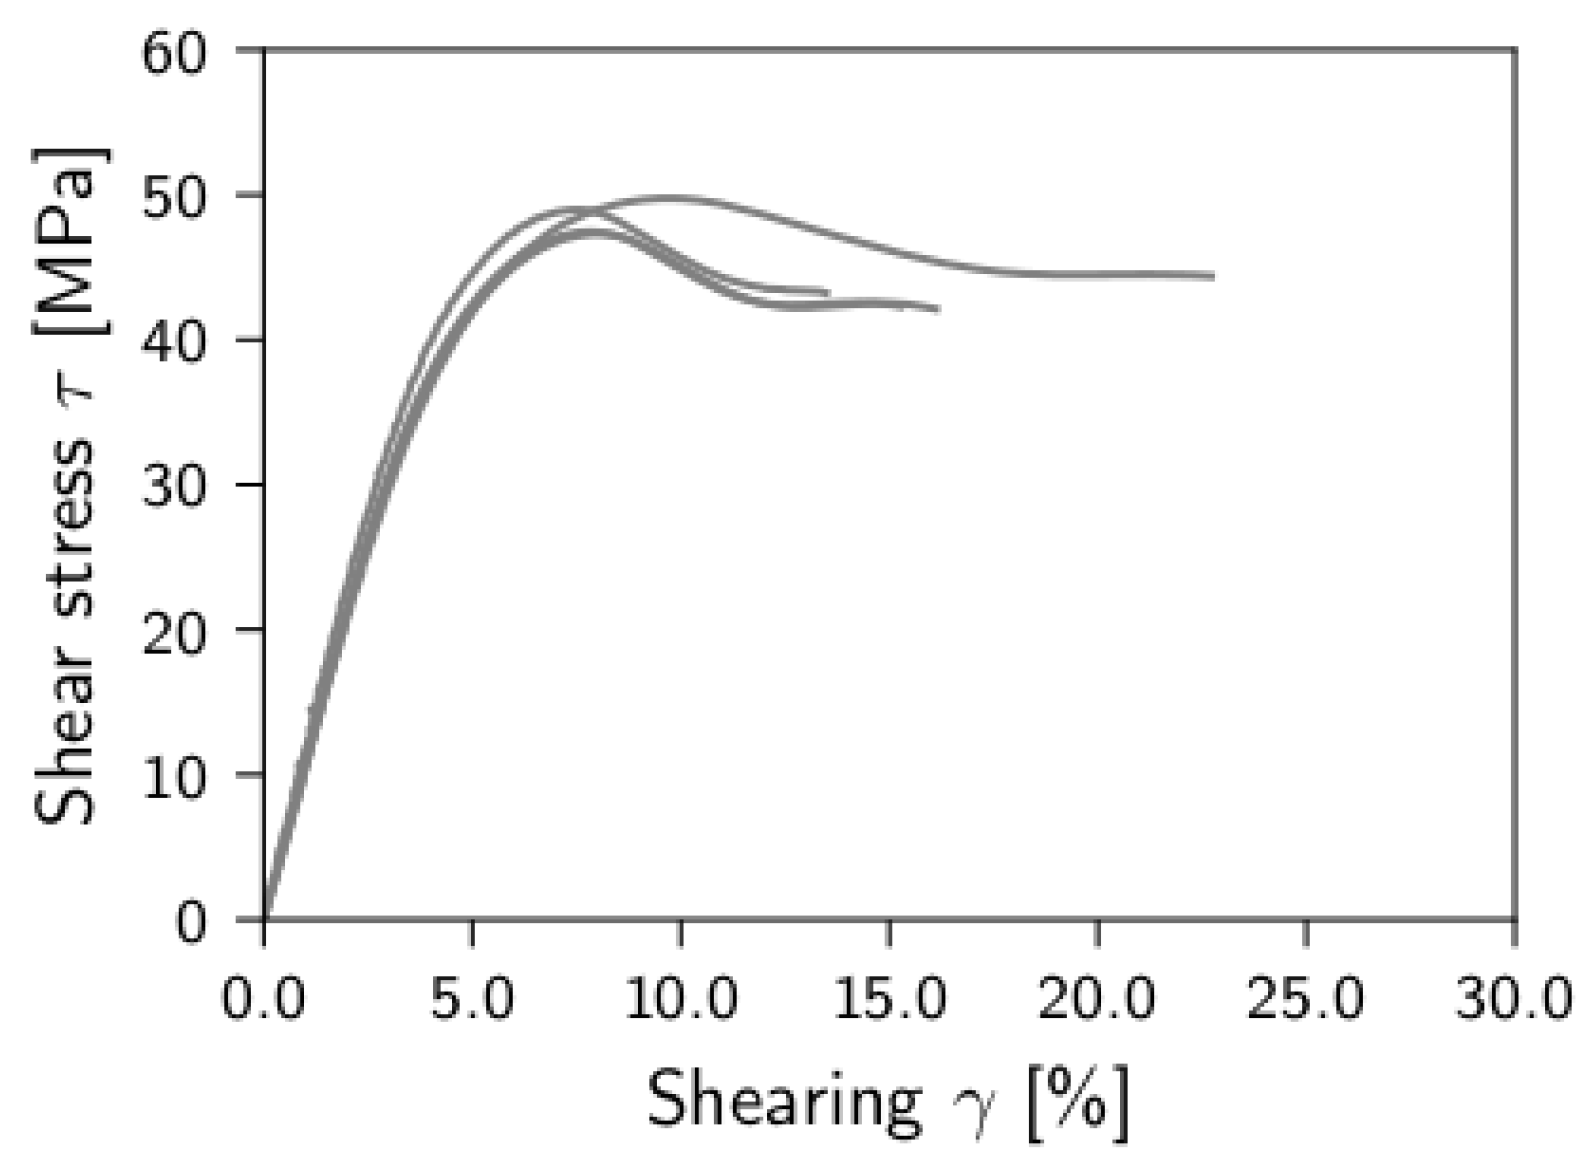
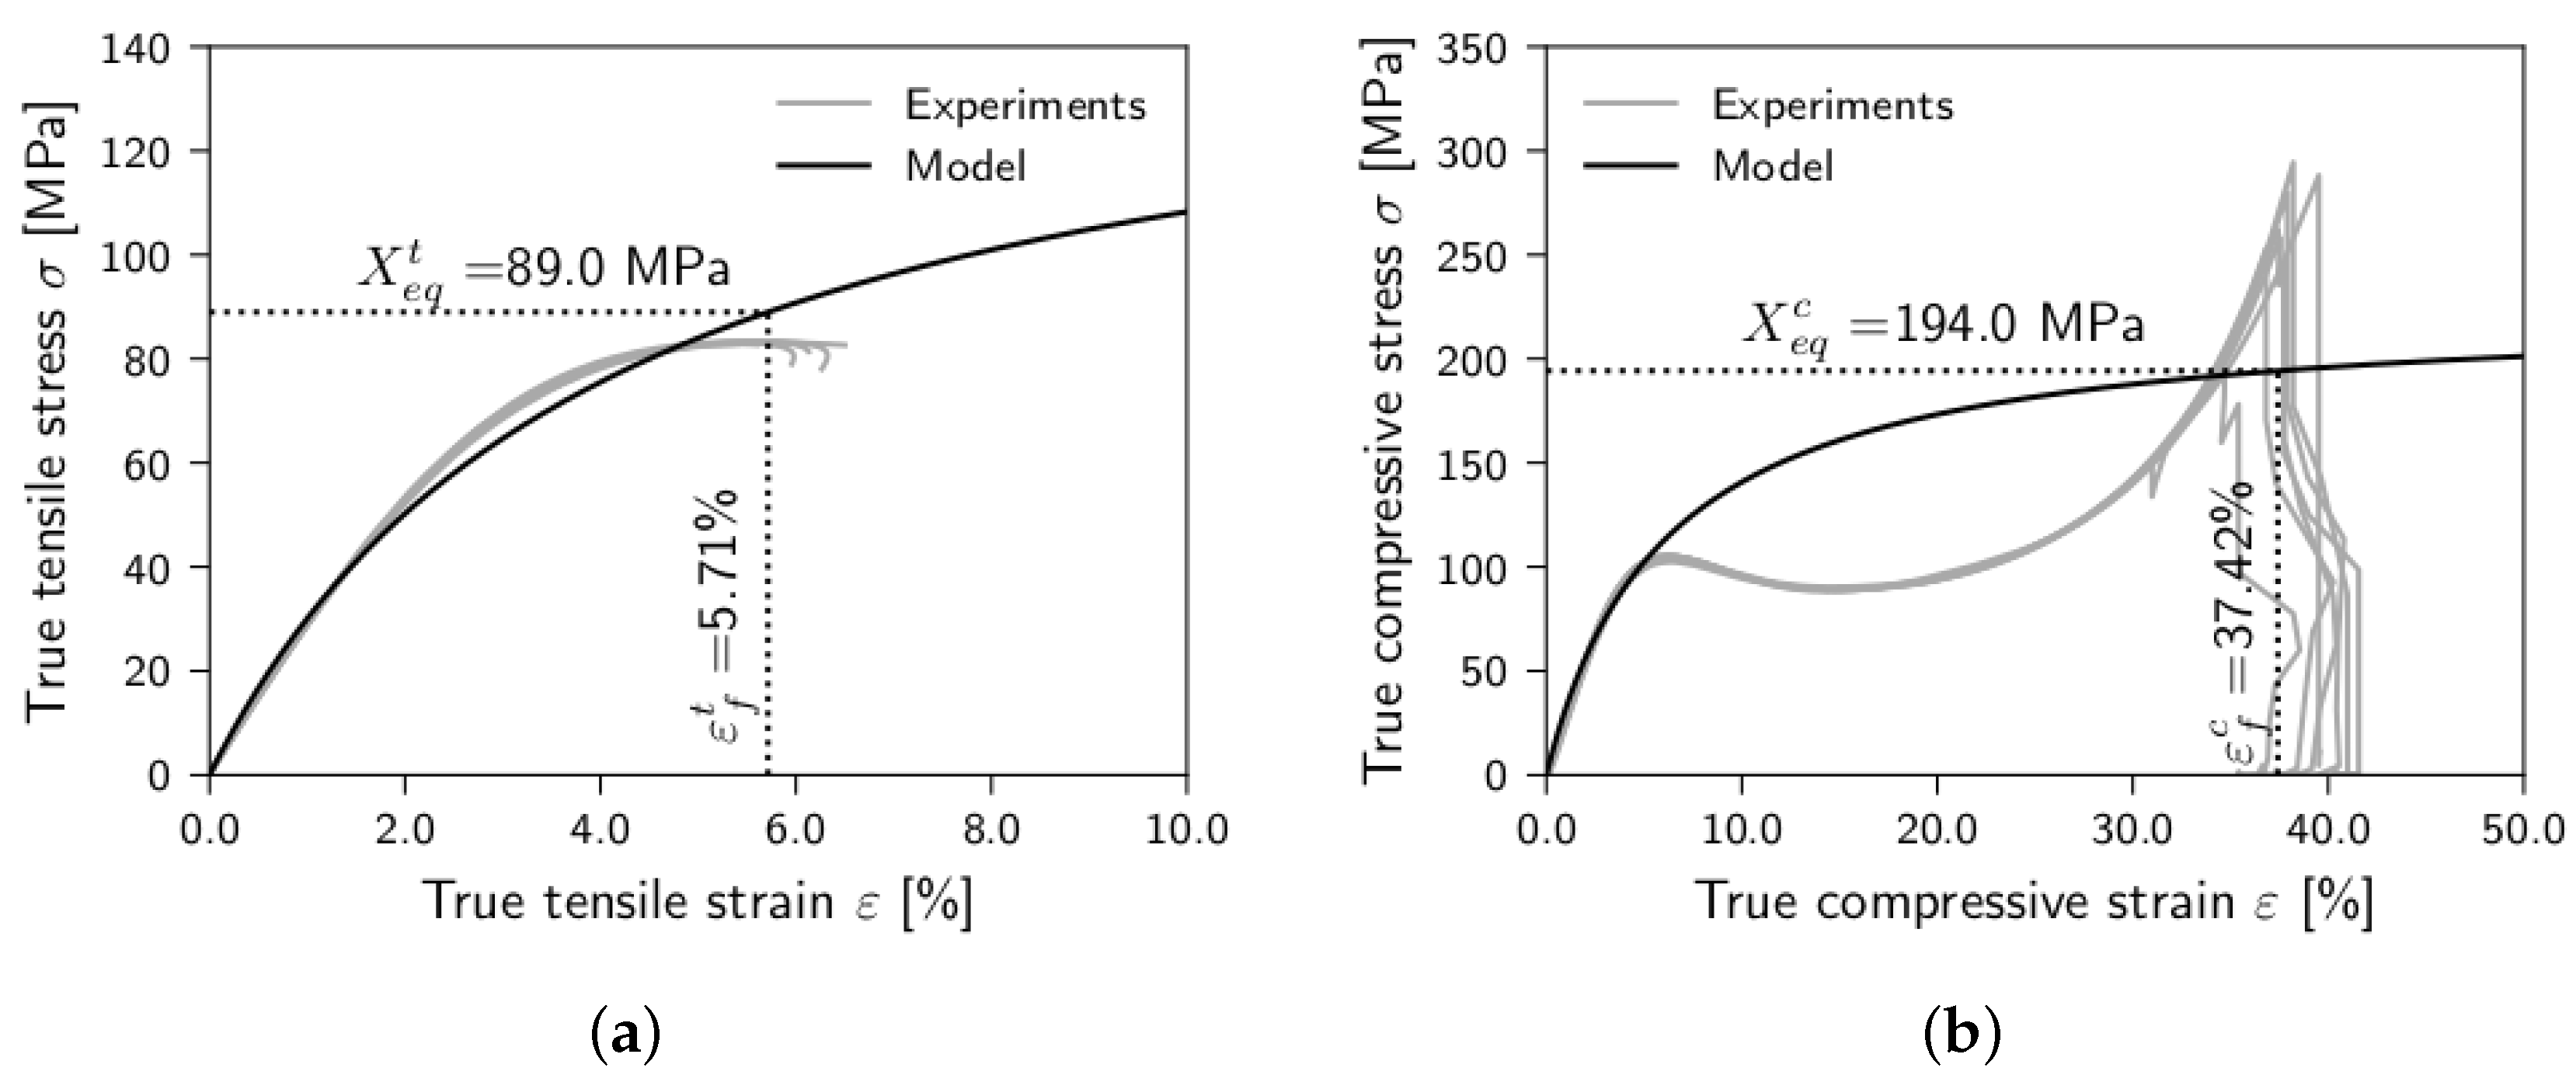
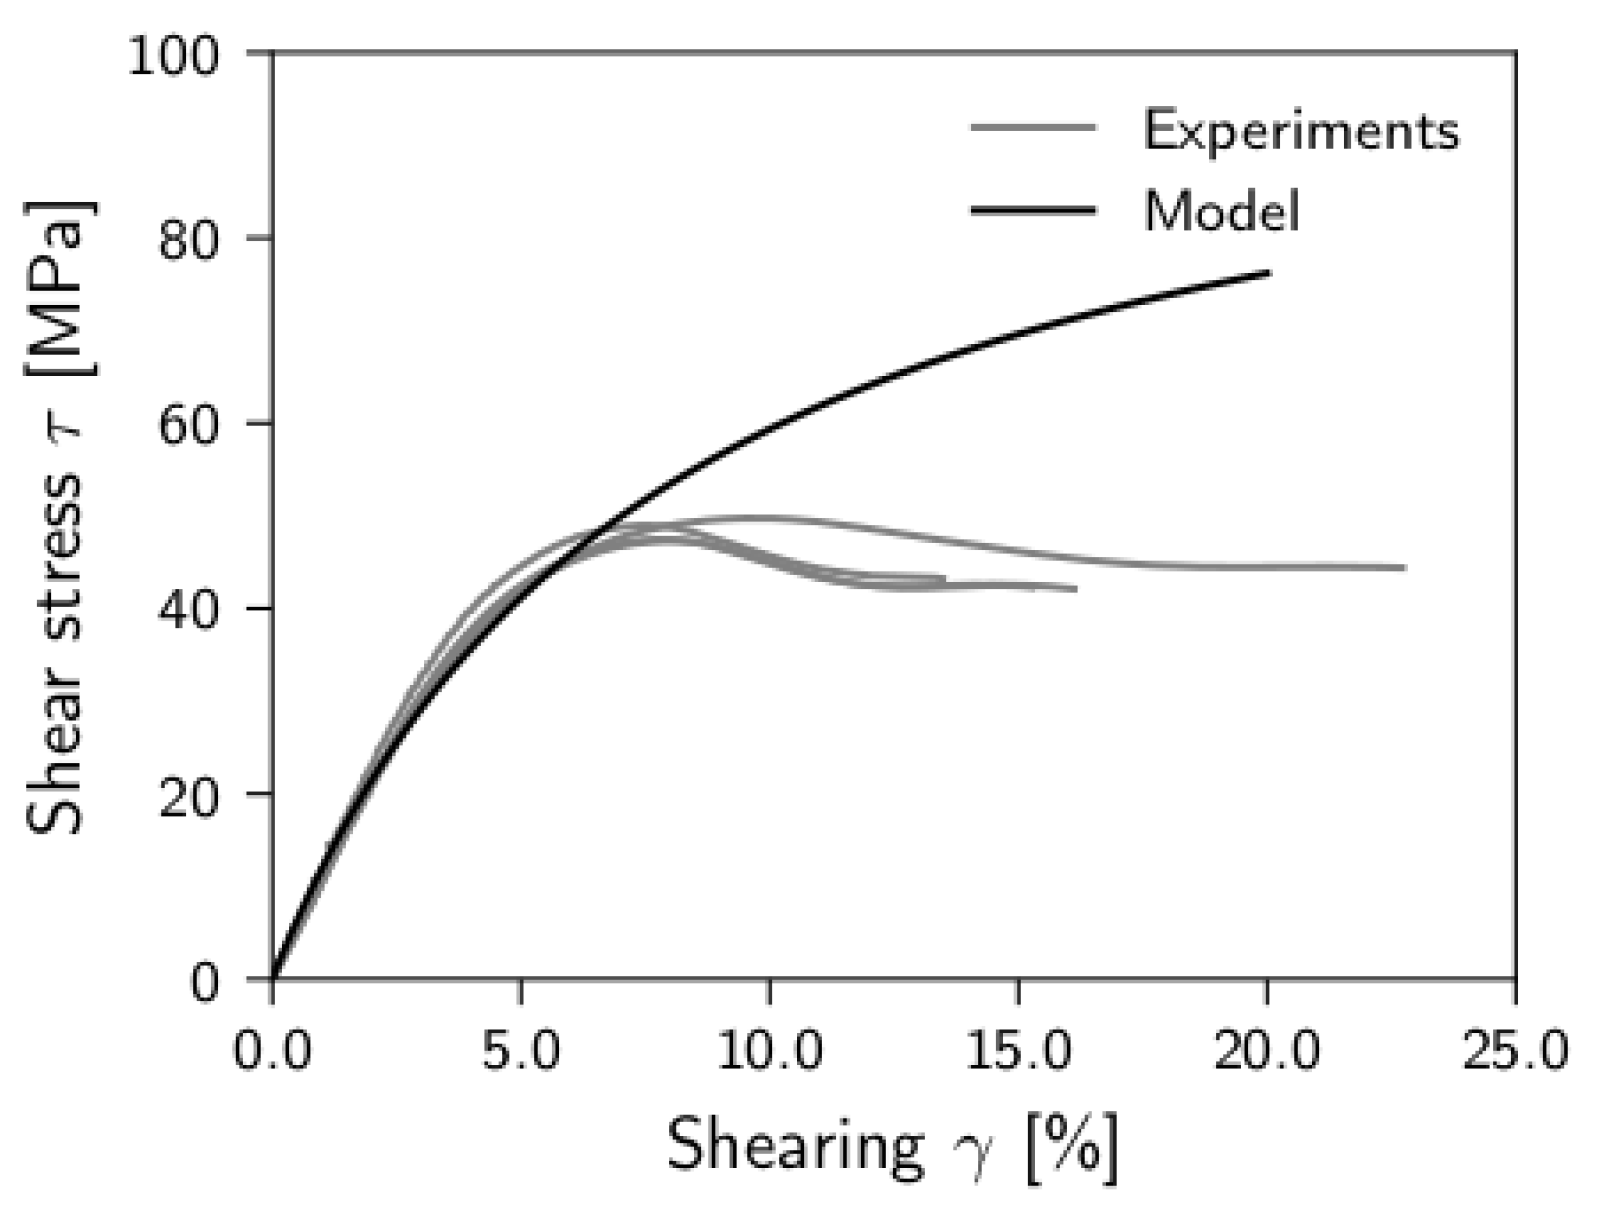
For the pure resin, the model significantly deviates from the experiments for strains higher than 6% for compression and for shearing higher than 7% for shear load, respectively (
Figure 8b and
Figure 9). These deviations do not affect the quality of the micromechanical simulations of the composite to a relevant extent.
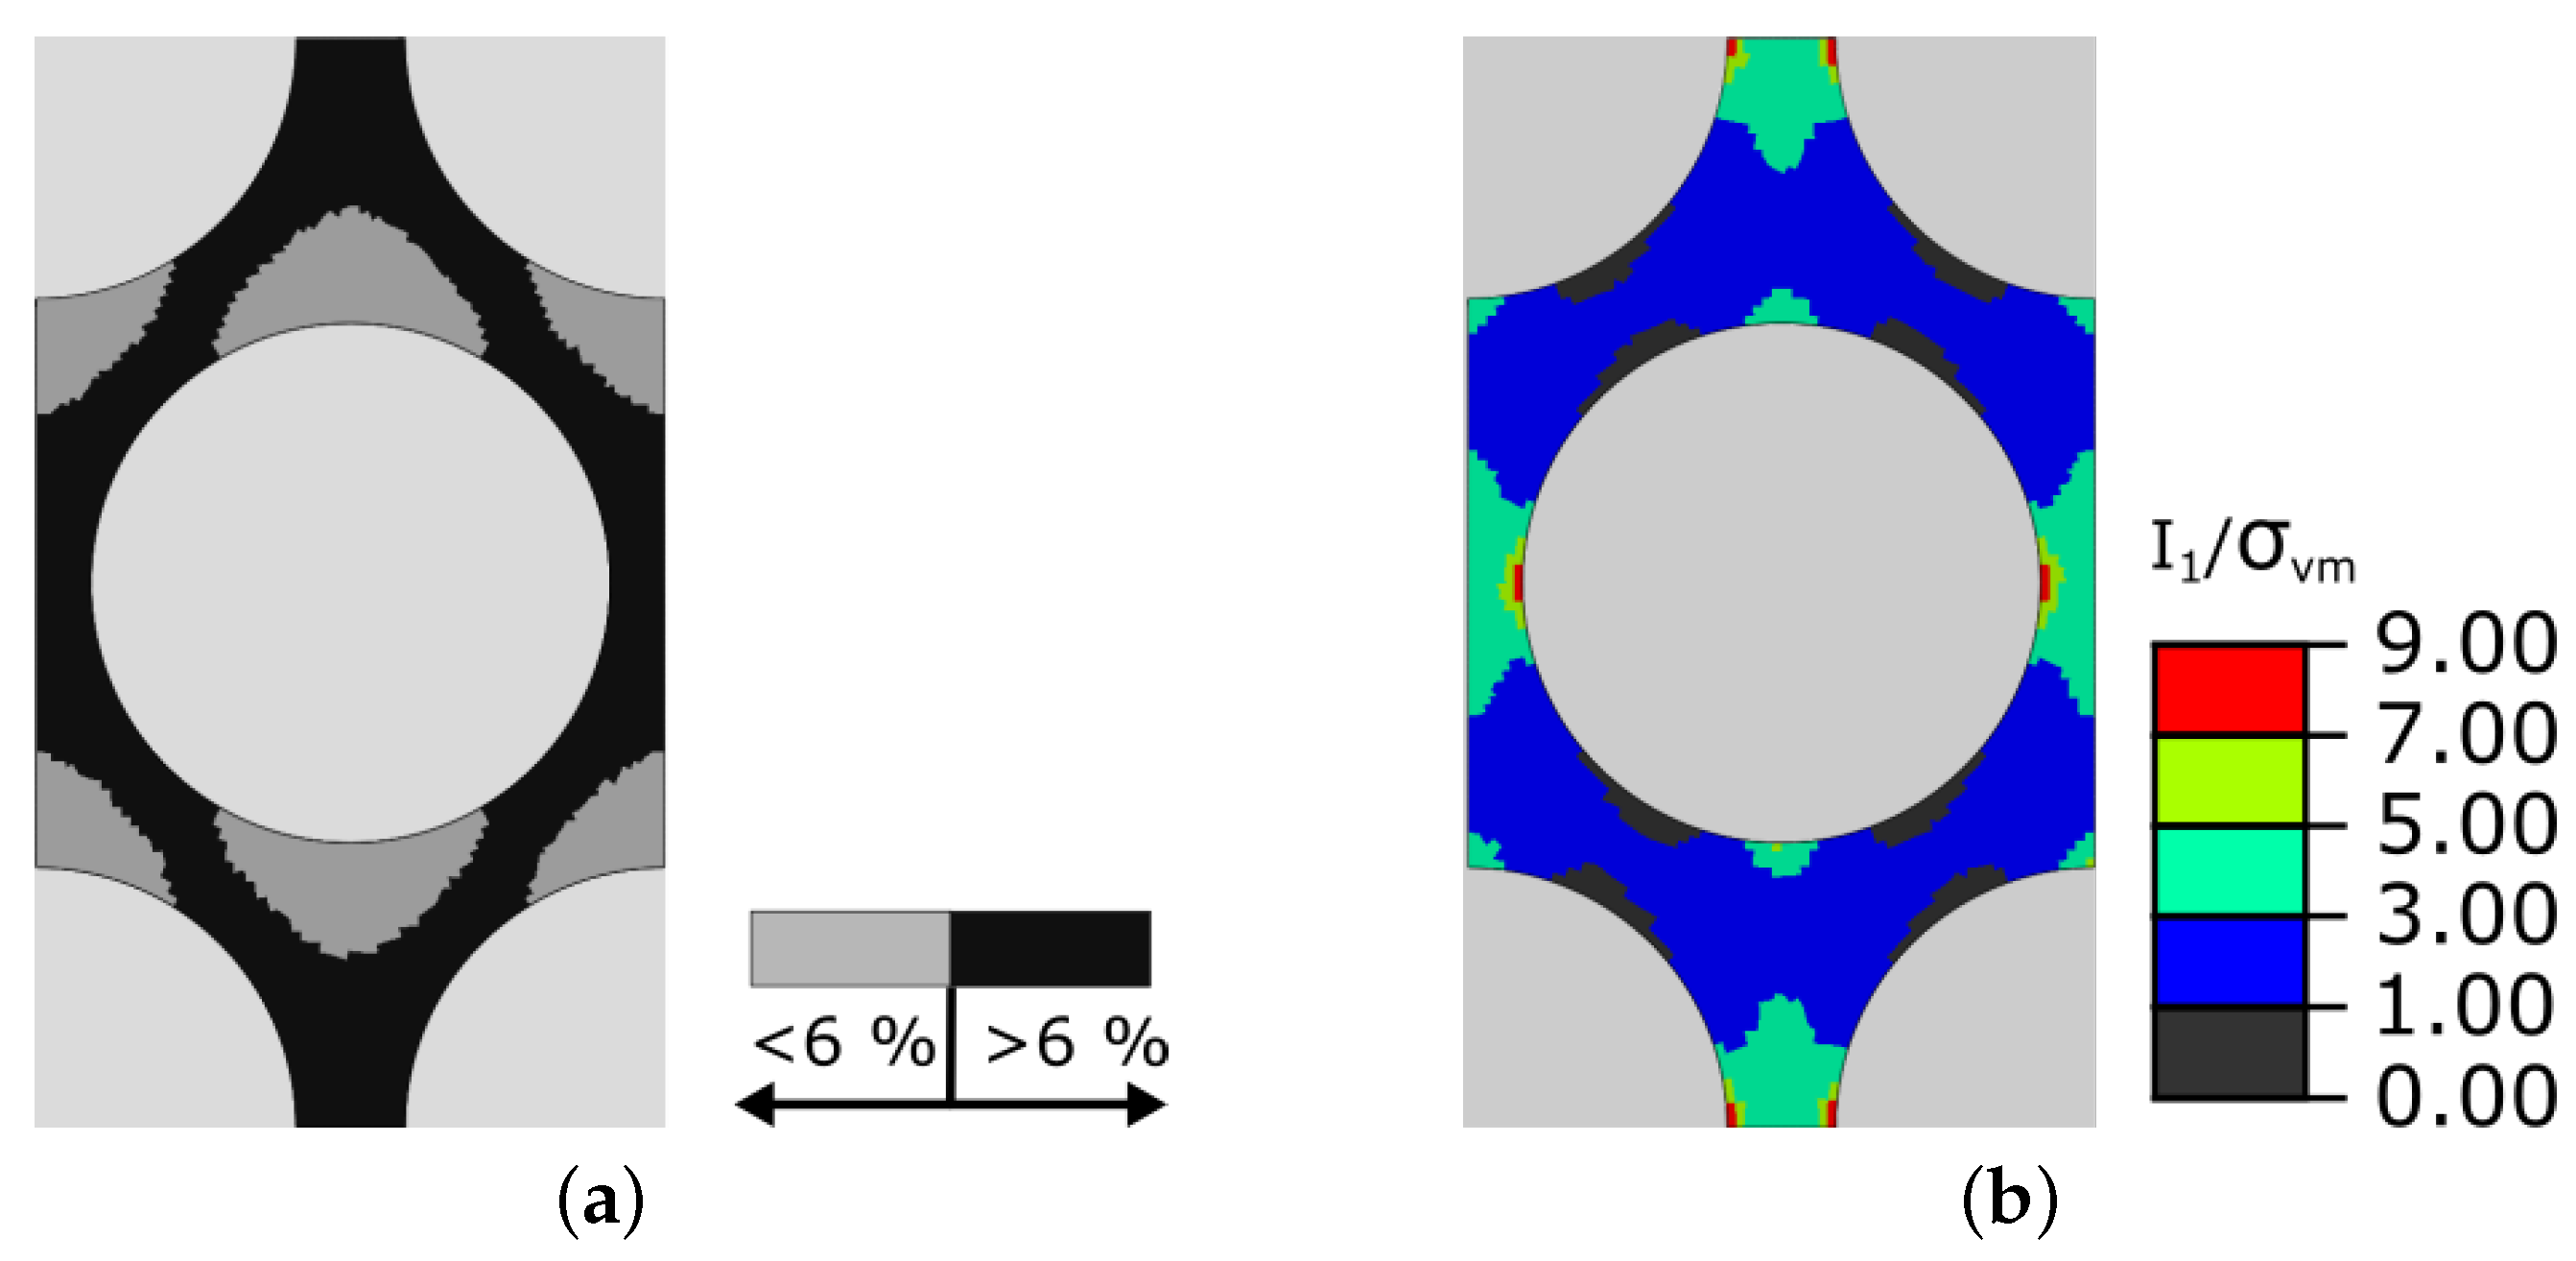
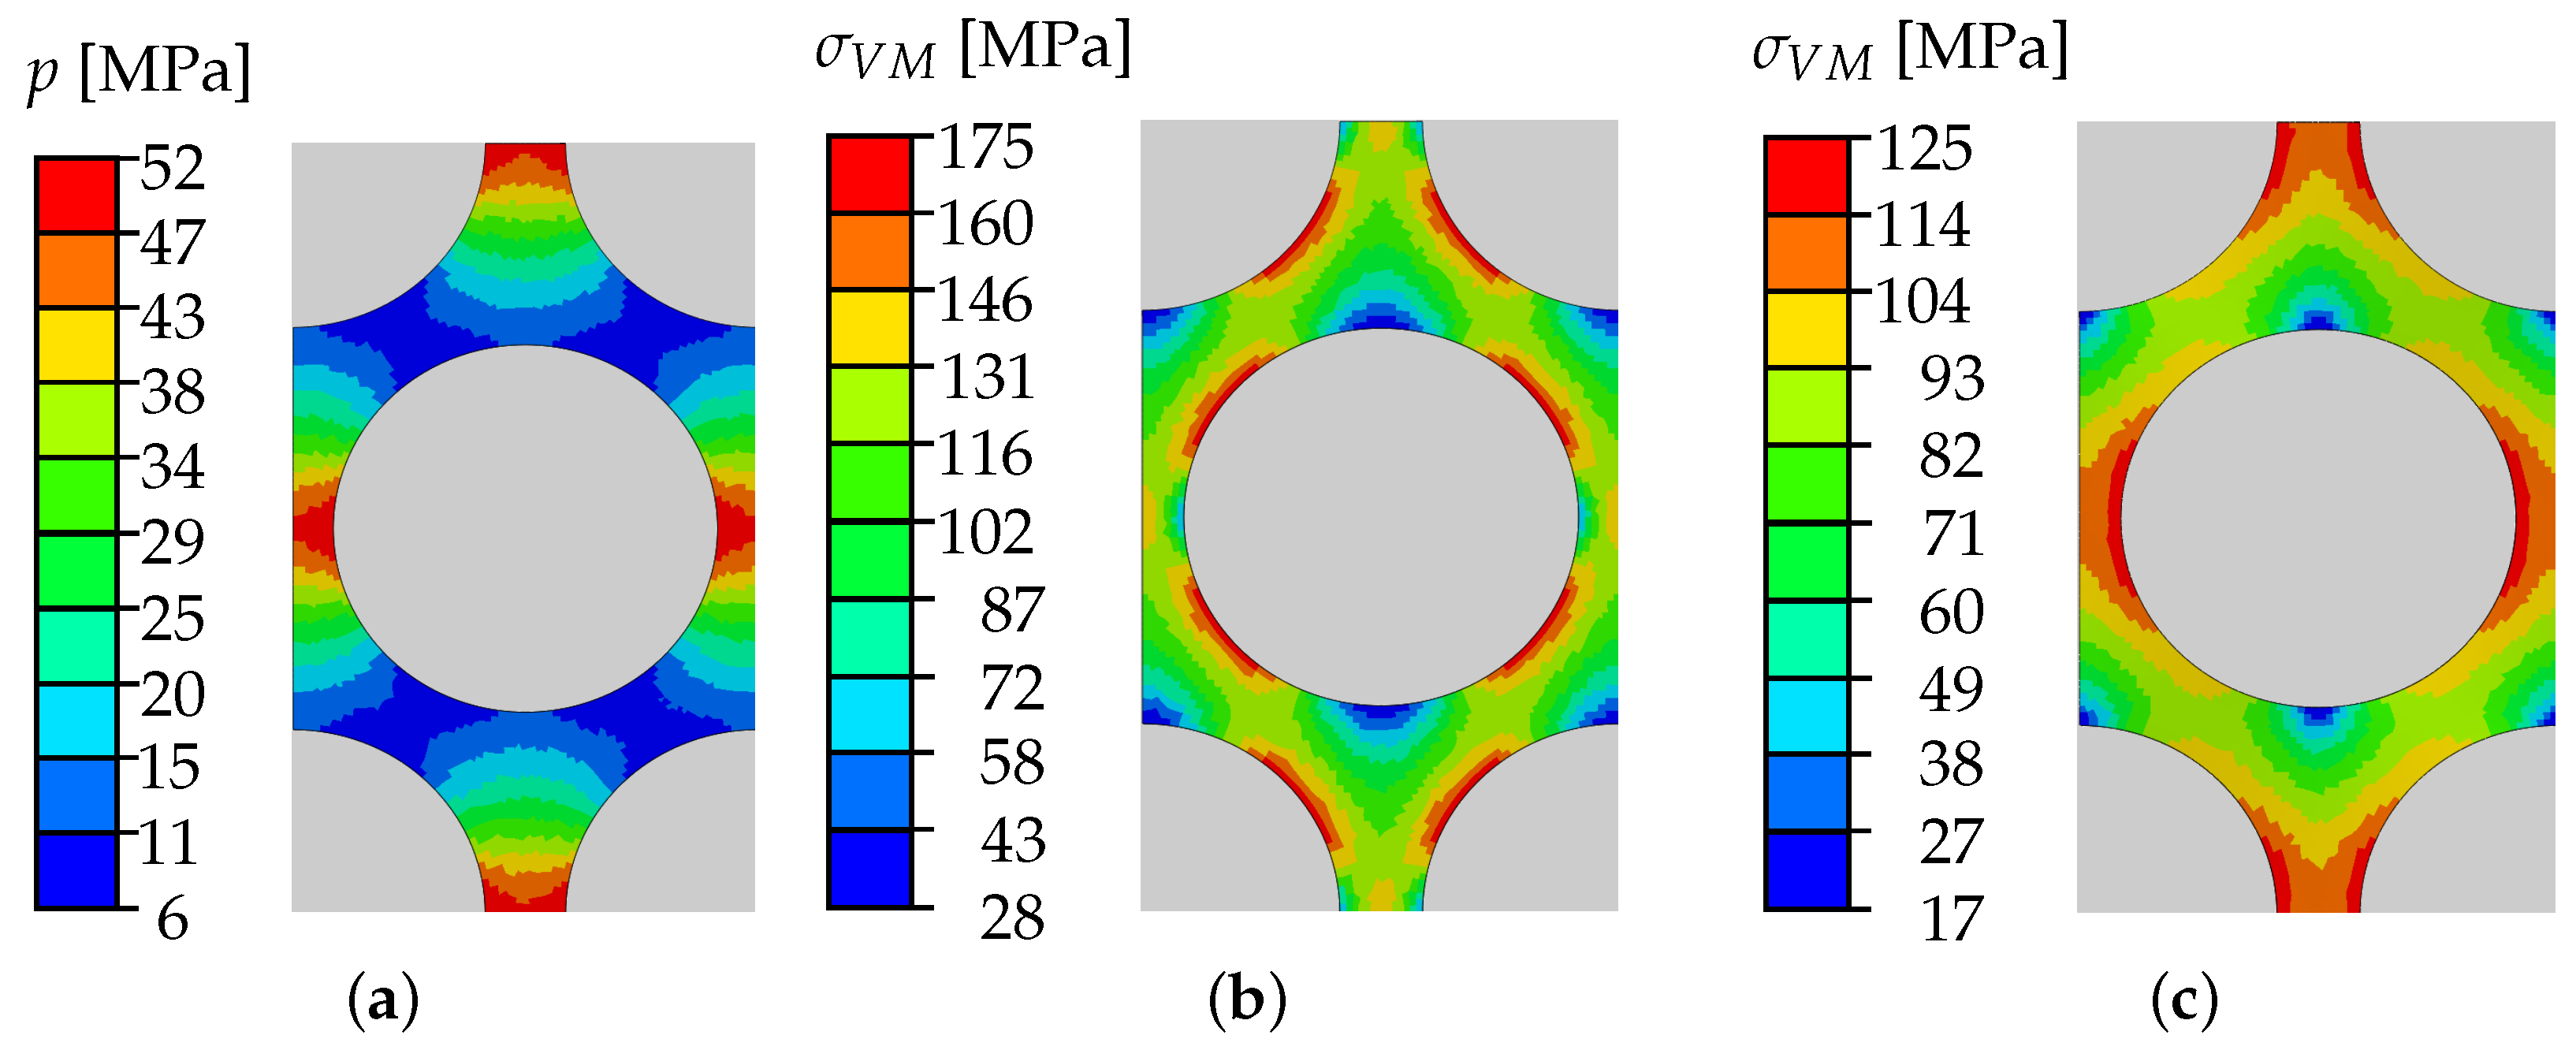
Figure 13a shows the local matrix strain distribution for a transverse compression load case in a composite one load increment before failure initiates. In the areas highlighted in black, the local strain component in the direction of the external load exceeds 6%. This is the case for about half of the matrix area. Due to the error of the pure resin model, a significant overestimation of the stresses in the black highlighted areas could be suspected. Due to the extent of these areas, this should lead to a significant overestimation of the effective composite stresses. This is, however, not observed (
Figure 11b). To find an explanation,
Figure 13b shows the local stress distributions in terms of the ratio of the first stress invariant
to the von Mises equivalent stress
. The first invariant gives the dilatoric part or hydrostatic pressure
p (
p) of a stress state. The von Mises equivalent stress is a measure for the deviatoric part. For a uniaxially stressed homogeneous material, the first invariant and the von Mises equivalent stress are equal. For multiaxial stress states, as found in the matrix in a composite under transverse compression load, the hydrostatic pressure is much higher than the deviatoric part. Only in a few areas of the matrix (highlighted in black in
Figure 13b) the equivalent stress according to von Mises is equal to or greater than the first invariant. The plastic behavior of the epoxy resin, which is often assumed to alone cause the nonlinear matrix material behavior, depends on the hydrostatic pressure component of the stress state [
21,
29]. Higher hydrostatic pressure raises the yield point of the material. So, although plastic flow occurs in the epoxy resin under uniaxial compressive loading from a certain strain, in the composite, this is delayed by the higher hydrostatic stress component. Thus, local plasticity of the matrix seems to be less relevant for the global composite stress–strain behavior.
Altogether, the micromechanical simulation with nonlinear-elastic and orthotropically modeled matrix satisfactorily predicts the stiffness behavior of the UD composite. The consideration of the nonlinearity and the tension/compression-asymmetry seems to have the highest impact on the prediction quality of the composite stiffness. Whether these phenomena are attributed to and modeled with nonlinear-elastic or elasto-plastic effects, is of secondary importance. This also seems to be true for the global composite strengths: The maximum relative error by amount of the predicted strengths is 8%,
Table 4.
The failure strain—defined as strain value corresponding to the stress maximum—is slightly overestimated for the transverse tension and compression load case (
Table 4). For shear, the failure strain is underestimated (2.45% instead of 3.75%). In addition to the differences between the calculated and the measured strengths, this is also due to the over- or underestimation of the material nonlinearity. Compared to the transverse tension load case, this deviation is somewhat higher for transverse compression and
12-shear.
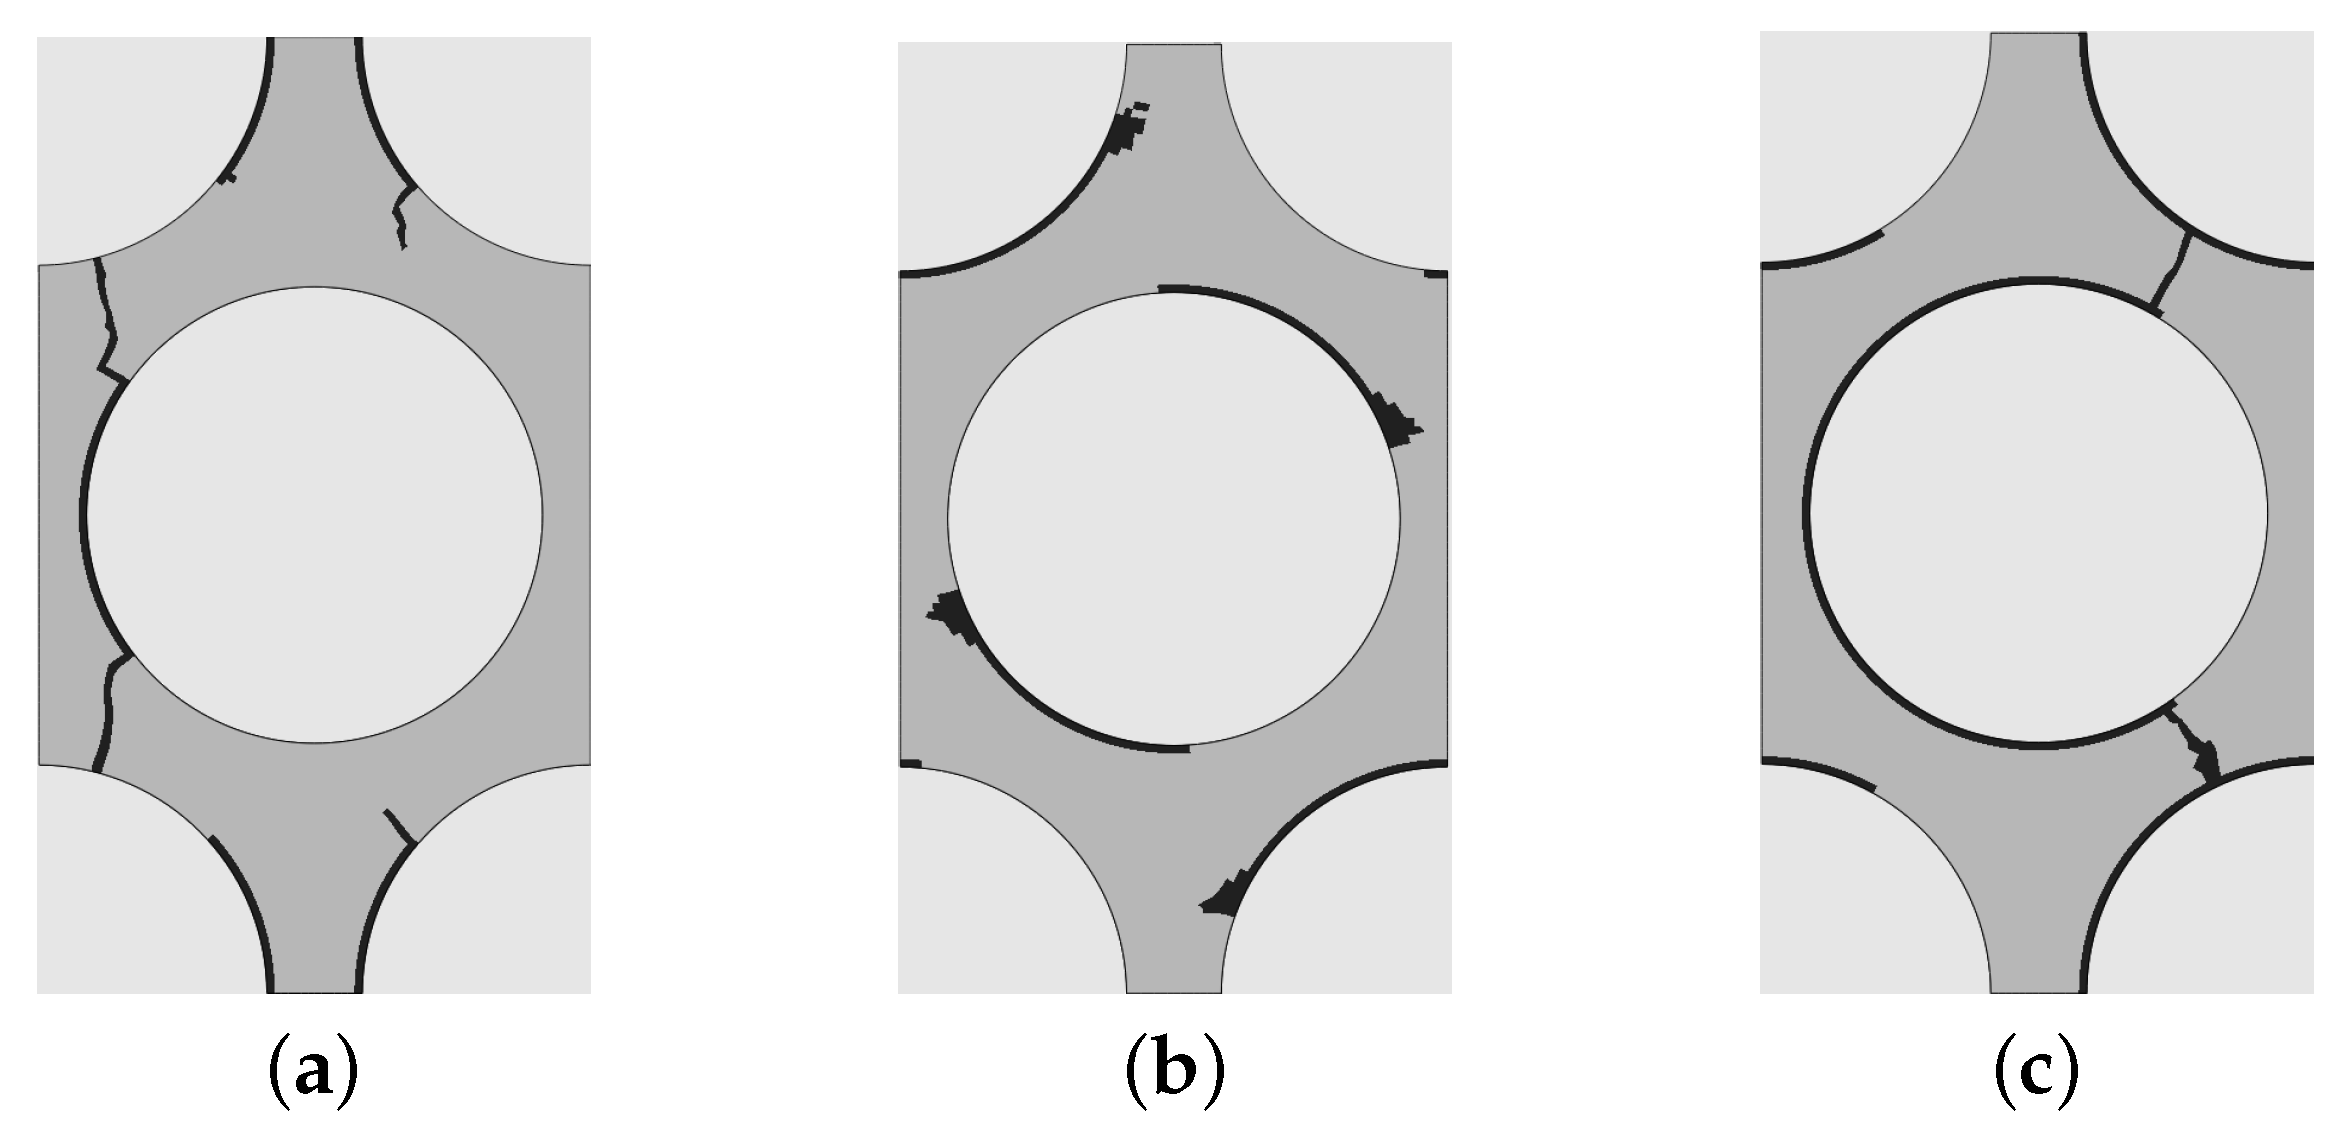
The simulated matrix damage, shown in
Figure 14, initiates in matrix elements adjacent to the fibers, which is in accordance with experimental observations.
As the interface is modeled to be a perfect connection of fiber and matrix, damage occurs only within the matrix phase. Strictly speaking, there is no interface failure in the model. Nevertheless, the failure of the matrix elements being directly connected to the fiber elements is referenced to “interface damage’‘ or “debonding“, in the following. The contour plots in
Figure 15 explain why the damage initiates at the fiber-matrix-interface. The plots show the matrix stress distribution within the transversally loaded UD composite one load increment before damage initiates. The matrix failure behavior is pressure-dependent: The higher the amount of a negative dilatoric stress (hydrostatic pressure
p < 0), the higher the bearable amount of the deviatoric stress part, represented by
. Thus, for stress states with positive dilatoric stresses (
p ≥ 0), these dominate the matrix failure. For stress states with negative dilatoric stresses, the failure becomes deviatorically dominated.
Figure 15a shows the dilatoric matrix stress distribution in the composite under transverse tensile load. The dilatoric stresses are positive over the whole RVE. The opposite is true for the other load cases: Under transverse compression, mainly negative hydrostatic matrix stresses are present and under shear the hydrostatic stress proportion is negligibly small. Therefore,
Figure 15b,c show the distribution of the von Mises equivalent stress
as this dominates the matrix failure for these load cases. Due to the property mismatch of fiber and matrix, stress concentrations (red areas) arise in these regions for all load cases. Within these red areas, the damage initiates in the matrix elements which are directly connected to the fibers. Due to the introduced local scatter of the matrix strength, the damage is not initiated in all (red) areas with stress concentration but only in the elements with a critical combination of high stresses and small strength.
This “debonding“ grows until the damage changes direction and connects the interface damages through the matrix. Under transverse tension, the crack forms parallel to the load direction, as experimentally observed [
10,
35]. Under transverse compression the simulation shows a matrix crack that grows oblique to the loading direction. This is also experimentally observed by [
41] as well as by [
10]. Under
12-shear loading, the fiber-matrix-debondings grow very far around the fiber before they connect through the matrix region. In the calculations by [
9,
10,
11], the debonding is less pronounced before it grows into the matrix region to connect with neighboring debonds.
6. Prediction Quality Compared to Literature Models
After the error of the model prediction has been assessed, the prediction quality is compared to similar models found in the literature. For this comparison, published micromechanical simulation results based on different material modeling approaches are selected that have also been compared to experimental data. As the present paper is not a review, this model selection does not claim completeness. Most of the selected models use an elasto-plastic [
7,
9,
10,
11] or visco-plastic [
12,
13,
27,
28] modeling approach for the pure resin material. Two micromechanical simulations based on a linear-elastic and isotropic material model of the matrix are represented [
14,
23]. The cited micromechanical approaches also differ concerning the modeled fiber arrangement and the interface modeling.
Table 5 provides the key aspects of the micromechanical modeling approach for each selected model.
For more details, the reader is referred to the individual publications. The key aspects of the herein presented model are summarized in the table, as well.
For each selected model, the given experimental and simulation results are extracted from the publications and the relative error of the simulation with respect to the experiment is computed in the same manner as has been done for the herein the presented results in
Section 5. It should be noted that the publications treat different material systems (fiber and matrix type are also given in
Table 5) and, thus, each simulation is compared to a different experimental data base. The probably different scattering of these data bases also effects the estimated relative errors of the model predictions. Nevertheless, it is assumed that the calculated relative errors provide a good estimation of the accuracy of the individual models.
In the following, the simulation errors of the selected literature models are compared to each other (bar plots in
Figure 16,
Figure 17 and
Figure 18). Additionally, the simulation errors obtained within the herein presented study are also displayed in the figure (black dashed line in
Figure 16,
Figure 17 and
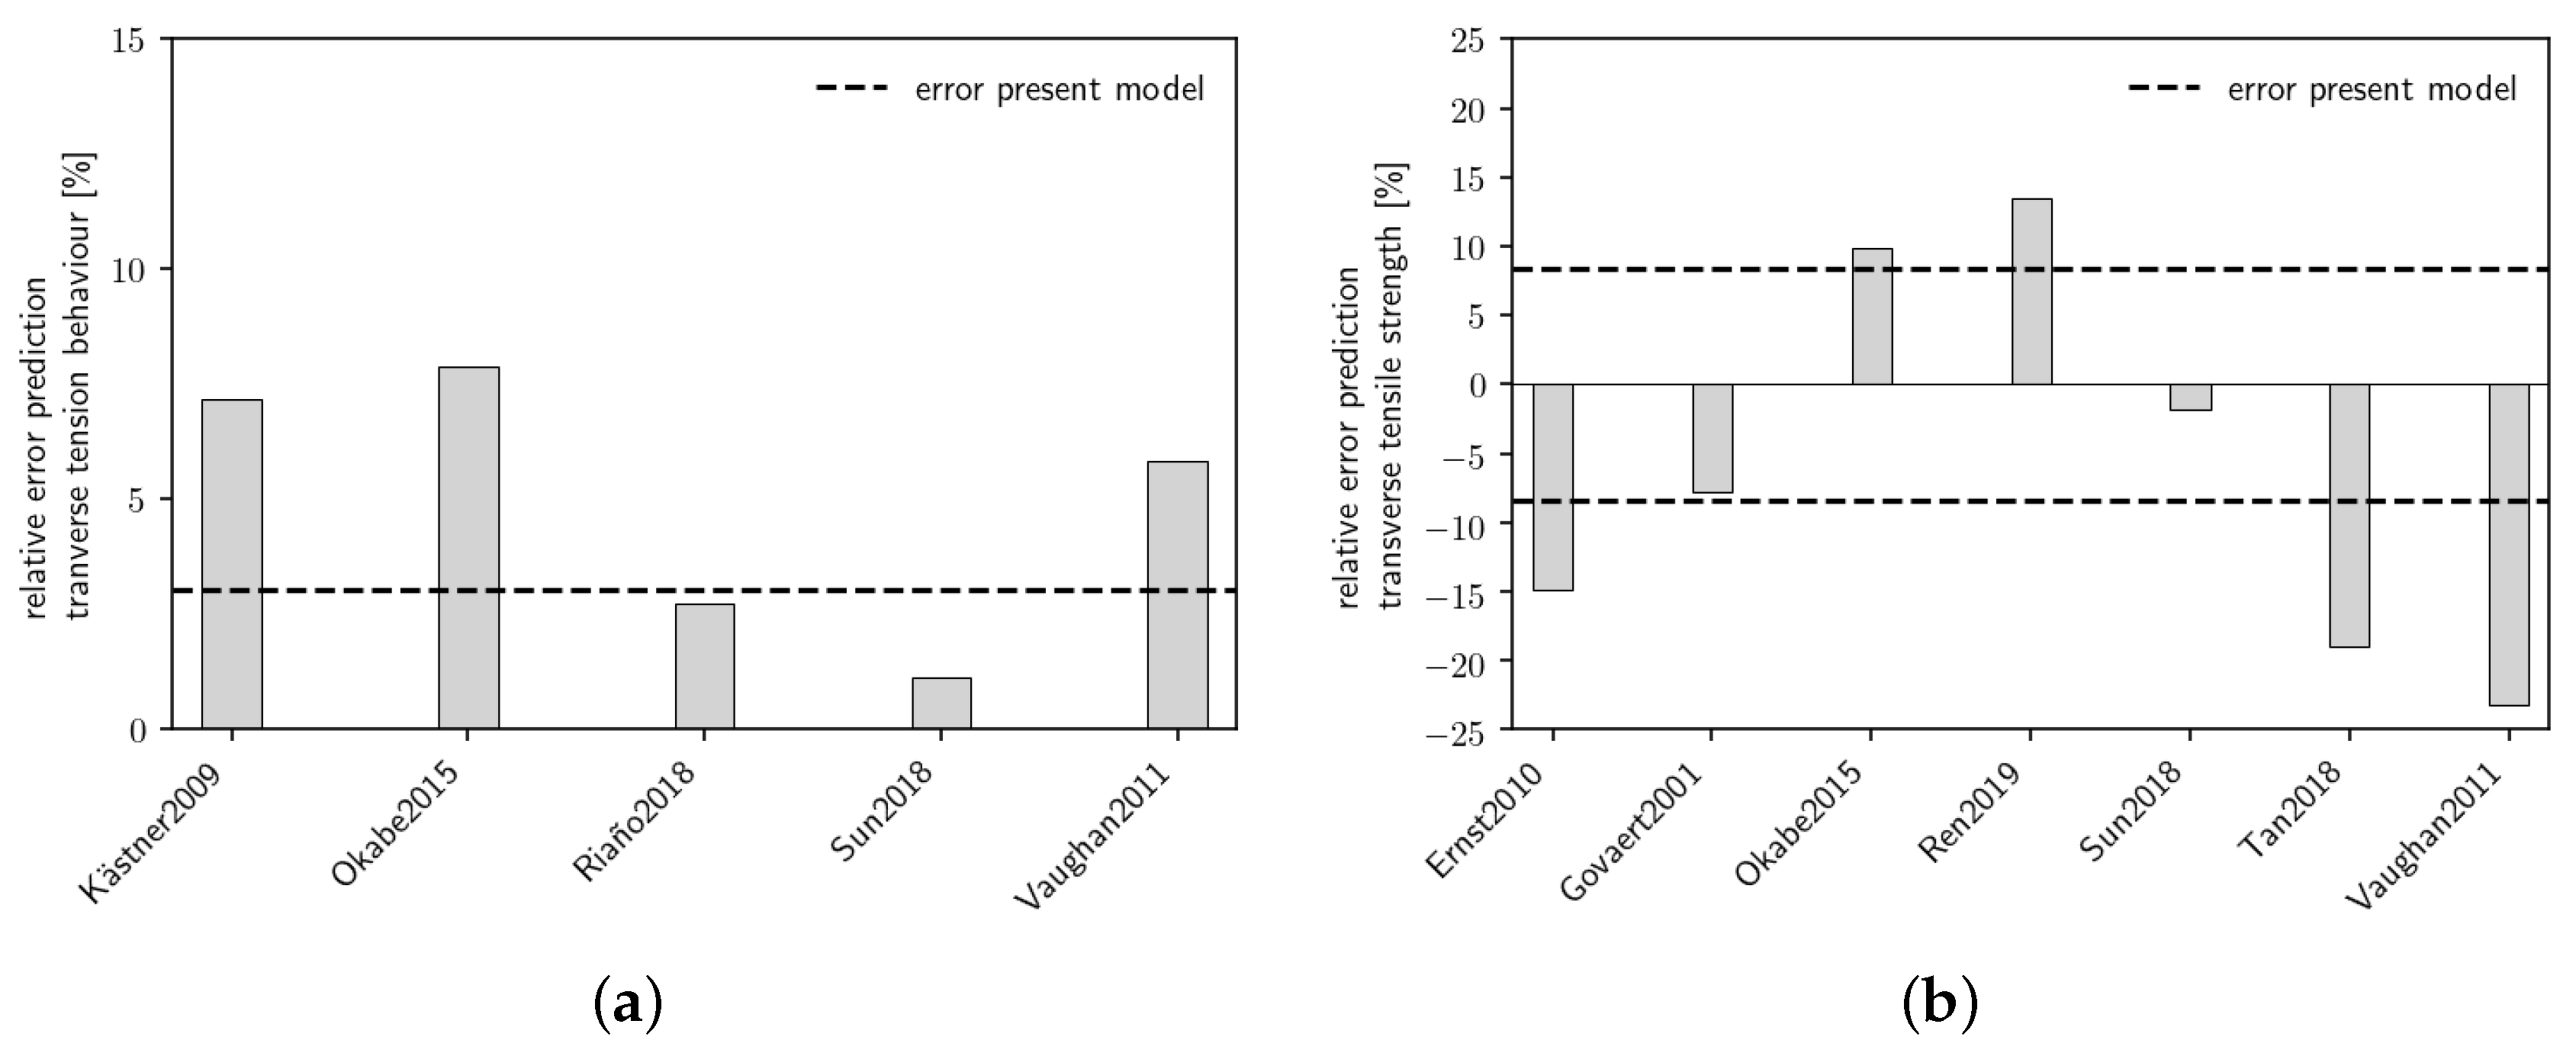
Figure 18). As the prediction of initial modulus is usually reasonably accurate, only the relative error for the predicted stress–strain behavior and for the strength prediction are compared. Not every selected publication provides simulation results for all composite properties or delivers the complete stress-strain-curve for the considered load cases. Because of that, not every model is represented in each diagram. Most micromechanical simulation results are presented for the transverse tension behavior,
Figure 16. The bar plots give the relative prediction errors for each individual literature model with respect to the corresponding experiments. Additionally, the black dashed line shows the relative prediction error of the herein present model. Regardless of whether the proposed model over- or underestimates the experimental value, the error is plotted on both the positive and the negative y-axis.
For the prediction of the transverse tension behavior, two ( Sun et al. [
10], Riano et al. [
23]) out of five models give a more accurate prediction regarding the relative error than the herein presented model. For the transverse tensile strength, two ( Sun et al. [
10], Govaert et al. [
12]) out of seven models yield to a better prediction. Thereby, only Sun et al. [
10] provides a comparison for both the elastic behavior and the strength.
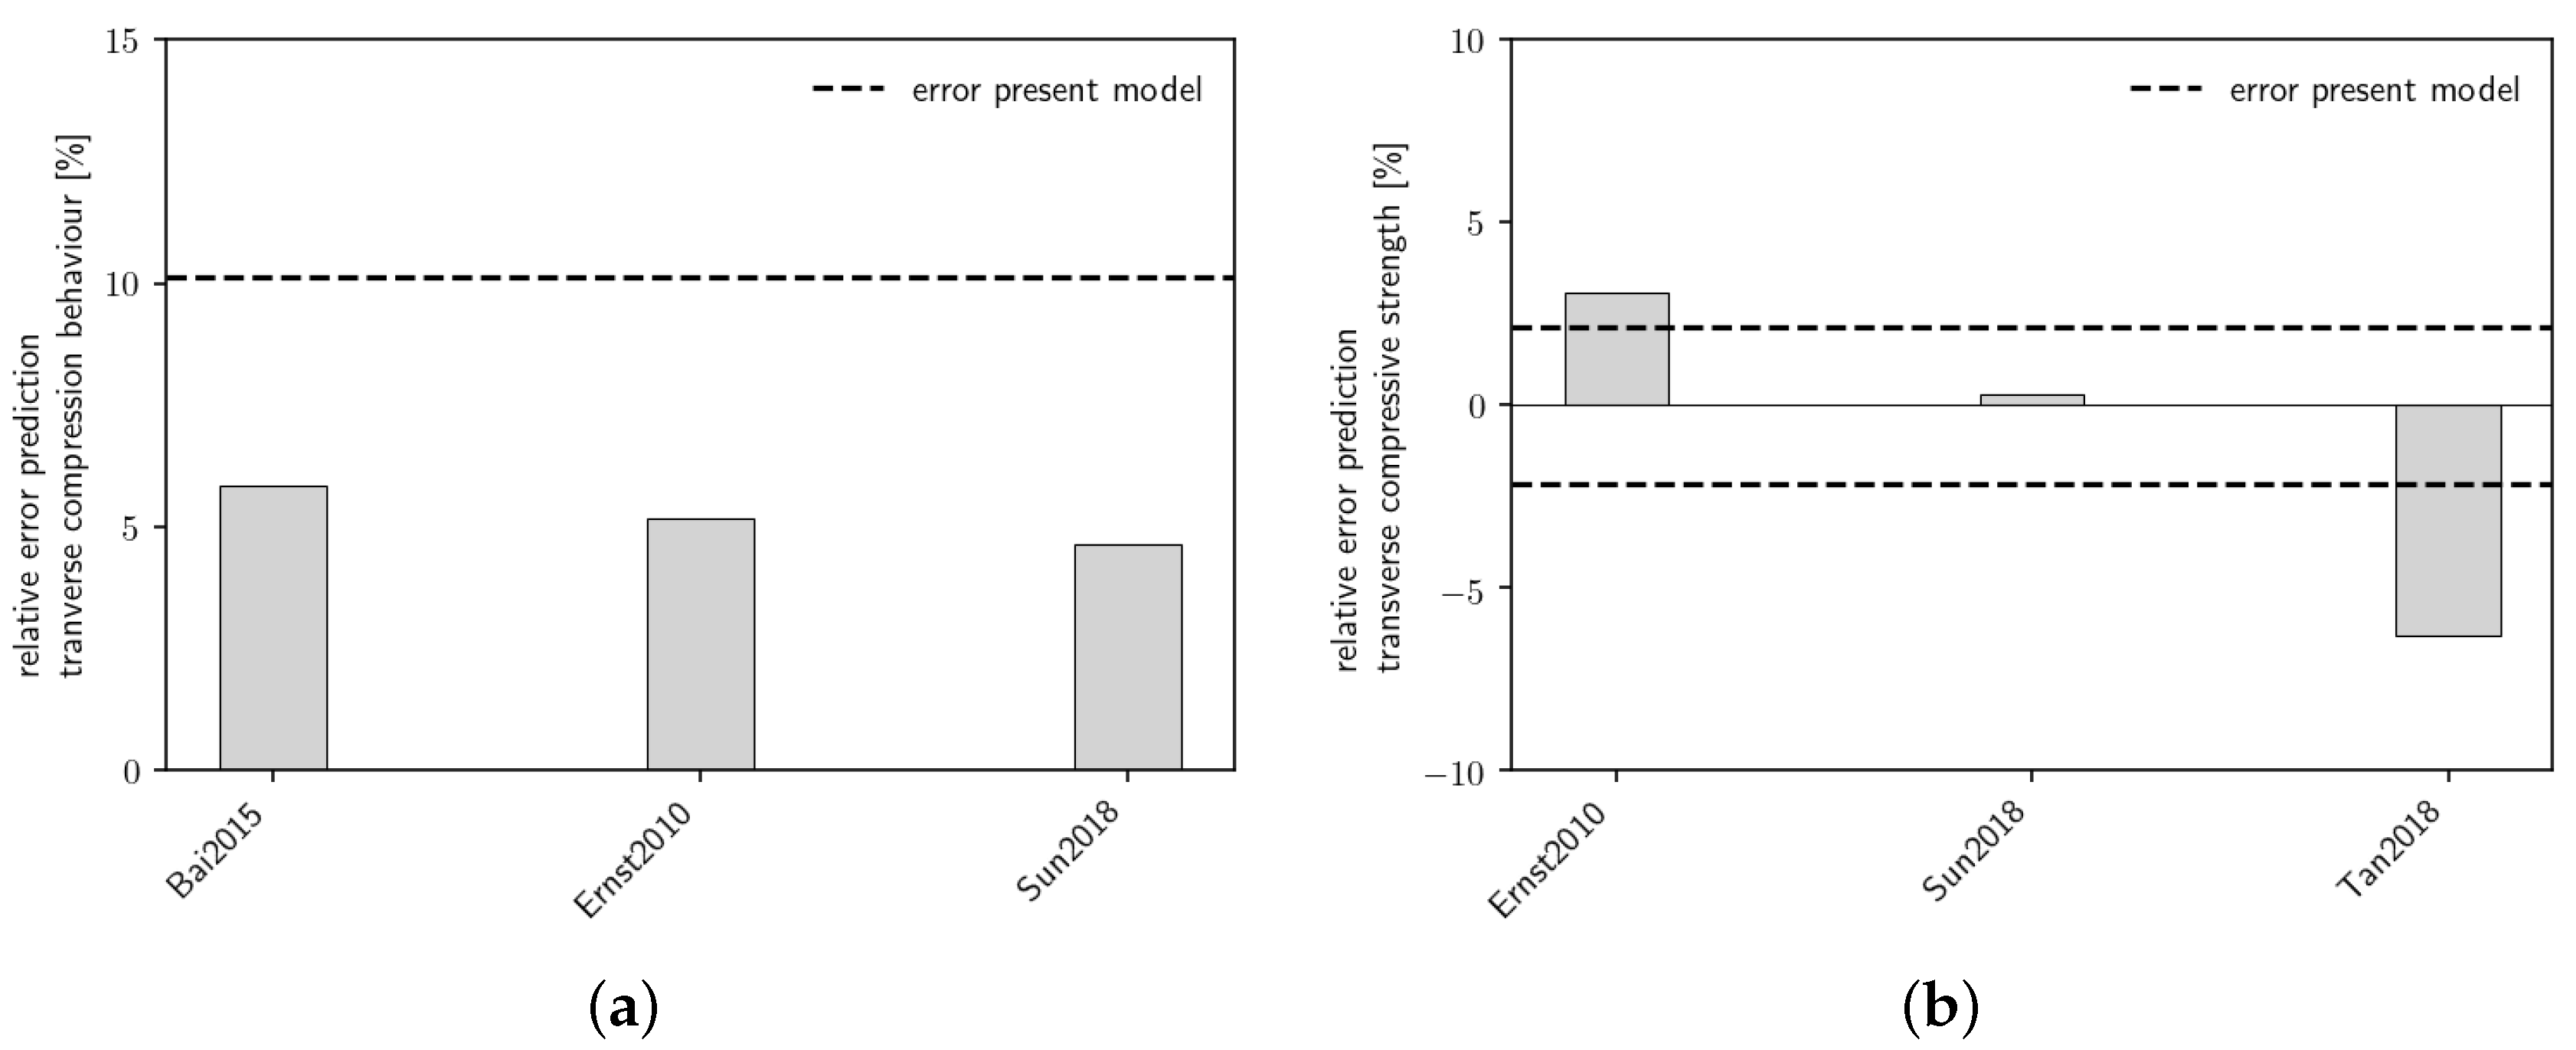
For the transverse compression behavior, the relative error of 10% is higher than the relative errors of all selected literature models,
Figure 17b. The transverse compressive strength prediction of the herein presented model is, one the other hand, more accurate than two out of three selected models,
Figure 17a.
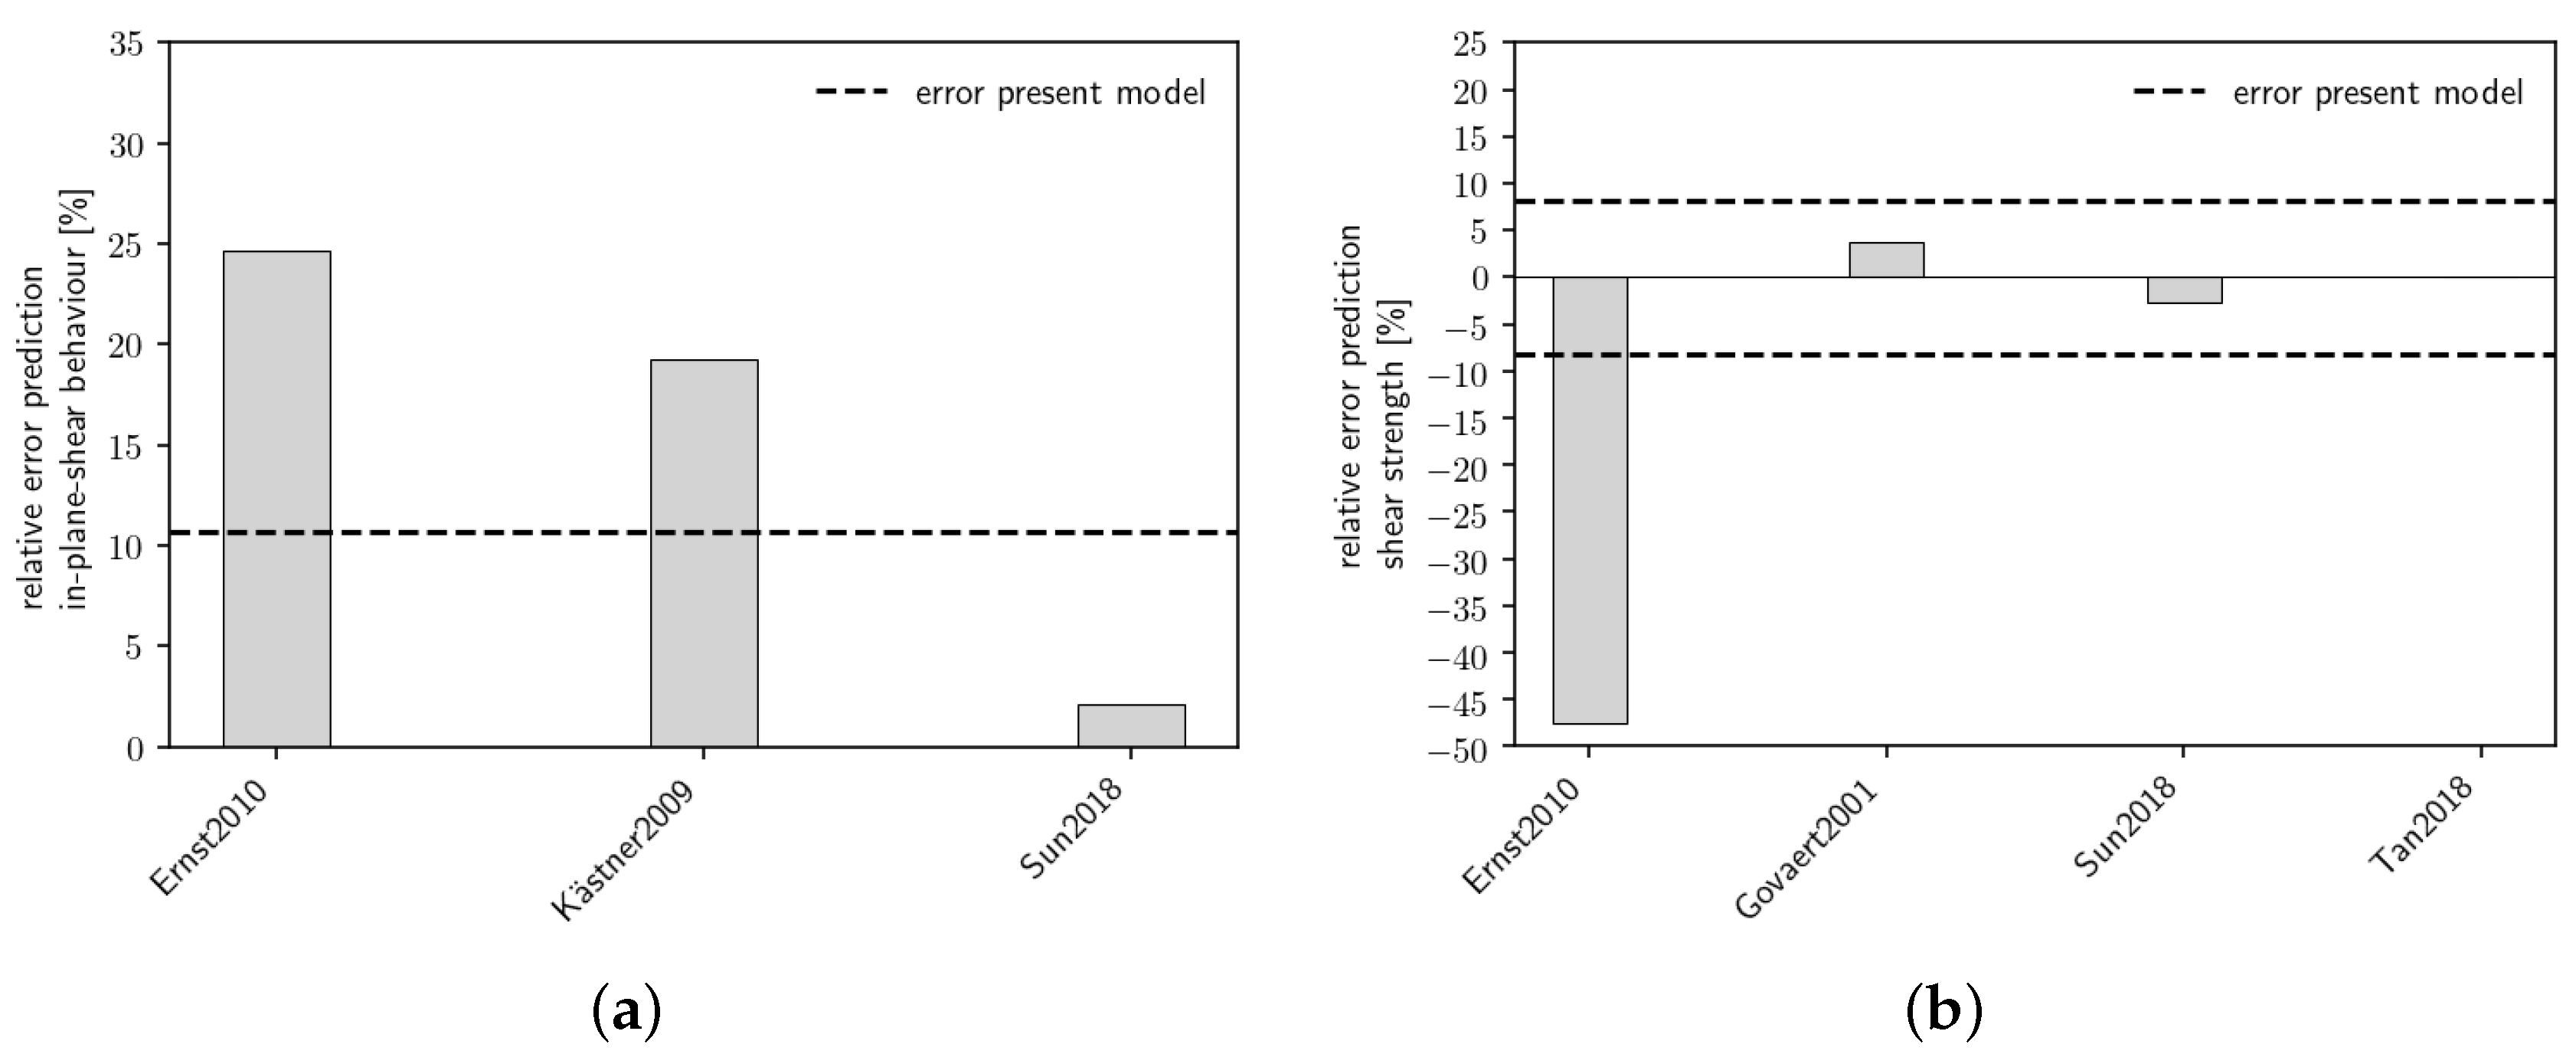
For the prediction of the
12-shear behavior and strength the models by Sun et al. [
10] and by Tan et al. [
11] provides particularly good results, which are quite better than the herein presented predictions,
Figure 18. The relative errors of the models by Ernst et al. [
9] and Kästner [
28] are quite high (>15%) and higher than the errors of the herein presented model. In general, there is a significant greater difference in the model prediction quality of the literature models for the
12-shear load case than for the other matrix-dominated load cases. Overall, the herein presented model gives a good accuracy compared to the literature models. However, the comparison between simulation and experiment must not be regarded as validation for all models presented in the literature. Sun et al. [
10] and Okabe et al. [
13], whose model leads to very good prediction results, use some experimental composite data for a reverse calibration of the matrix failure criterion or the fiber-matrix-interface parameters, respectively. Vaughan and McCarthy [
7,
8] do not use experimental composite data directly for calibration, but they compare the simulation results with different interface parameters.
Figure 16 shows the error for the simulation result closest to the experiments. The reverse model calibration reduces the validation database. Depending on the goal of the micromechanics simulation, e.g., if parametric studies in terms of the model parameters are conducted, this procedure is expedient. On the other hand, a prediction of the composite behavior is only possible if experiments on the composite level are not used to adjust the micromechanical model parameters. Besides the model presented here, the only for comparison selected models that make no use of a reverse calibration and give prediction results for all here considered load cases are the models by Ernst et al. [
9] and Tan et al. [
11].
7. Summary and Conclusions
The present research investigates whether an elastic material model for the epoxy matrix in micromechanical simulations sufficiently predicts the material behavior of transversely loaded FRPs. The model of the stress–strain behavior of the epoxy is strain-dependent and orthotropic in order to capture the nonlinearity and the tension/compression-asymmetry of the resin’s constitutive behavior. While the representation of the neat resin’s tensile behavior is sufficient, larger deviations from the experimental data occur for compression and shear at higher strains. For failure and progressive damage modeling a stress invariant-based failure criterion and a sudden material degradation together with a viscous damage regularization scheme is used. To examine the predictive capability of this model, FEM-based micromechanical simulations using a hexagonal RVE are conducted. It is focused on the matrix-dominated load cases transverse tension, transverse compression and 12-shear. To verify the model, the simulation results are compared to experimental data. Additionally, the accuracy of the presented micromechanical predictions are compared to that of other models published in the literature. The relative error of the predicted initial moduli, strengths and failure strains is evaluated. Additionally, an error measurement is proposed indicating how well the nonlinear stress–strain behavior of the composite is predicted. The relative error of the predicted composite material parameters and the predicted composite strengths is a maximum of 8%. The maximum deviation of the predicted stress–strain behavior from the experiment is 18%. This is a reasonably good accuracy and is within the accuracy of the literature models. This indicates the admissibility of the assumptions made. Furthermore, it seems primarily important to capture the nonlinearity and the tension/compression-asymmetry of the resin’s constitutive behavior. To predict the global transverse composite behavior, it seems less important whether this is depicted by plasticity. Thus, this study gives the indication that a pure elastic model considering the named effects might be sufficient for a reasonably good micromechanical stiffness and strength prediction, if rate-dependent effects are negligible. This facilitates the numerical calculation, as elastic models do not need an iterative process within the material equations and, therefore, are numerically more efficient.
This could be further quantified with a direct comparison of different material modeling approaches calibrated and benchmarked against the same experimental data.
The importance of plastic effects on the global composite behavior could be different for composites made of other polymeric materials with a different plasticity behavior, e.g., a different pressure-sensitivity. Thus, a further research question is to verify whether the presented purely elastic modeling approach is also applicable to other resin materials. Additionally, plasticity maybe could play a more important role for the global composite behavior for other, e.g., multiaxial, load cases. Hence, it would be worth to simulate multiaxial load cases and compare the micromechanical simulation results to corresponding experiments. This could be a further evaluation of the presented modeling approach.


