Developing an Equivalent Solid Material Model for BCC Lattice Cell Structures Involving Vertical and Horizontal Struts


Department of Mechanical and Material Engineering, Wright State University, 3640 Colonel Glenn Hwy, Dayton, OH 45435, USA
*
Author to whom correspondence should be addressed.
J. Compos. Sci. 2020, 4(2), 74; https://0-doi-org.brum.beds.ac.uk/10.3390/jcs4020074
Submission received: 4 May 2020
/
Revised: 14 June 2020
/
Accepted: 15 June 2020
/
Published: 17 June 2020
(This article belongs to the Special Issue Characterization and Modelling of Composites)
Abstract
:In this study, a body-centered cubic (BCC) lattice unit cell occupied inside a frame structure to create a so-called “InsideBCC” is considered. The equivalent quasi-isotropic properties required to describe the material behavior of the InsideBCC unit cell are equivalent Young’s modulus , equivalent shear modulus , and equivalent Poisson’s ratio . The finite element analysis (FEA) based computational approach is used to simulate and calculate the mechanical responses of InsideBCC unit cell, which are the mechanical responses of the equivalent solid. Two separates finite element models are then developed for samples under compression: one with a 6 × 6 × 4 cell InsideBCC lattice cell structure (LCS) and one completely solid with equivalent solid properties obtained from a unit cell model. In addition, 6 × 6 × 4 cell specimens are fabricated on a fused deposition modeling (FDM) uPrint SEplus 3D printer using acrylonitrile butadiene styrene (ABS) material and tested experimentally under quasi-static compression load. Then, the results extracted from the finite element simulation of both the entire lattice and the equivalent solid models are compared with the experimental data. A good agreement between the experimental stress–strain behavior and that obtained from the FEA models is observed within the linear elastic limit.
1. Introduction
Lattice cell structures (LCS) are the engineered porous structures that are composed of periodic unit cells in three dimensions. Such structures have many scientific and engineering applications, such as in thermal systems, gas technology, mechanical and aerospace structures, etc., for which lightweight, high strength, and energy absorption capabilities are essential properties [1,2,3,4,5,6,7,8]. Additionally, combining different unit cell configurations, such as a frame structure and a body-centered cubic (BCC) structure (Figure 1), will provide higher strength and higher stiffness LCS. Such a combined LCS is termed as InsideBCC in this paper. It has been shown that the combining unit cells such as lattice structures inside the tube, BCC with vertical struts at each node, BCC with vertical struts in alternate layers, and BCC with gradient distributed vertical struts, contribute to the buckling and bending resistance and enhancement in energy absorption performance as well as the high specific strength and stiffness [9,10,11,12].
The finite element analysis (FEA) technique is usually used for designing complex structures at the system and subsystem levels to reduce cost and time. While modeling large scale structures with lattice cells, the numerical simulations require a large number of degrees of freedom to get accurate analysis, which requires more computation time [13,14]. For example, the BCC lattice structure with a strut diameter of 1 mm and the unit cell dimensions of 5 mm × 5 mm × 5 mm having the overall LCS dimensions of 25 mm × 25 mm × 20 mm under the compression was modeled using FEA [9]. In this case, the time needed to complete the solution was 48 h for mass scaling of 1E-7 times the time increment. Additionally, by using the FEA simulation, a BCC unit cell with a strut diameter of 0.7 mm and dimensions of a single unit cell are 5 mm × 5 mm × 5 mm in x, y, and z direction respectively under tension the computational time of solution was 10 h [15]. To model large scale structures involving LCS, an equivalent solid material can be used to replace and represent the whole lattice structure model to reduce computational time. The equivalent solid section will not have any struts. Displacement results from the equivalent solid model can be used as an input to different sub-models. Here, the sub-modeling approach can be utilized to find localized stress/strain within lattices in critical regions for large scale structures. Thus, the main objective of this study is to develop and employ a computational methodology to find equivalent solid material properties of InsideBCC LCS to conduct large scale finite element simulation easier and computationally less expensive.
This paper is organized as follows. First, the load–displacement and stress–strain results is first obtained from the FEA of InsideBCC unit cell under compression and shear in all three orthogonal directions. The stress–strain plots are then used to calculate the equivalent mechanical properties such as the elastic modulus , shear modulus , and Poisson’s ratio for a unit cell. In this case, the unit cell size is 5 mm × 5 mm × 5 mm with a strut diameter of 1 mm and the bulk material is considered to be acrylonitrile butadiene styrene (ABS). Next, two separate finite element models are developed for samples under compression: one with 6 × 6 × 4 cell InsideBCC LCS and one completely solid with equivalent solid properties obtained from the unit cell model. In addition, 6 × 6 × 4 cell specimens are fabricated on a 3D printer using ABS material and tested experimentally under quasi-static compression load. Then, the results extracted from the finite element simulation of both the entire lattice and the equivalent solid models were compared with the experimental data to validate the FEA modeling scheme. This modeling scheme can be used to obtain equivalent solid properties for InsideBCC LCSs with other unit cell dimensions and strut diameters.
2. General Methodology
The main goal of this research was to develop an elastic material to predict the mechanical response of combining a lattice cell structure, which is called InsideBCC. Additionally, the current study could be used to find the effect of vertical and horizontal struts on the mechanical response of lattice cells within the elastic limit when compared with its BCC counterpart [16]. An InsideBCC unit cell is a representative volume element (RVE) that is used to generate equivalent solid mechanical responses. These mechanical properties would be used to create the equivalent solid material model, which is identical to the mechanical response of a whole lattice structure. Only periodic boundary conditions provide the correct equivalent properties of a unit cell since it was used as an RVE.
The general methodology strategy is schematically showed in Figure 2 in which the InsideBCC unit cell was used as a model for predicting the mechanical responses of the full-scale lattice structure. The following were the steps process flow of this research:
- A model of the InsideBCC unit cell was simulated using FEA to calculate the elastic modulus for x, and y direction (). For this case, the bulk ABS mechanical properties were used.
- Calculate the Poisson’s ratio for different orientations , obtained in part (a) models.
- A model of the InsideBCC unit cell was simulated using FEA to predict the shear modulus (. For this case, the bulk ABS mechanical properties were used.
- A FEA model of 6 × 6 × 4 cell InsideBCC was generated and run to find its load–displacement response under compression. For this case, the bulk ABS mechanical properties were used.
- A separate FEA model was generated for a complete solid material with overall dimension to be same as a 6 × 6 × 4 cell InsideBCC. In this case, the equivalent solid properties obtained from steps (a–c) above were used.
- Three samples of 6 × 6 × 4 cell InsideBCC were fabricated on a fused deposition modeling (FDM) uPrint SEplus 3D printer using acrylonitrile butadiene styrene (ABS). The samples are then tested under quasi-static compression test to compare their load–displacement behavior with that simulated from both solid material (step d) and LCS models (part c).
3. Experimental Procedure
3.1. InsideBCC LCS Layout, Fabrication and Material Used
The micromechanics ABAQUS software 6.17 was used to design all models for finite element (FE) simulation [17], printing purposes, and implementing experimental tests. The micromechanics technique has more flexibility for creating hexahedral mesh elements to increase the accuracy of results. InsideBCC unit cell was designed by micromechanics ABAQUS, as illustrated in Figure 3a. The dimensions of a single InsideBCC unit cell are 5 mm × 5 mm × 5 mm with a truss diameter of 1 mm. The overall dimensions to create the lattice structure of InsideBCC were 30 mm × 30 mm × 20 mm in x, y, and z-directions respectively as shown in Figure 3b. The configurations of InsideBCC geometry that were designed by micromechanics technique software are saved in stereolithography (STL), which is a format used to define the sample geometry of a 3D printer software Stratasys Catalyst [18]. These samples were fabricated by a fused deposition modeling (FDM) based uPrint SE plus 3D printer [19] using acrylonitrile butadiene styrene (ABS) material. Furthermore, the printer nozzle temperature of 300 °C and the chamber temperature of 77 °C were maintained, which were used as default temperature settings for all the specimens that were printed. Three samples were fabricated to conduct the experimental quasi-static compression test for validation of the results obtained from both the FEA models of equivalent solid material and whole lattice structure. Those specimens were fabricated with support material, which was removed using a Stratasys cleaning apparatus, SCA, 1200HT [20]. The printing parameters selected for this research were based on the references [9,10,16,21].
3.2. Quasi-Static Compression Test
The quasi-static compression test was performed to calculate material behaviors such as modulus of elasticity, and yield point of LCS. A universal testing machine, which is Instron 5500R, was used to conduct the compression test on the fabricated specimens of InsideBCC CLS with dimensions of 30 mm × 30 mm × 20 mm, consisting of 6 × 6 × 4 InsideBCC unit cells in x, y, and z direction respectively. All the samples of polymer cellular structure were compressed by 10 mm displacement with a constant displacement rate of 0.4 mm/min. A software connected with the Instron machine 5500R was used to collect the load–displacement data, which was saved in Excel. The completed final specimen of LCS for compression testing is illustrated in Figure 4.
4. Finite Element Modeling
Both the InsideBCC unit cell (for steps a and c in Section 2) and LCS (for step d in Section 2) were designed and meshed using the intervention technique, which was developed in the micromechanics technique of ABAQUS/CAE 6.17 software. The developing micromechanics technique (DMT) has drastically simplified the selection of element types during mesh generation for a combining cellular structure. The DMT method addresses the challenges associated with the complexity of the InsideBCC unit cell and LCS to generate hexahedral mesh. The general process flow of the DMT method is schematically illustrated in Figure 5 in which the InsideBCC unit cell and LCS were designed and meshed. Seven essential steps are to: (1) create the single strut by using five points in one plane as a deformable coordinates point; (2) create four struts as a basis of a frame; (3) generate the frame by a mirror and then by using cell partition, which is defined as a cutting plane in order to complete the whole frame; (4) as a separate process, generate a single BCC unit lattice cell; (5) join the BCC unit cell inside the frame to create the InsideBCC unit cell; (6) using the linear pattern in order to generate the number of unit cells in all direction x, y, and z; and (7) finally, generate mesh using mesh controls by selecting the Hex option.
4.1. Unit Cell Modeling for Equivalent Solid Properties
In this step, the FEA was employed to model the compression and shear test of an InsideBCC unit cell geometry for different directions within the elastic limit to predict equivalent solid properties of the whole cellular structure. The unit cell has dimensions 5 mm × 5 mm × 5 mm and the diameter struts of 1 mm (Figure 3a). ABS polymer material was employed for all finite element FE models.
4.1.1. Mesh Generation
In general, two element types are usually used for mesh generation, which are tetrahedron and hexahedron. In the field of mesh generation, researchers have used tetrahedral elements that can be easily created automatically in most finite element models [22,23,24]. However, user intervention is required to create a hexahedral mesh element, which provides high performance and it gives accurate results as compared with the tetrahedral mesh elements [20,25,26]. Therefore, in this research to generate the mesh for all FE simulation, a hexahedral element type is used by the MTD technique, which in turn gives the capability to use a first-order hexahedron continuum solid element with linear brick reduced integration (C3D8R).
Since meshing is significantly better at providing accurate results, both mesh sensitivity analysis and the type of mesh generation were considered. To achieve FEA with high performance, in this work, a mesh sensitivity analysis was performed on a unit cell. Accordingly, mesh sensitivity was performed by observing the stiffness versus the total number of the elements under compression, which is illustrated in Figure 6. Additionally, this curve illustrated the mesh convergence that occurred when the mesh size decreased from 1.25 (coarse) to 0.19 (fine) when the percentage variation of stiffness was within 2%. Based on this percentage, the acceptable mesh size chosen from the mesh convergence study was 0.35 mm, the total number of elements was 2400 elements, and the amount of stiffness was 230.39 N/mm. A discretized model shows the acceptable mesh size employed for the InsideBCC model is illustrated in Figure 6 as an insert. In this research, the same procedure was followed to perform the mesh sensitivity analysis for all FE models.
4.1.2. Boundary Conditions
In the current research, for the aim of capturing the behavior of the entire heterogeneous cellular structures based on the analyses of the InsideBCC unit cell, only the periodic boundaries would suffice. Regarding both the elastic modulus and Poisson’s ratio, the lattice unit cell faces are free to move, including all translational and rotational degrees of freedom with respect to rigid plates as illustrated in Figure 7a. Typically, the rigid plate is a non-deformable plate when subjected to any certain load. Consequently, the applied displacement load with a specific amount on the reference point of the rigid plate will be distributed with the same value for the entire plate. To determine the elastic modulus and Poisson’s ratio, a compressive displacement was applied on one face (here, the top plate in Figure 7a toward the opposite face (here, the bottom plate in Figure 7b in the downward direction)). The reference plate on the bottom plate was to be fixed in all three directions as illustrated in Figure 7a. For the shear modulus simulation, the model was placed between two rigid plates, where each of the opposite unit cell faces were clamped with the corresponding plates as illustrated in Figure 7b. Shear displacement was applied on the top plate while the other face was kept fixed for all degrees of freedom as shown in Figure 7b. The displacement loading was applied using the dynamic explicit FEA simulation.
4.1.3. Material Properties
The bulk material properties of ABS used in the finite element models of the InsideBCC unit cell are illustrated in Table 1. Experimentally, three specimens were investigated to measure the material properties of the bulk material according to ASTM-D695, ISO 604 for standard compression and ASTM-D882 for tension tests [9,10,11,12,13,14,15,16].
4.2. InsideBCC LCS and Equivalent Solid Material Model
To demonstrate the performance of development of an elastic material model for InsideBCC lattice cell structures, two separate finite element models were developed under the compression load: one with a 6 × 6 × 4 cell InsideBCC lattice structure (for step d in Section 2) and one entirely solid (for step e in Section 2). The optimized discretized simulations of a 30 mm × 30 mm × 20 mm combining a lattice structure with a 5 mm × 5 mm × 5 mm unit cell having a strut diameter of 1 mm (Figure 8a) and 30 mm × 30 mm × 20 mm equivalent solid material (Figure 8b) are illustrated in Figure 8. The heterogeneous LCS in Figure 8a and the equivalent solid material in Figure 8b were simulated with hexagonal elements. The LCS model was generated and meshed using the DMT micromechanics technique as described in the previous section. Interestingly, the study of the mesh optimum sensitivity analysis shows the number of elements for the heterogeneous lattice structure model was 345,600 while the number of elements for the solid material model was 144,000, illustrated in Figure 8. In addition, the time required for that study to generate the mesh and seed part for the LCS model was about 12 h without running the FE simulation while the time required for creating the solid material model was about one second.
The raw material properties used for the LCS (Figure 8a) simulation of the FE model are shown previously in Table 1, whereas the equivalent solid properties obtained from the previous section was used for the solid model shown in Figure 8b.
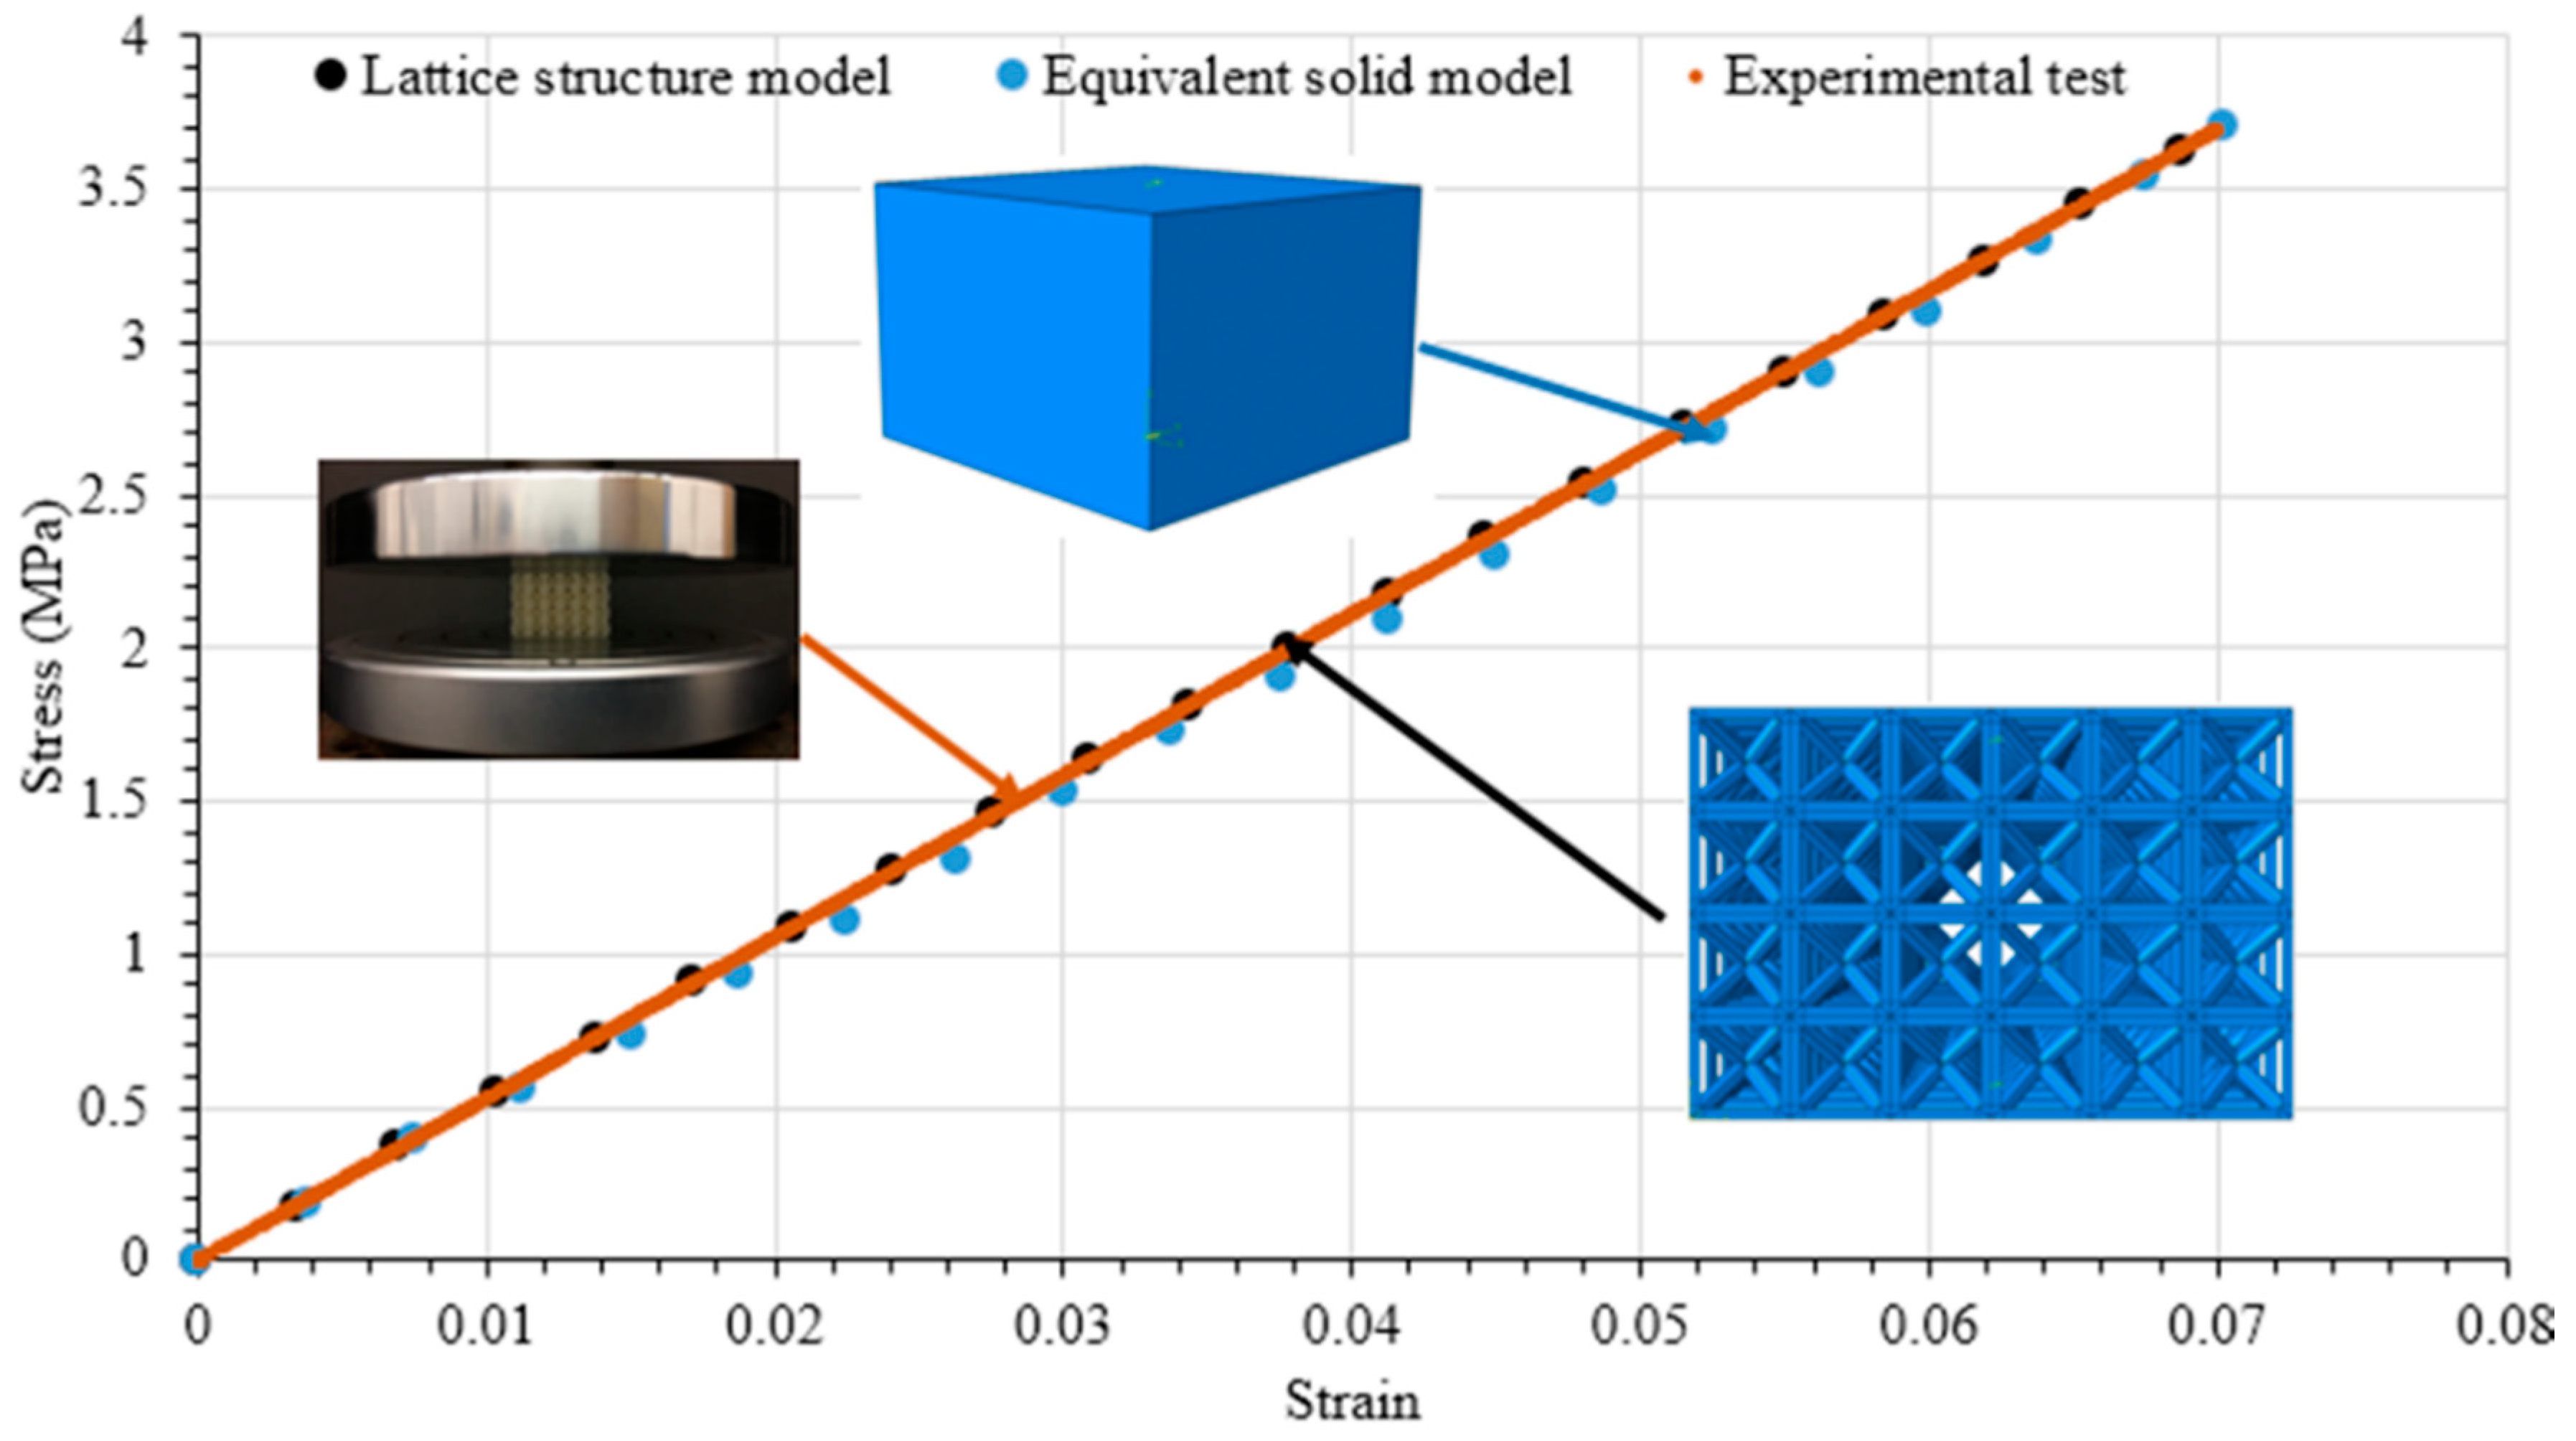
To mimic precise boundary conditions of the experimental test, the top and bottom faces of both the InsideBCC LCS in Figure 8a and the equivalent solid model in Figure 8b were tied to perfect rigid plates for all degrees of freedom. In that manner, a displacement load was applied on the top face of the model to move towards the bottom face. The stress–strain curves for both the fully lattice structure and equivalent solid model are illustrated in Figure 9 inclusive of the experimental results. In this figure, the experimental stress–strain plot was created based on the average modulus of elasticity of three LCS samples.
5. Results and Discussion
5.1. Load–Displacement Behavior
For InsideBCC configuration, load–displacement data from three samples (experimental) were plotted in one diagram to investigate the specimen to specimen variation under the compression load. The stress–stain behavior of three InsideBCC samples is illustrated in Figure 10. In this paper, the mechanical behavior of InsideBCC configuration under the compression load within the elastic limit was discussed. In other words, the elastic limit until the yield point was considered, which means the stages of lattice cell failure were not included in this study.
5.2. Comparison between Experimental and FEA Model
To show the implementation of the proposed equivalent solid material model method, two separate finite element models were developed for specimens under compression simulation. One of them is the InsideBCC lattice structure model with the raw material properties and the other one was the completely solid material model with equivalent properties to the InsideBCC unit cell. The equivalent solid material properties obtained from unit cell models were Ee = 46.12 MPa, Ge = 21.77 MPa, and νe = 0.42. The outcomes of both FE models (the heterogeneous lattice structure model and equivalent solid material model) were validated with the experimental result of 3D printed LCS. The load–displacement data in Figure 10 were converted to stress–strain plots and the slope of the linear region was used to calculate modulus of elasticity of LCS. The experimental stress–strain plot in Figure 9 was based on the average modulus of elasticity from three LCS samples. The stress–strain plots acquired from the lattice cell structure of FEA (black solid circles), equivalent solid material (blue solid circles), and the experimental test of 3D printed LCS (brown line) were compared with each other as shown in Figure 9. The proposed equivalent solid material had the capability to capture the mechanical behavior of a large-scale heterogeneous lattice structure model. As it can be observed from Figure 9, there was good agreement within the linear elastic limit among the results of the overall lattice cell structure model, the equivalent solid material model, and the experimental work. Accordingly, the equivalent solid material model for a lattice-based structure gave accurate and acceptable capturing for the mechanical behavior of a full-scale heterogeneous lattice structure.
5.3. Comparison between BCC LCS and InsideBCC CLCS
Representative load–displacement behavior of both BCC and InsideBCC ABS samples were plotted together to compare the variation of compression behavior, which is illustrated in Figure 11. For the BCC sample the maximum failure or peak load was about 500 N while the InsideBCC sample was about 4000 N. Thus, it could be concluded that the InsideBCC lattice cell structures involving vertical and horizontal struts shows enormously higher stiffness and failure load than the BCC geometry. Additionally, from the area under the load–displacement curve, the strain energy absorption is lowest for the BCC feature, while the InsideBCC configuration had the largest one. Stiffness, failure load, and energy absorption for various parameters such as the strut diameter, cell size, and processing factors will be further investigated by developing a surrogate model using the intelligent method. The improved mechanical performance of InsideBCC LCS can be used for specific applications that required unique load–displacement characteristics.
6. Summary and Remarks
In this paper, the equivalent solid material model was developed such that the equivalent properties of heterogeneous unit cell configuration (InsideBCC) were used to mimic the behavior of the mechanical response of heterogeneous lattice structures involving vertical and horizontal struts for engineering design exploration. Consequently, the equivalent solid material model of InsideBCC configuration is very quick, accurate and practical when compared with a numerical model of the full-scale heterogeneous lattice structure. Therefore, developing an equivalent solid material not only demonstrates the computational time reduction from several days to few minutes but also provides an efficient analysis for FE simulation of InsideBCC LCS. Besides, one of the biggest challenges is to use FDM based 3D printing technology to create the InsideBCC lattice structure with vertical and horizontal struts. As a futuristic technique for this research, a surrogate model will be developed to determine the equivalent material properties for larger and more complicated combined LCS, with any arbitrary cell size, strut diameter, and type of material, which can be used for FEA simulations with a considerable reduction in the computational time.
Author Contributions
Conceptualization, T.A.A. and A.M.; methodology, T.A.A. and A.M.; formal analysis, T.A.A.; investigation, T.A.A. and A.M.; resources, A.M.; data curation, T.A.A.; writing—original draft preparation, T.A.A.; writing—review and editing, A.M.; supervision, A.M.; project administration, A.M. All authors have read and agreed to the published version of the manuscript.
Funding
This research received no external funding.
Conflicts of Interest
The authors declare no conflict of interest.
References
- Wilmoth, N. Determining the Mechanical Properties of Lattice Block Structures; NASA Technical Report Server; National Aeronautics and Space Administration: Cleveland, OH, USA, 2013. Available online: https://ntrs.nasa.gov/archive/nasa/casi.ntrs.nasa.gov/20130014836.pdf (accessed on 16 June 2020).
- Bible, M.; Sefa, M.; Fedchak, J.A.; Scherschligt, J.; Natarajan, B.; Ahmed, Z.; Hartings, M.R. 3D-Printed Acrylonitrile Butadiene Styrene-Metal Organic Framework Composite Materials and Their Gas Storage Properties. 3D Print. Addit. Manuf. 2018, 5, 63–72. [Google Scholar] [CrossRef]
- Wong, M.; Owen, I.; Sutcliffe, C. Convective heat transfer and pressure losses across novel heat sinks fabricated by Selective Laser Melting. Int. J. Heat Mass Transf. 2009, 52, 281–288. [Google Scholar] [CrossRef]
- Al-Saedi, D.; Masood, S.; Faizn, M. Mechanical properties and energy absorption capability of functionally graded F2BCC lattice fabricated by SLM. Mater. Sci. Eng. 2018, 144, 32–44. [Google Scholar] [CrossRef]
- Mahmoud, D.; Elbestawi, M. Lattice Structures and Functionally Graded Applications in Additive Manufacturing of Orthopedic Implants. Manuf. Mater. Process. 2017, 1, 13. [Google Scholar] [CrossRef]
- Ulah, L.; Brandt, M.; Feih, S. Failure and energy absorption characteristics of advanced 3D truss core structures. Mater. Des. 2016, 92, 937–948. [Google Scholar] [CrossRef]
- Alsalla, H.; Hao, L.; Smith, C. Fracture toughness and tensile strength of 316 L stainless steel cellular lattice structures manufactured using the selective laser melting technique. Mater. Sci. Eng. 2016, 669, 1–6. [Google Scholar] [CrossRef]
- Maskery, L.; Hussey, A.; Aremu, A.; Tuck, C.; Ashcroft, L.; Hague, R. An investigation into reinforced and functionally graded lattice structures. J. Cell. Plast. 2017, 53, 151–165. [Google Scholar] [CrossRef] [Green Version]
- Al Rifaie, M.J. Resilience and Toughness Behavior of 3D-Printed Polymer Lattice Structures: Testing and Modeling. Master’s Thesis, Wright State University, Dayton, OH, USA, 2017. [Google Scholar]
- Fadeel, A.; Mian, A.; Al Rifaie, M.; Srinivasan, R. Effect of Vertical Strut Arrangements on Compression Characteristics of 3D Printed Polymer Lattice Structures: Experimental and Computational Study. J. Mater. Eng. Perform. 2018, 1, 1–8. [Google Scholar] [CrossRef]
- Cetin, E.; Baykasoglu, C. Energy absorption of thin-walled tubes enhanced by lattice structures. Int. J. Mech. Sci. 2019, 158, 471–484. [Google Scholar] [CrossRef]
- Turner, A.J.; Al Rifaie, M.; Mian, A.; Srinivasan, R. Low-Velocity Impact Behavior of Sandwich Structures with Additively Manufactured Polymer Lattice Cores. ASM Int. 2018, 27, 2505–2512. [Google Scholar] [CrossRef]
- Lozanovski, B.; Leary, M.; Tran, P.; Qian, M.; Choong, P.; Brandt, M. Computational modelling of strut defects in SLM manufactured lattice structures. Mater. Des. 2019, 171, 107671. [Google Scholar] [CrossRef]
- Smith, M.; Guan, Z.; Cantwell, W. Finite element modelling of the compressive response of lattice structures manufactured using the selective laser melting technique. Int. J. Mech. Sci. 2013, 67, 28–41. [Google Scholar] [CrossRef]
- Koeppe, A.; Padilla, C.A.H.; Voshage, M.; Schleifenbaum, J.H.; Markert, B. Efficient numerical modeling of 3D-printed lattice-cell structures using neural networks. Manuf. Lett. 2018, 15, 147–150. [Google Scholar] [CrossRef]
- Alwattar, T.A.; Mian, A. Development of an Elastic Material Model for BCC Lattice Cell Structures Using Finite Element Analysis and Neural Networks Approaches. J. Compos. Sci. 2019, 3, 33. [Google Scholar] [CrossRef] [Green Version]
- Study Part Module in ABAQUS CAE 6.17 Documentation; DS Simulia: Providence, RI, USA, 2017.
- Chakravorty, D. Craftcloud. 2019. Available online: http://all3dp.com/what-is-stl-file-format-extension-3d-printing (accessed on 16 June 2020).
- Stratasys. uPrint SE Plus. 2017. Available online: https://support.stratasys.com/products/fdm-platforms/uprint (accessed on 16 June 2020).
- Support Removal. Available online: https://www.oryxadditive.com/sca-1200ht (accessed on 16 June 2020).
- Abdulhadi, H.S.; Mian, A. Effect of strut length and orientation on elastic mechanical response of modified body-centered cubic lattice structures. J. Mater. Des. Appl. 2019, 233, 2219–2233. [Google Scholar] [CrossRef]
- Ravari, M.K.; Kadkhodaei, M.; Badrossamay, M.; Razaei, R. Numerical investigation on mechanical properties of cellular lattice structures fabricated fused deposition modeling. Int. J. Mech. Sci. 2014, 88, 154–161. [Google Scholar] [CrossRef]
- Cuan-Urquizo, E.; Bhaskar, A. Flexural elasticity of woodpile lattice beams. Eur. J. Mech. A Solids 2018, 67, 187–199. [Google Scholar] [CrossRef] [Green Version]
- Chen, W.; Lee, T.; Lee, P.; Lee, J.W.; Lee, S. Effects of internal stress concentrations in plantar soft-tissue—A preliminary three-dimensional finite element analysis. Med. Eng. Phys. 2010, 32, 324–331. [Google Scholar] [CrossRef]
- Tadepalli, S.C.; Erdemir, A.; Cavanagh, P.R. Comparison of hexahedral and tetrahedral elements in finite element analysis of the foot and footwear. J. Biomech. 2011, 44, 2337–2343. [Google Scholar] [CrossRef]
- Oliveira, B.; Sundnes, J. Comparison of Tetrahedral and Hexahedral Meshes for Finite Element Simulation of Cardiac Electro-Mechanics. In Proceedings of the VII European Congress on Computational Methods in Applied Sciences and Engineering, Crete Island, Greece, 5–10 June 2016; pp. 164–177. [Google Scholar]
Figure 1.
Combining frame and body-centered cubic (BCC) unit cells to develop an InsideBCC unit cell.
Figure 1.
Combining frame and body-centered cubic (BCC) unit cells to develop an InsideBCC unit cell.

Figure 2.
A methodology strategy from unit cell finite elemental analysis (FEA) model to equivalent solid model of InsideBCC configuration.
Figure 2.
A methodology strategy from unit cell finite elemental analysis (FEA) model to equivalent solid model of InsideBCC configuration.

Figure 3.
Micromechanics technique design (MTD). (a) InsideBCC unit cell. (b) InsideBCC lattice structure.
Figure 3.
Micromechanics technique design (MTD). (a) InsideBCC unit cell. (b) InsideBCC lattice structure.

Figure 4.
Experimental procedures, (a) specimen design in MTD; (b) fabricated sample under compression; and (c) zoomed-in view of 3D printed sample within compression test fixture.
Figure 4.
Experimental procedures, (a) specimen design in MTD; (b) fabricated sample under compression; and (c) zoomed-in view of 3D printed sample within compression test fixture.

Figure 5.
Framework for developing micromechanics technique using ABAQUS.

Figure 6.
Mesh sensitivity study of the InsideBCC unit cell (5 × 5 × 5) mm and d = 1 mm for mesh size from 1.25 mm (coarse) to 0.19 mm (fine).
Figure 6.
Mesh sensitivity study of the InsideBCC unit cell (5 × 5 × 5) mm and d = 1 mm for mesh size from 1.25 mm (coarse) to 0.19 mm (fine).

Figure 7.
(a) Boundary conditions of the unit cell FEA model for the elastic modulus and Poisson’s ratio in all three directions x, y, and z. (b) Boundary conditions of the unit cell FEA model for the shear modulus in all three directions x, y, and z.
Figure 7.
(a) Boundary conditions of the unit cell FEA model for the elastic modulus and Poisson’s ratio in all three directions x, y, and z. (b) Boundary conditions of the unit cell FEA model for the shear modulus in all three directions x, y, and z.

Figure 8.
FEA mesh of full simulation for (a) the InsideBCC lattice cell structure (LCS) model and (b) the equivalent solid model.
Figure 8.
FEA mesh of full simulation for (a) the InsideBCC lattice cell structure (LCS) model and (b) the equivalent solid model.

Figure 9.
Comparison of the FEA simulation of the LCS model, experimental test, and equivalent solid model.
Figure 9.
Comparison of the FEA simulation of the LCS model, experimental test, and equivalent solid model.

Figure 10.
Stress–strain curves for three InsideBCC specimens.

Figure 11.
Comparison of load—displacement curves for BCC and InsideBCC configurations: BCC sample (brawn line) and InsideBCC sample (blue line).
Figure 11.
Comparison of load—displacement curves for BCC and InsideBCC configurations: BCC sample (brawn line) and InsideBCC sample (blue line).


Table 1.
Bulk material properties of ABS material.
| Young’s Modulus (MPa) | Poisson’s Ratio | Density (g/mm3) | Yield Strength (MPa) | Ultimate Tensile Strength (MPa) | Plastic Strain (mm/mm) |
|---|---|---|---|---|---|
| 861.55 | 0.35 | 7.92 × 10⁻⁴ | 25.75 | 33.33 | 0.045 |
© 2020 by the authors. Licensee MDPI, Basel, Switzerland. This article is an open access article distributed under the terms and conditions of the Creative Commons Attribution (CC BY) license (http://creativecommons.org/licenses/by/4.0/).
Share and Cite
MDPI and ACS Style
Alwattar, T.A.; Mian, A. Developing an Equivalent Solid Material Model for BCC Lattice Cell Structures Involving Vertical and Horizontal Struts. J. Compos. Sci. 2020, 4, 74. https://0-doi-org.brum.beds.ac.uk/10.3390/jcs4020074
AMA Style
Alwattar TA, Mian A. Developing an Equivalent Solid Material Model for BCC Lattice Cell Structures Involving Vertical and Horizontal Struts. Journal of Composites Science. 2020; 4(2):74. https://0-doi-org.brum.beds.ac.uk/10.3390/jcs4020074
Chicago/Turabian StyleAlwattar, Tahseen A., and Ahsan Mian. 2020. "Developing an Equivalent Solid Material Model for BCC Lattice Cell Structures Involving Vertical and Horizontal Struts" Journal of Composites Science 4, no. 2: 74. https://0-doi-org.brum.beds.ac.uk/10.3390/jcs4020074