Process Chain Optimization for SWCNT/Epoxy Nanocomposite Parts with Improved Electrical Properties


Abstract
:1. Introduction
2. Materials and Methods
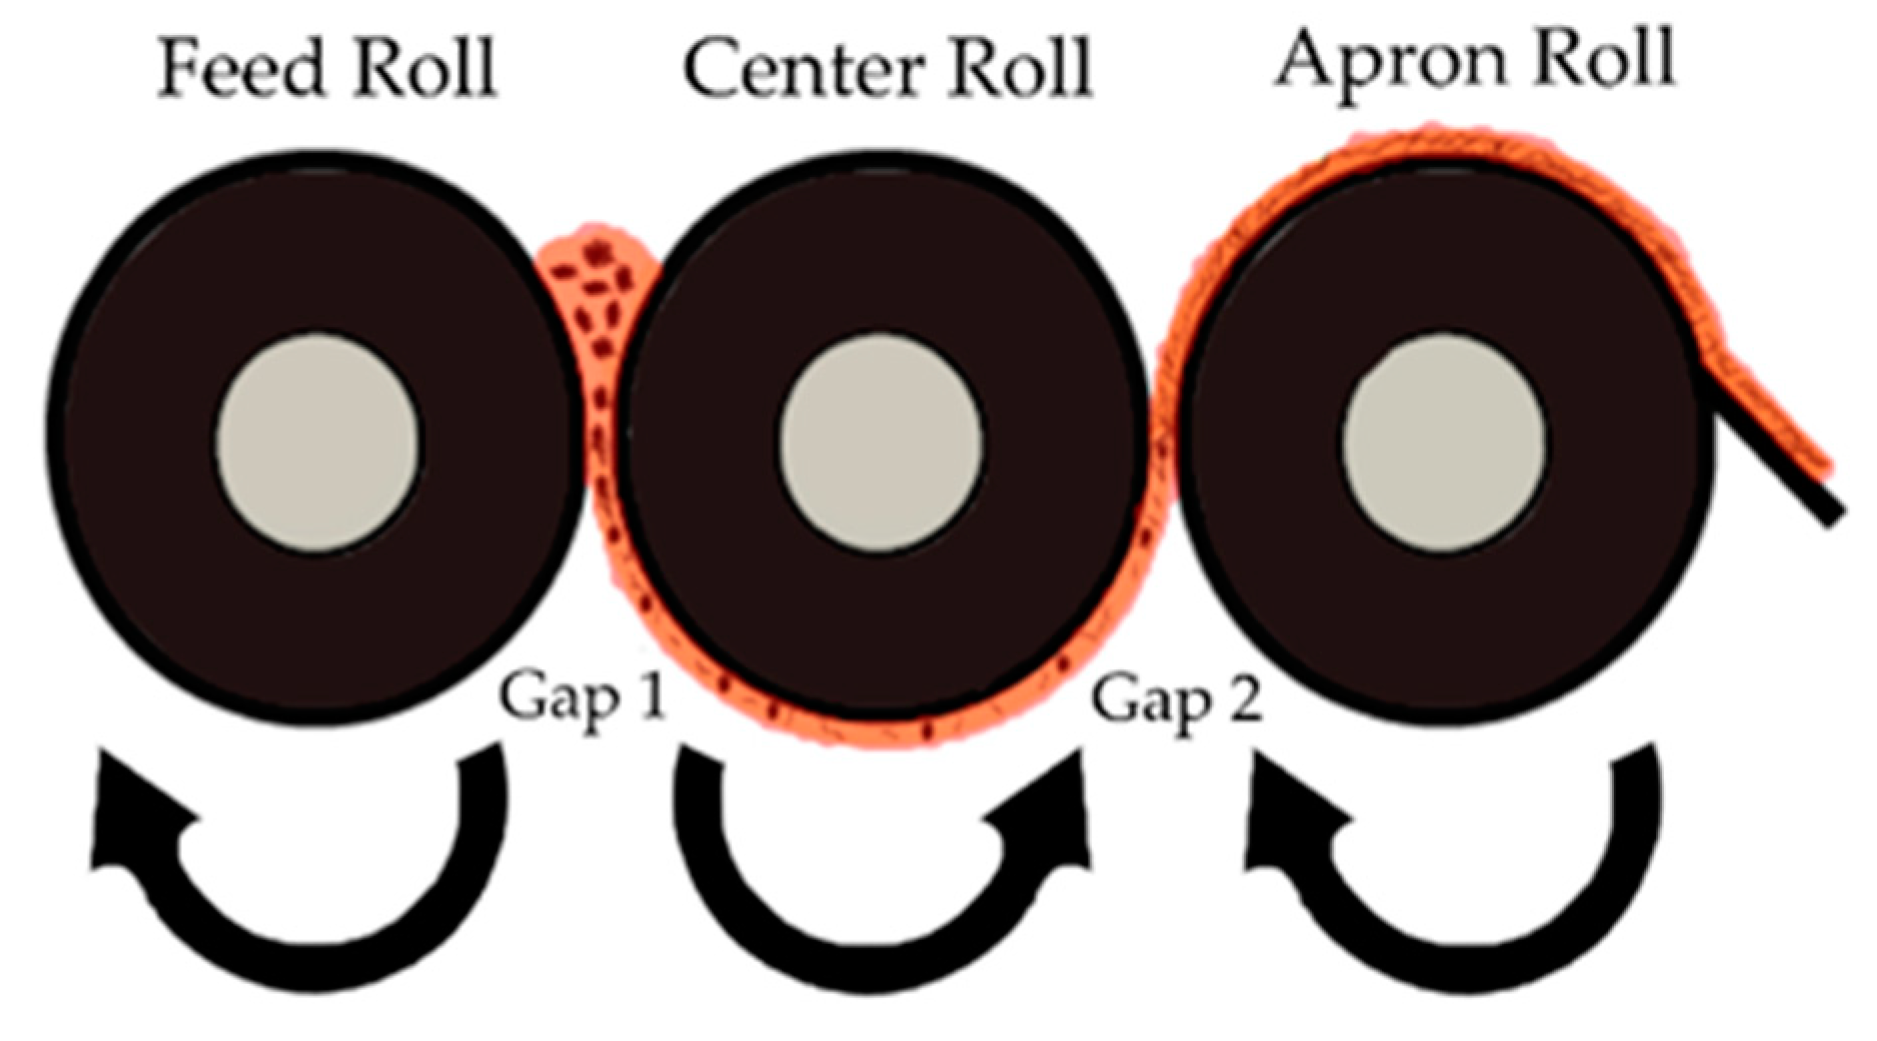
- Dispersion of nanoparticles in the liquid resin (with a three-roll mill);
- Addition of the curing agent in the correct stoichiometric amount;
- Feeding the mold, setting the electric field and the curing temperature;
- After reaction completion, removal of the field and retrieval of the samples.
2.1. Materials
2.2. Dispersion of SWNTs in Epoxy
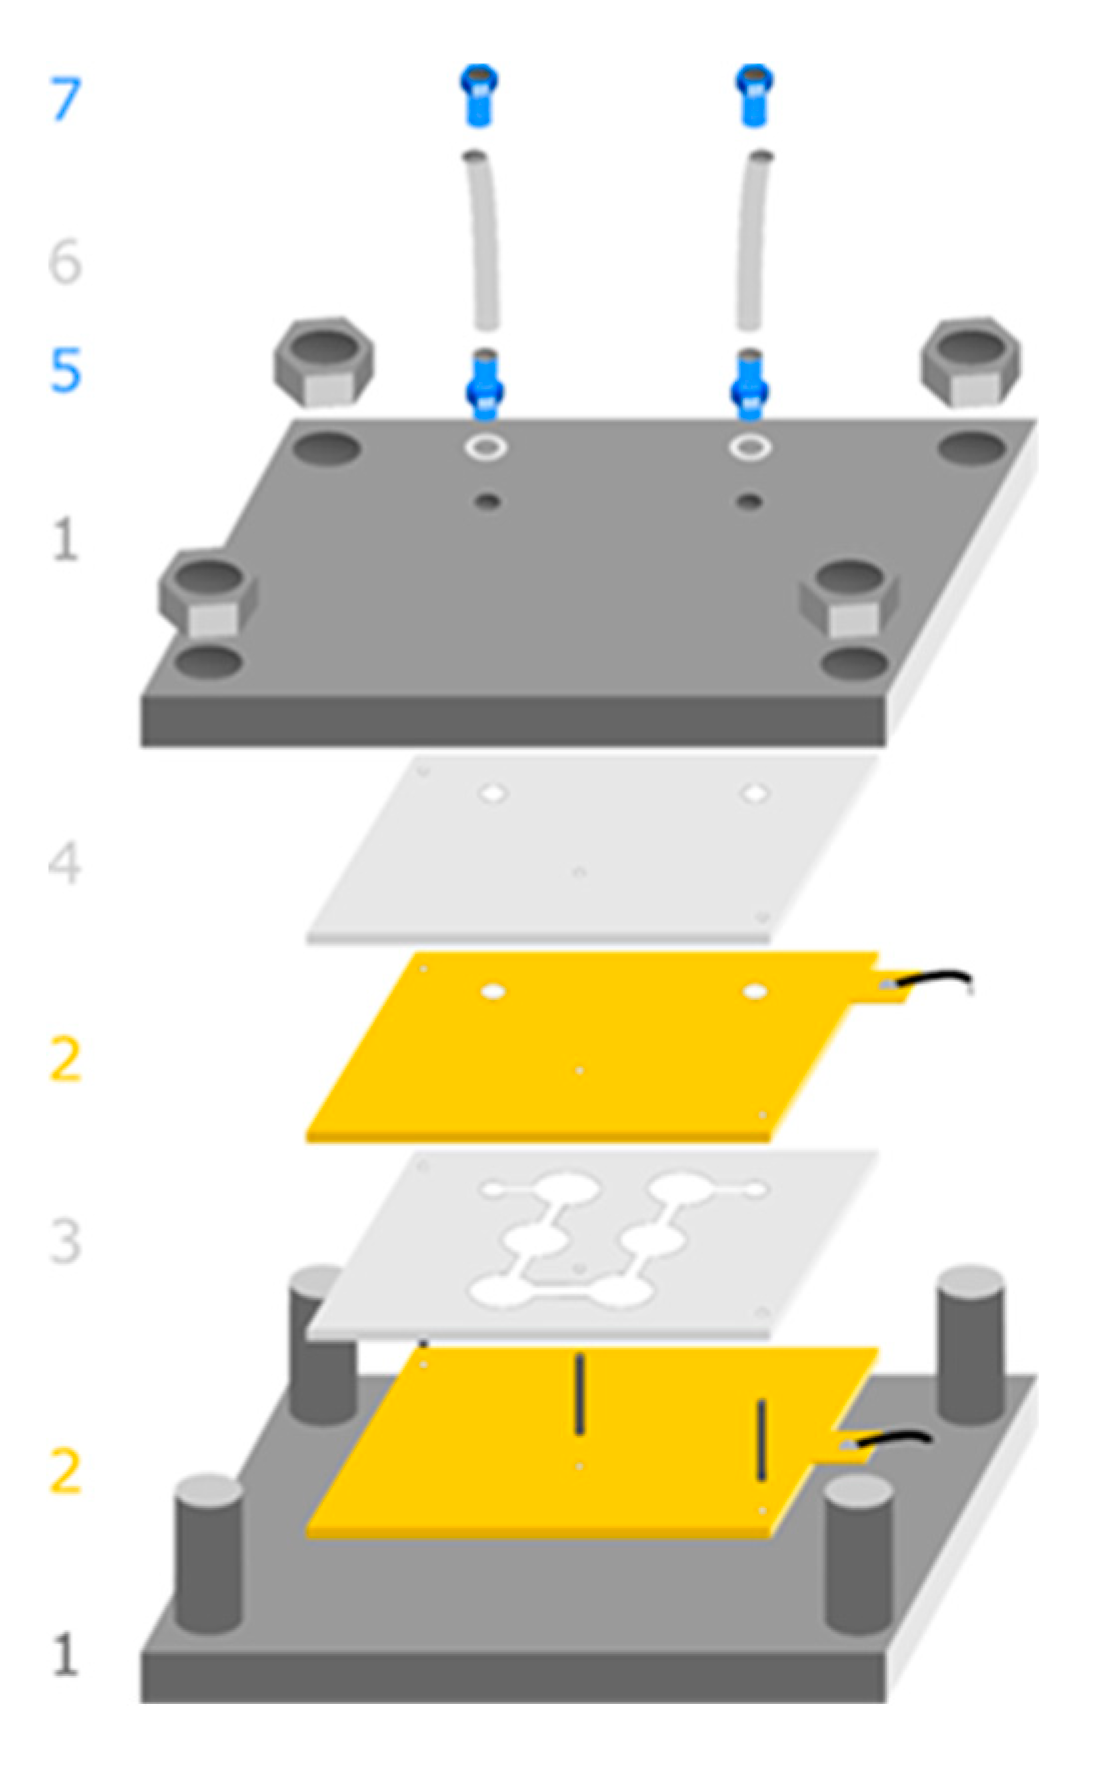
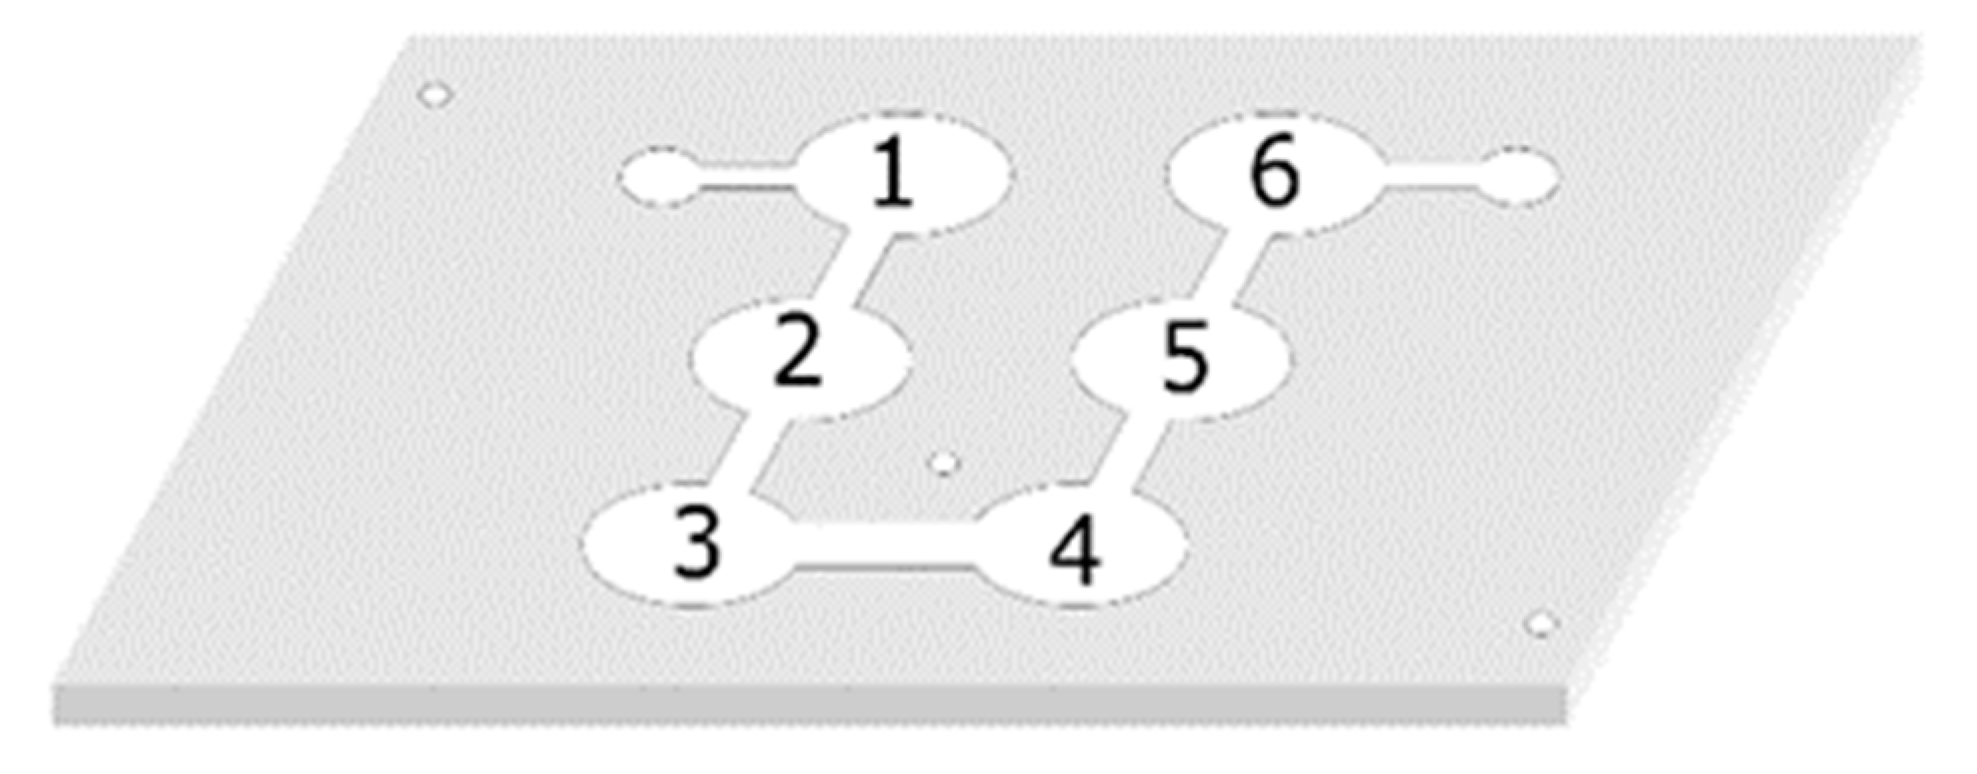
2.3. Set-Up for Electric Field Application
2.4. Electric Field
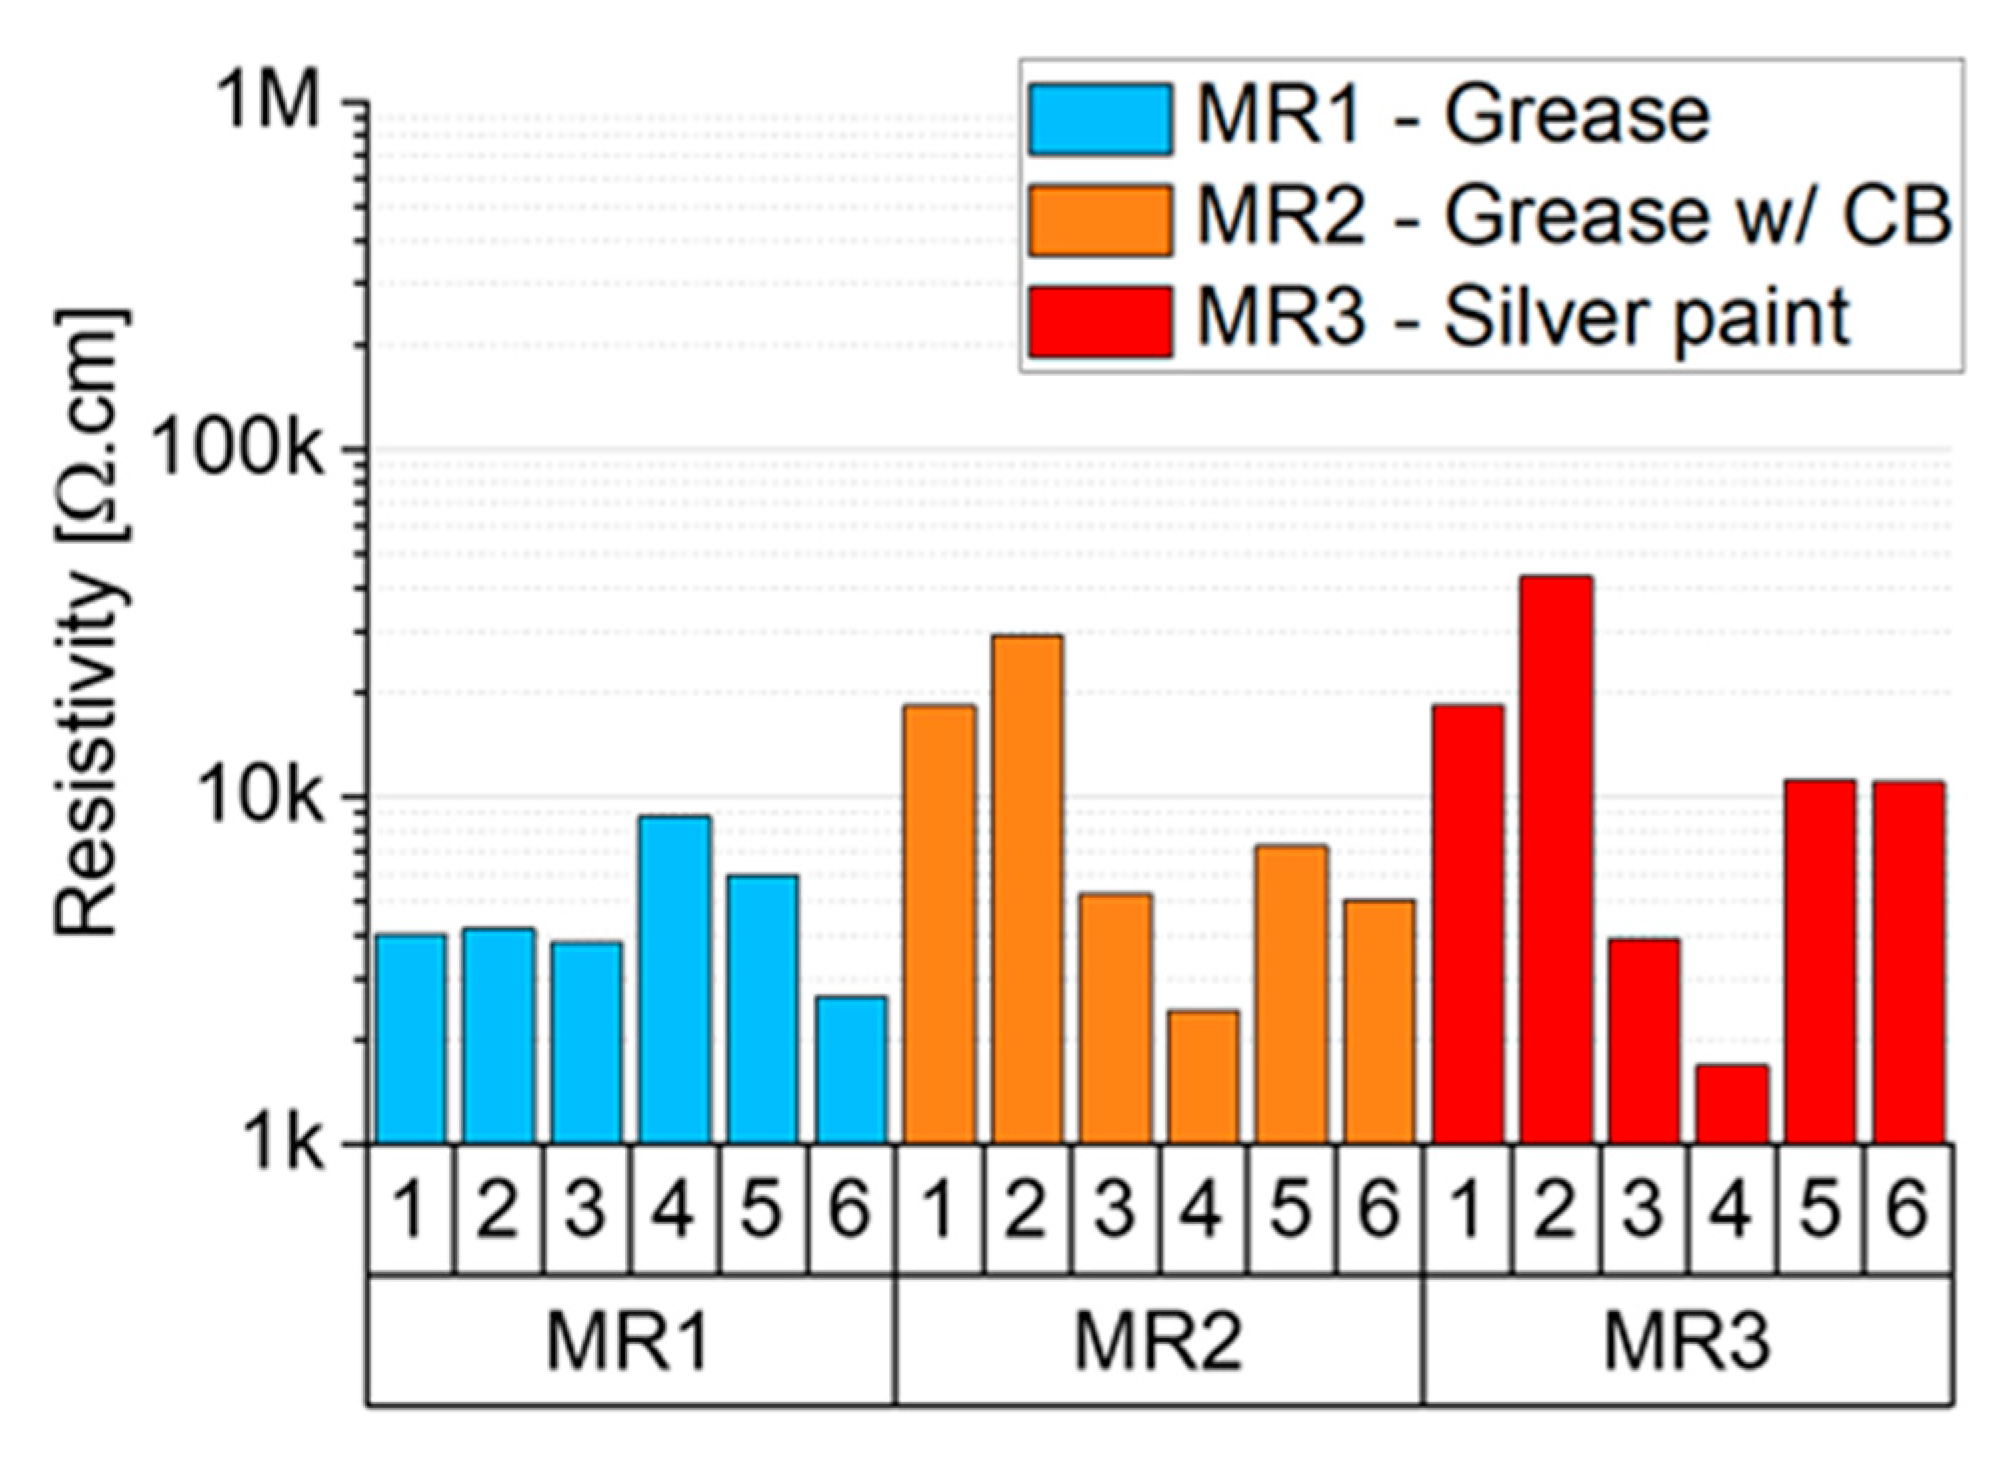
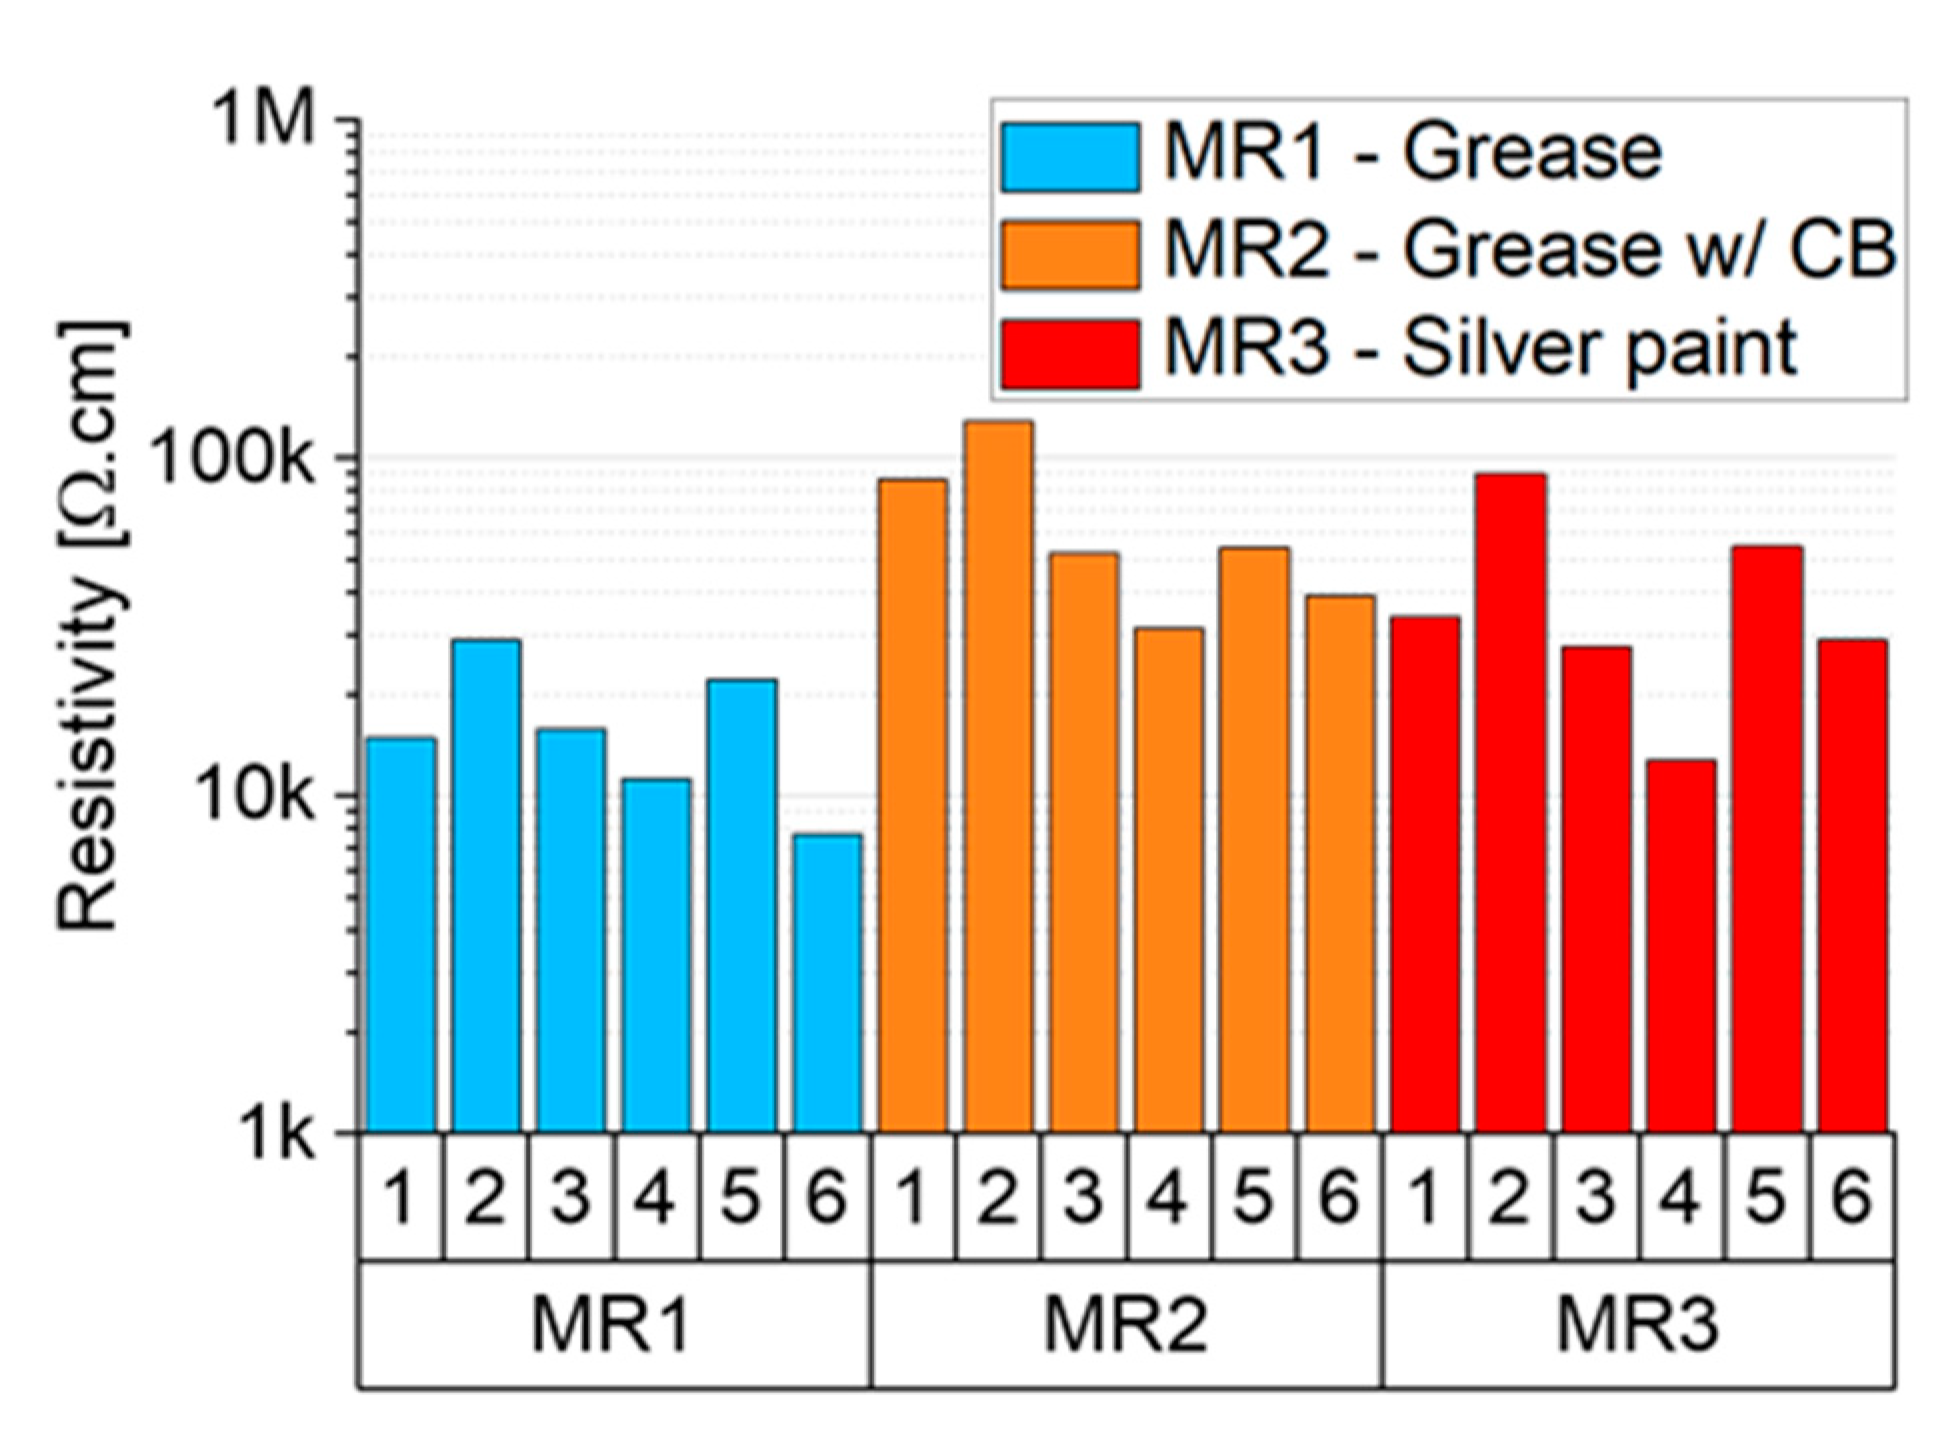
2.5. Characterization of Electrical Resistivity
3. Results
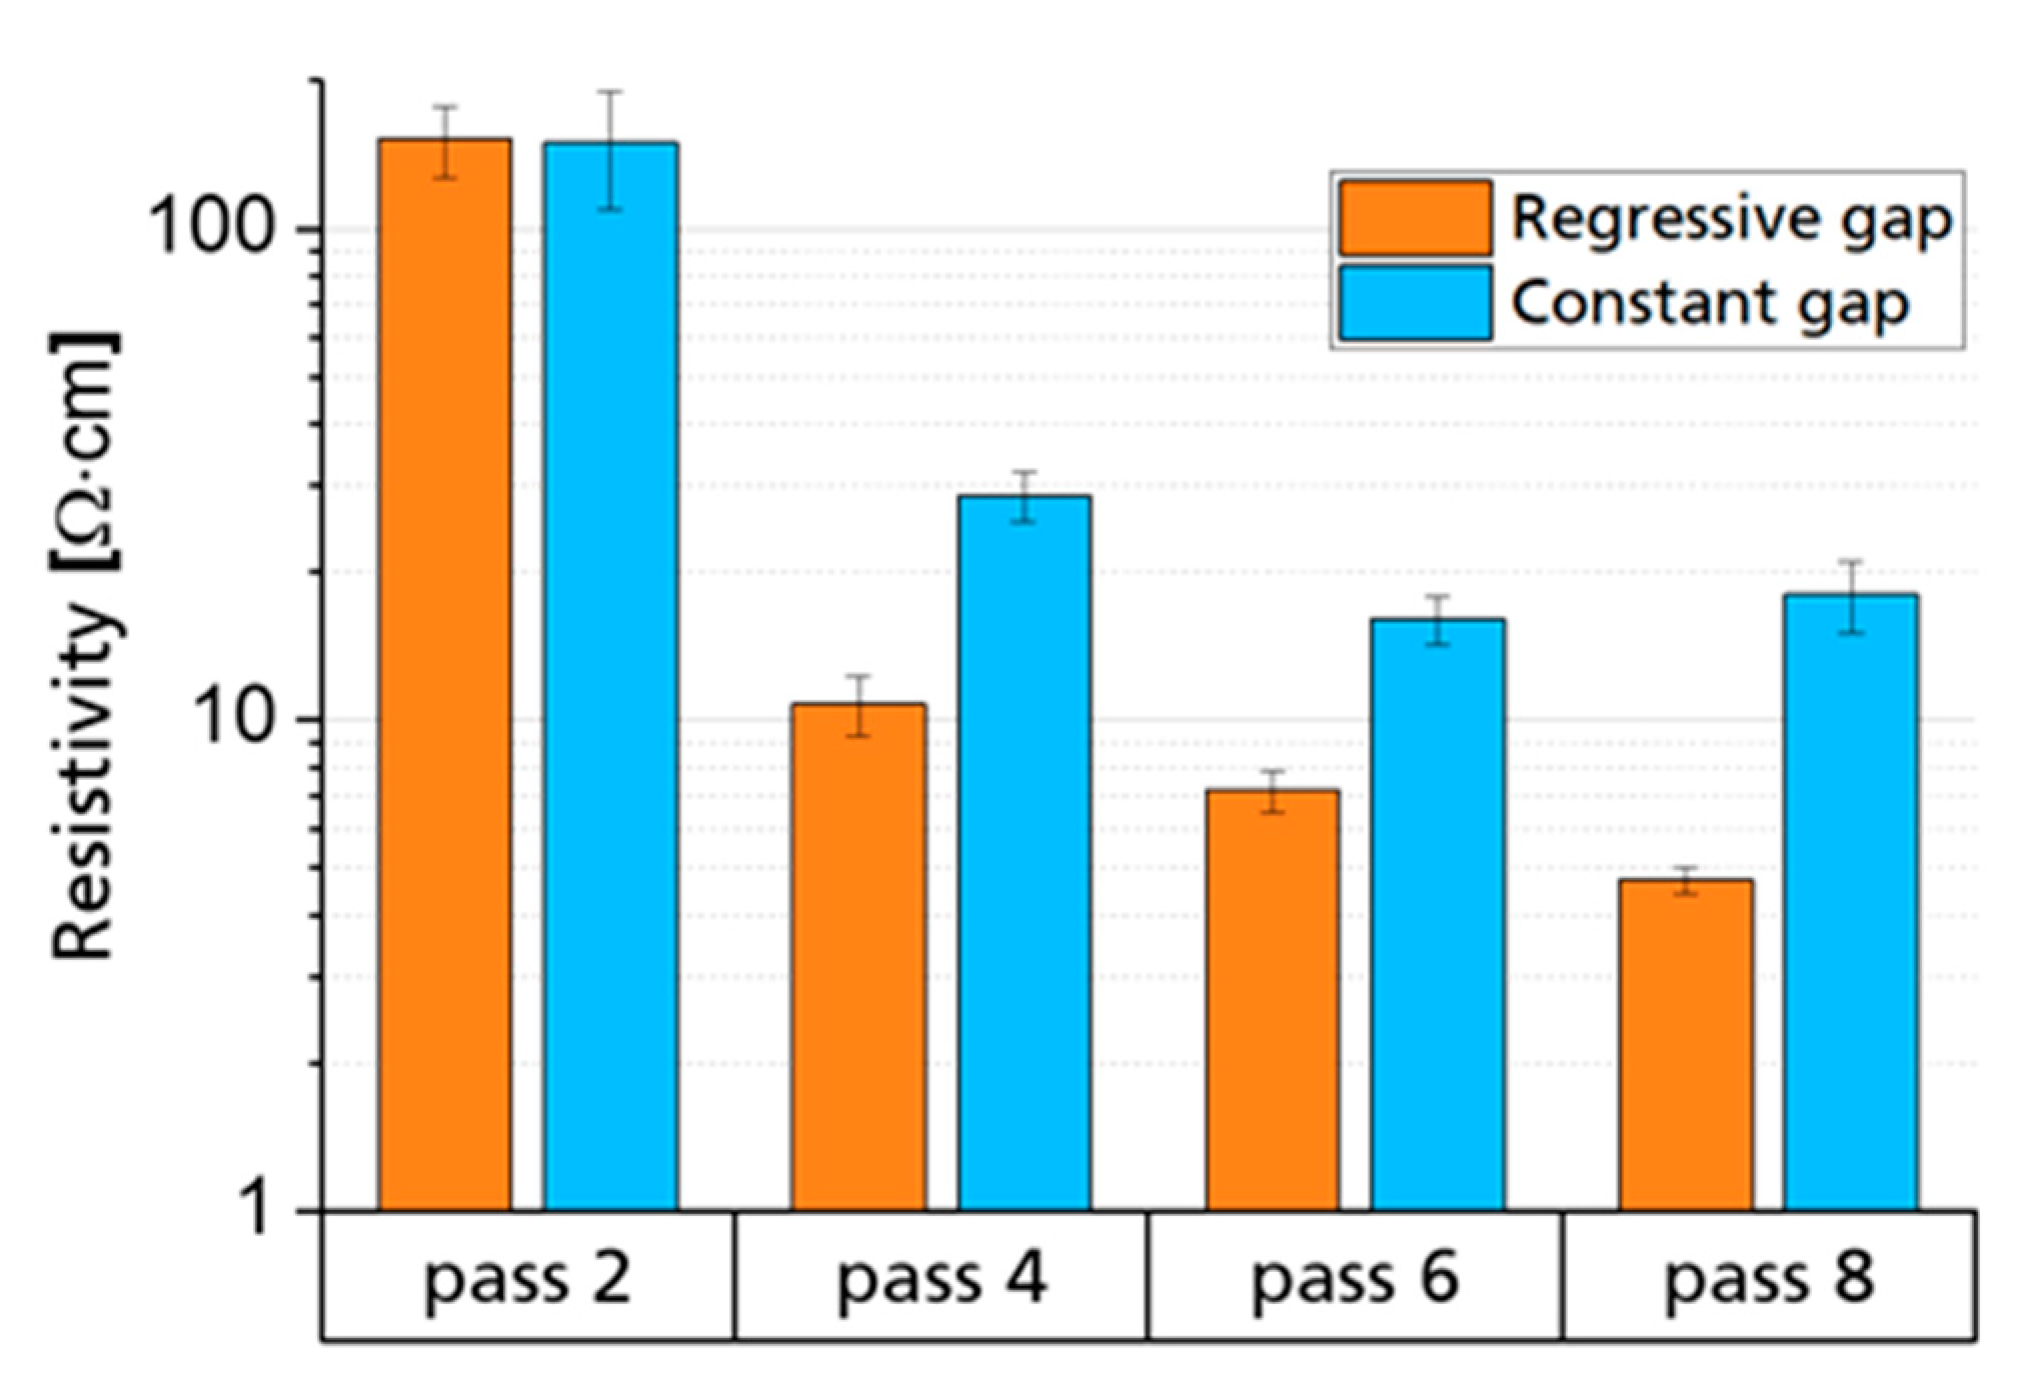
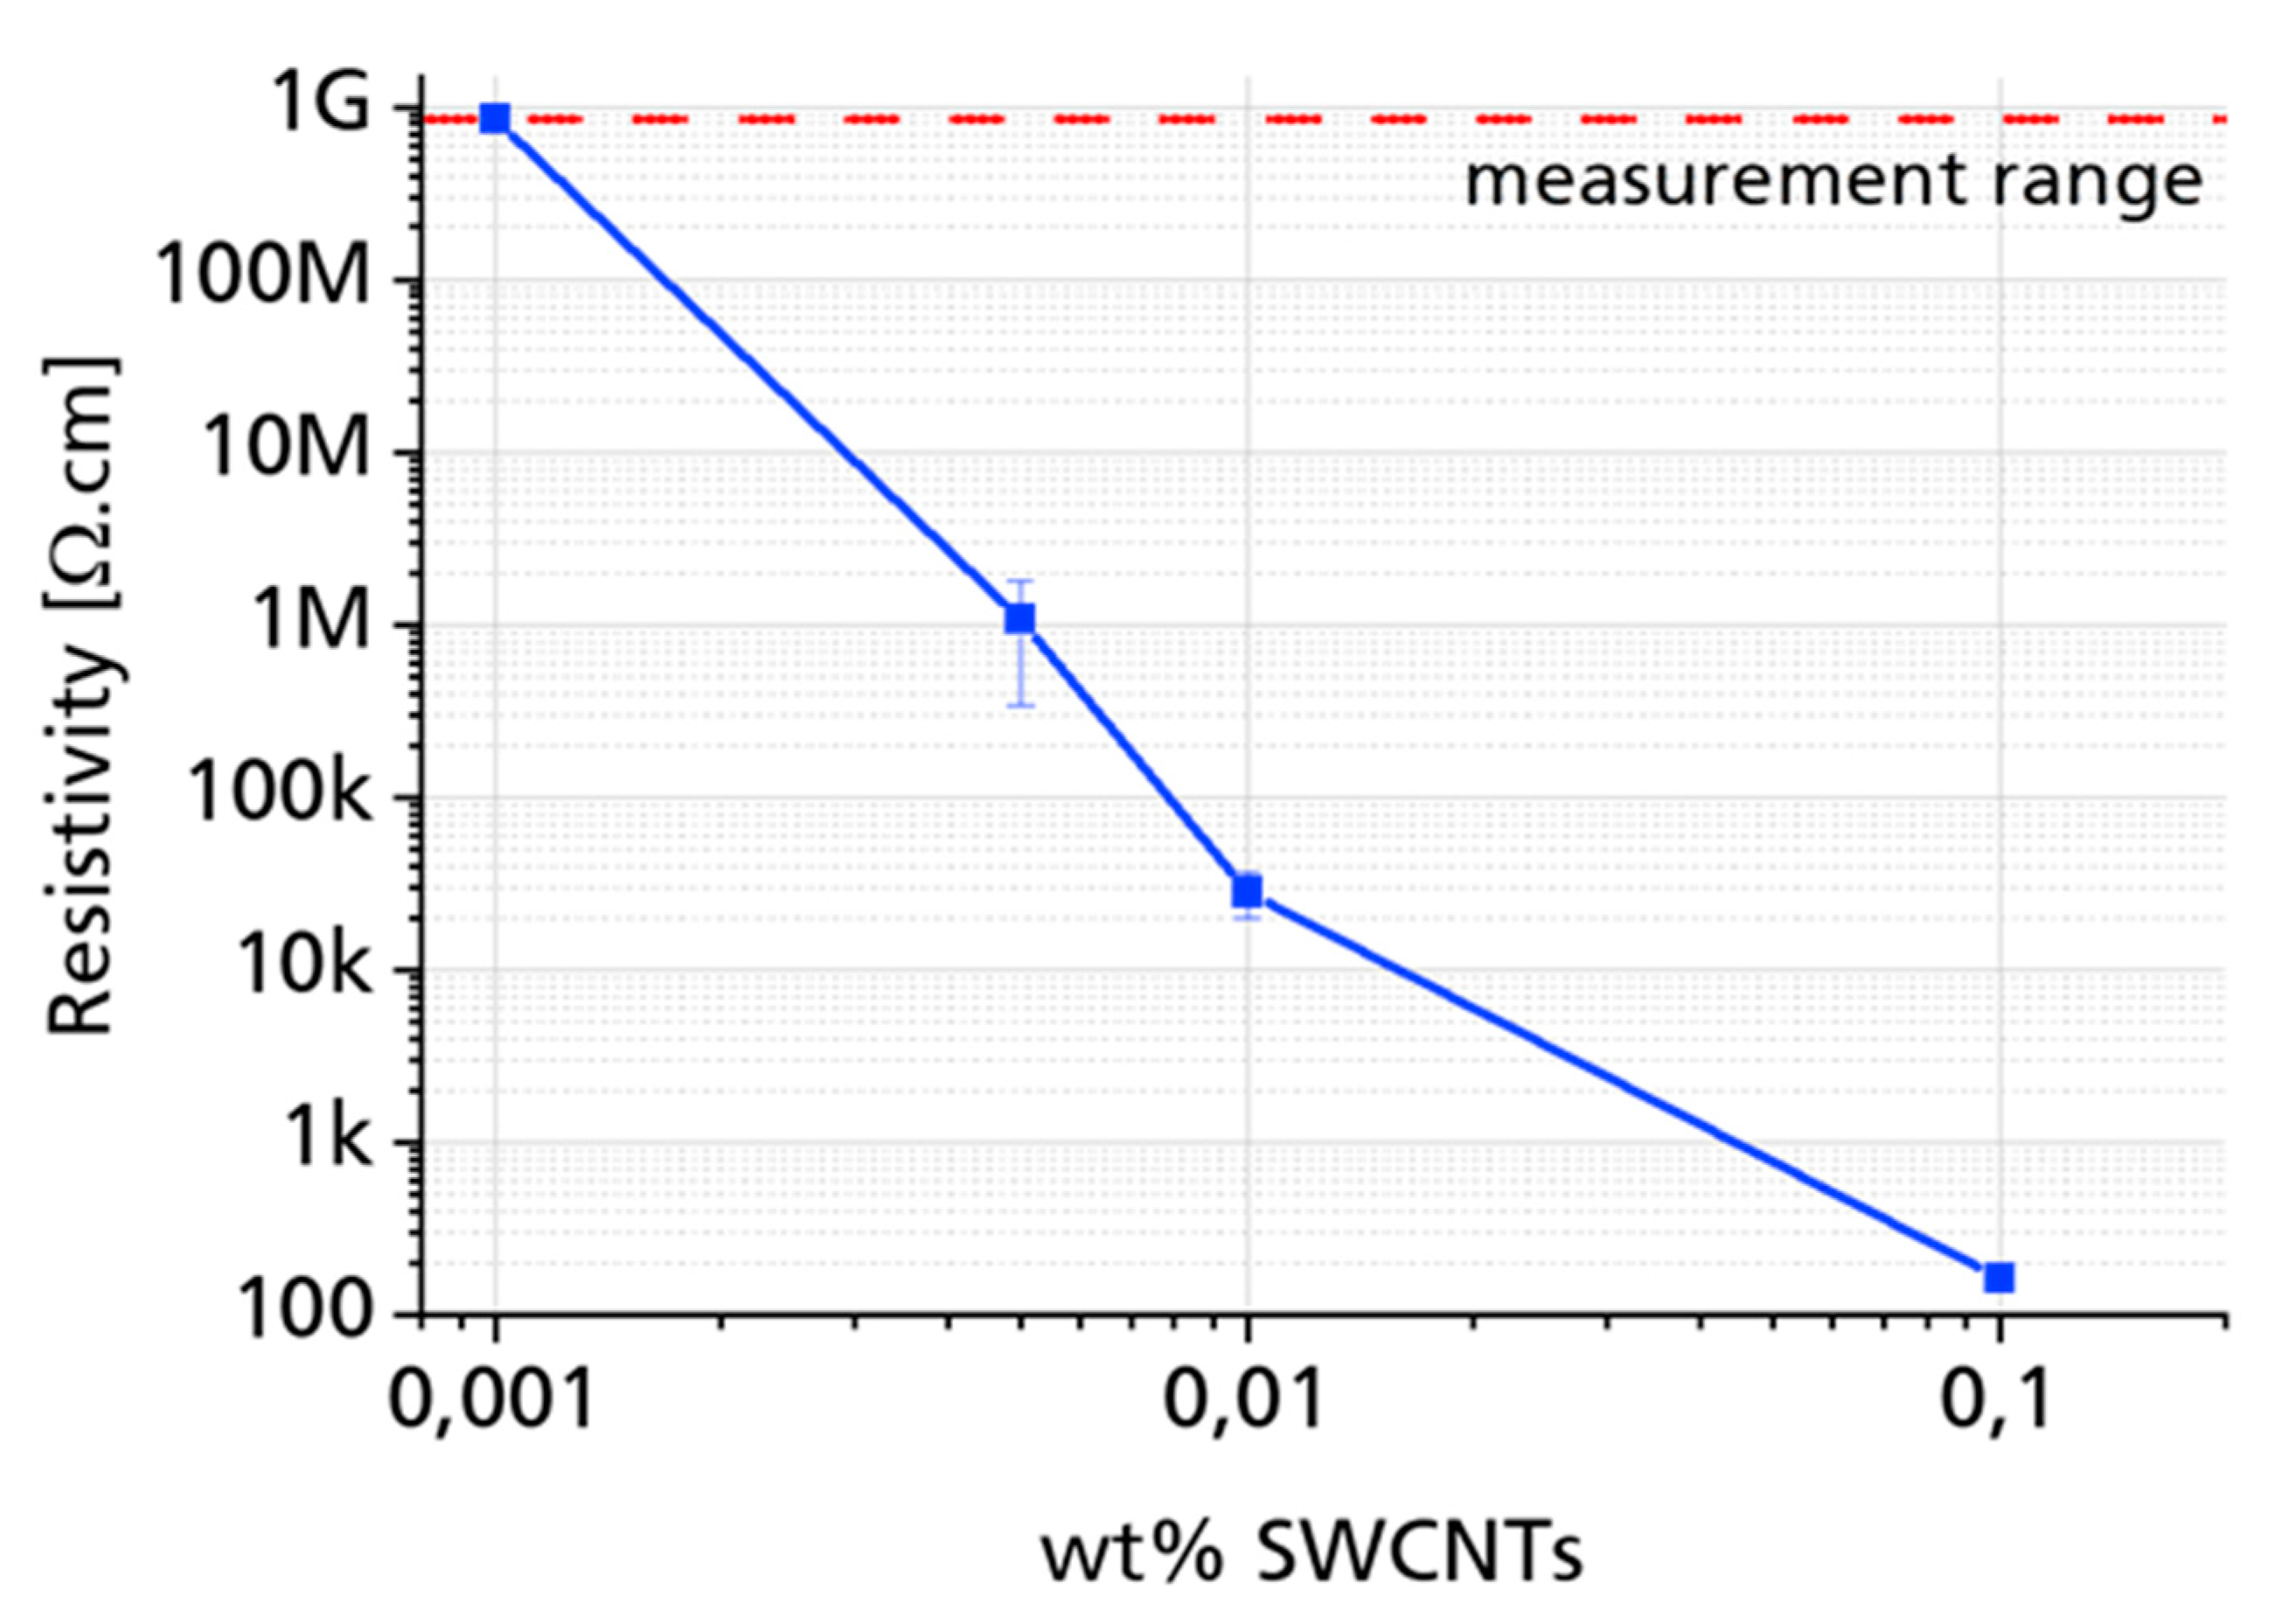
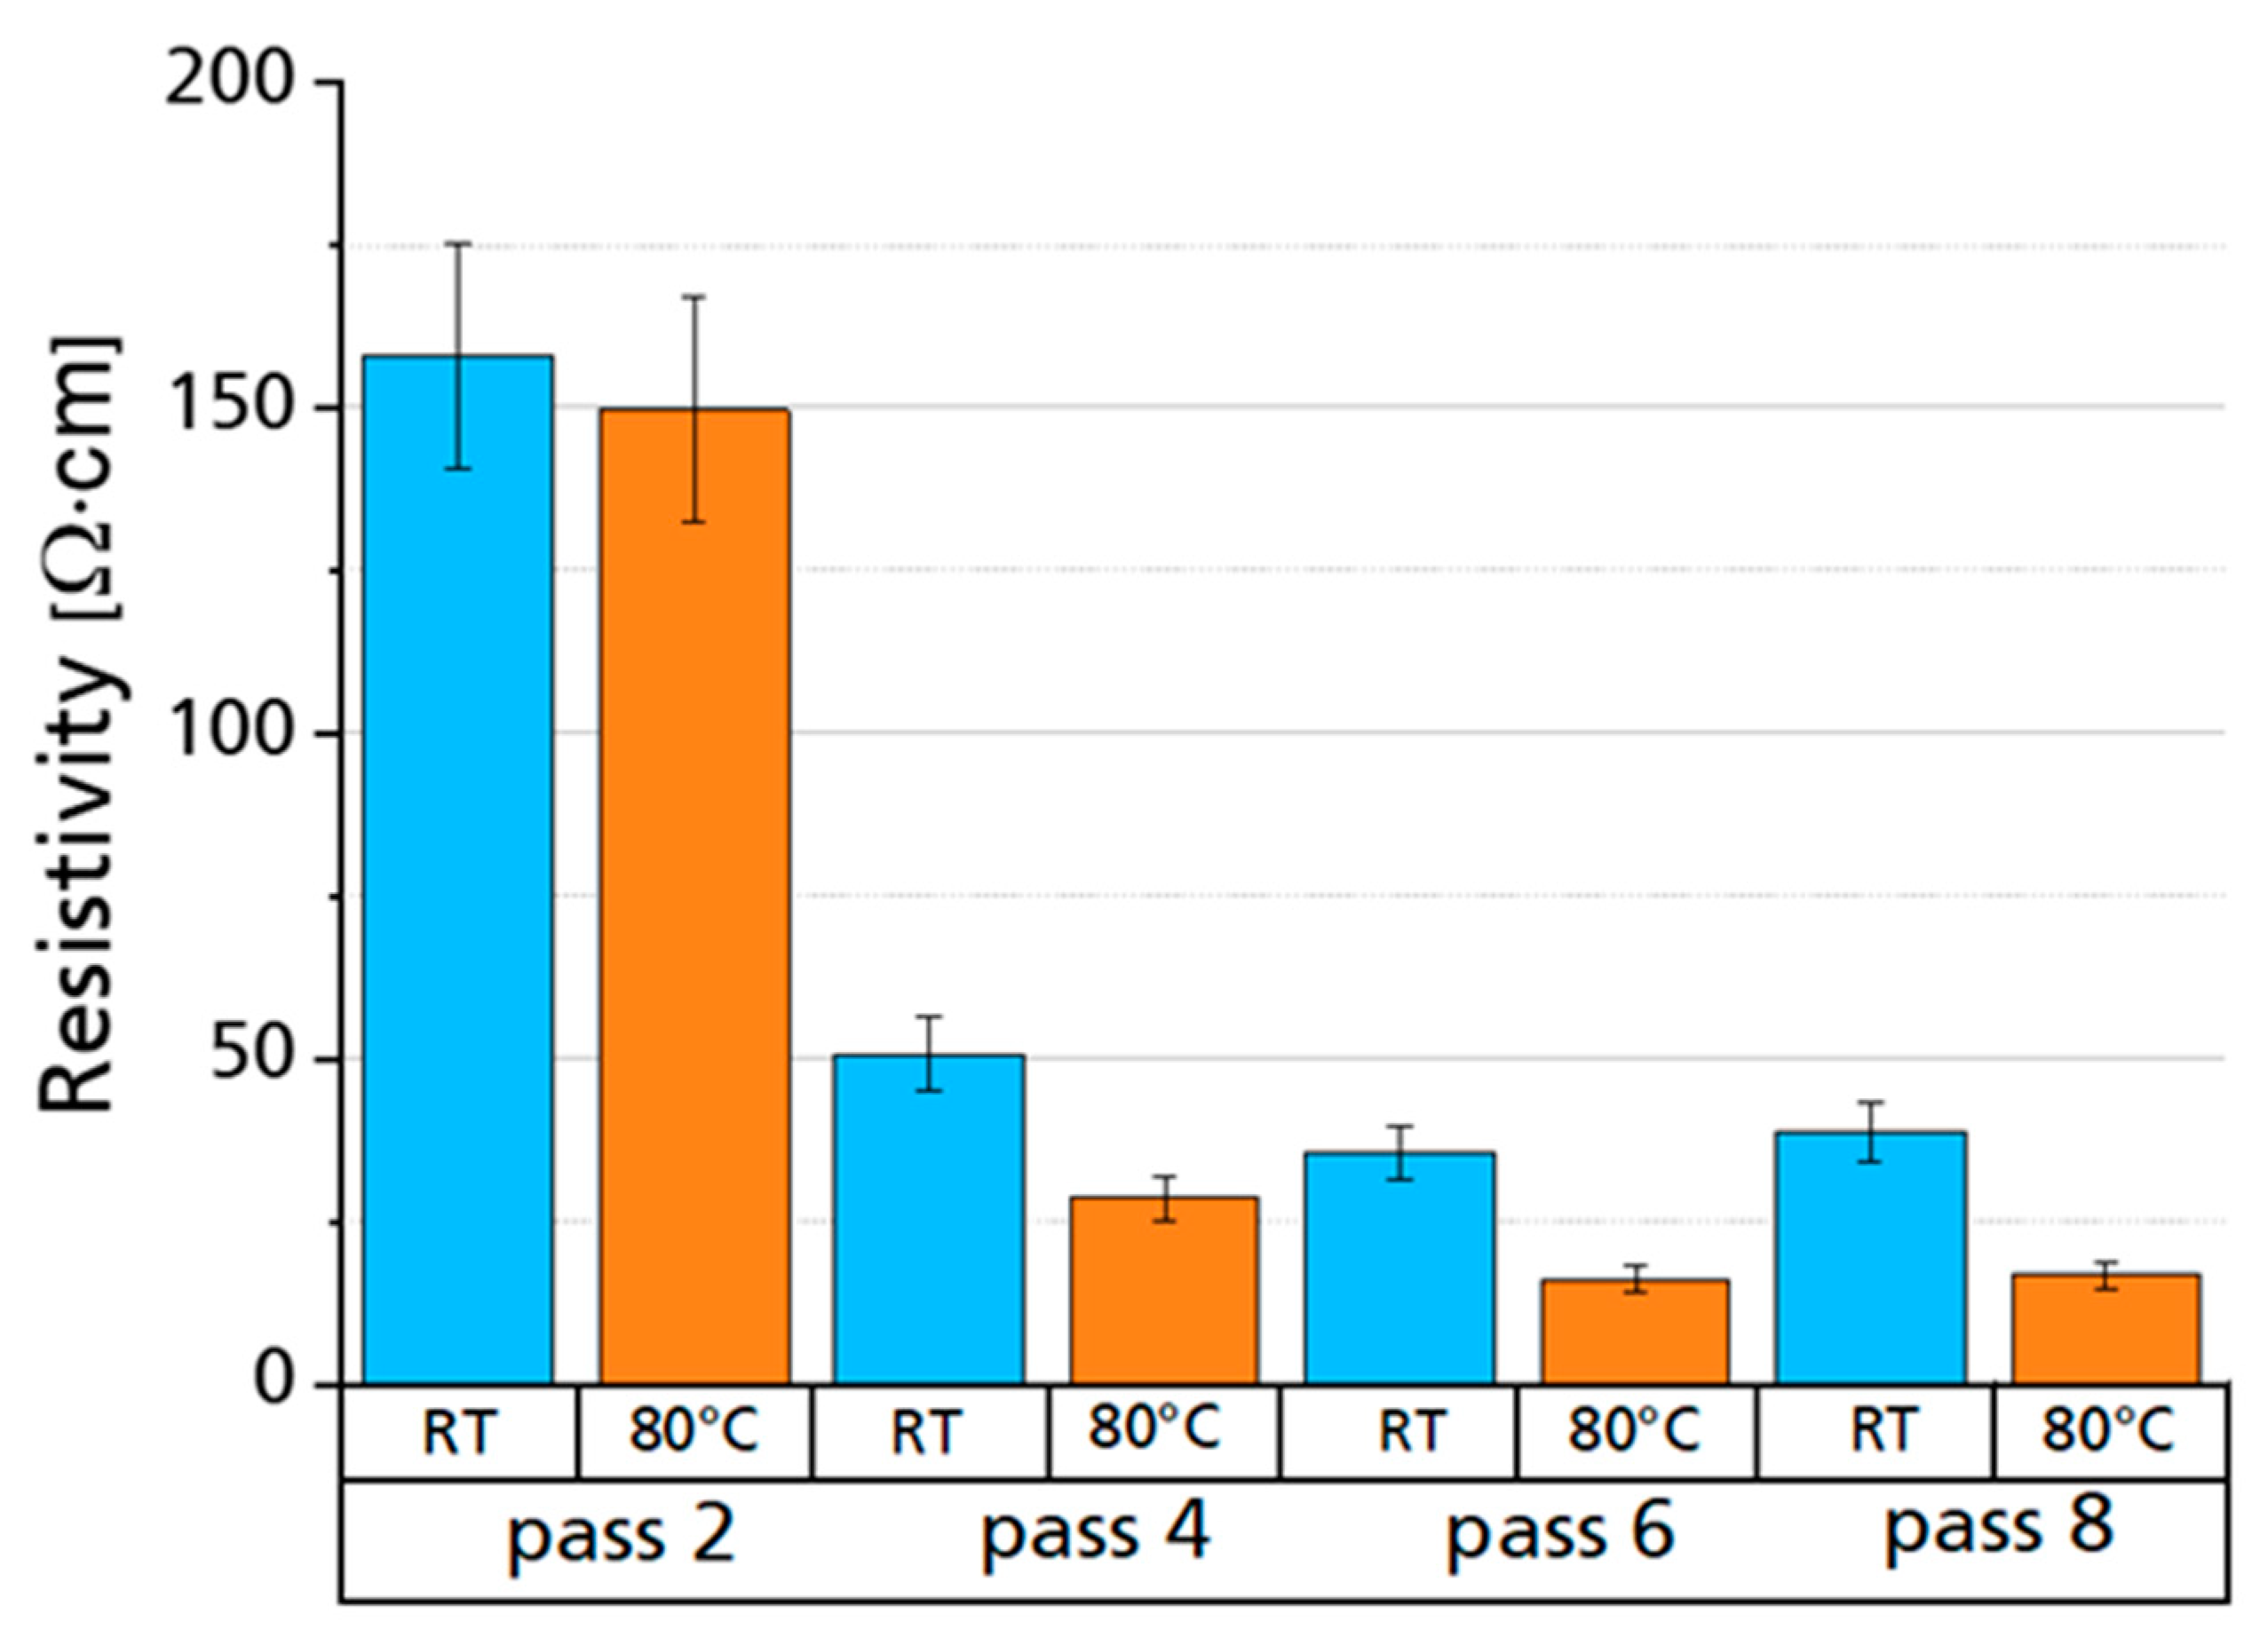
3.1. Dispersion
- Constant gap—The suspension was passed eight times with a fixed gap 1 of 15 μm (between the feed and center rolls—refer to 2 in Figure 2) and a gap 2 of 5 μm (between the center and apron rolls).
- Regressive gap—Starting with a larger gap between rolls (60–20), and then every two passes halving the distance until reaching the physical limit used on constant gap mode, 15–5 μm.
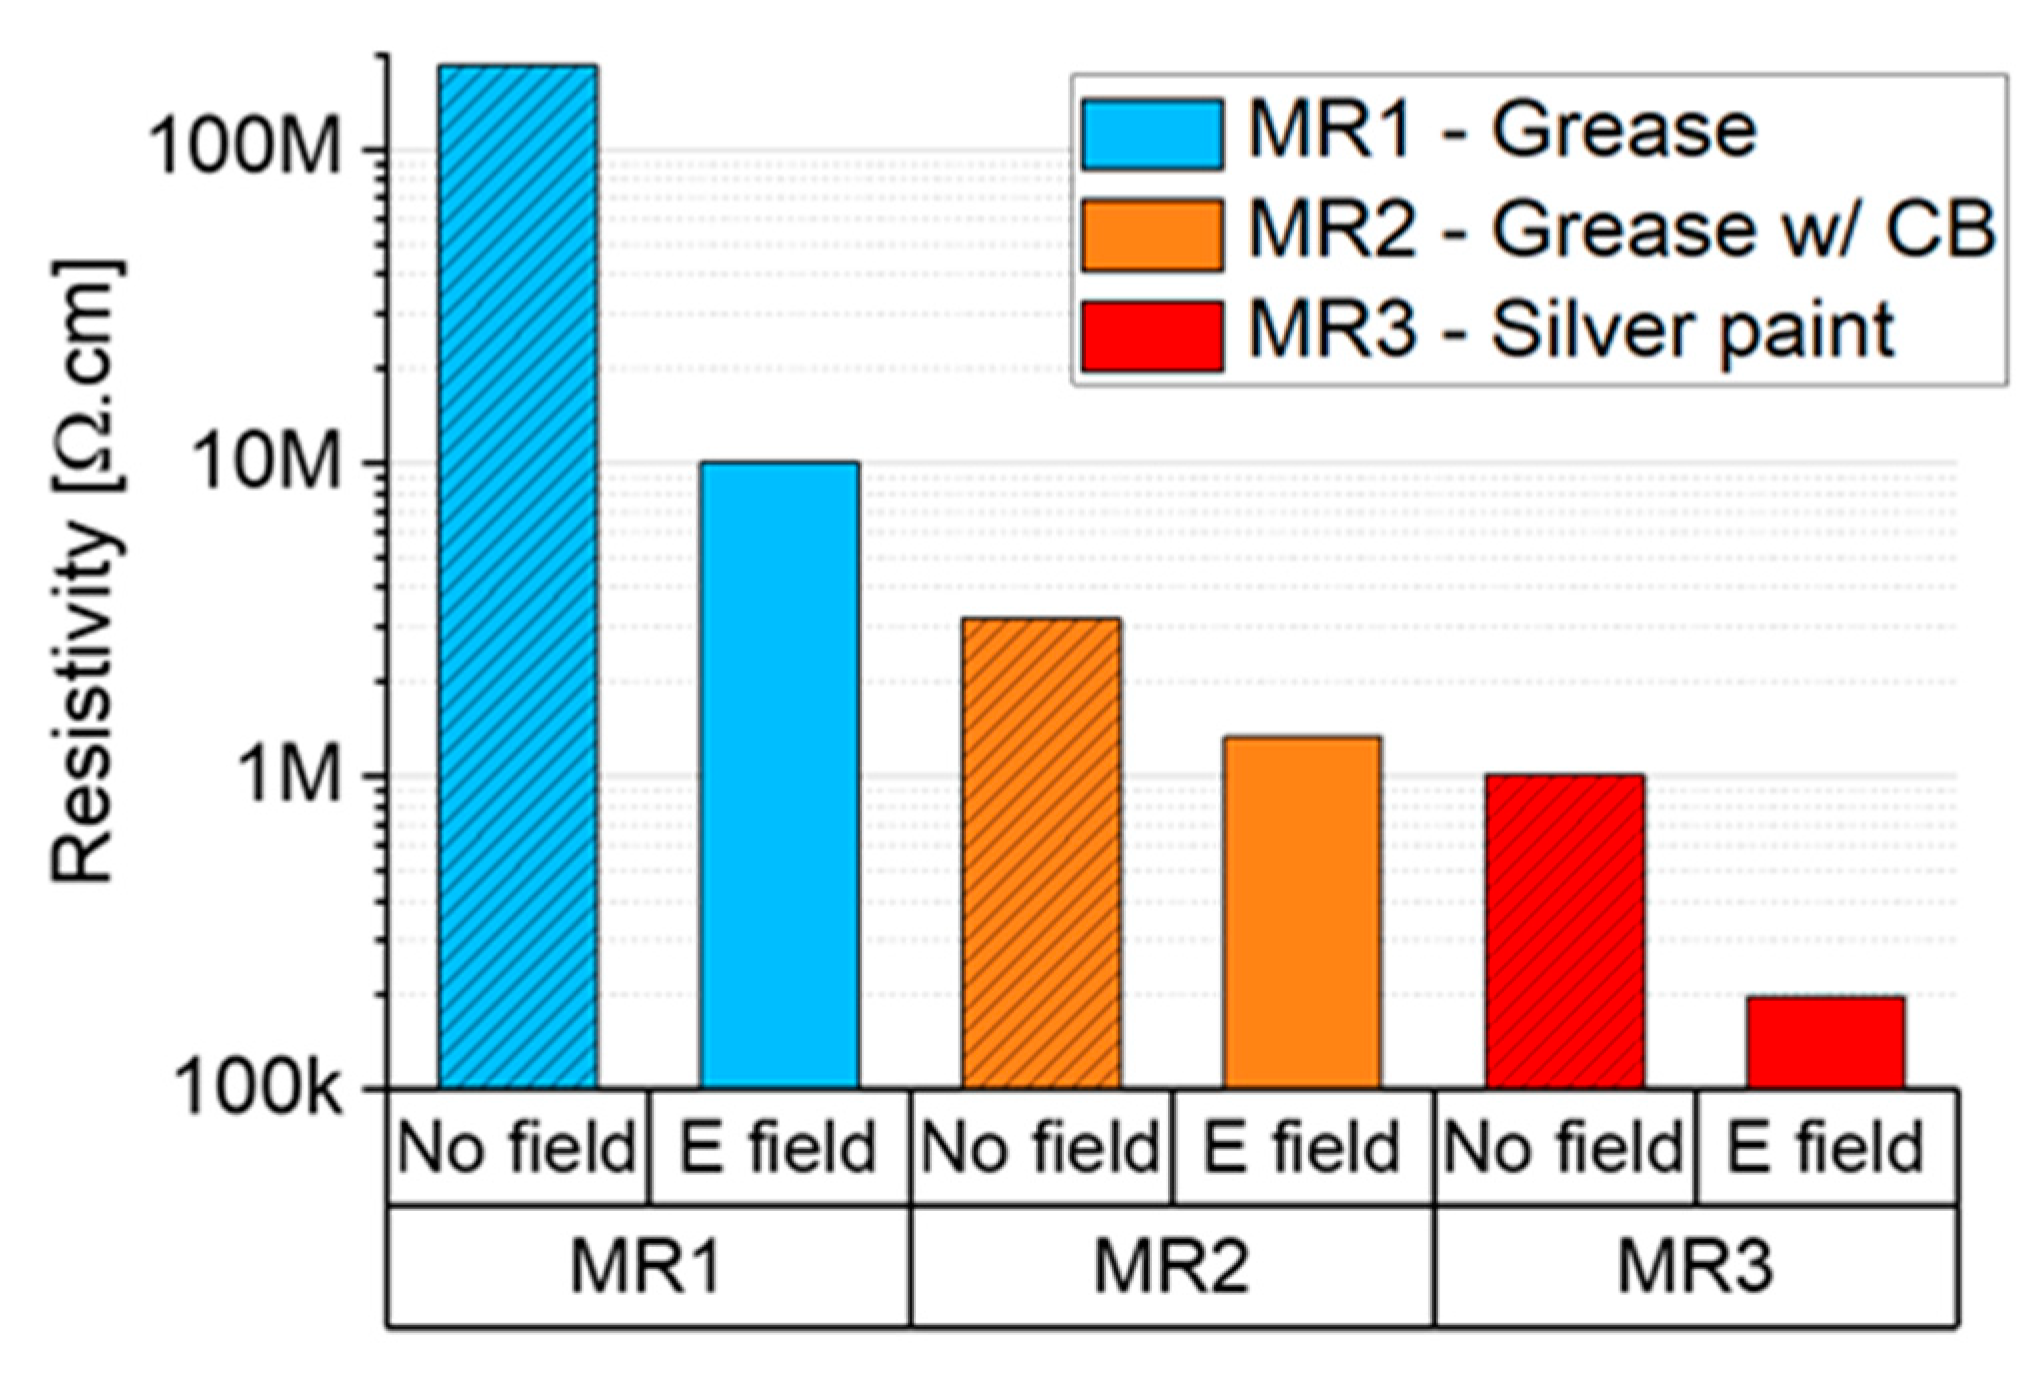
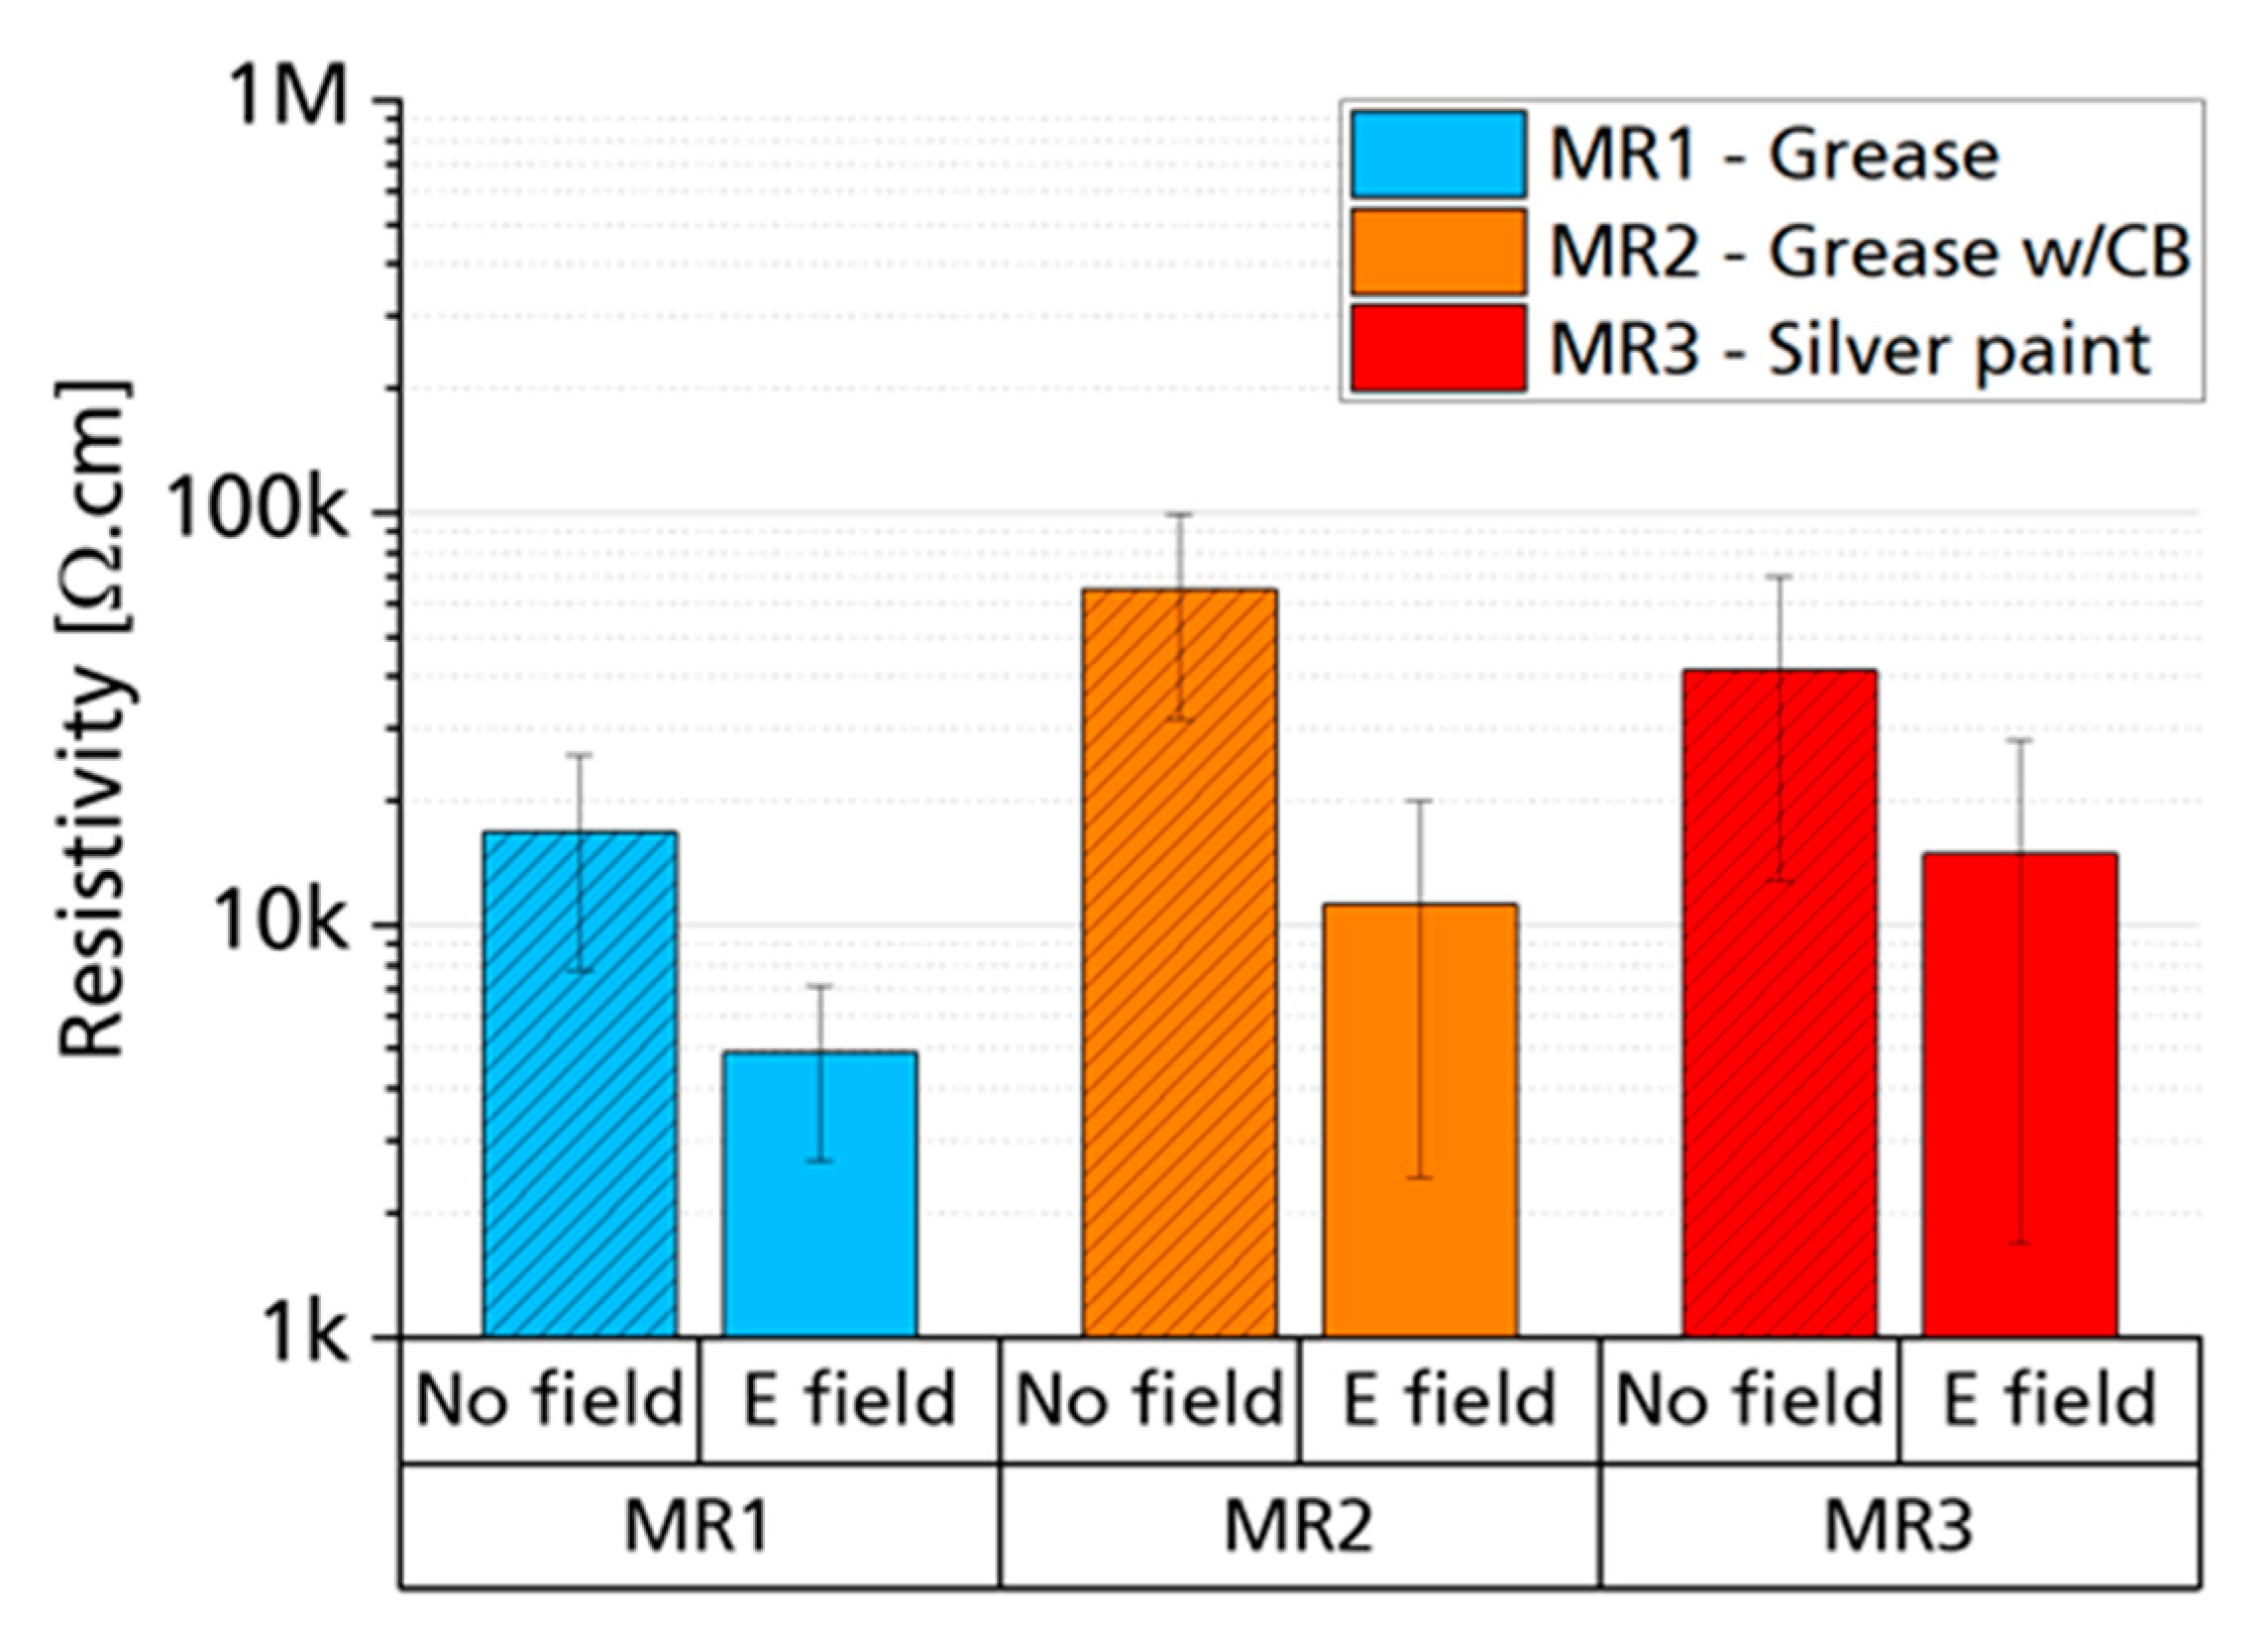
3.2. Electric Fields
4. Discussion and Conclusions
Author Contributions
Funding
Conflicts of Interest
References
- Kaur, G.; Adhikari, R.; Cass, P.; Bown, M.; Gunatillake, P. Electrically conductive polymers and composites for biomedical applications. RSC Adv. 2015, 5, 37553–37567. [Google Scholar] [CrossRef]
- Yeetsorn, R.; Fowler, M.W.; Tzoganakis, C.A. Review of Thermoplastic Composites for Bipolar Plate Materials in PEM Fuel Cells. In Nanocomposites with Unique Properties and Applications in Medicine and Industry; InTech: London, UK, 2011. [Google Scholar]
- Lan, Y.C.; Wang, Y.; Ren, Z.F. Physics and applications of aligned carbon nanotubes. Adv. Phys. 2011, 60, 553–678. [Google Scholar]
- Zeng, Z.; Jin, H.; Chen, M.; Li, W.; Zhou, L.; Zhang, Z. Lightweight and anisotropic porous mwcnt/wpu composites for ultrahigh performance electromagnetic interference shielding. Adv. Funct. Mater. 2016, 26, 303–310. [Google Scholar] [CrossRef]
- Alig, I.; Pötschke, P.; Lellinger, D.; Skipa, T.; Pegel, S.; Kasaliwal, G.R.; Villmow, T. Establishment, morphology and properties of carbon nanotube networks in polymer melts. Polymer 2012, 53, 4–28. [Google Scholar] [CrossRef]
- Bauhofer, W.; Kovacs, J.Z. A review and analysis of electrical percolation in carbon nanotube polymer composites. Compos. Sci. Technol. 2009, 69, 1486–1498. [Google Scholar] [CrossRef]
- Krause, B.; Potschke, P.; Haussler, L. Melt mixed SWCNT-polypropylene composites with very low electrical percolation. Polymer 2016, 98, 45–50. [Google Scholar] [CrossRef]
- Kasaliwal, G.R.; Göldel, A.; Pötschke, P.; Heinrich, G. Influences of polymer matrix melt viscosity and molecular weight on MWCNT agglomerate dispersion. Polymer 2011, 52, 1027–1036. [Google Scholar] [CrossRef]
- Kasaliwal, G.R.; Pegel, S.; Göldel, A.; Pötschke Petra, P.; Heinrich, G. Analysis of agglomerate dispersion mechanisms of multiwalled carbon nanotubes during melt mixing in polycarbonate. Polymer 2010, 51, 2708–2720. [Google Scholar] [CrossRef]
- Sandler, J.K.W.; Kirk, J.E.; Kinloch, I.A.; Shaffer, M.S.P.; Windle, A.H. Ultra-low electrical percolation threshold in carbon-nanotube-epoxy composites. Polymer 2003, 44, 5893–5899. [Google Scholar] [CrossRef]
- Peng, B.; Locascio, M.; Zapol, P.; Li, S.; Mielke, S.L.; Schatz, G.C. Measurements of near-ultimate strength for multiwalled carbon nanotubes and irradiation-induced crosslinking improvements. Nat. Nanotechnol. 2008, 3, 626–631. [Google Scholar] [CrossRef] [PubMed]
- Iosif, D.; Rosca, S.; Hoa, V. Highly conductive multiwall carbon nanotube and epoxy composites produced by three-roll milling. Carbon 2009, 47, 1958–1968. [Google Scholar]
- Yamamoto, K.; Akita, S.; Nakayama, Y. Orientation of carbon nanotubes using electrophoresis. Jpn. J. Appl. Phys. 1996, 2, L917. [Google Scholar] [CrossRef]
- Yamamoto, K.; Akita, S.; Nakayama, Y. Orientation and purification of carbon nanotubes using ac electrophoresis. J. Phys. D Appl. Phys. 1998, 31, L34. [Google Scholar] [CrossRef]
- Oliva-Avilés, A.I.; Avilés, F.; Sosa, V.; Oliva, A.I.; Gamboa, F. Dynamics of carbon nanotube alignment by electric fields. Nanotechnology 2012, 23, 465710. [Google Scholar] [CrossRef]
- Martin, C.A.; Sandler, J.K.W.; Windle, A.H.; Schwarz, M.K.; Bauhofer, W.; Schulte, K.; Shaffer, M.S.P. Electric field-induced aligned multi-wall carbon nanotube networks in epoxy composites. Polymer 2005, 46, 877–886. [Google Scholar] [CrossRef]
- Li, J.; Zhang, Q.; Peng, N.; Zhu, Q. Manipulation of carbon nanotubes using AC dielectrophoresis. Appl. Phys. Lett. 2005, 86, 1–3. [Google Scholar] [CrossRef]
- Park, C.; Wilkinson, J.; Banda, S.; Ounaies, Z.; Wise, K.E.; Sauti, G.; Lillehei, P.T.; Harrison, J.S. Aligned single-wall carbon nanotube polymer composites using an electric field. J. Polym. Sci. Polym. Phys. Ed. 2006, 44, 1751–1762. [Google Scholar] [CrossRef]
- Cheng, Q.F.; Wang, J.P.; Wen, J.J.; Liu, C.H.; Jiang, K.L.; Li, Q.Q.; Fan, S.S. Carbon nanotube/epoxy composites fabricated by resin transfer molding. Carbon 2010, 48, 260–266. [Google Scholar] [CrossRef]
- Olowojoba, G.; Sathyanarayana, S.; Caglar, B.; Kiss-Pataki, B.; Mikonsaari, I.; Hübner, C.; Elsner, P. Influence of process parameters on the morphology, rheological and dielectric properties of threeroll-milled multiwalled carbon nanotube/epoxy suspensions. Polymer 2013, 54, 188–198. [Google Scholar] [CrossRef]
- Olowojoba, G.; Sathyanarayana, S.; Caglar, B.; Mikonsaari, I.; Hübner, C.; Elsner, P. Influence of processing temperature, carbon nanotube agglomerate bulk density and functionalization on the dielectric and morphological properties of carbon nanotube / epoxy suspensions. In Proceedings of the Polymer Processing Society 29th Annual Meeting PPS-29, Nuremberg, Germany, 15–19 July 2013. [Google Scholar]
- Morais, M.V.C.; Oliva-Avilés, A.I.; Matos, M.A.S.; Tagarielli, V.L.; Pinho, S.T.; Hübner, C.; Henning, F. On the effect of electric field application during the curing process on the electrical conductivity of single-walled carbon nanotubes–epoxy composites. Carbon 2019, 150, 153–167. [Google Scholar] [CrossRef]


| Pass | 1 | 2 | 3 | 4 | 5 | 6 | 7 | 8 |
|---|---|---|---|---|---|---|---|---|
| Constant gap (µm) | 15–5 | 15–5 | 15–5 | 15–5 | 15–5 | 15–5 | 15–5 | 15–5 |
| Regressive gap (µm) | 60–20 | 60–20 | 30–10 | 30–10 | 15–5 | 15–5 | 15–5 | 15–5 |
© 2020 by the authors. Licensee MDPI, Basel, Switzerland. This article is an open access article distributed under the terms and conditions of the Creative Commons Attribution (CC BY) license (http://creativecommons.org/licenses/by/4.0/).
Share and Cite
V. C. Morais, M.; Marcellan, M.; Sohn, N.; Hübner, C.; Henning, F. Process Chain Optimization for SWCNT/Epoxy Nanocomposite Parts with Improved Electrical Properties. J. Compos. Sci. 2020, 4, 114. https://0-doi-org.brum.beds.ac.uk/10.3390/jcs4030114
V. C. Morais M, Marcellan M, Sohn N, Hübner C, Henning F. Process Chain Optimization for SWCNT/Epoxy Nanocomposite Parts with Improved Electrical Properties. Journal of Composites Science. 2020; 4(3):114. https://0-doi-org.brum.beds.ac.uk/10.3390/jcs4030114
Chicago/Turabian StyleV. C. Morais, Manuel, Marco Marcellan, Nadine Sohn, Christof Hübner, and Frank Henning. 2020. "Process Chain Optimization for SWCNT/Epoxy Nanocomposite Parts with Improved Electrical Properties" Journal of Composites Science 4, no. 3: 114. https://0-doi-org.brum.beds.ac.uk/10.3390/jcs4030114