Article

Polarization Parameters and Scaling Matter—How Processing Environment and Shape Factor Influence Electroactive Nanocomposite Characteristics

by
S. Banerjee
1 and
K. A. Cook-Chennault
2,3,4,*
1
Mechanical Engineering, Lyles College of Engineering, California State University, Fresno, CA 93740, USA
2
Mechanical and Aerospace Engineering Department, School of Engineering, Rutgers, the State University of New Jersey, Piscataway, NJ 08854, USA
3
Biomedical Engineering Department, School of Engineering, Rutgers, the State University of New Jersey, Piscataway, NJ 08854, USA
4
Department of Educational Psychology, Rutgers, the State University of New Jersey, Piscataway, NJ 08854, USA
*
Author to whom correspondence should be addressed.
J. Compos. Sci. 2020, 4(3), 141; https://0-doi-org.brum.beds.ac.uk/10.3390/jcs4030141
Submission received: 11 July 2020 / Revised: 20 August 2020 / Accepted: 31 August 2020 / Published: 19 September 2020
(This article belongs to the Special Issue Composite Nanostructures for Energy and Environment Applications)

Abstract

:
Polymeric-ceramic smart nanocomposite piezoelectric and dielectric materials are of interest due to their superior mechanical flexibility and ability to leverage characteristics of constituent materials. A great deal of work has centered on development of processes for manufacturing 0–3 continuity composite piezoelectric materials that vary in scale ranging from bulk, thick and thin film to nanostructured films. Less is known about how material scaling effects the effectiveness of polarization and electromechanical properties. This study elucidates how polarization parameters: contact versus corona, temperature and electrical voltage field influence the piezoelectric and dielectric properties of samples as a function of their shape factor, i.e., bulk versus thick film. Bulk and thick film samples were prepared via sol gel/cast-mold and sol gel/spin coat deposition, for fabrication of bulk and thick films, respectively. It was found that corona polarization was more effective for both bulk and thick film processes and that polarization temperature produced higher normalized changes in samples. Although higher electric field voltages could be achieved with thicker samples, film samples responded the most to coupled increases in temperature and electrical voltage than bulk samples.

1. Introduction

Piezoelectric and dielectric materials are ubiquitously used as sensors, actuators and transducers over a wide range of applications including but not limited to process control [1,2], industrial and automotive monitoring systems [3,4,5], medical diagnostics [6,7], aviation and aerospace structural health monitoring [8,9], embedded passive devices [10,11], and resonators and filters in telecommunications [12]. The brittle nature of homogenous ceramic piezoelectric materials limits their operational strains (~0.2% for homogenous lead zirconate titanate, PZT) [13], cycle life, and formability into complex shapes and structures [14]. Hence, two-phase polymer matrix based composites containing piezoelectric fillers within an continuous epoxy/polymer matrix [15,16,17,18,19], have attracted much attention due to their flexibility, ease of processing and applicability to embedded passive devices. However, two-phase piezoelectric-epoxy composites suffer from poor electrical and piezoelectric properties due to the insulating epoxy matrix, which decreases the polarization of the piezoelectric phase. Several researchers have demonstrated that the inclusion of electrically conductive particles within the matrix of the two-phase composite [20,21] addresses this problem by enhancing the polarization of the composite, thereby enhancing their electrical properties [22,23,24]. Yet, less is known about the interrelationship between the composite processing technique and properties of the electrically conductive particles and shape factor of the material (geometry), which dictate the piezoelectric and dielectric properties of the materials [3,25].
Previous work on the investigation of polarization effects on thick films exists however, less is known about how corona polarization influences bulk materials and processing, which is needed in scaled-up commercial manufacturing processes. Many have assumed that the positive effects of corona polarization are negligible when applied to bulk samples. This assumption influences how corona polarization approaches are imagined for indoctrination into industrial processes. The novelty of this work is that it presents a comprehensive and wholistic analysis of the polarization process as a function of geometrical scaling of the samples that have the same composition. This method of analysis allows for a more accurate comparison of polarization techniques, as opposed to other reviews of similar samples that have different matrix materials and/or filler sizes and geometries. This manuscript examines the coupled influences of polarization parameters: temperature and voltage, and material sample shape, i.e., disk (bulk) and thick film. The material of interest is composite piezoelectric, where PZT and multi-walled carbon nanotube (MWCNT) fillers are embedded within a non-electroactive (insulative) matrix. These materials are of interest for a variety of applications, such as sensors, actuator, energy harvesting, embedded tough capacitive screens, and bioengineered scaffolds. Many workers have reported on the piezoelectric and dielectric properties of materials, however few studies have examined how processing parameters and shape factor differences in materials result in different effective electrical and mechanical properties. This work examines shape factors of materials, i.e., one bulk fabricated in disks and another in thick films using the same processing parameters, and examines how these factors influence the piezoelectric strain coefficient, dielectric constant, dielectric loss of the materials and polarization ratio as a function of volume fraction of MWCNTs, polarization temperature and voltage. This work is an initial step towards the careful consideration of how material scaling may be contextualized for application to large scale manufacturing techniques.

1.1. Piezoelectric Composites

The material properties of piezoelectric composites are governed by the arrangement of the phases within the composite. This is referred to as connectivity, which refers to the way individual phases are self-connected. The concept of connectivity was first developed by Skinner et al. [26] and later enhanced by Pilgrim et al. [27]. In general, 10 connectivity patterns can be used for a diphasic system. The ten connectivity patterns are (0-0), (0-1), (0-2), (0-3), (1-1), (1-2), (2-2), (1-3), (2-3) and (3-3). Using this formatting schema, the first digit within the parenthesis refers to the number of dimensions of connectivity for the piezoelectric active phase and the second digit is used for the polymer phase. This convention can also be extended to include a third phase by adding a third number within the parenthesis [20]. Hence, in this work, 0-3-0 piezoelectric composites are materials that are made of a polymeric matrix and two filler materials.
Two-phase composite piezoelectric materials, so-called 0-3 composites comprising piezoelectric particles embedded within a continuous polymer matrix, have attracted much attention due to their flexibility, ease of processing and use in embedded passive devices [16,28], such as capacitors. Integration of embedded passive components into printed circuit boards generally results in enhanced electrical performance of the device, improved reliability, reduction of device size, faster switching speed, and lower production costs [29,30,31,32]. Two-phase composites: metal-polymer [33,34,35,36,37] and ceramic-polymer have been extensively studied [38,39,40,41,42] for application in coupling or by-pass capacitor technology, where emphasis has been placed on achievement of high effective dielectric constants via analysis of percolation theory and mixing rules. Piezo-polymer composites are also promising because of their excellent tailored properties [3,30]. These materials have many advantages including high electromechanical coupling factors [43,44,45,46,47], low acoustic impedance [23,48,49,50], mechanical flexibility [51,52,53,54], broad bandwidth [55,56,57,58,59], and low mechanical quality factors [29,31,60,61]. The mechanical, electrical and acoustic properties of these materials can also be tailored according to the nature of application of the composite material [38,62,63,64]. Inclusions of electrically conductive fillers within polymer matrixes have been demonstrated by several researchers [32,65,66,67]. All researchers have reported that the polymer matrix conductivity was enhanced by the electrically conductive fillers [68,69,70,71,72]. Recently carbon nanotubes (CNTs) have emerged as an attractive filler material [21,25,72] due to their electrically conductive nature and high aspect ratios, which have been found to also enhance mechanical strength and stiffness [66,73].

1.2. Carbon Nanotube Composites

Carbon nanotubes consist of a single graphite sheet wrapped into a cylindrical tube. An array of these nanotubes concentrically nested together form MWCNTs [74]. MWCNTs have been extensively studied due to their unique electrical and mechanical properties that are exemplified especially when embedded within matrix materials. MWCNTs have high electrical conductivity due to the unidirectional structure and the ballistic transport of electrons over long nanotube lengths, which enables MWCNTs to transport current with negligible joule heating [75,76]. CNTs also have high young’s moduli, stiffness, and tensile strength. For example, the young’s modulus of an individual nanotube has been reported to be ~0.64 TPa [77], which is similar to the stiffness of silicon carbide nanowires [75,76]. MWCNTs have been applied to commercial applications in polymer matrix based composite materials to enhance electron transport and mechanical strength of the composite structure [77,78]. Composites with carbon nanotubes embedded in a polymer matrix have been studied by many researchers [23,40,48,66,79,80,81,82,83]. The dielectric properties of these composites are enhanced due to the increase in charge carriers from the carbon nanotubes. However, beyond a certain volume fraction of the CNTs, the composite reaches the percolation threshold. The percolation threshold occurs when an electrically conductive pathway is formed in the composite that results in a sharp rise in conductivity of the composite [84]. Depending on the application of the composites, properties within the percolation threshold are either advantageous or deleterious, hence being able to anticipate it is desirable. Thus, many researchers have studied when the mechanisms leading to reaching and surpassing the percolation threshold [85,86,87]. For example, Ma and Wang [40] compared the microstructure and dielectric properties of epoxy-based damping composites that contained CNTs and PMN-PZT piezoceramics, and concluded that the composites exhibited a percolation threshold in the range of 1–1.5 g CNTs per 100 g epoxy. They also concluded that in the region of the percolation threshold, a continuous electro-conductive network was formed, and that beyond the percolation threshold, these materials demonstrated dynamic mechanical loss factors that were superior to those below the percolation threshold, and those without semiconductor inclusions. Tian and Wang [88] examined the performance of epoxy-multiwalled carbon nanotube-piezoelectric ceramic composites as rigid damping materials. Their results were similar to Ma and Wang [40], where the percolation threshold was found to be in the range of 1–1.5 g CNTs per 100 g epoxy. They too concluded that loss factors were improved with the incorporation of CNTs and PZT, when the amount of CNTs was above the critical electrical percolation loading.
Researchers have predicted that the increase in the volume fraction of the electrically conductive inclusion phase in the composite can also lead to an increase in conductivity [65,89]. The conductivity can also increase due to the effect of tunneling resistance in carbon nanotube nanocomposites [81]. A change in percolation threshold by variation in the aspect ratio of the conductive inclusions has also been demonstrated [90,91]. The percolation thresholds of multiphasic composite materials with CNT inclusions and their variation in aspect ratio of the CNTs is shown in Table 1. Upon inspection of this table, it is seen that the processing of the composite along with the aspect ratio of MWCNTs influences the percolation threshold. For example, fragmented MWCNT–PMMA nanocomposites were found to exhibit a sparser network, higher transparency, lower electrical conductivity, higher percolation threshold and higher piezoresistive sensitivity than composites fabricated with only CNTs [92], which was attributed to less packed conductive networks formed by shorter (fragmented) MWCNTs. The inter-relationship between preparation method, microstructure, mechanical and electrical properties, and electromagnetic interference shielding were investigated by Li et al. [93], who found solution-based preparation methods dispersed MWCNTs more uniformly (leading to fewer agglomerations) than melt-based processing methods. Methods such as the solution blending with melt compounding lead to more uniformly distributed MWCNTs, which exhibited the lowest percolation threshold of the four methods studied. Similarly, Hur et al. [94] investigated the effects of aspect ratio and content of MWCNT on strain sensor properties of the composite. It was found that using lower filler content with low aspect ratio MWCNTs resulted in lower Young’s moduli and larger strain ranges, in comparison to higher aspect ratio composites, which the team concluded was due to the bridging effect of the filler and its loading transfer. It was also found that lower aspect ratio composites had lower electrical conductivity and a larger percolation threshold values than the composites comprising higher aspect ratios due to the poor ability of the low aspect ratio samples to create electrical paths in the composites [94]. Cardoso et al. [95] examined whether Celzard’s Theory for prediction of the percolation threshold of nanocomposites could be applied to composites composed of two types of fillers. Both samples incorporated a two-part epoxy (Epikote Resin 862 and Ethacure 100 Curative) with either vapor-grown carbon nanofibers (VGCNF) or MWCNTs. They found that while this theory is suitable for predicting the percolation threshold bounds for the VGCNF composites; it is not appropriate for predicting percolation of composites with MWCNTs, because MWCNT composites had intrinsic characteristics beyond the aspect ratio that were determinant for MWCNT composite electrical conductivity. Due to their enhanced dielectric and piezoelectric properties [21,25] and multifunctional nature [65], multiphasic piezoelectric composite have a high potential for applications as sensors transducers and energy harvesting devices.
In multiphasic piezoelectric composite sensors and transducers, the piezoelectric properties can be controlled by polarization of the polycrystalline piezoelectric phase. [16] Initially, the dipoles of the piezoelectric phase are aligned in random directions. The alignment of the dipoles determines the effective electromechanical properties [100] of the composite. The dipoles are aligned during processing techniques that include high temperatures and the application of high voltage static and/or dynamic electric fields. Traditionally the contact or parallel plate poling methods have been used to polarize piezoelectric materials and composites [16,100]. Recently, many researchers have studied the corona discharge polarization method because higher poling voltages can be achieved in comparison to contact polarization methods [16]. The strength of the polarization field and poling temperature have also been identified as important parameters in determining the effectiveness of the poling process [24,101] and also the effective electromechanical properties of the composite, but comparison of their impact as a function of sample geometry has not been studied.
Two phase composites with randomly distributed electrically conductive fillers have drawn a lot of attention in the past few years due to their scalability and the ease of processing techniques and their flexibility [74,102]. Towards the direction of fabrication of embedded passive components, two phase metal-polymer and metal-ceramic composites has been studied to obtain high dielectric constants of >500 [103,104]. Among these materials two-phase composites with MWCNT as conductive inclusions randomly distributed in a relaxor ferroelectric matrix, PMMA show improvements in electrical properties with increased volume fraction of the conductive inclusion [79,80] and exhibit a dramatic increase in electrical properties around the critical concentration around 0.1% of MWCNT by weight, known as the percolation threshold [3,22]. One drawback in these kinds of composites is the high variation of the electrical properties as the concentration reaches close to the percolation threshold, which occurs due to the formation of conductive pathways in the composite by direct contact or electron tunneling between the conductive inclusions. This causes a sharp increase in conductivity in the composite which leads to high dielectric loss [21,105]. This can be attributed to increasing values of the dielectric loss that render the composite non-desirable in practical applications. For example, in the case of PZT-epoxy composites, researchers have shown a decrease in the dielectric constant from >1000 for the single phase PZT to values <50 [15] for two phase PZT-epoxy composites. Other have noted that even the values of the piezoelectric strain coefficients decrease from ~20 pC/N for the single phase to values <5 pC/N for the di-phasic ferroelectric-polymer composites [28,105]. This decline in the piezoelectric and dielectric properties is due to the decrease in the number of charge carriers in the insulating polymer matrix [84]. As a solution for the above problems researchers have started to investigate three phase composites that consist of ferroelectric and conductive inclusions that are randomly distributed in an uniform polymer matrix [20,22,106,107,108,109]. While many have demonstrated notable piezoelectric values [108,110,111,112], processing technique, active filler surface morphology and size/shape inherently influence the electromechanical performance of the samples.
This work seeks to understand the relationship between material processing, conductive filler shape and volume fraction, polarization method, polarization temperature and voltage; and how these relationships dictate the electromechanical properties of bulk and thick film composites. The materials of interest include nanocomposites fabricated using two filler materials (PZT—piezoelectric and MWCNTs—electrically conductive) and a two-part epoxy resin. It is well known that piezoelectric and dielectric properties of materials are a function of constituent materials, polarization boundary conditions and sample geometry. However, few researchers have examined the variation of sample geometry with polarization process within the same study on the sample comprising the same material composition.

2. Materials and Methods

2.1. Material Properties

Three-phase piezoelectric (0-3-0) composites that are composed of multi-walled carbon nanotubes (MWCNTs), lead zirconate titanate ( Pb ( Zr x Ti ( 1 x ) ) O 3 –Navy IV) (purchased from APC International) and a two-part epoxy-DGEBA, EpofixTM Cold-setting embedding resin (purchased from Electron Microscopy Sciences) were fabricated via a modified sol gel/spin coat and deposition process onto stainless steel bottom electrodes. The cold-setting resin was a two-part epoxy that consisted of a bisphenol A diglycidyl ether-based resin and a triethylenetetramine-based hardener. The average aspect ratio of the MWCNTs was determined from TEM images to be ~461. The piezoelectric, dielectric and physical properties of the PZT and epoxy are presented in Table 2.

2.2. Composite Bulk (Disk) and Film Preparation

The film and bulk samples were prepared using the procedure outlined in [113,114]. The PZT filler was pre-processed using the method described in [114] and then mixed with the bisphenol A diglycidyl ether part of the two-part epoxy, and sonicated for four hours. The MWCNTs were sonicated for four hours in ethanol (200 proof, Sigma-Aldrich) in the ultra-sonicator. After the MWCNTs were surface treated, they were mixed with the mixture of PZT and epoxy, thus forming the sol (non-macroscopic particles in solution) and a gel (bushy structures as clusters and agglomeration pockets of PZT epoxy and MWCNTs). The organic residues that were left behind by the gradual evaporation of the ethanol bound the different phases in the mixture during the desiccation step that occurred for four hours. The binder component of the epoxy was then added to the mixture and the solution subsequently sonicated for an additional half an hour. The sol gel formed was spin coated onto a stainless-steel substrate using the Laurel WS-650-23NPP spin coater. The stainless-steel substrate was 1.5 × 2.5 cm and 20 μm thick. The spin coat process included incremental increases by 100 rpm, until a final speed of 1000 rpm was achieved. The substrate is coated with a three phase PZT-epoxy-MWNCT composite material of thickness ~150 μm. The film was then allowed to cure on a hot plate at 75 °C (glass transition temperature of the epoxy) for eight hours and then subsequently polarized via a parallel plate contact or a corona discharge method.
The bulk (disk) samples were placed into a mold and cured at the same temperature as the films for eight hours. The disks were 7 mm in radius and 6 mm thick. The volume fraction of PZT for both bulk and thick film samples was held constant at 30%, while the volume fraction of MWCNTs were varied from 1–6% to identify the percolation threshold. The piezoelectric strain coefficient, d33 and dielectric constant, ε’, were determined as a function of polarization process, i.e., contact parallel plate or corona plasma, polarization temperature, polarization voltage, and volume fraction of MWCNTs.
The parallel plate contact polarization method was achieved by placing the disk or film in between the top and the ground base plates in a dielectric medium (silicone oil) and applying an external electric field of ranging from 0.7 to 2.7 kV/mm depending on the sample type. The corona polarization technique enabled a 2.7 kV/mm voltage to be achieved, while the contact polarization process could not accomplish the voltage without (short circuiting) a dielectric breakdown of the sample. The composite was heated to the approximate glass transition temperature of the matrix phase and an electric field was applied at the electrodes. The corona discharge polarization method involves the application of an electric field via a needle that is held at a certain distance away from the composite material.

2.3. Sample Characterization

A piezometer was used to measure the dielectric constant, ε’, dielectric loss tangent, tan δ and the piezoelectric strain coefficient, d33 at a frequency of 110 Hz. Yamada’s model [115] for the piezoelectric charge constant was used to calculate the polarization ratio, α of the PZT particles as a function of voltage and effective piezoelectric strain coefficient. The dispersion of PZT and MWCNTs within the epoxy matrix was observed via micrographs of the fractured surface and cross section of thick films using a Zeiss Sigma Field Emission scanning electron microscope (SEM) and electron dispersion spectroscopy (EDS) microscope (FESEM ZEISS 982).

3. Results

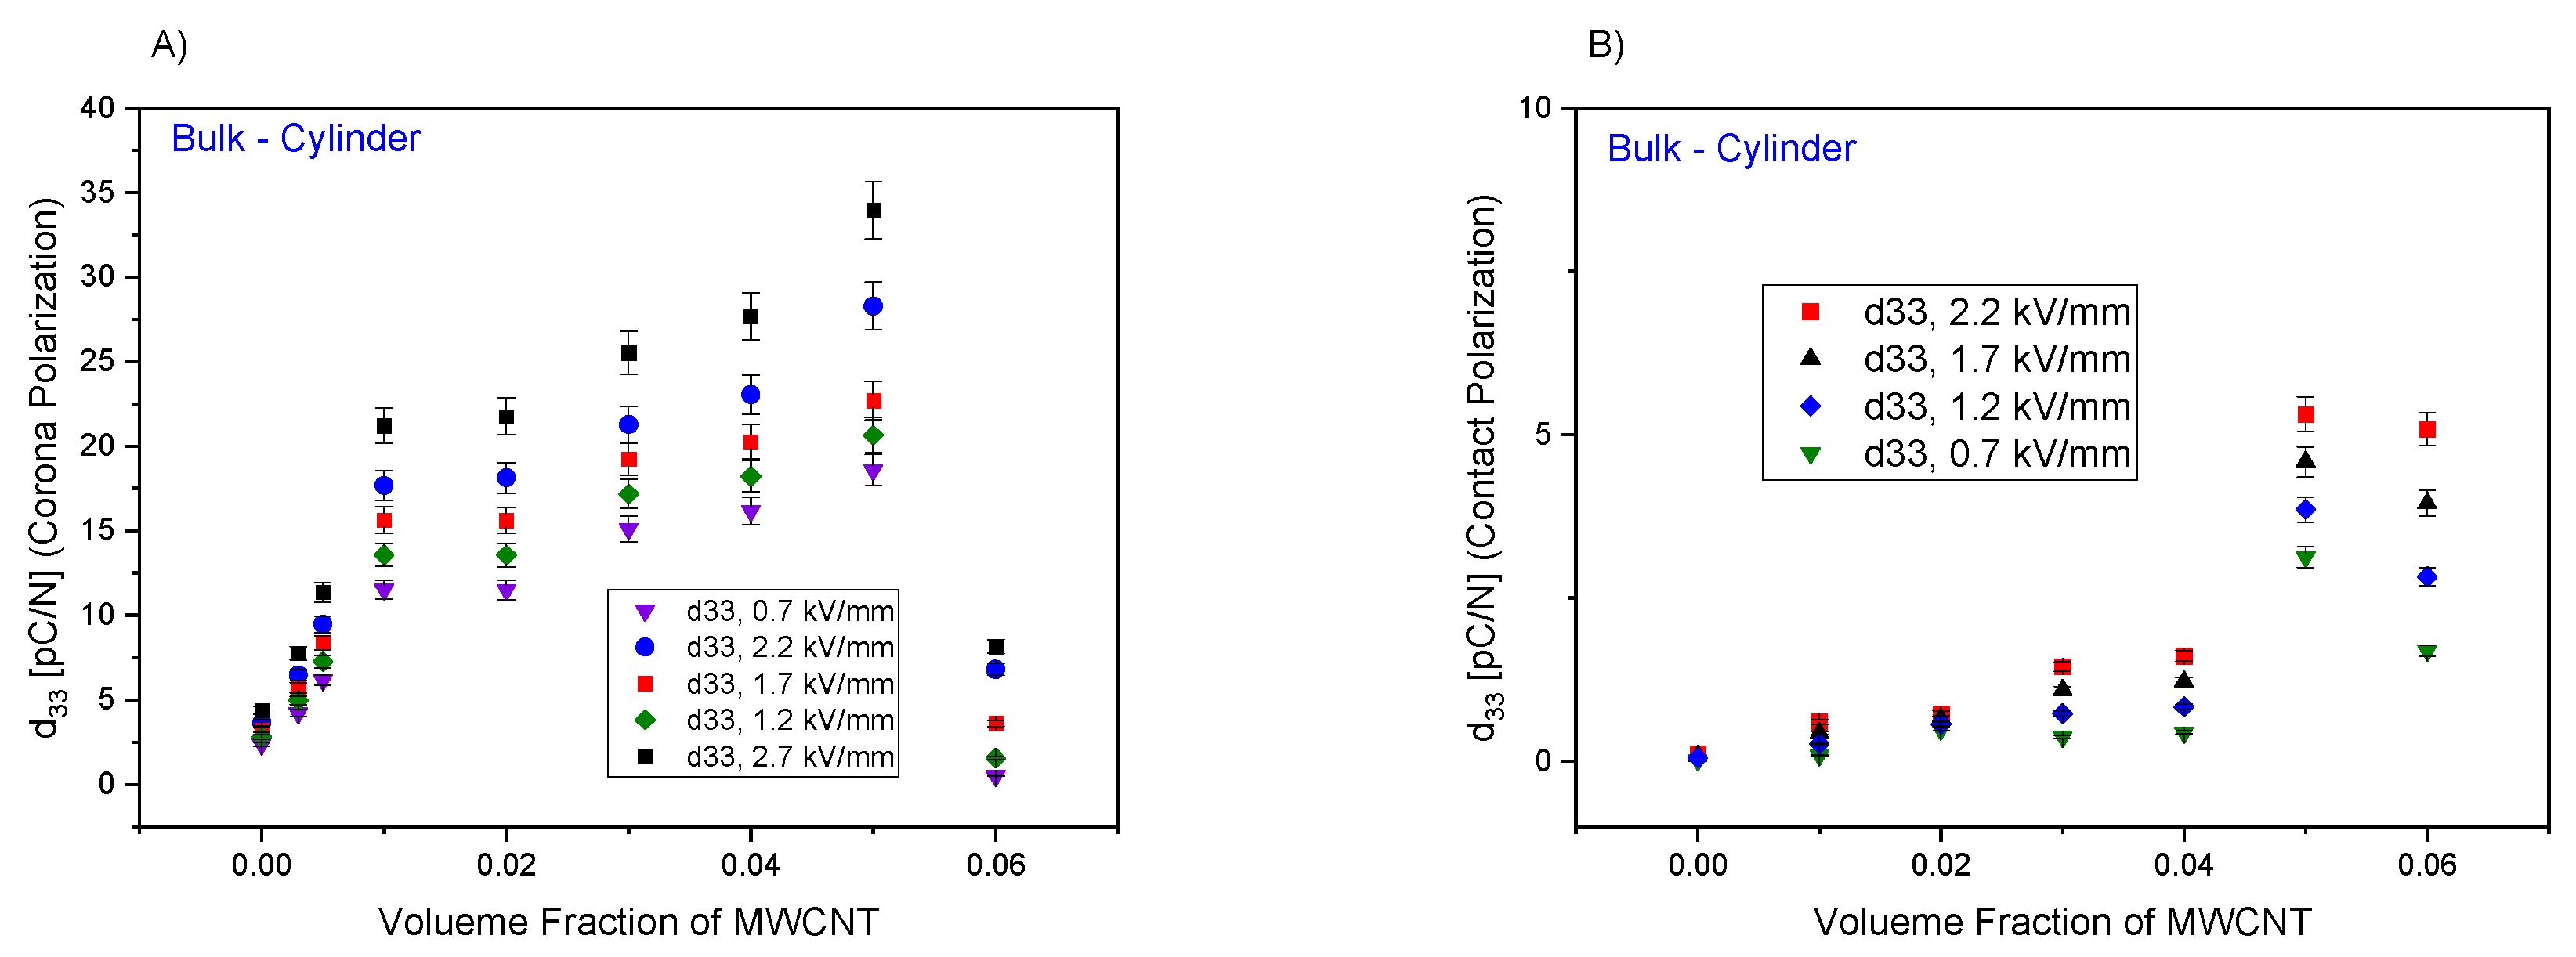
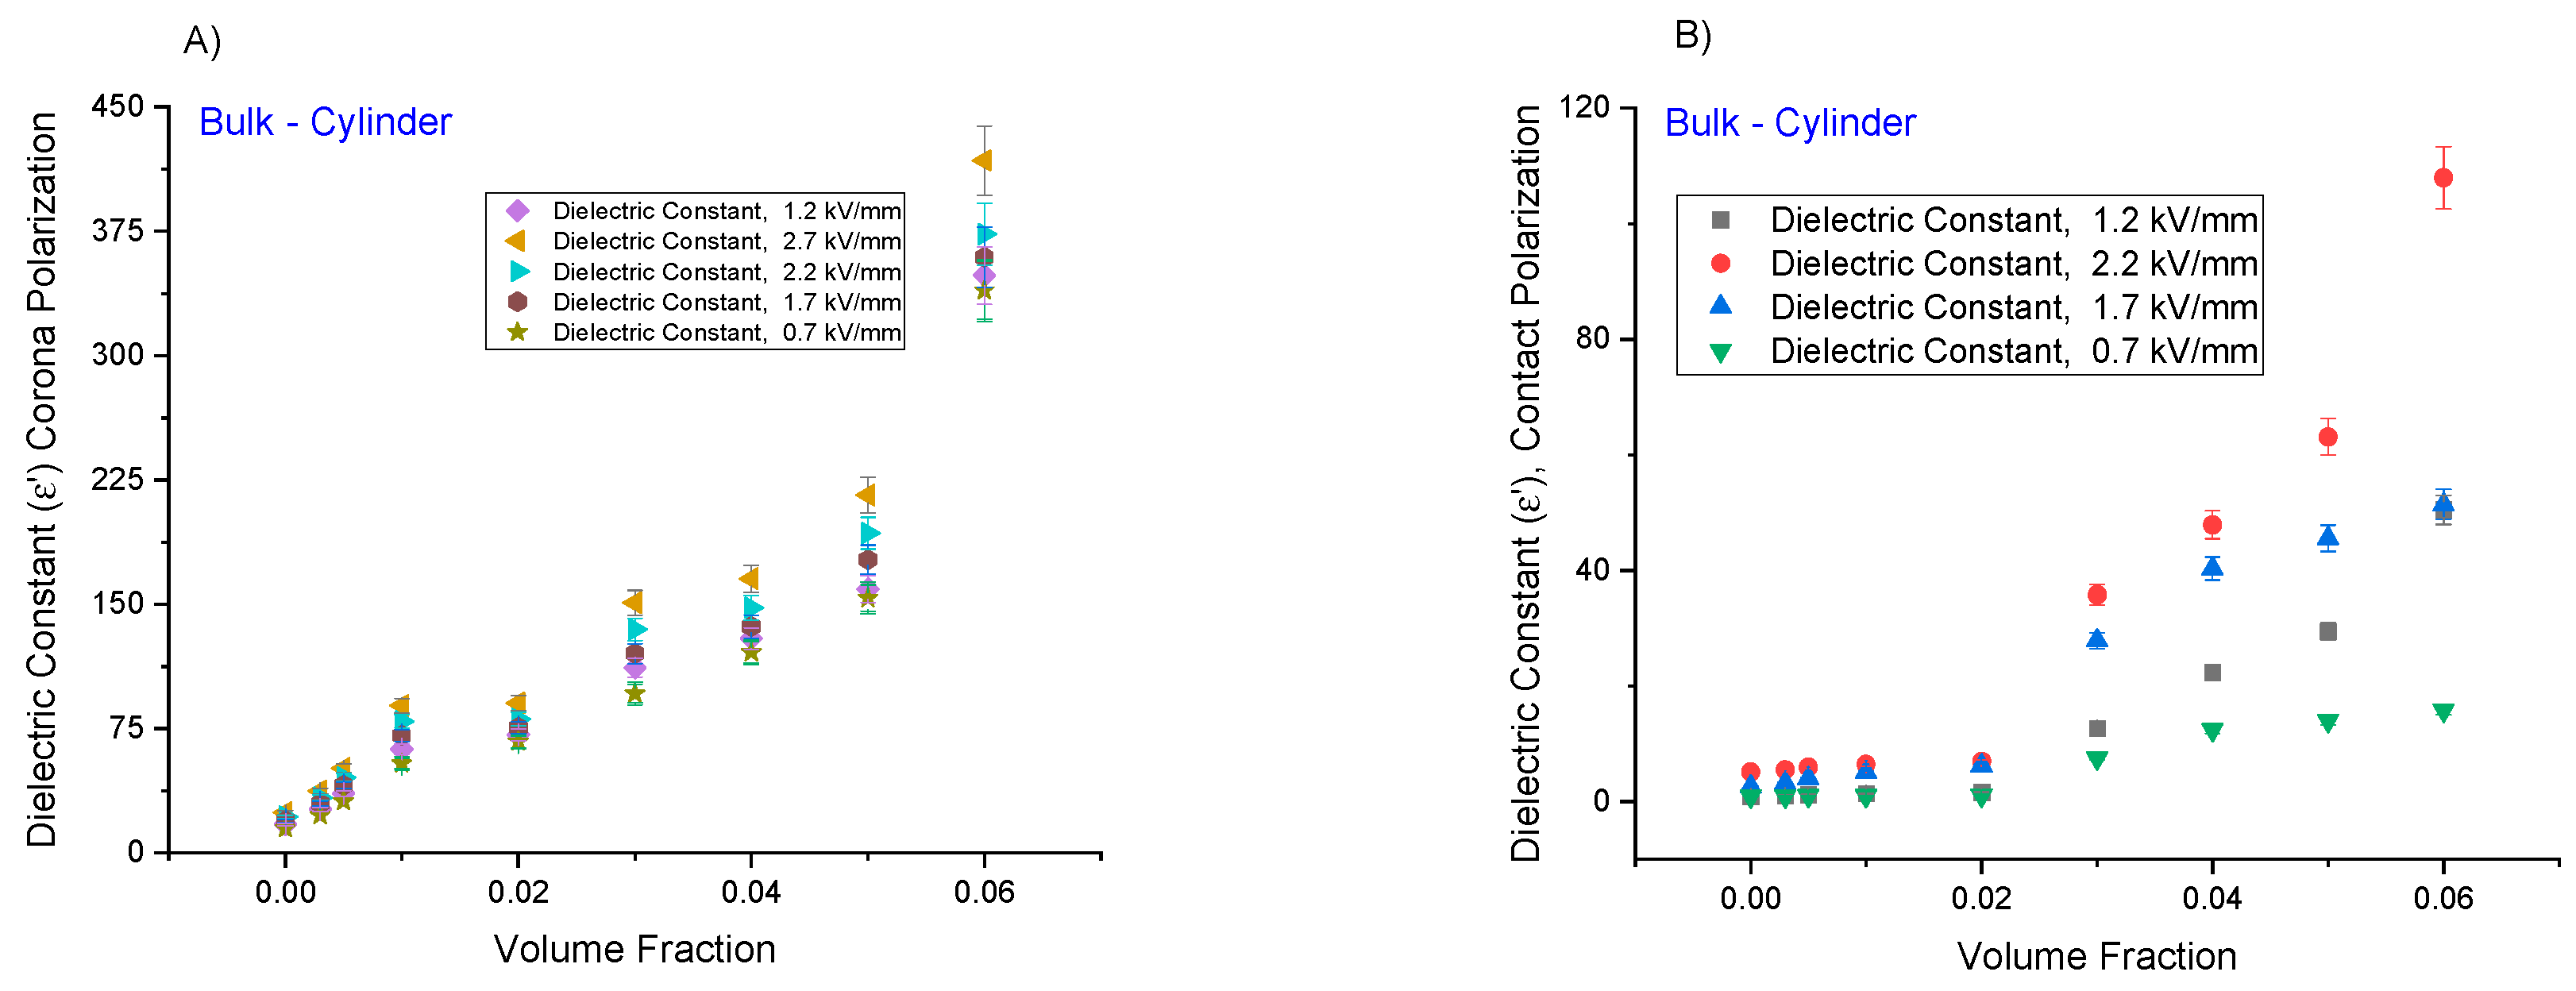
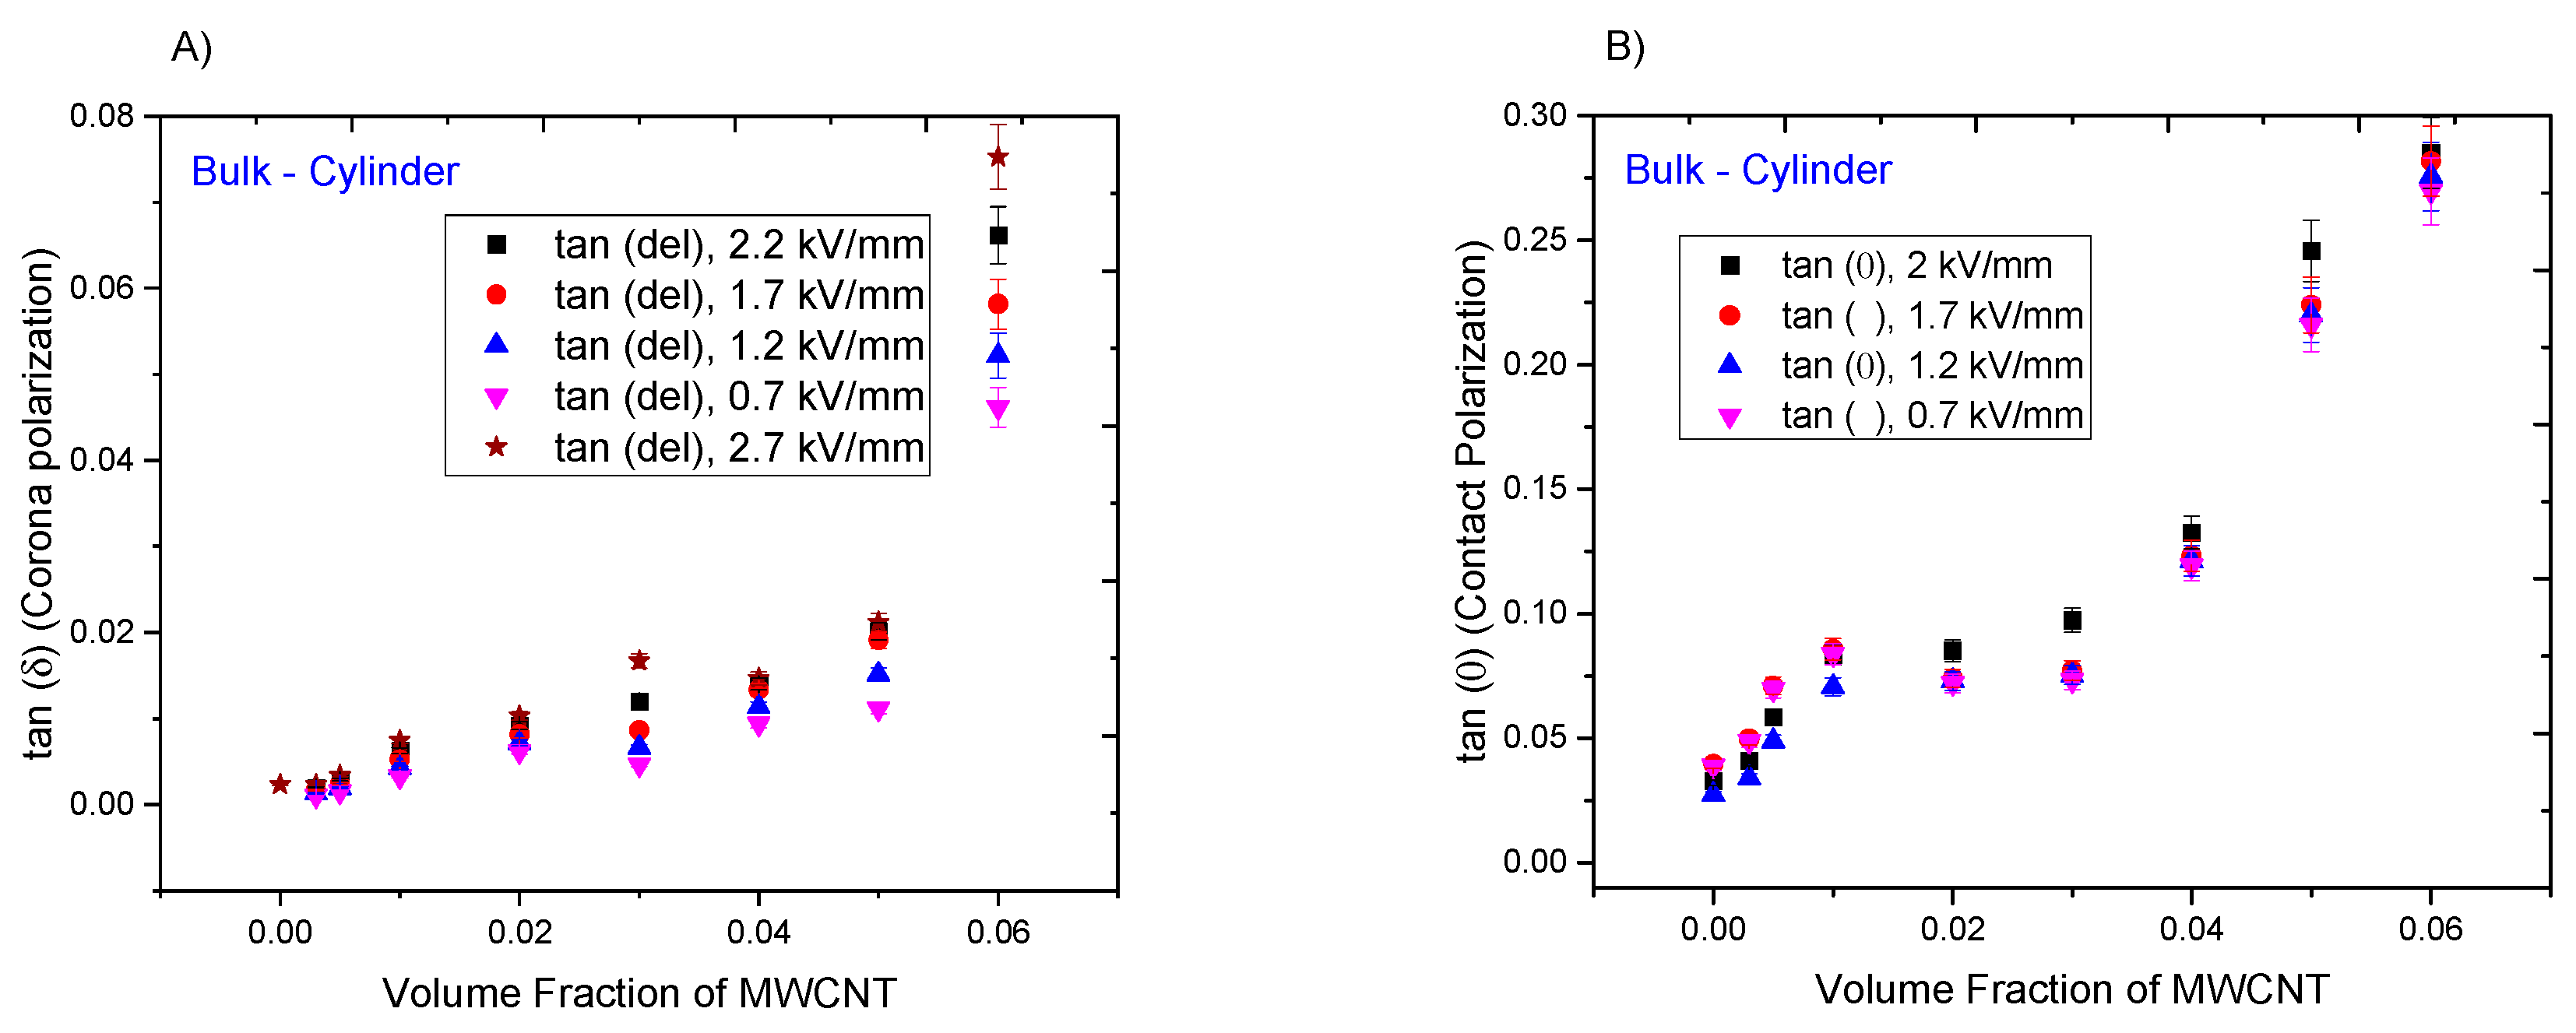
3.1. Variation of Polarization Voltage-Contact and Corona Polarization in Bulk Disks

The variation in the piezoelectric strain coefficient, d33 in the bulk PZT-epoxy-MWCNT composites as a function of polarization voltage for the corona and contact poling methods is shown in Figure 1A,B respectively. The poling voltage was varied between 2.7–0.7 kV/mm for samples that were corona poled, and 2.2–0.7 kV/mm for samples that were contact polarized. Samples that were contact polarized short circuited beyond 2.2 kV/mm. The volume fraction of the multiwalled carbon nanotubes (MWCNT) was varied from 1% to 6%, while the polarization temperature was kept constant at 75 °C.
As expected, the piezoelectric strain coefficient increases as a function of polarization voltage and volume fraction of MWCNTs, where the maximum poling voltage reached was for a MWCNT volume fraction of 6% at 2.7 kV/mm for the corona polarization technique. For lower MWCNT volume fractions (<6%) the maximum poling voltage was greater than 2.7 kV/mm due to the increase in the number of conductive pathways in the composite with the increase in the MWCNT volume fraction that ultimately causes dielectric breakdown of the composite. To maintain a uniform maximum poling voltage over all MWCNT volume fractions, 2.7 kV/mm was chosen as the maximum poling voltage for corona poled samples, while 2.2 was chosen for bulk samples. The composites were all poled for 60 min.
It is observed that the piezoelectric strain coefficient increases with the polarization voltage. For example, at a MWCNT volume fraction of 4%, the d33 values for poling voltages of 0.7, 1.2, 1.7, 2.2 and 2.7 kV/mm for the corona poling method are ~16.18, 18.23, 20.29, 23.07 and 27.684 pC/N respectively. In the case of the contact poling method and for the same MWCNT volume fraction the d33 values are (as expected) lower than their corona polarized counterparts: ~0.44, 0.83, 1.22 and 1.61 pC/N for the contact poling method with poling voltages of 0.7, 1.2, 1.7 and 2.2 kV/mm, respectively. This trend is visible for all volume fractions of the MWCNTs. The increase in poling voltage (or poling strength) aligns more dipoles in the poling direction as the intensity of the voltage increases. This increases the polarization of the composite and leads to higher d33 values, which follow a trend similar to that described by Nan et al. [116].
Similarly, the dielectric constant, ε’, values for the three phase composites increase as a function of voltage intensity as shown in Figure 2. The dielectric constant is higher at higher poling voltage values for all volume fractions of MWCNTs. For example, in the case of corona poling for a MWCNT volume fraction of 3% the ε’ values for poling voltages of 0.7, 1.2, 1.7, 2.2 and 2.7 kV/mm are ~121.04, 129.43, 136.54, 147.81 and 165.39, respectively. For the same volume fraction of MWCNT where contact polarization is employed, the dielectric constant values are ~25, 27, 36 and 38 for poling voltages of 0.7, 1.2, 1.7 and 2.2 kV/mm respectively. Hence, this demonstrates that corona polarization may be more effective than contact polarization for bulk samples. The orientation of the dipoles and the effective polarization leads to higher values of dielectric constant in addition to the electronic and ionic polarization in the composite [16]. With an increase in the poling field the dipole polarization increases in the poling direction thereby increasing the number of dipoles being aligned, which leads to increases in the dielectric constant as seen Figure 2 for both corona and contact polarization methods. The contact resistance from the contact method contribute to the reduction on polarization experienced by the samples.
The tan (δ) values also increase with increases in the poling voltage and volume fraction of MWCNTs as seen in Figure 3. For example, the tan (δ) values for the corona poled composites with poling fields of 0.7, 1.2, 1.7, 2.2 and 2.7 kV/mm (at MWCNT volume fraction of 4%) are ~0.0093, 0.011, 0.013, 0.014 and 0.015, respectively at a frequency of 110 Hz. The higher values of tan (δ) with increased poling voltages can be attributed to the increased number of defects or localized regions of dielectric breakdown in the composites caused by high voltage polarization. This trend is also seen for most volume fractions of the contact poled composites. There is also, a sharp increase in the tan (δ) values for composites with a MWCNT volume fraction of 6% which indicates a sharp rise in the dielectric loss. This rise in dielectric loss is due the increase in conductivity of the composite around the percolation threshold. These results suggest that the percolation region initiates near 6% volume fraction of MWCNTs.

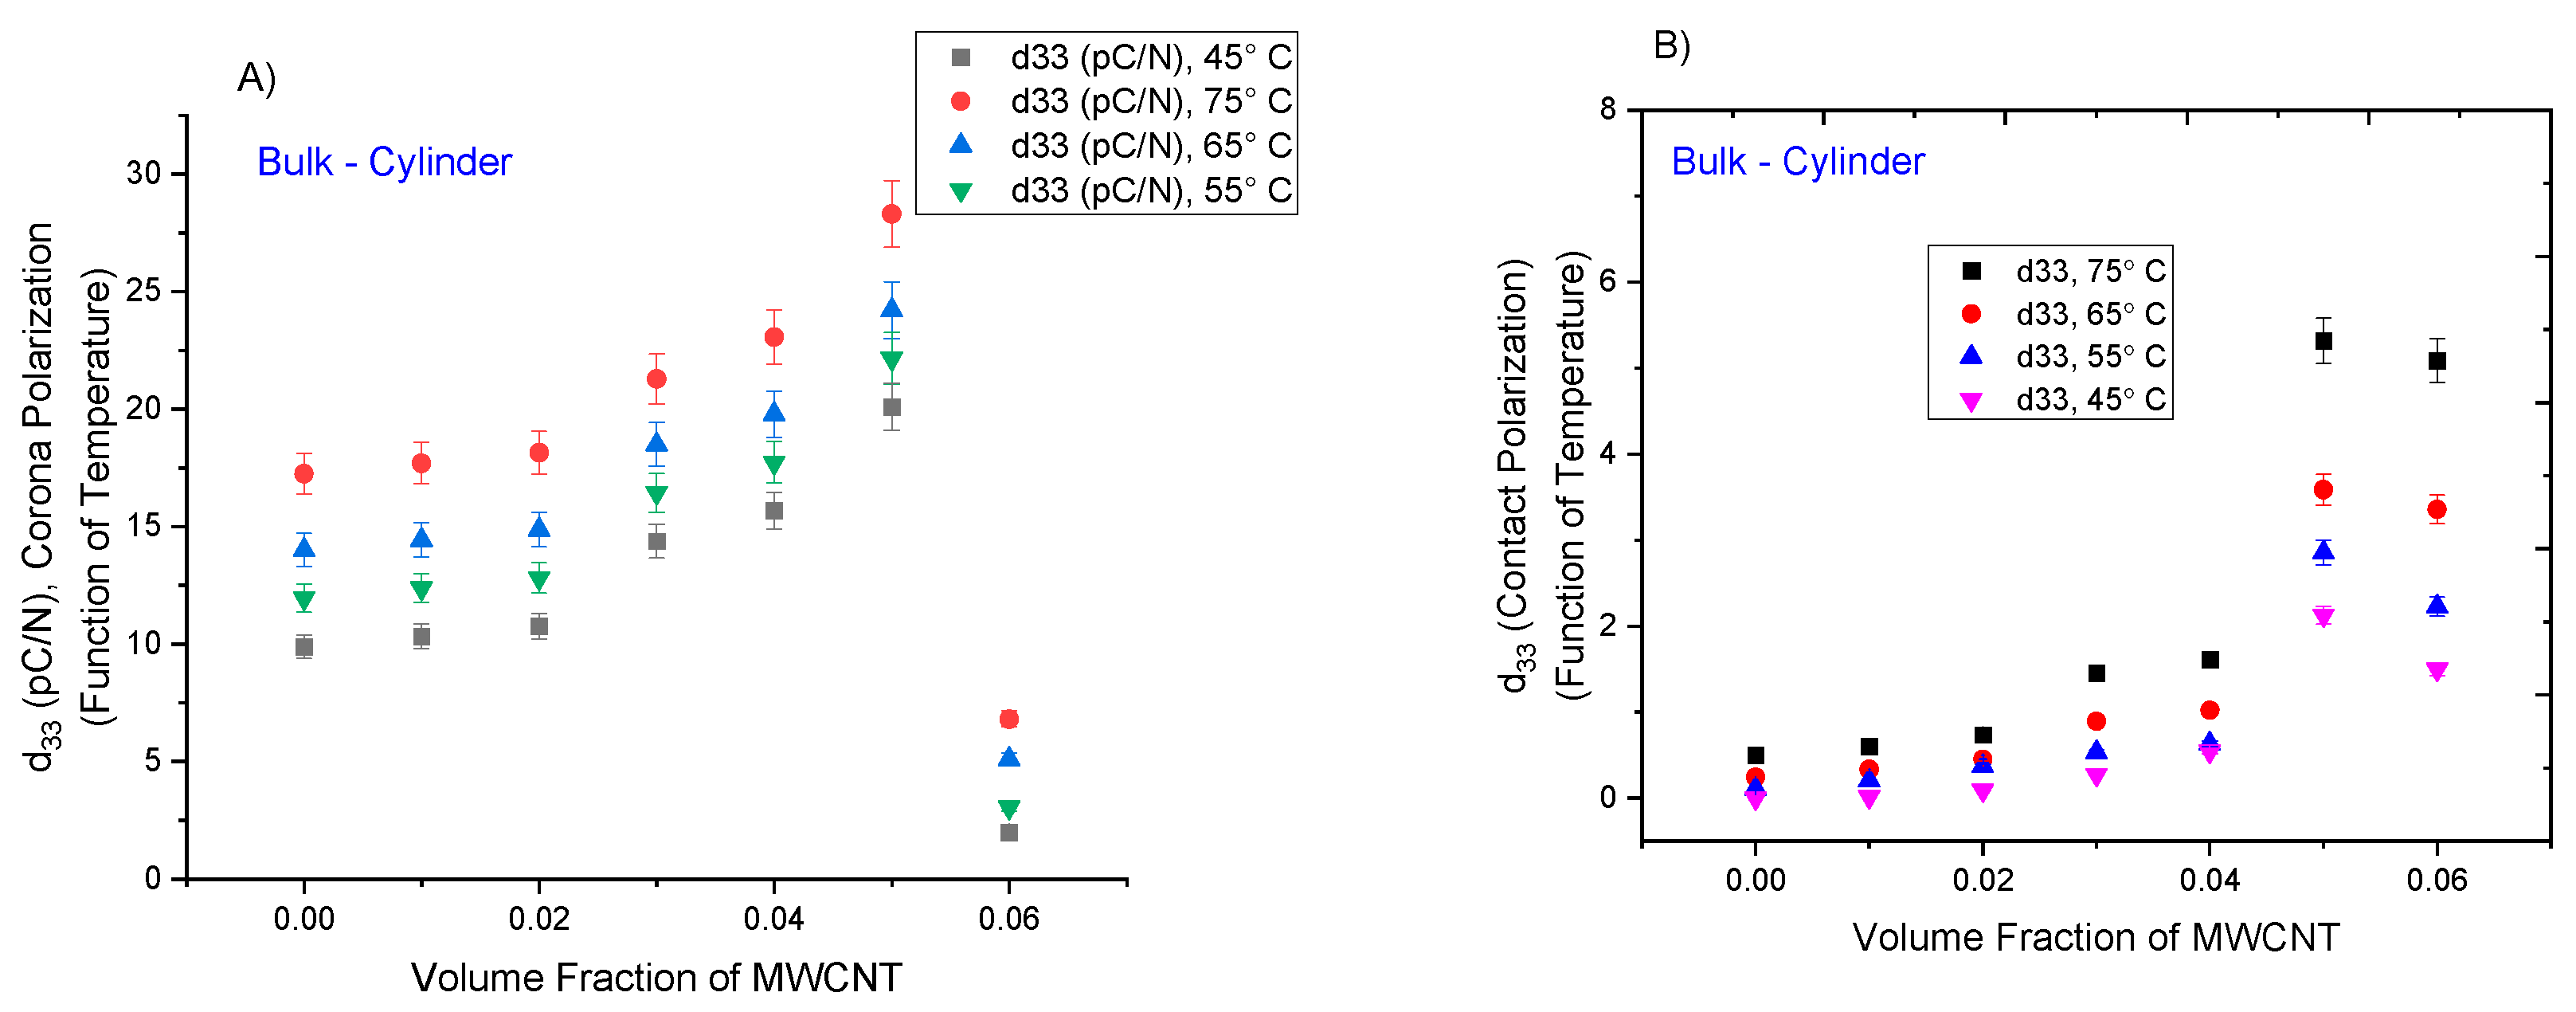
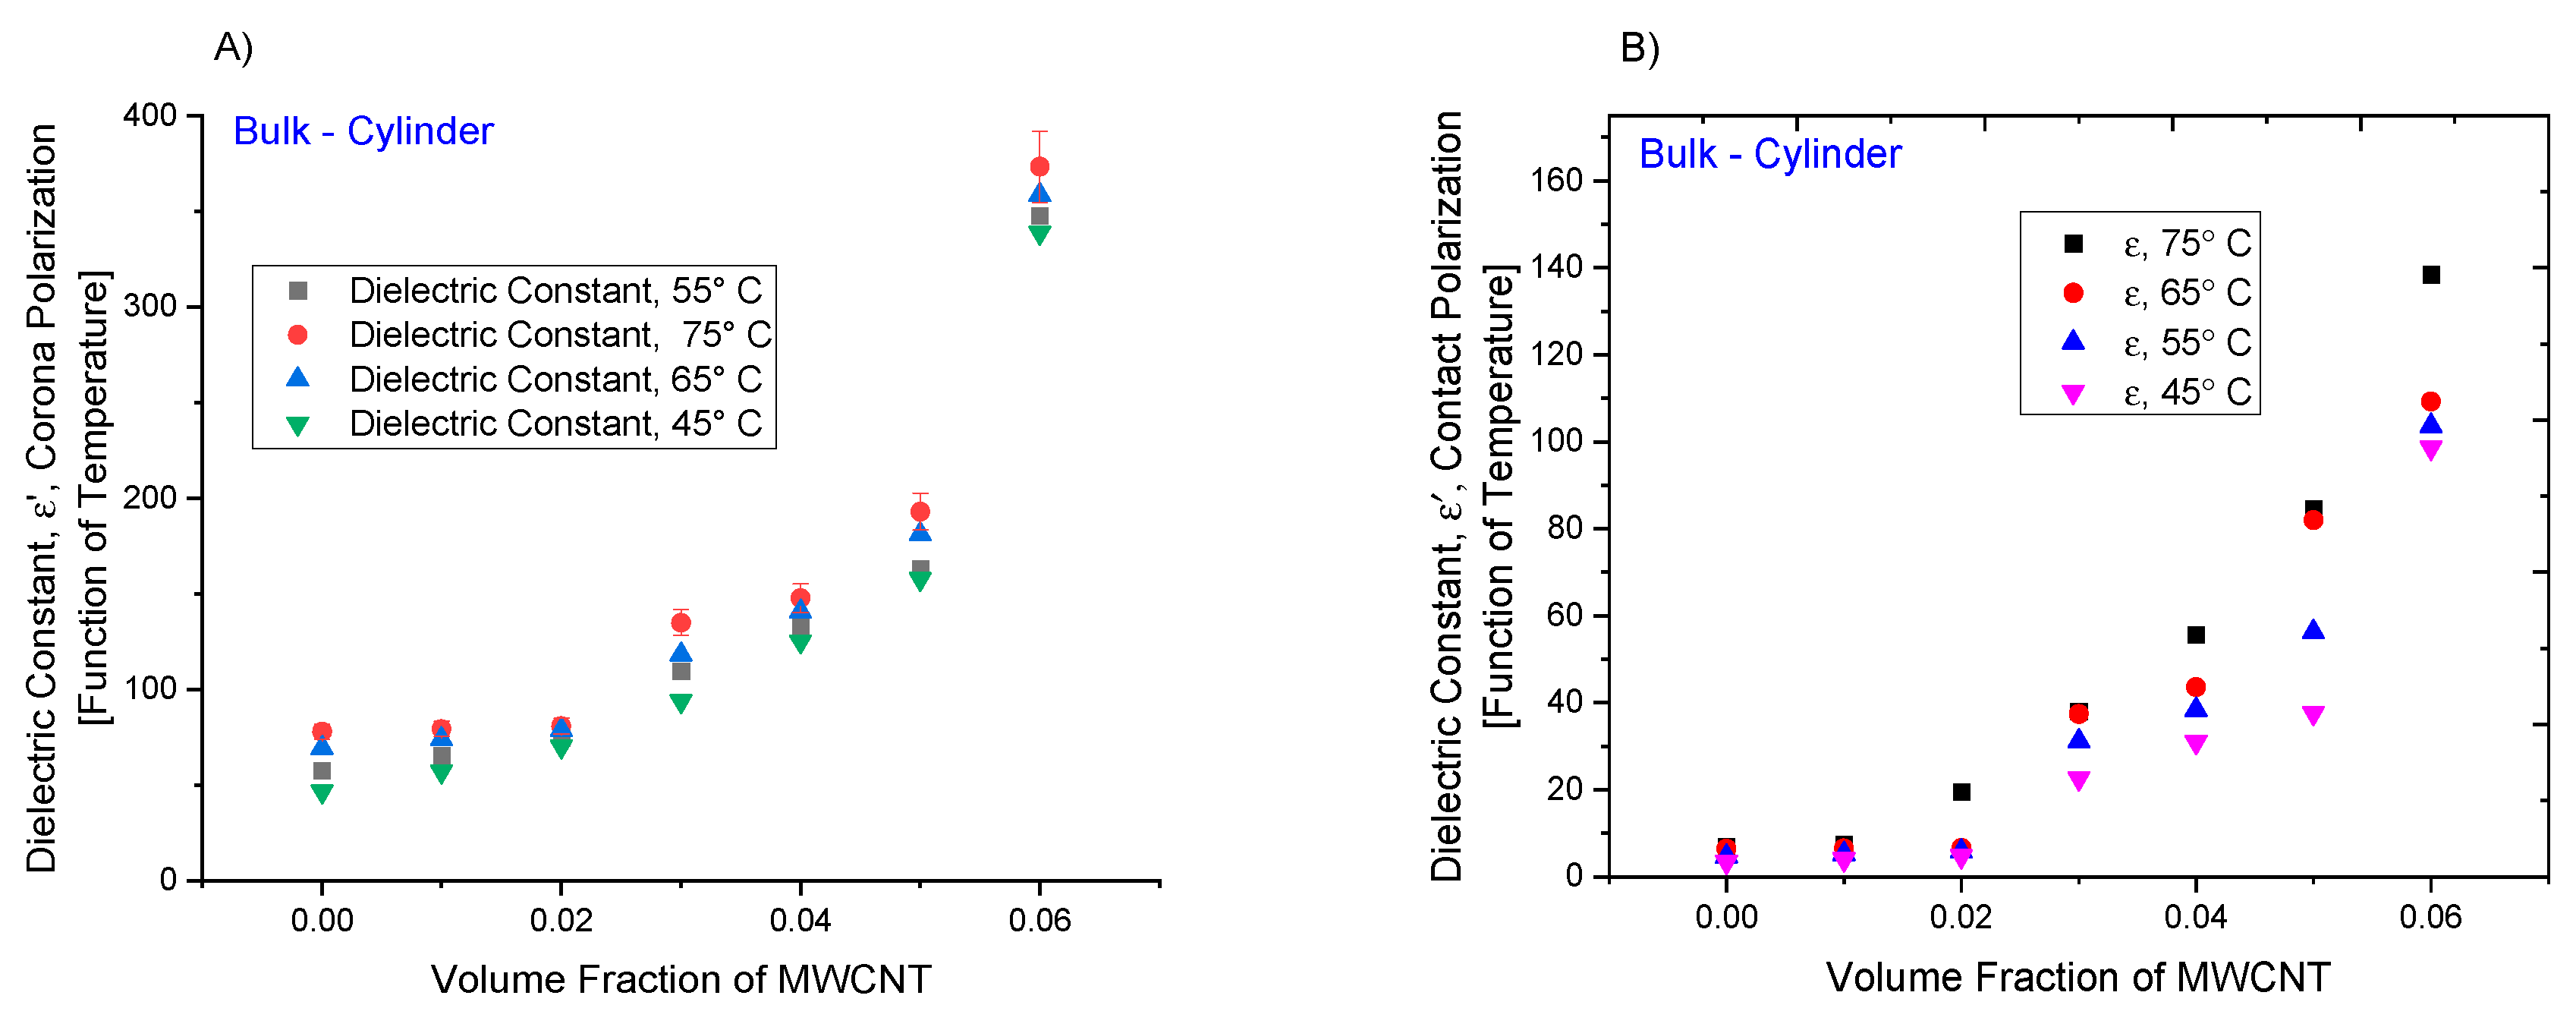
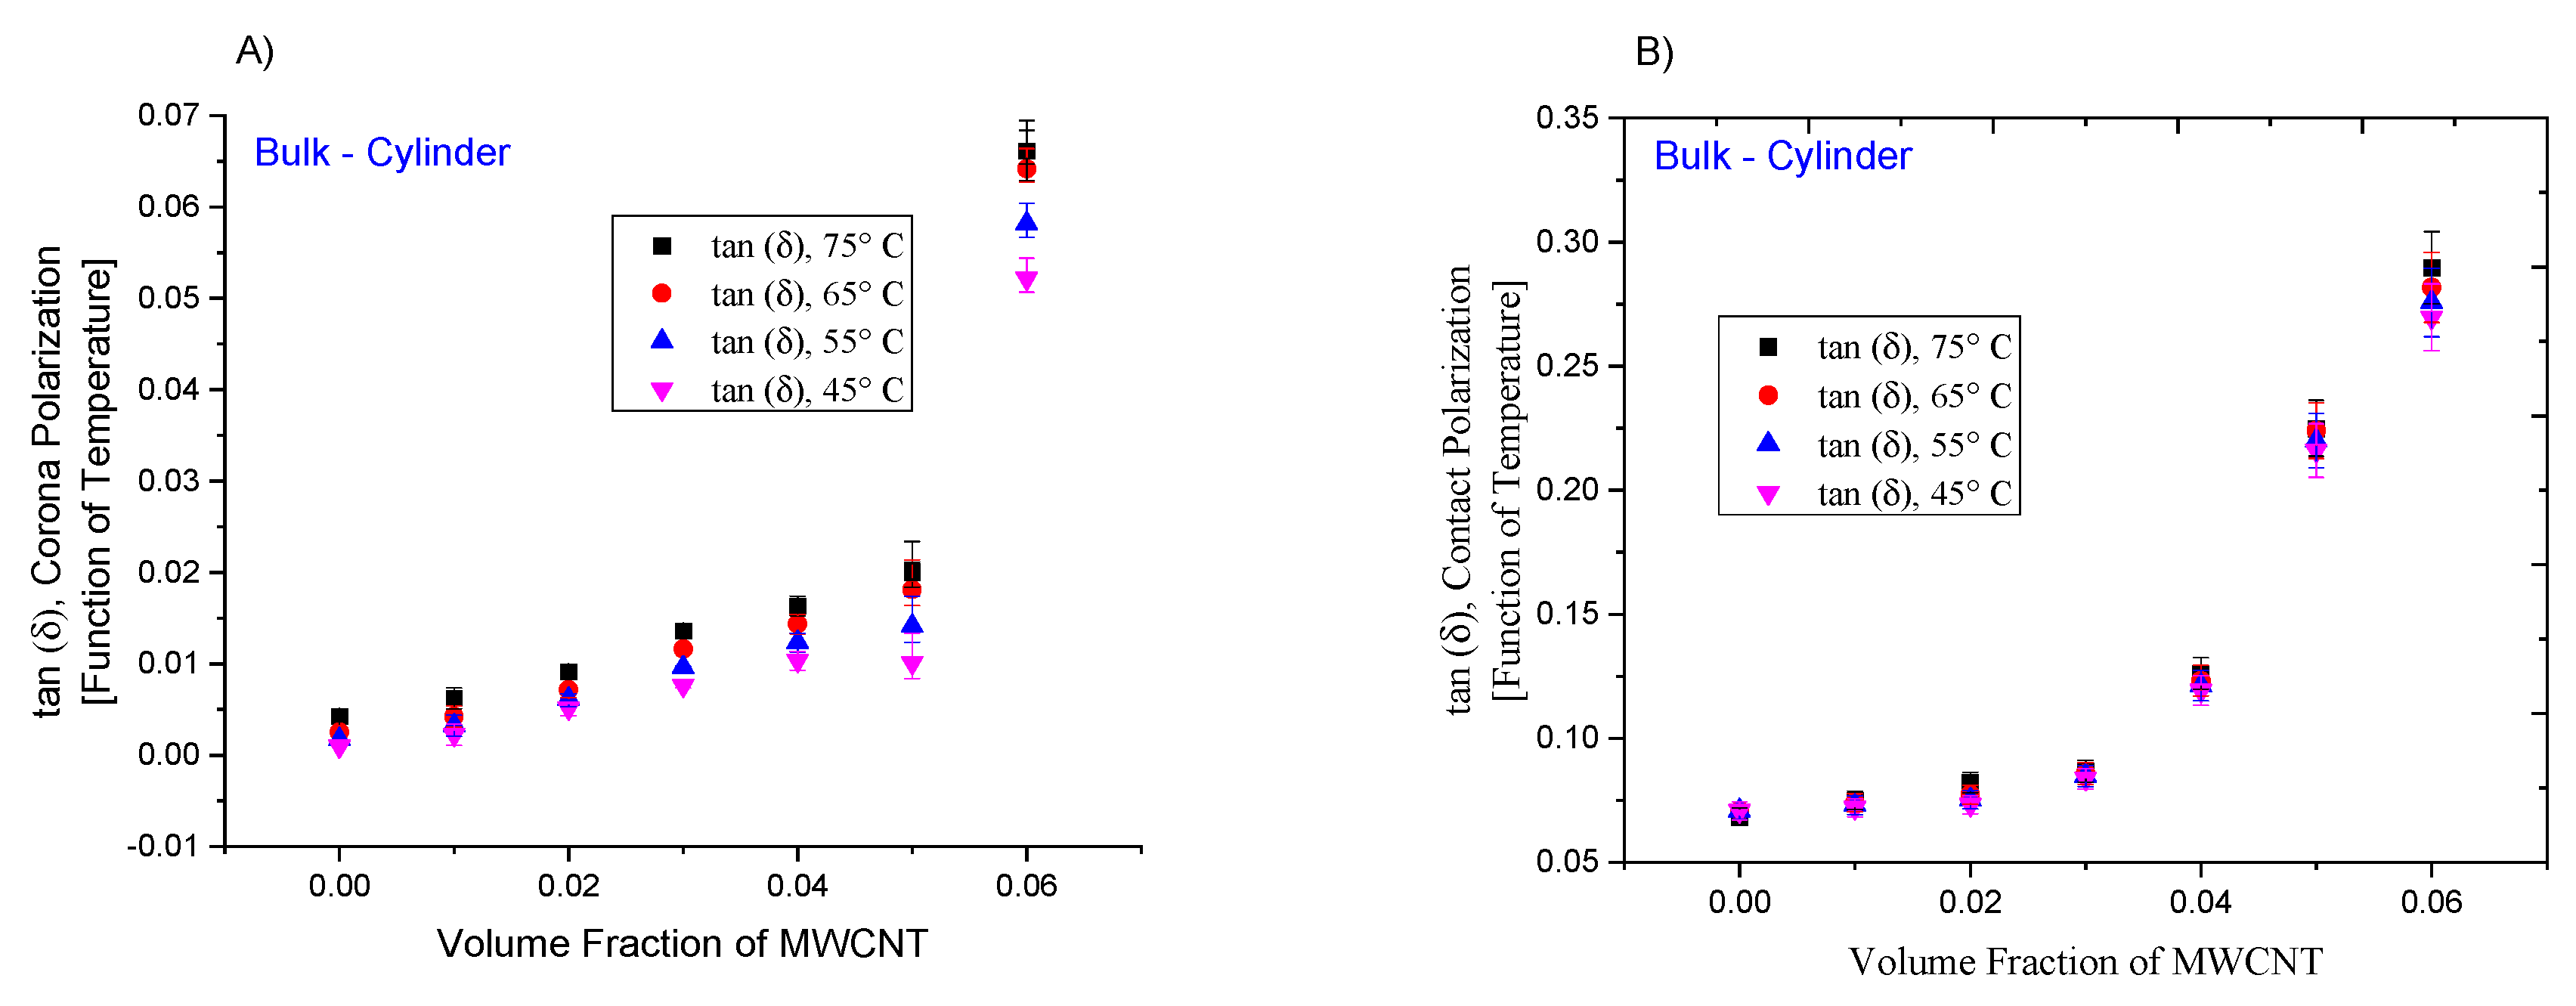
3.2. Variation of Temperature-Contact and Corona Polarization in Bulk Disks

The variation in the piezoelectric strain coefficient, d33 in bulk PZT-epoxy-MWCNT composites with decreasing poling temperature for both the corona and contact poling methods are shown in Figure 4A,B respectively. The poling temperature was varied from 45–75 °C and the MWCNT volume fraction is varied from 1% to 6%. The poling temperature was not increased beyond the glass transition temperature of the epoxy matrix, which is ~75 °C, the poling voltage was held constant at 2.2 kV/mm for disk samples for a polarization time of 60 min.
It can be seen that the d33 increases with increase in the polarization temperature, where at a MWCNT volume fraction of 4%, the d33 values for poling temperatures of 45, 55, 65 and 75 °C are ~15.65, 17.72, 19.78 and 23.31 pC/N, respectively. In the case of the contact poling method and for the same MWCNT volume fraction the d33 values are 0.54, 0.63, 1.01 and 1.61 pC/N. This trend is seen for all volume fractions of the MWCNTs, where the increase in the temperature increases the mobility of the crystal lattice structures of the polycrystalline piezoelectric phase, PZT, which causes the dipoles to align along the poling direction. [16,69] This also results in an increase in the number of dipoles that can be aligned for a given polarization voltage, which leads to higher dielectric strain values. Interestingly, the increase in polarization voltage leads to higher rates of increase in the piezoelectric coefficients and dielectric constant in comparison to the increase in temperature.
The dielectric constant, values show a similar increase with the poling temperature for the three phase bulk composites as shown in Figure 5. In Figure 5, the change in the dielectric constant varies with the polarization temperature as it varies from 45–75 °C. As expected, dielectric constant is higher for all volume fractions of MWCNTs at higher poling temperatures.
In the case of corona poling and for a MWCNT volume fraction of 4% the ε’ values for poling temperatures of 45, 55, 65 and 75 °C are ~125.1, 133.48, 140.6 and 147.81, respectively. For the same volume fraction of MWCNT in the case of the contact poled samples the dielectric constant values are ~31, 38, 43 and 55 for poling temperatures of 45, 55, 65 and 75 °C, respectively. The dielectric constant is a combination of the effective polarization due to the dipoles and their orientation, in addition to the contributions of electronic and ionic polarizations in the composite. With an increase in the poling temperature the dipole polarization increases due to an increase in the number of dipoles being aligned in the poling direction. This causes an increase in ε’ observed in Figure 5 for both corona and contact poling methods.
The tan (δ) values of the bulk three phase composites are also measured as a function of the poling temperature in addition to the ε’ values. For both the corona poled and contact poled composites they increase by small amounts as a function of poling temperature and at volume fractions below the percolation threshold as seen in Figure 6A,B. For example, the tan (δ) values for the corona poled composites with poling temperatures of 45, 55, 65 and 75 °C and a MWCNT volume fraction of 4% are ~0.01, 0.012, 0.014 and 0.016, respectively. Even for the MWCNT volume fraction of 6%, the tan (δ) values are 0.05, 0.058, 0.064 and 0.066 for the same changes in temperature. This trend is consistent for the contact poled composites as seen in Figure 6B. The small amount of increase in the tan (δ) values with increase in the poling temperature can be attributed to the higher chance of the formation of localized percolation pathways in the composites due to higher mobility of the ionic species in the composite at higher temperatures.

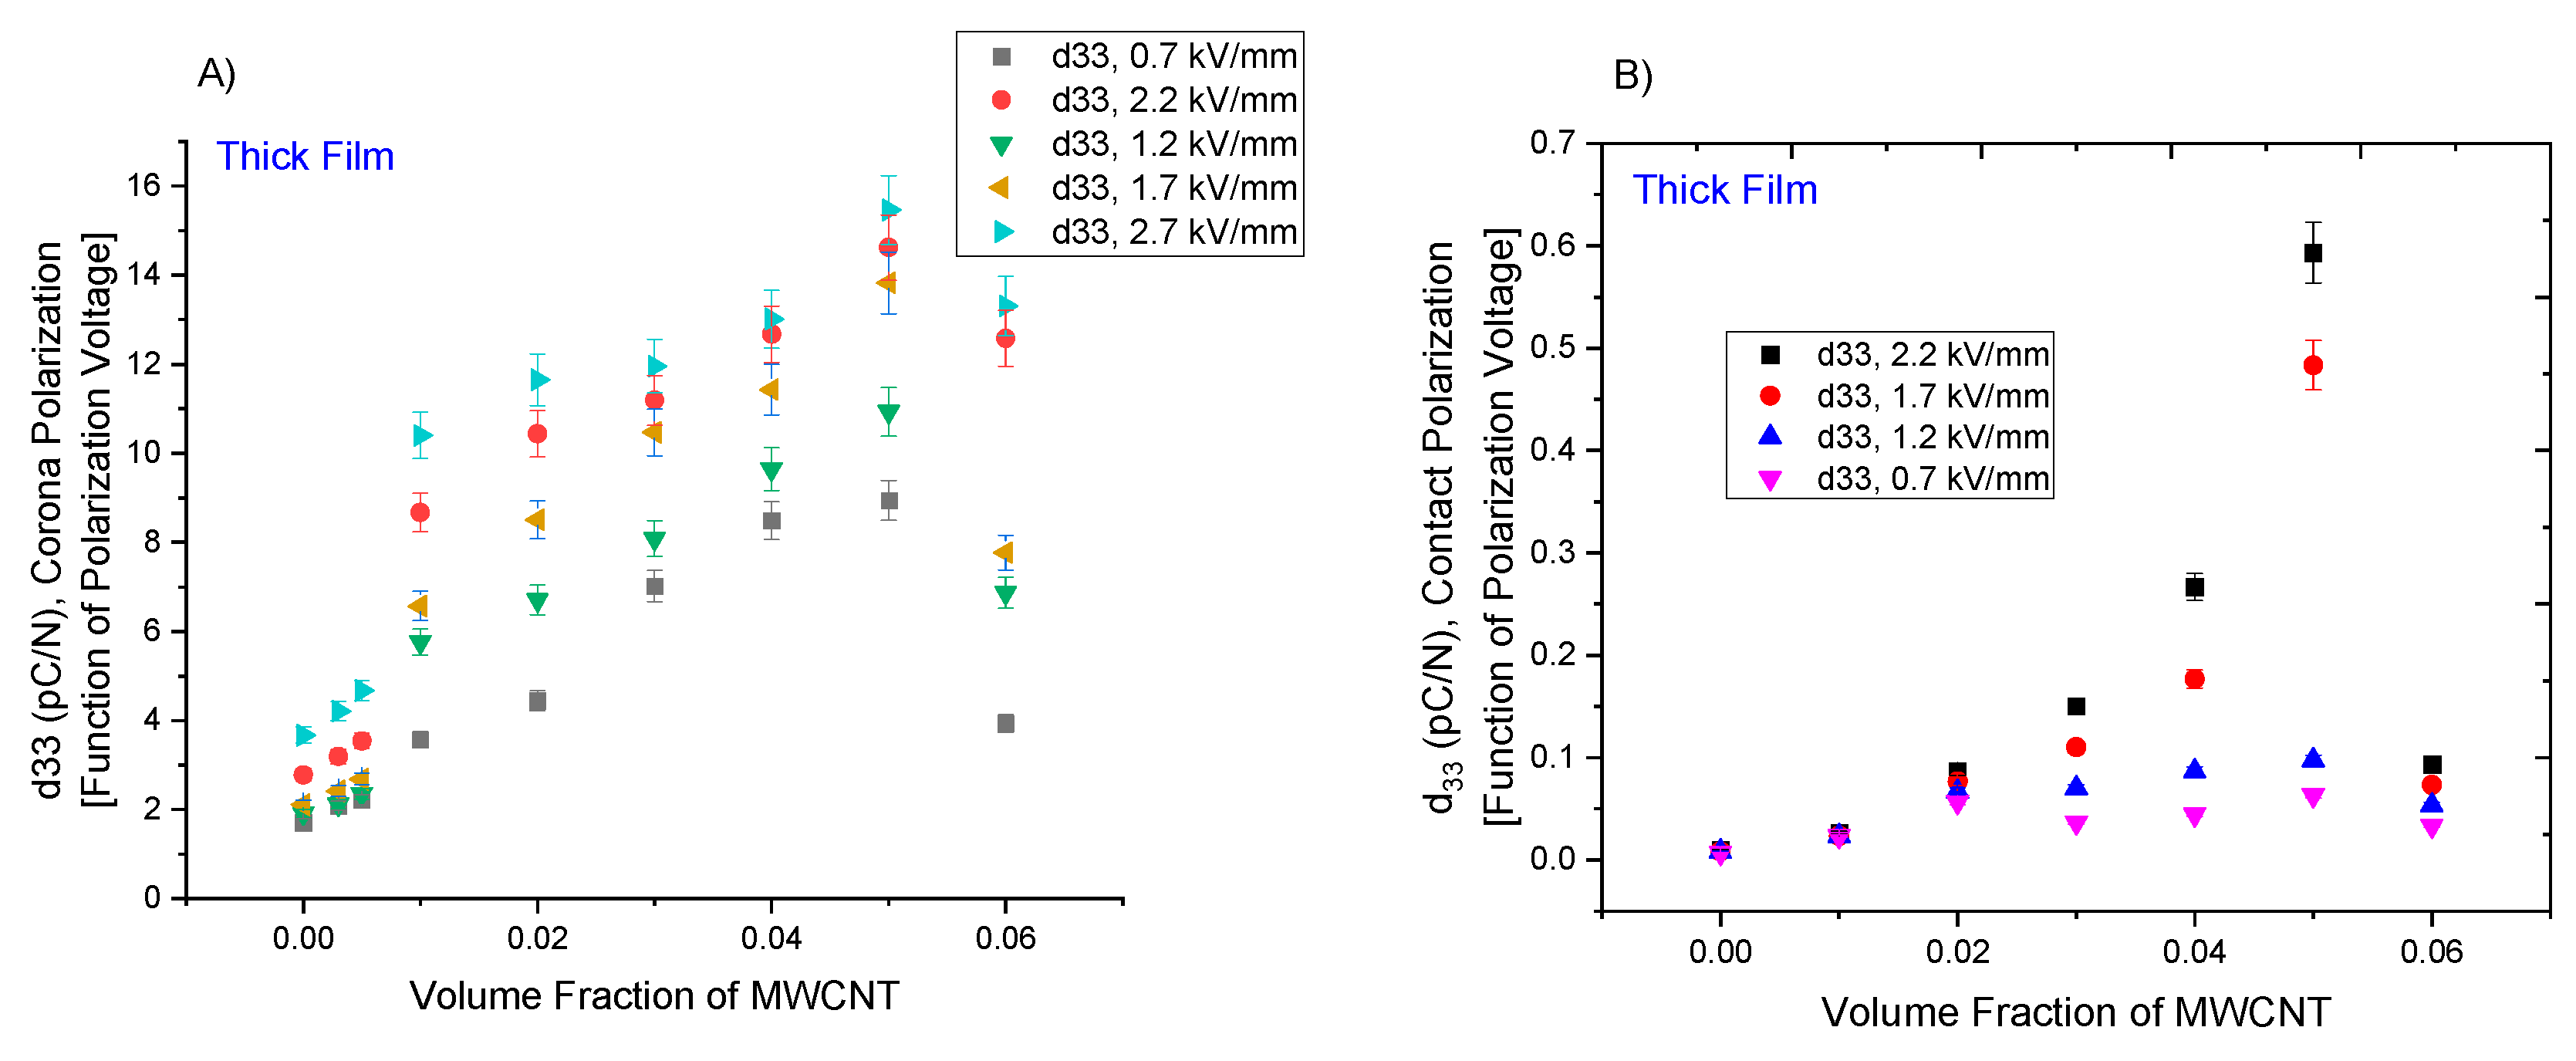
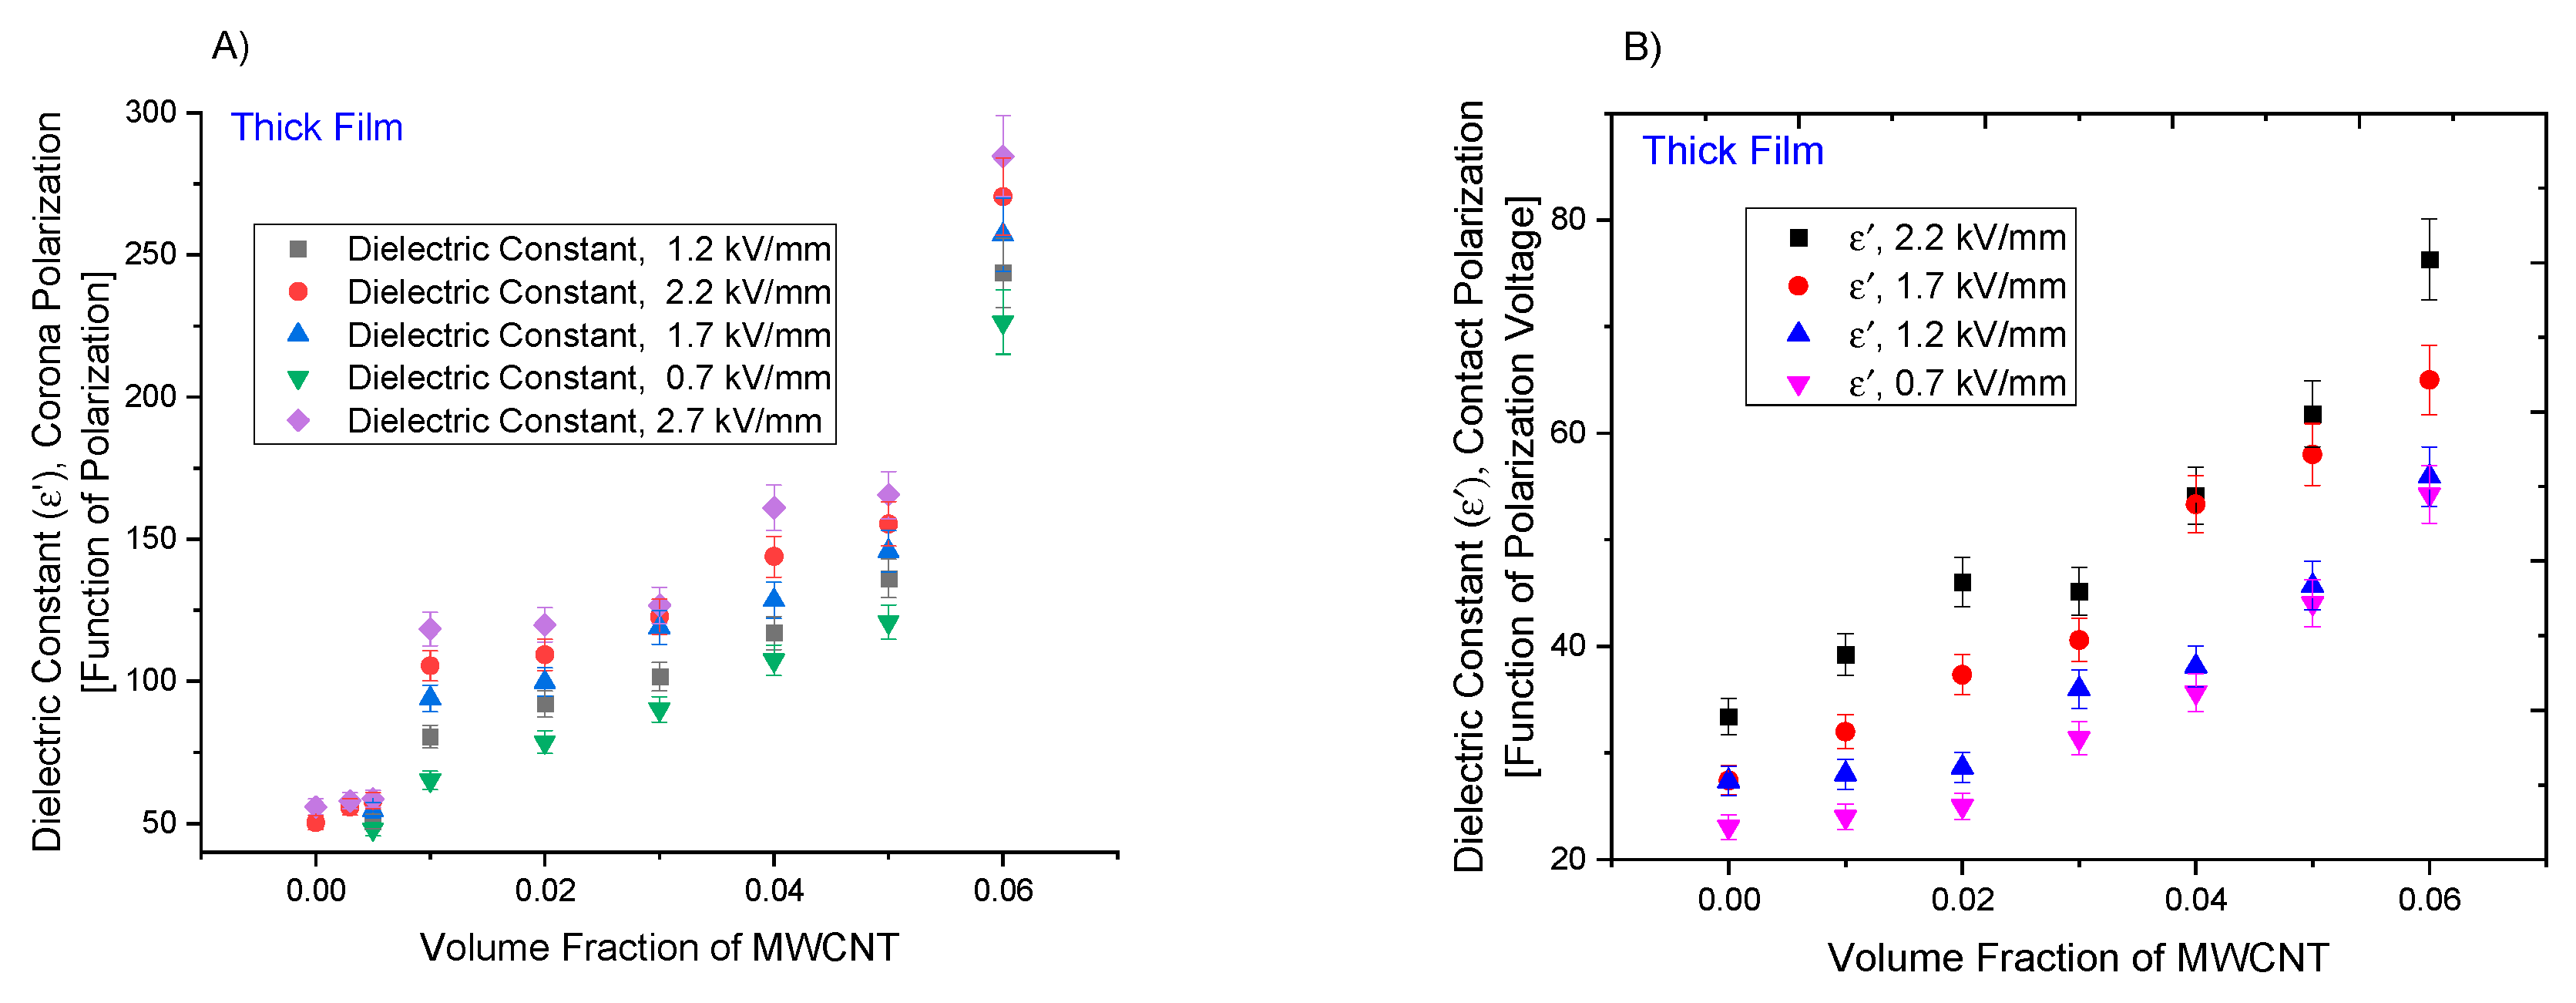
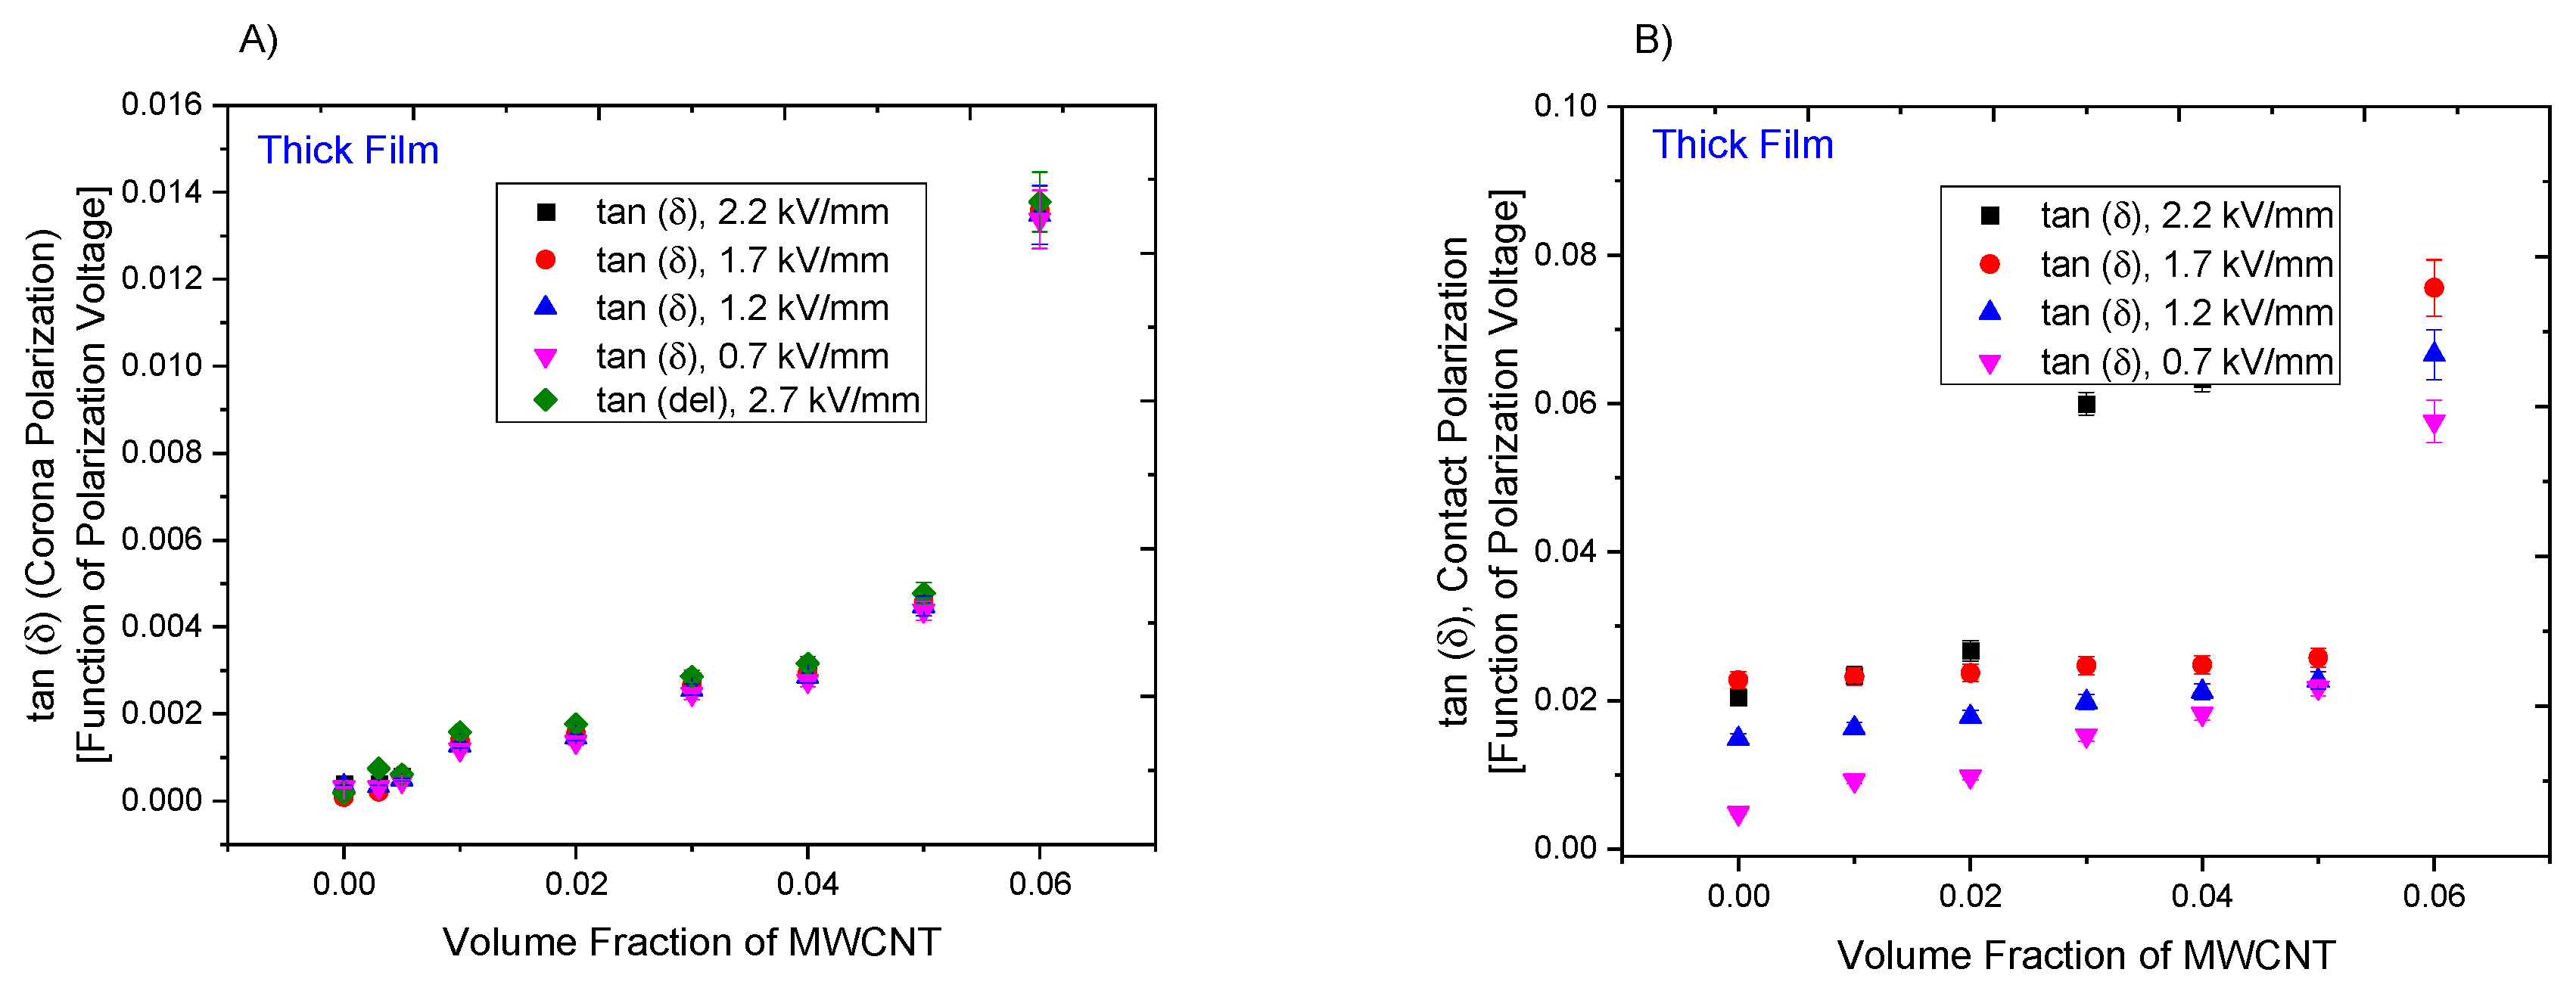
3.3. Variation of Polarization Voltage in Corona and Contact Poled Thick Films

The piezoelectric strain coefficients and dielectric constants in the PZT-epoxy-MWCNT thick film composites are plotted as a function of polarization voltage for the corona/contact poling methods in Figure 7 and Figure 8, respectively. The poling voltage is varied between 2.7–0.7 kV/mm (for corona poling), 2.2–0.7 kV/mm (contact poling) and the MWCNT volume fraction is varied from 1% to 6% for the thick films, the poling temperature is kept constant at 75 °C. It is seen that an increase in the poling voltage results in an increase in the piezoelectric strain coefficient like the bulk samples. For example, at a MWCNT volume fraction of 4% the d33 values for poling voltages of 0.7, 1.2, 1.7, 2.2 and 2.7 kV/mm for the corona poling method are ~8.49, 12.67, 11.43 and 9.645 pC/N, respectively. In the case of the contact poling method and for the same MWCNT volume fraction the d33 values are 0.04, 0.08, 0.17 and 0.27 pC/N for the contact poling method with poling voltages of 0.7, 1.2, 1.7 and 2.2 kV/mm respectively. The increase in the piezoelectric strain coefficients with increasing poling voltages are observed for all volume fractions of the MWCNTs. The increase in poling voltage aligns higher number of dipoles in the poling direction which increases the polarization of the composite and leads to higher d33 values in the thick film composites.
The dielectric constant values for thick film composites show a similar change as depicted in Figure 8, where they are higher at poling voltage values for all volume fractions of MWCNTs. For example, in the case of corona poling and for a MWCNT volume fraction of 3% the ε values for poling voltages of 0.7, 1.2, 1.7, 2.2 and 2.7 kV/mm are ~107.42, 117.02, 128.53, 143,88 and 161.06, respectively. For the same volume fraction of MWCNTs (contact poled) the dielectric values are ~31, 36, 41 and 45 for poling voltages of 0.7, 1.2, 1.7 and 2.2 kV/mm, respectively. Similar to the bulk composites, the polarization due to the orientation of the dipoles contributes to the values of dielectric constant. With an increase in the poling voltage, more dipoles become aligned and the polarization due to the dipoles increases, which results increases in the dielectric constant for both corona and contact poling methods.
The tan (δ) values also increase with increases in the poling voltage as seen in Figure 9. Specifically, the tan (δ) values for the contact poled composites with poling fields of 0.7, 1.2, 1.7 and 2.2 kV/mm (at a MWCNT volume fraction of 4% are ~0.009, 0.01, 0.02 and 0.033 respectively. The higher values of tan (δ) that are associated with increased polarization voltages are attributed to the increased number of defects or localized regions of dielectric breakdown in the composites caused by high voltage polarization. The tan (δ) for the corona poled composites show very little change for all MWCNT volume fractions, thus indicating the effectiveness of the corona poling method (causes less poling defects) in thick films as compared to contact poling method [16].

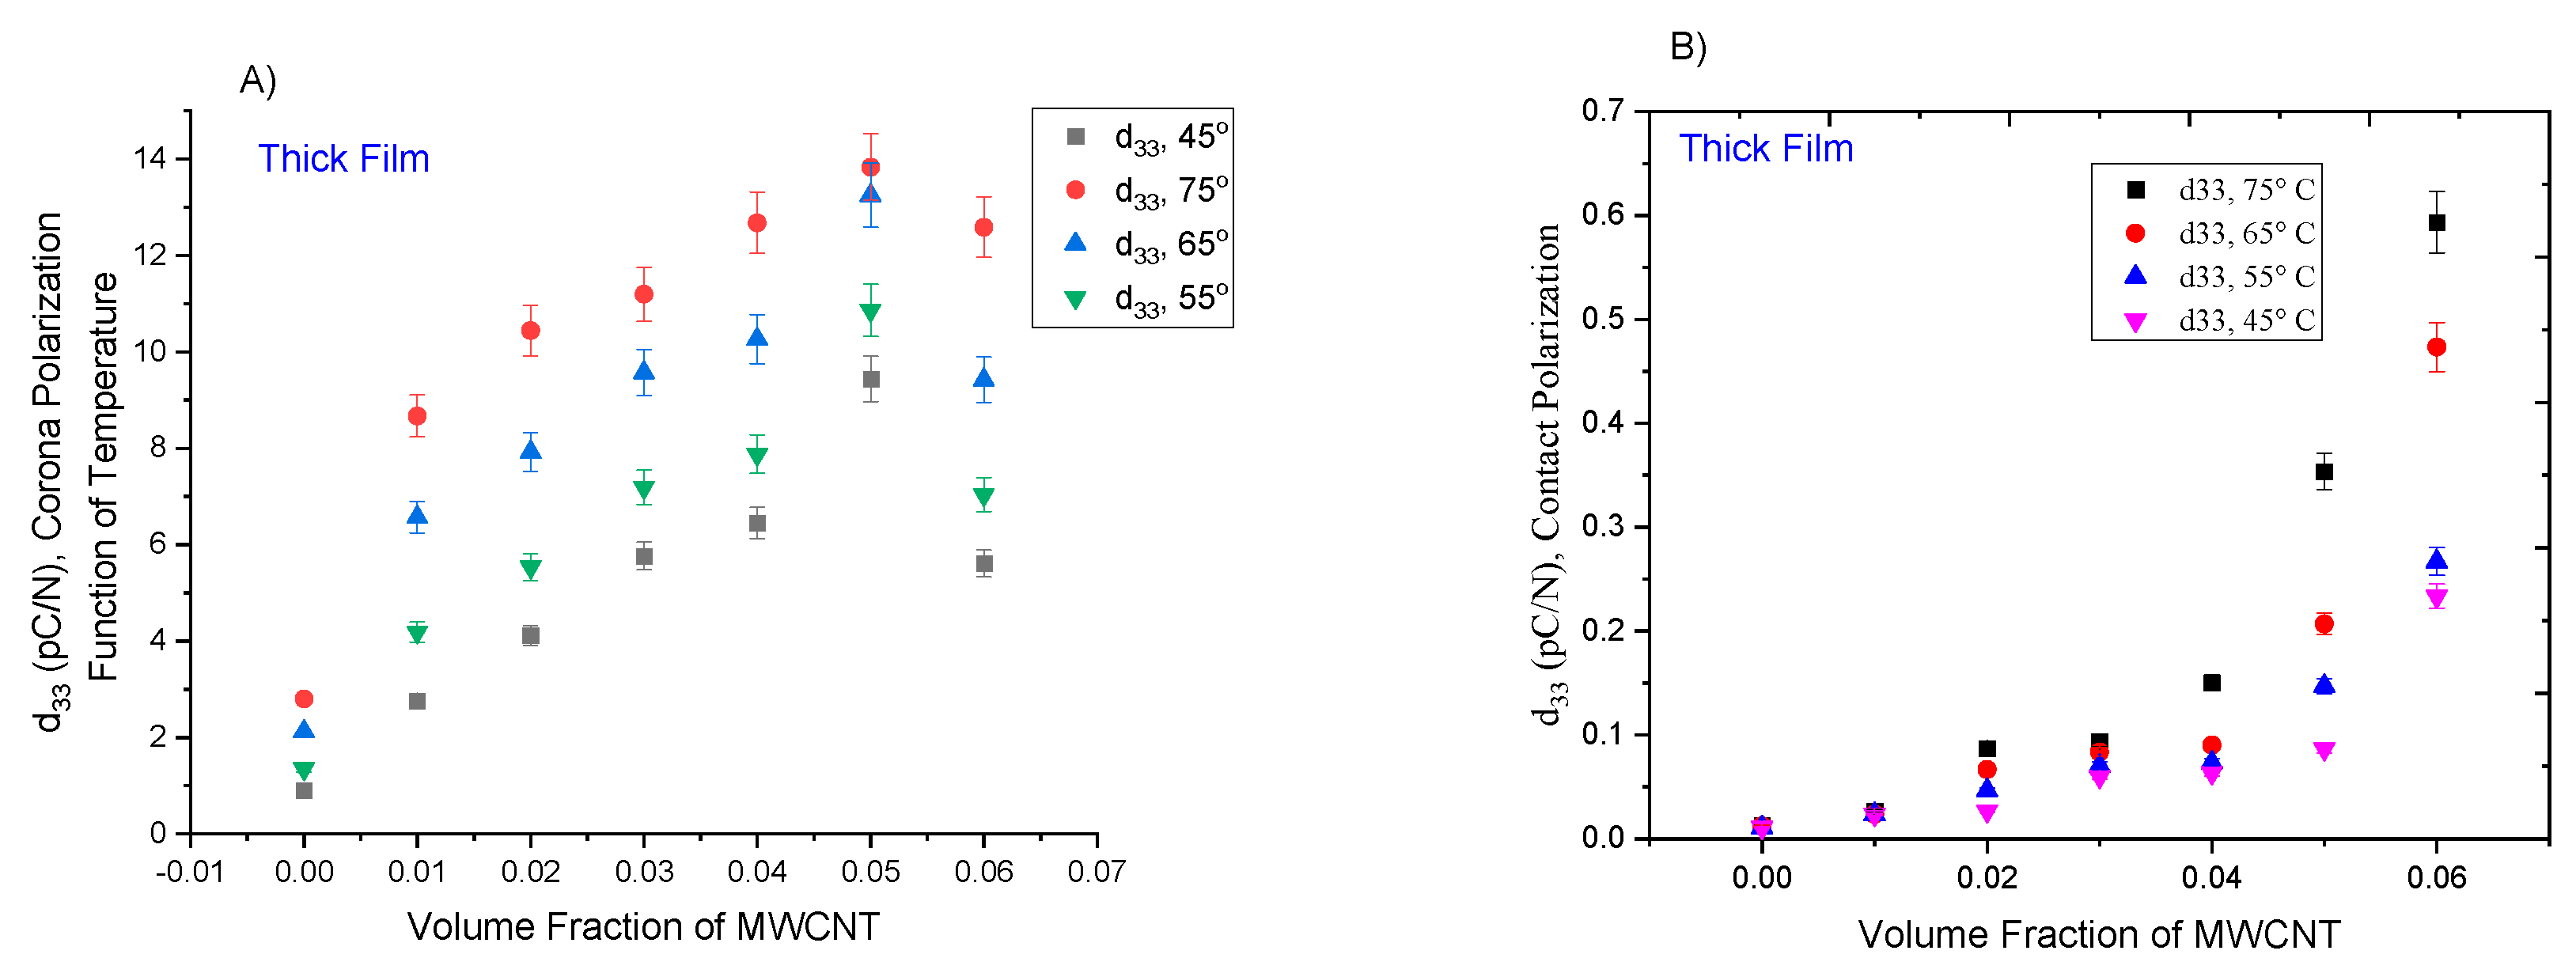
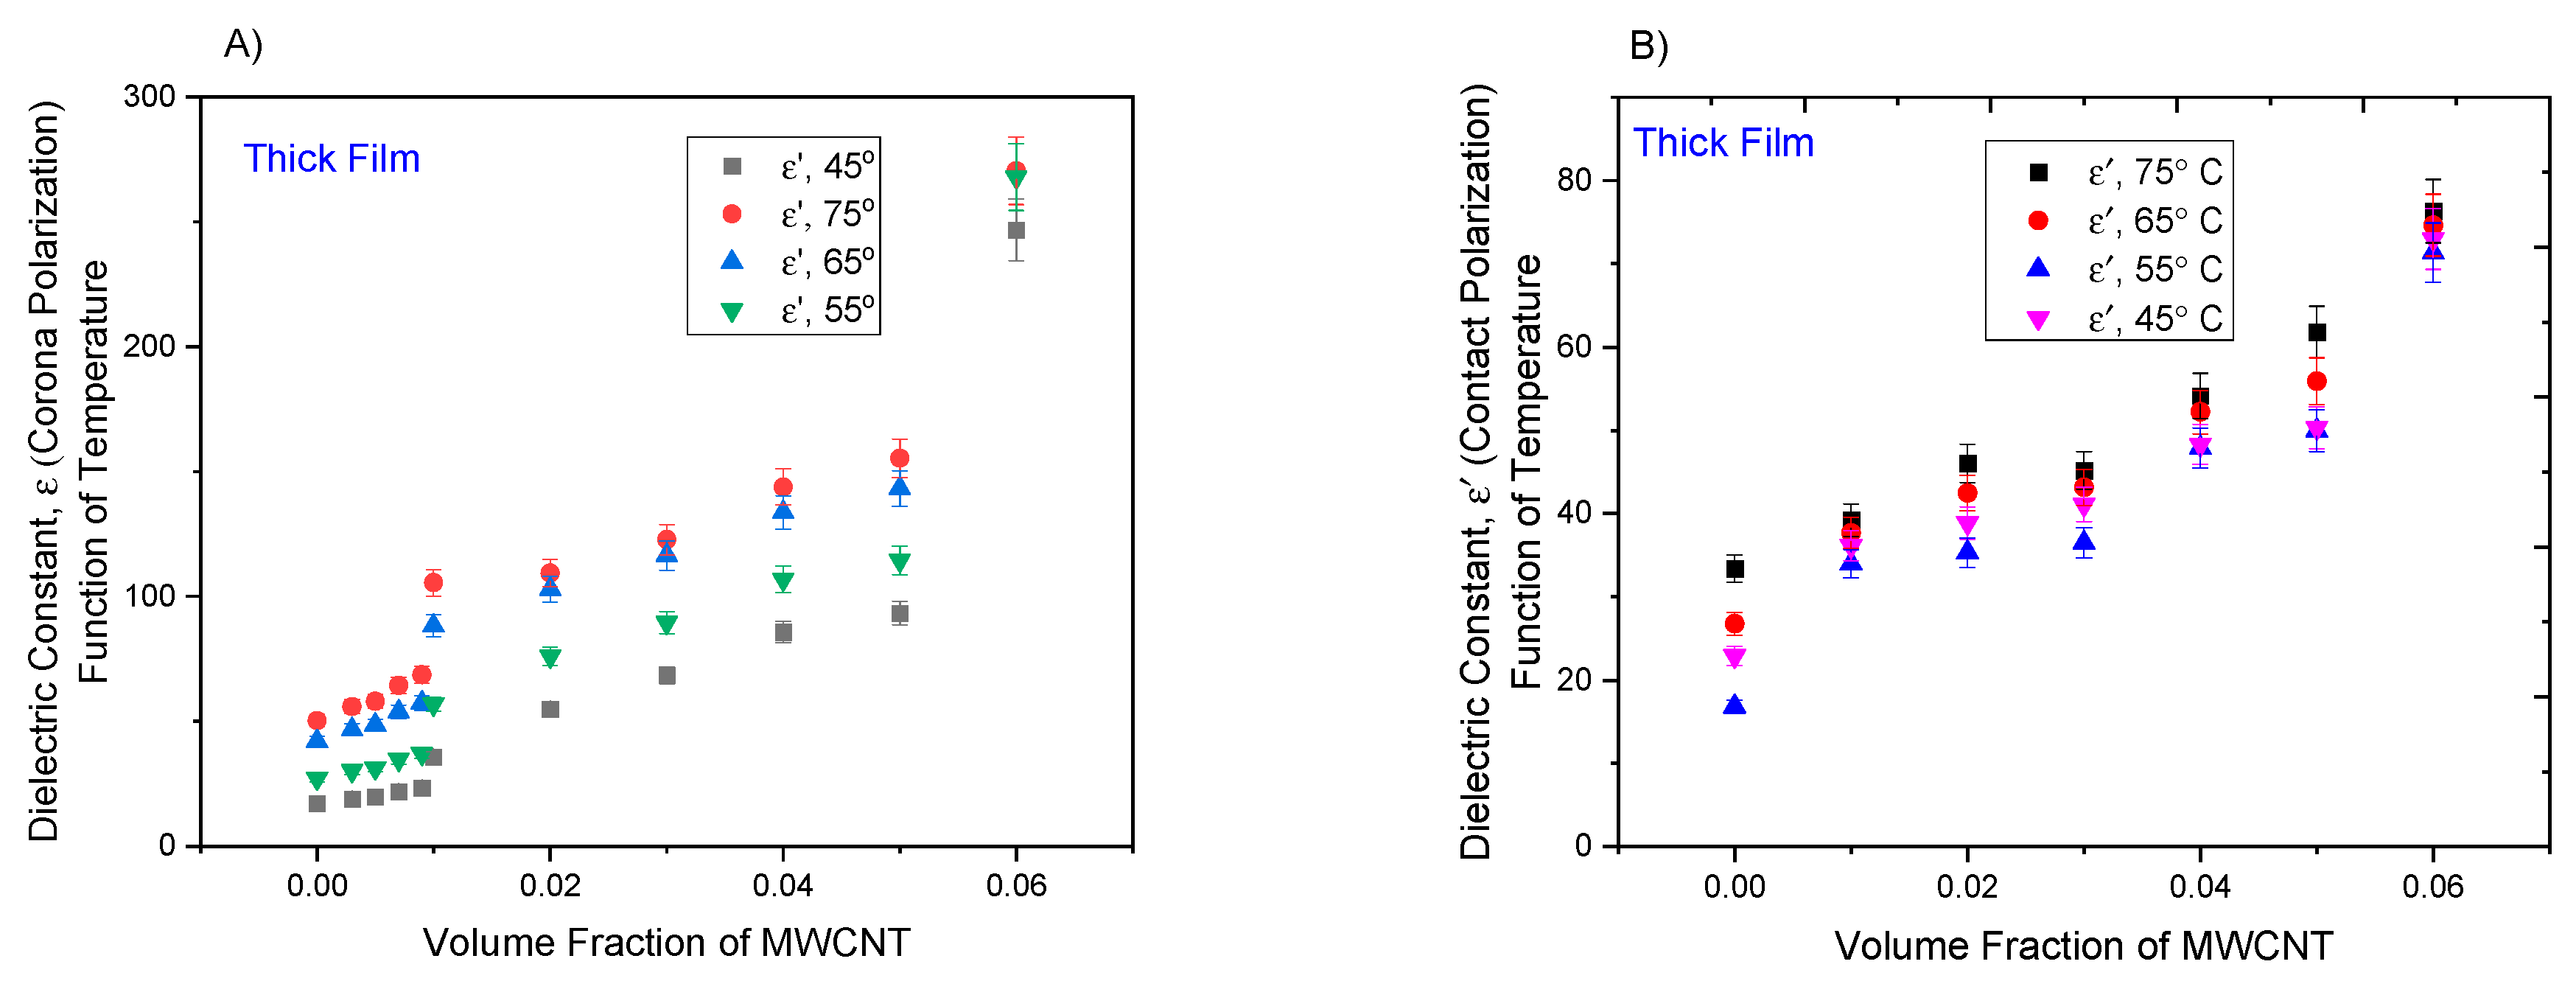
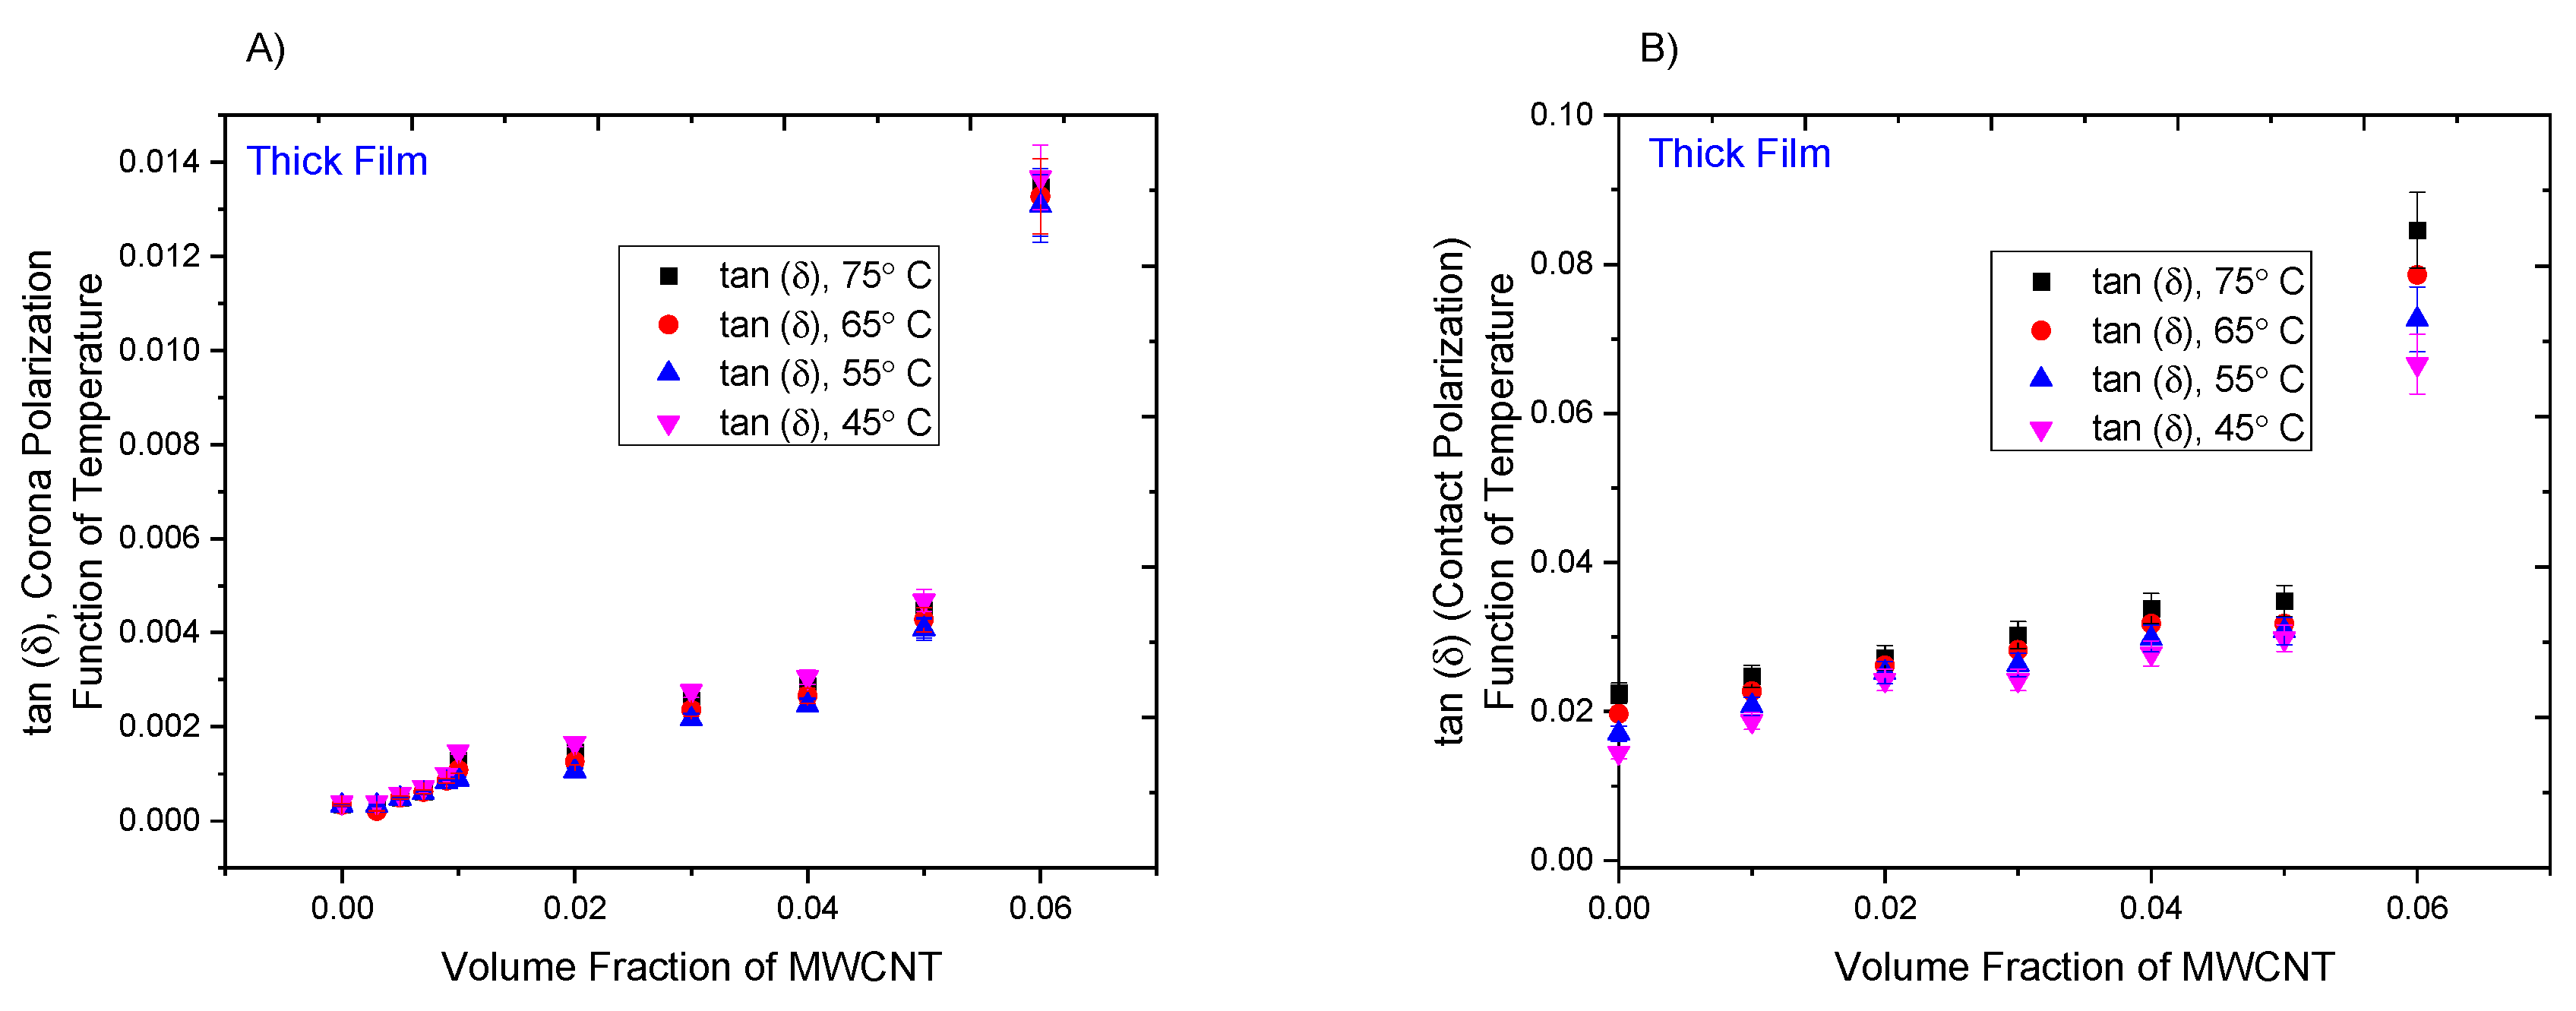
3.4. Variation of Polarization Temperature in Corona and Contact Poled Thick Films

The variation in the piezoelectric strain coefficient, d33 in PZT-epoxy-MWCNT thick films with decreasing poling temperature for both corona/contact poling methods are shown in Figure 9 and Figure 10, respectively. The poling temperature is varied from 45–75 °C and the MWCNT volume fraction was varied from 1% to 6%. The poling voltage was kept constant at 2.2 kV/mm. It can be seen that the d33 increases with an increase in the poling voltage. At a MWCNT volume fraction of 4% the d33 values for poling temperatures of 45, 55, 65 and 75 °C for the corona poling method are ~6.45, 7.87, 10.26 and 12.68 pC/N, respectively. In the case of the contact poling method and for the same MWCNT volume fraction the d33 values are 0.086, 0.14, 0.20 and 0.26 pC/N for the contact poling method with poling voltages of 0.7, 1.2, 1.7 and 2.2 kV/mm respectively. This trend is seen for all volume fractions of the MWCNTs. At high temperature a greater number of dipoles can be aligned for the given poling voltage due to the increase in the mobility of the dipoles. This increases the polarization of the composite and leads to higher d33.
The ε’, values show a similar increase with the poling temperature for the three phase thick film composites. Figure 11 shows the change in ε’ values with the poling temperature varying from 45–75 °C. For all volume fractions of MWCNTs the dielectric constant is higher at higher poling temperatures. For example, in the case of corona poling and for a MWCNT volume fraction of 4% the ε’ values for poling temperatures of 45, 55, 65 and 75 °C are ~57, 71, 81 and 95, respectively. For the same volume fraction of MWCNT in the case of the contact poled samples the ε’ is ~85.75, 106.79, 133.65 and 143.88 for the same poling temperatures. The dielectric constant of the composite increases with the increase in the effective dipole polarization, which depends on the to the dipole orientation. With an increase in the poling temperature the dipole polarization increases due to an increase in the number of dipoles being aligned in the poling direction. This causes an increase in ε as seen for both the poling methods.
The tan (δ) values of the bulk three phase composites are also measured as a function of the poling temperature in addition to the ε’ values. Figure 12 shows how the dielectric loss for the contact poled composites increase with polarization temperature, while the loss remains nearly constant for the corona poling technique. This trend in followed for all MWCNT volume fractions of the thick film composites with contact poling. This increase in the tan (δ) values with increase in the poling temperature can be attributed to the higher chance of the formation of localized percolation pathways in the composites due to higher mobility of the ionic species in the composite at higher temperatures during contact poling of the thick films. These defects can also be coupled with the localized dielectric breakdown of the epoxy matrix material. In the case of the corona poling, the probability of the formation of these defects is much lower, which leads to almost constant tan (δ) values at different poling temperatures.

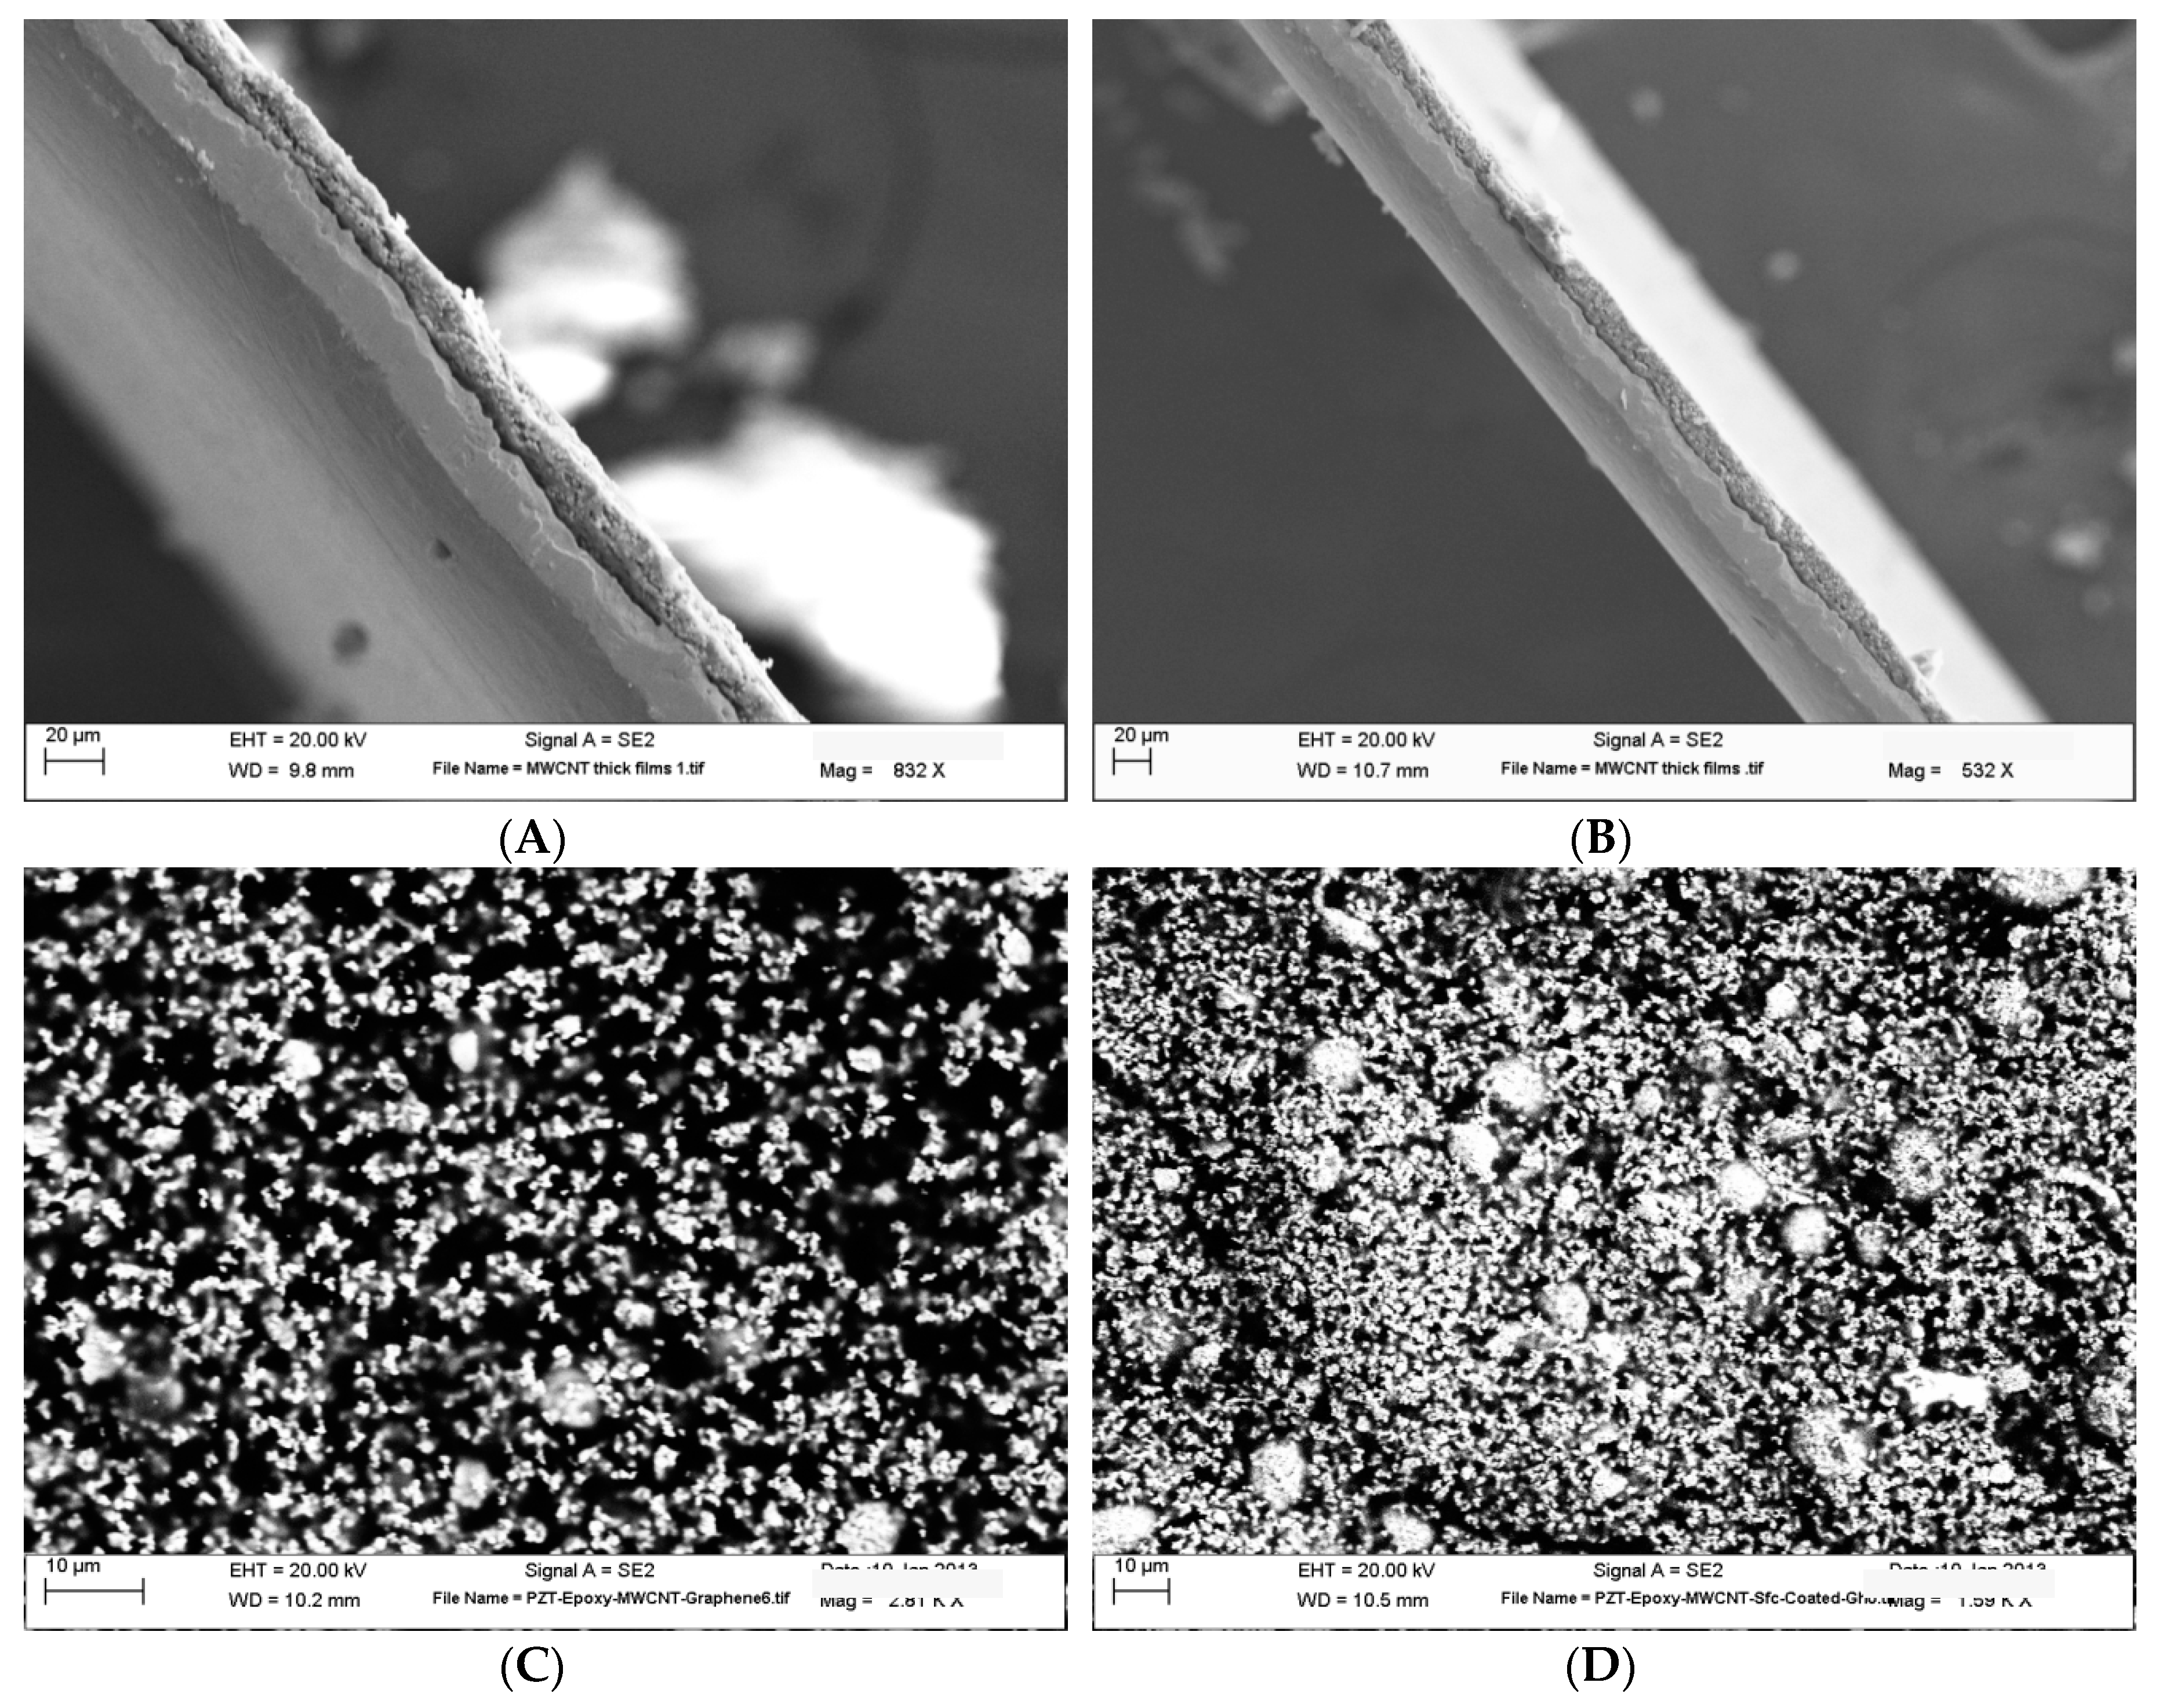
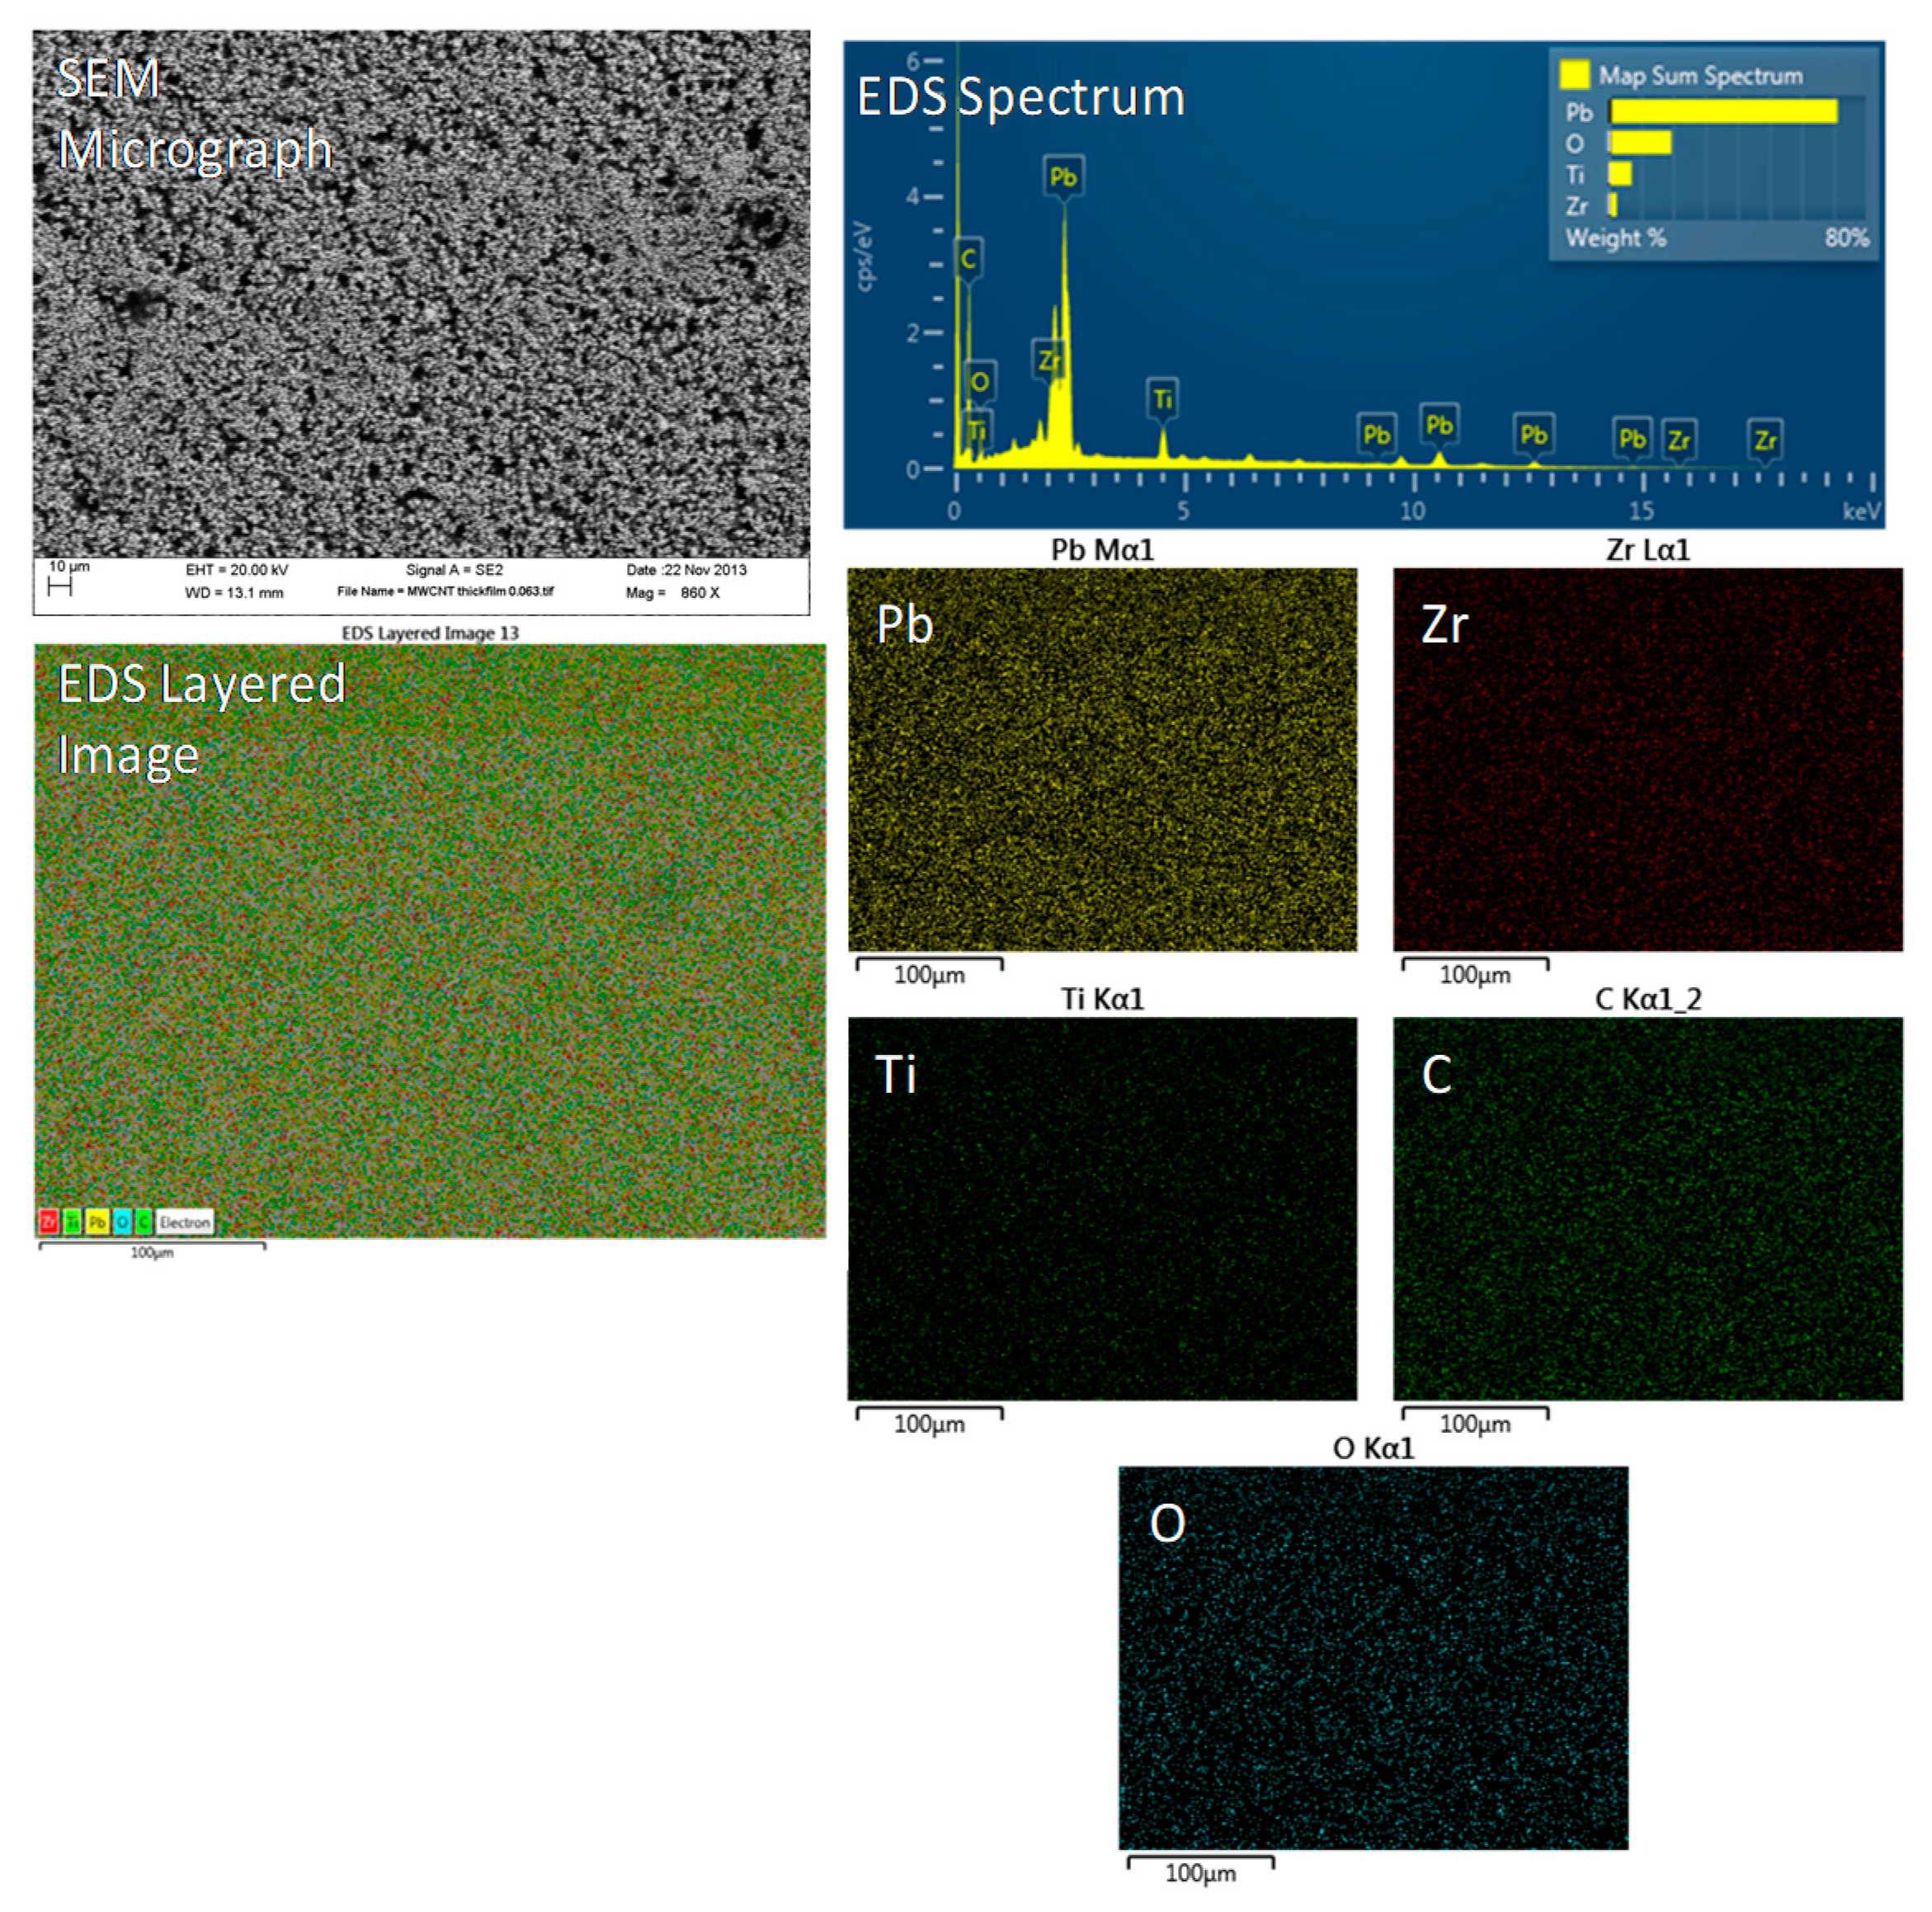
3.5. SEM Characterization of Films

The dispersion of PZT and MWCNTs within the epoxy matric was observed with the aid of micrograph images obtained from a Zeiss Sigma Field Emission scanning electron microscope (SEM) and an Oxford INCA PentaFET x3 8100 energy dispersive X-ray spectroscopy. The three phase PZT-Epoxy-MWCNT thick film with MWCNT volume fractions of 4% and 6% are shown in Figure 13. The figure shows the composite thick film spin coated over a flexible stainless substrate.
SEM micrographs of the fractured surfaces of the composite thick films are shown in Figure 13. The PZT clusters and cloud shaped clusters of MWCNTs are seen distributed in the epoxy matrix. As observed from the image analysis from ImageJ, the MWCNT clusters range in sizes <2 μm with an average cluster size of ~600 nm. On the other hand, the PZT clusters are >2 μm with an average cluster of around 12 μm.
Figure 14 shows the SEM micrograph and EDS spectroscopy of the PZT-epoxy-MWCNT thick film fractured surface and the top surface respectively. The fractured surface shows the distribution of the PZT and MWCNT clusters in the epoxy matrix similar to that of the bulk composites. The EDS elemental analysis and the layered image of the top surface of the thick film shows a uniform distribution of the different phases on the surface. An image analysis in ImageJ shows that the average PZT particle size in the fractured surface and on the top surface are ~10 and 11 μm respectively. The average MWCNT cluster size is ~650 nm at the fractured surface and ~550 nm at the top surface of the thick film. This might be due to the presence of a higher viscosity sol-gel (containing larger clusters of MWCNTs) closer to the substrate surface as compared to the top surface of the thick film during the spin coating process. As analyzed by ImageJ, the PZT cluster sizes are >2 μm and that of the MWCNTs are <2 μm.

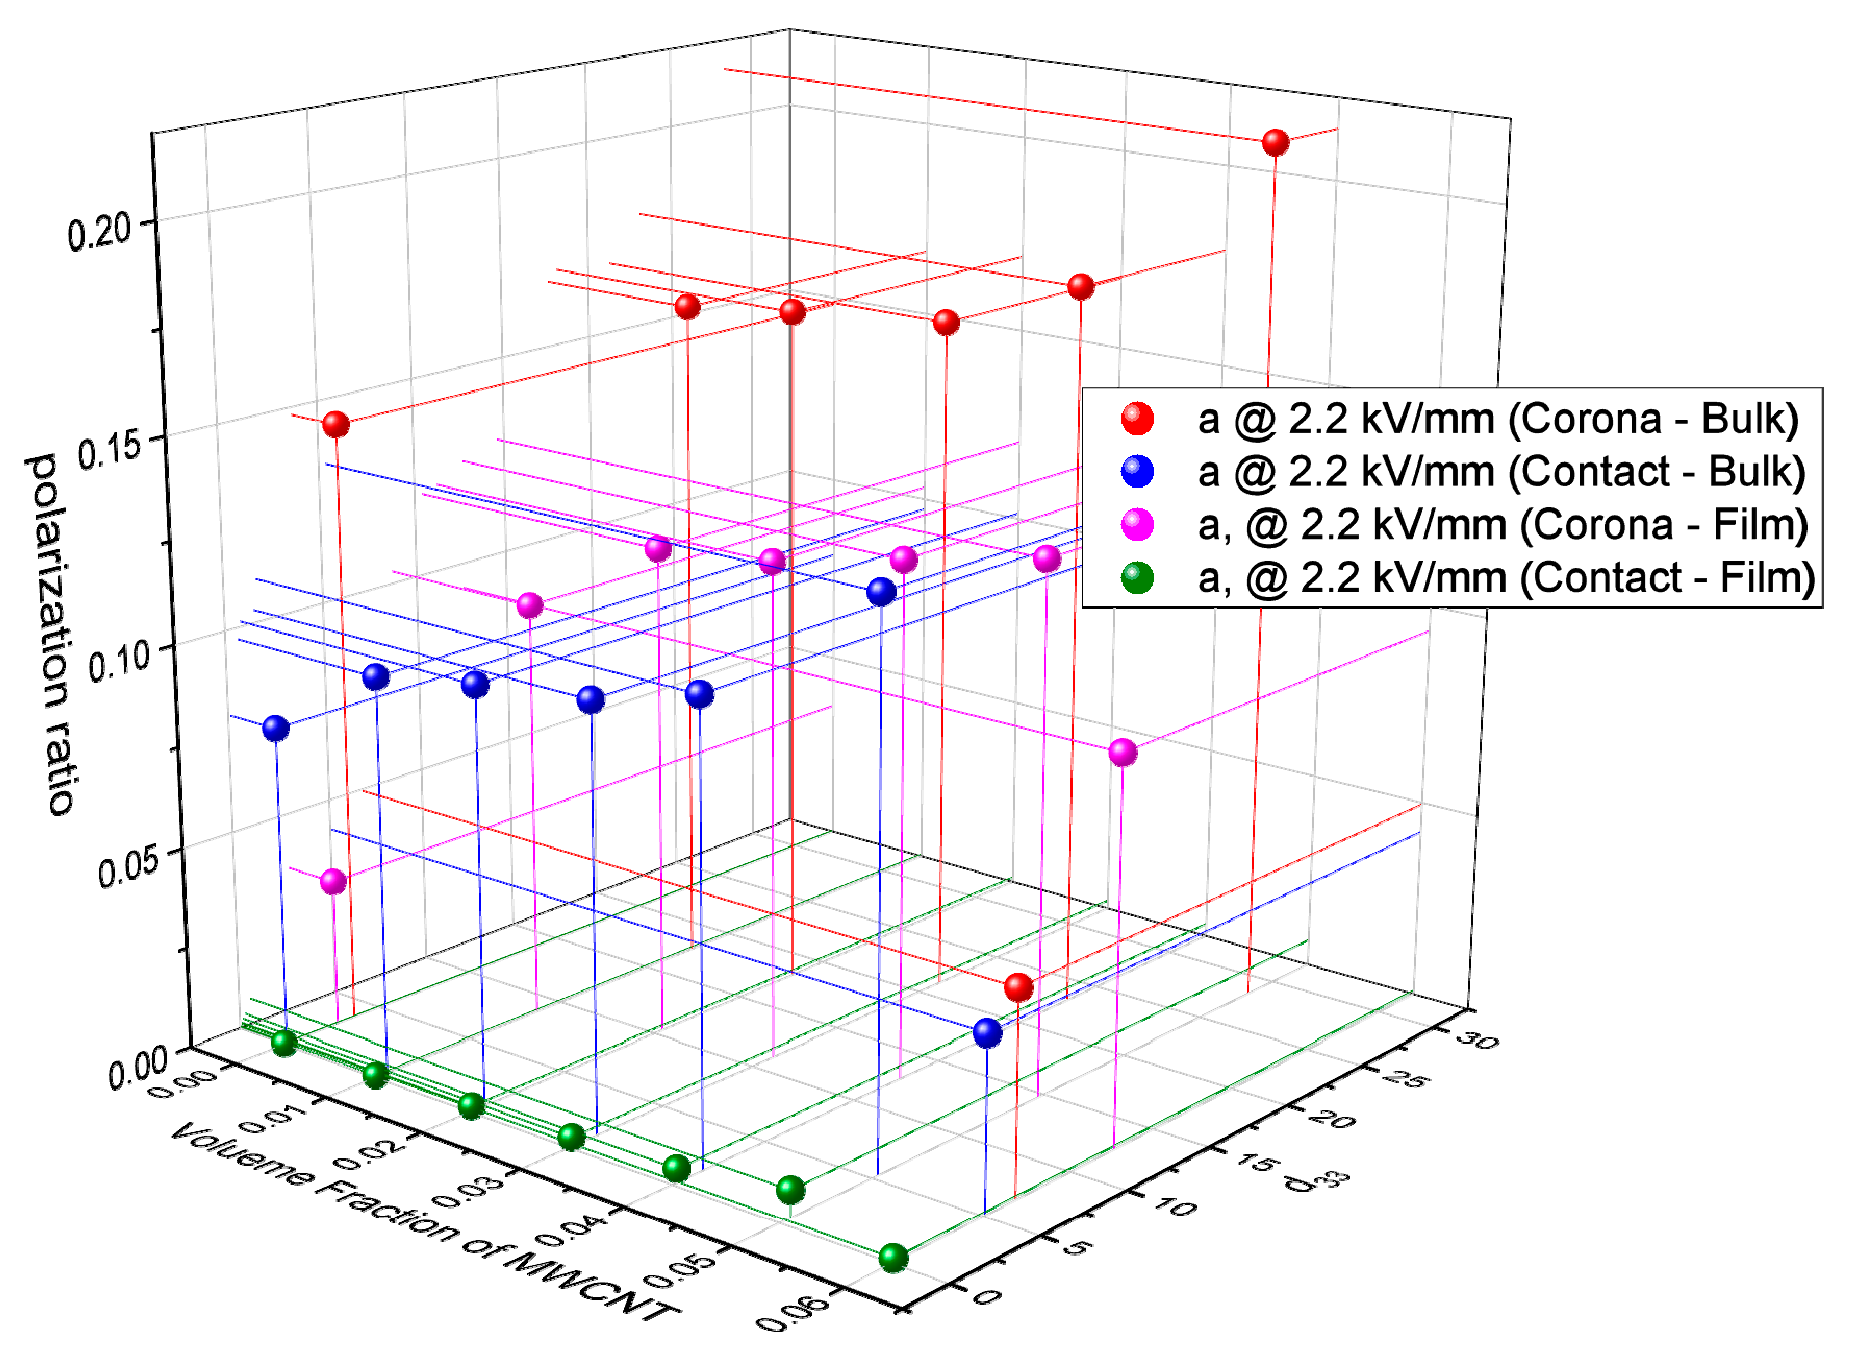
3.6. Influence of Sample Shape and Polarization Voltage

The results indicate the enhancement of these properties with increasing poling voltage and temperature. Higher poling voltage increases the effective dipole moment in the direction of poling and enhances the effective properties. On the other hand, an increase in the poling temperature will increase the mobility of the dipoles, which will allow more dipoles to orient themselves along the poling direction; effectively increasing the dipole moment and enhancing the piezoelectric and dielectric properties of the composites. Apart from the poling parameters the effective piezoelectric and dielectric characteristics of the composites also depend on the surface properties of the embedded particles, as well as, the shape factor of the samples as shown in Figure 15.

4. Conclusions and Future Work

The mechanisms that influence the piezoelectric and dielectric properties of the three phase composites were investigated by varying the volume fraction of the conductive phase and polarization parameters: temperature and applied voltage per thickness. Bulk and thick film samples were prepared via sol gel/cast-mold and sol gel/spin coat deposition, for fabrication of bulk and thick films, respectively. The material properties of these piezoelectric composites were quantified by means of dielectric constant, dielectric loss, piezoelectric strain coefficient, polarization ratio and sample geometry. It was found that corona polarization was more effective for both bulk and thick film processes than contact polarization due to the ability of the former method to align dipoles despite sample defects and filler agglomerations. In addition, the polarization temperature produced higher normalized changes in samples. Though higher electric field voltages could be achieved with thicker samples, film samples responded the most to coupled increases in temperature and electrical voltage than bulk samples. This study elucidates how polarization parameters: contact versus corona, temperature and electrical voltage field influence the piezoelectric and dielectric properties of samples as a function of their shape factor, i.e., bulk versus thick film. In addition, this work indicates that corona polarization is effective for bulk materials, where it was originally believed to have negligible benefits on samples of this scale in comparison to contact polarization techniques.
This work is an initial step towards wholistic analysis of corona processing of thin and bulk materials of the same composition. Though it can be seen that thinner samples achieve higher changes in polarization due to the processing temperature and voltage, limitations associated with bulk sample thicknesses need to be studied further. In addition, a sensitivity analysis of influences of each parameter is needed to better understand, which phenomenon indicate higher degrees of polarization than others.

Author Contributions

Conceptualization, S.B. and K.A.C.-C.; methodology, S.B. and K.A.C.-C.; formal analysis, S.B. and K.A.C.-C.; investigation, S.B.; resources, K.A.C.-C.; data curation, S.B.; writing—original draft preparation, S.B.; writing—review and editing, K.A.C.-C.; supervision, K.A.C.-C.; project administration, K.A.C.-C.; funding acquisition, K.A.C.-C. All authors have read and agreed to the published version of the manuscript.

Funding

This research was funded by National Science Foundation, grant number #1659818.

Conflicts of Interest

The authors declare no conflict of interest.

References

  1. Haertling, G.H. Ferroelectric Ceramics: History and Technology. J. Am. Ceram. Soc. 1999, 82, 797–818. [Google Scholar] [CrossRef]
  2. Zhu, Z.W.; To, S.; Li, Y.M.; Zhu, W.L.; Bian, L.X. External force estimation of a piezo-actuated compliant mechanism based on a fractional order hysteresis model. Mech. Syst. Signal Process. 2018, 110, 296–306. [Google Scholar] [CrossRef]
  3. Banerjee, S.; Cook-Chennault, K.A. Influence of Al Particle Size and Lead Zirconate Titanate (PZT) Volume Fraction on the Dielectric Properties of PZT-Epoxy-Aluminum Composites. J. Eng. Mater. Technol. 2011, 133. [Google Scholar] [CrossRef]
  4. Lucas, G.B.; de Castro, B.A.; Rocha, M.A.; Andreoli, A.L. Three-phase induction motor loading estimation based on Wavelet Transform and low-cost piezoelectric sensors. Measurement 2020, 164. [Google Scholar] [CrossRef]
  5. Kubba, A.E.; Jiang, K. Efficiency Enhancement of a Cantilever-Based Vibration Energy Harvester. Sensors 2014, 14, 188–211. [Google Scholar] [CrossRef] [Green Version]
  6. Lethiecq, M.; Levassort, F.; Certon, D.; Tran-Huu-Hue, L. Piezoelectric Transducer Design for Medical Diagnosis and NDE. In Piezoelectric and Acoustic Materials for Transducer Applications; Safari, A., Akdoğan, E.K., Eds.; Springer: Berlin/Heidelberg, Germany, 2008; pp. 191–215. [Google Scholar] [CrossRef]
  7. Buncic, N.; Kabasi, A.; Cakaric, T.; Bilusic, A. Prototyping of a High Frequency Phased Array Ultrasound Transducer on a Piezoelectric Thick Film. Inf. Midem J. Microelectron. Electron. Compon. Mater. 2019, 49, 3–9. [Google Scholar] [CrossRef] [Green Version]
  8. Li, M.; Yuan, J.; Guan, D.; Chen, W. Application of piezoelectric fiber composite actuator to aircraft wing for aerodynamic performance improvement. Sci. China Technol. Sci. 2011, 54, 395–402. [Google Scholar] [CrossRef]
  9. Dong, T.; Kim, N.H. Cost-Effectiveness of Structural Health Monitoring in Fuselage Maintenance of the Civil Aviation Industry. Aerospace 2018, 5, 87. [Google Scholar] [CrossRef] [Green Version]
  10. Elghandour, E.I. Experimental study of cantilevered composite beam with different stacking sequences. In 2001: A Materials and Processes Odyssey, Books 1 and 2; Repecka, L., Saremi, F.F., Eds.; Nasampe.org: Long Beach, CA, USA, 2001; Volume 46, pp. 740–751. [Google Scholar]
  11. Saravanos, D.A. Passively damped laminated piezoelectric shell structures with integrated electric networks. AIAA J. 2000, 38, 1260–1268. [Google Scholar] [CrossRef] [Green Version]
  12. Chalasani, S.; Conrad, J.M. A survey of energy harvesting sources for embedded systems. In Proceedings of the Southeastcon, Huntsville, AL, USA, 3–6 April 2008; IEEE: Piscataway, NJ, USA, 2008; pp. 442–447. [Google Scholar]
  13. Guillon, O.; Thiebaud, F.; Perreux, D. Tensile fracture of soft and hard PZT. Int. J. Fract. 2002, 117, 235–246. [Google Scholar] [CrossRef]
  14. Banerjee, S.; Du, W.; Wang, L.; Cook-Chennault, K.A. Fabrication of dome-shaped PZT-epoxy actuator using modified solvent and spin coating technique. J. Electroceram. 2013, 31, 148–158. [Google Scholar] [CrossRef]
  15. Pascariu, V.; Padurariu, L.; Avadanei, O.; Mitoseriu, L. Dielectric properties of PZT–epoxy composite thick films. J. Alloy. Compd. 2013, 574, 591–599. [Google Scholar] [CrossRef]
  16. Arlt, K.; Wegener, M. Piezoelectric PZT/PVDF-copolymer 0-3 composites: Aspects on film preparation and electrical poling. Dielectr. Electr. Insul. IEEE Trans. 2010, 17, 1178–1184. [Google Scholar] [CrossRef]
  17. Burianova, L.; Hana, P.; Panos, S.; Kulek, J.; Tyagur, Y.I. Piezoelectric, dielectric and pyroelectric properties of 0-3 ceramic-polymer composites. Ferroelectrics 2000, 241, 59–66. [Google Scholar] [CrossRef]
  18. Chamankar, N.; Khajavi, R.; Yousefi, A.A.; Rashidi, A.; Golestanifard, F. A flexible piezoelectric pressure sensor based on PVDF nanocomposite fibers doped with PZT particles for energy harvesting applications. Ceram. Int. 2020, 46, 19669–19681. [Google Scholar] [CrossRef]
  19. Pessia, Z.R.; Cunningham, C.A.; Krech, E.D.; Friis, E.A. Power amplification via compliant layer interdigitation and dielectrophoretic structuring of PZT particle composites. Smart Mater. Struct. 2020, 29. [Google Scholar] [CrossRef]
  20. Choi, H.-W.; Young-Woo, H.; Lee, J.-H.; Kim, J.-J.; Lee, H.-Y.; Park, E.-T.; Chung, Y.-K. Effects of BaTiO3 on dielectric behavior of BaTiO3-Ni-polymethyl methacrylate composites. Appl. Phys. Lett. 2006, 89, 132910–132913. [Google Scholar] [CrossRef]
  21. Dang, Z.M.; Fan, L.Z.; Shen, Y.; Nan, C.W. Dielectric behavior of novel three-phase MWNTs/BaTiO3/PVDF composites. Mater. Sci. Eng. B 2003, 103, 140–144. [Google Scholar] [CrossRef]
  22. Dang, Z.M.; Shen, Y.; Nan, C.W. Dielectric behavior of three-phase percolative Ni--BaTiO[sub 3]/polyvinylidene fluoride composites. Appl. Phys. Lett. 2002, 81, 4814–4816. [Google Scholar] [CrossRef]
  23. Dang, Z.-M.; Yao, S.-H.; Yuan, J.-K.; Bai, J. Tailored Dielectric Properties based on Microstructure Change in BaTiO3-Carbon Nanotube/Polyvinylidene Fluoride Three-Phase Nanocomposites. J. Phys. Chem. C 2010, 114, 13204–13209. [Google Scholar] [CrossRef]
  24. Dietze, M.; Es-Souni, M. Structural and functional properties of screen-printed PZT–PVDF-TrFE composites. Sens. Actuators A Phys. 2008, 143, 329–334. [Google Scholar] [CrossRef]
  25. Banerjee, S.; Kappera, R.; Chhowalla, M.; Cook-Chennault, K.A. Multi Walled Carbon Nanotube based Flexible Multi-morph Composite Thick Films with Graphene Electrodes. Energy Environ. Focus 2013, in press. [Google Scholar] [CrossRef]
  26. Newnham, R.E.; Skinner, D.P.; Cross, L.E. Connectivity and piezoelectric-pyroelectric composites. Mater. Res. Bull. 1978, 13, 525–536. [Google Scholar] [CrossRef]
  27. Pilgrim, S.M.; Newnham, R.E. 3:0: A new composite connectivity. Mater. Res. Bull. 1986, 21, 1447–1454. [Google Scholar] [CrossRef]
  28. Kuo, D.-H.; Chang, C.-C.; Su, T.-Y.; Wang, W.-K.; Lin, B.-Y. Dielectric behaviours of multi-doped BaTiO3/epoxy composites. J. Eur. Ceram. Soc. 2001, 21, 1171–1177. [Google Scholar] [CrossRef]
  29. Cook-Chennault, K.A.; Thambi, N.; Bitetto, M.A.; Hameyie, E.B. Piezoelectric Energy Harvesting: A Green and Clean Alternative for Sustained Power Production. Bull. Sci. Technol. Soc. 2008, 28, 496–509. [Google Scholar] [CrossRef]
  30. Cook-Chennault, K.A.; Thambi, N.; Sastry, A.M. Powering MEMS portable devices—A review of non-regenerative and regenerative power supply systems with special emphasis on piezoelectric energy harvesting systems. Smart Mater. Struct. 2008, 17, 043001. [Google Scholar] [CrossRef] [Green Version]
  31. Dan, Y.; Lu, Y.; Kybert, N.J.; Luo, Z.; Johnson, A.T.C. Intrinsic Response of Graphene Vapor Sensors. Nano Lett. 2009, 9, 1472–1475. [Google Scholar] [CrossRef] [Green Version]
  32. Blanas, P.; Das-Gupta, K. Composite Piezoelectric Materials for Health Monitoring of Composite Structures. In Proceedings of the MRS Proceedings; Materials Research Society: Warrendale, PA, USA, 2000. [Google Scholar]
  33. Doyle, W.T. Particle clustering and dielectric Enhancement in Percolating metal-insulator composites. J. Appl. Phys. 1995, 78, 6165–6169. [Google Scholar] [CrossRef]
  34. Doyle, W.T.; Jacobs, I.S. The influence of particle-shape on dielectric enhancement in metal-insulator composites. J. Appl. Phys. 1992, 71, 3926–3936. [Google Scholar] [CrossRef]
  35. Gerasimov, G.N.; Gromov, V.F.; Trakhtenberg, L.I. Physicochemical and Electrophysical Properties of Metal/Semiconductor Containing Nanostructured Composites. Russ. J. Phys. Chem. A 2018, 92, 1087–1098. [Google Scholar] [CrossRef]
  36. Kazak, N.S.; Agabekov, V.E.; Kurilkina, S.N.; Belyi, V.N. Formation and Properties of New Types of Metal-Dielectric Nanostructures for Creating Optical Metamaterials. Semiconductors 2018, 52, 2099–2102. [Google Scholar] [CrossRef]
  37. Wang, J.; Chang, A.S.; Sherfield, S.N.; Golobic, A.M.; Hunter, S.L.; Duoss, E.B.; Matthews, M.J. Electrical Properties of Copper-loaded Polymer Composites. In Nondestructive Characterization and Monitoring of Advanced Materials, Aerospace, Civil Infrastructure, and Transportation XIII, Denver, CO, USA, 1 April 2019; Yu, A.L., Wu, T.Y., Shull, H.F., Eds.; SPIE: Bellingham, WA, USA, 2019; Volume 10971. [Google Scholar]
  38. Bai, Y.; Cheng, Z.Y.; Bharti, V.; Xu, H.S.; Zhang, Q.M. High-dielectric-constant ceramic-powder polymer composites. Appl. Phys. Lett. 2000, 76, 3804–3806. [Google Scholar] [CrossRef]
  39. Li, Z.; Zhang, D.; Wu, K. Cement-Based 0-3 Piezoelectric Composites. J. Am. Ceram. Soc. 2002, 85, 305–313. [Google Scholar] [CrossRef]
  40. Ma, M.; Wang, X. Preparation, microstructure and properties of epoxy-based composites containing carbon nanotubes and PMN-PZT piezoceramics as rigid piezo-damping materials. Mater. Chem. Phys. 2009, 116, 191–197. [Google Scholar] [CrossRef]
  41. Lu, X.; Zou, X.W.; Shen, J.L.; Zhang, L.; Jin, L.; Cheng, Z.Y. High energy density with ultrahigh discharging efficiency obtained in ceramic-polymer nanocomposites using a non-ferroelectric polar polymer as matrix. Nano Energy 2020, 70. [Google Scholar] [CrossRef]
  42. Sundar, U.; Lao, Z.C.; Cook-Chennault, K. Enhanced Dielectric Permittivity of Optimized Surface Modified of Barium Titanate Nanocomposites. Polymers 2020, 12, 827. [Google Scholar] [CrossRef] [Green Version]
  43. Chen, C.; Zhang, R.; Wang, Z.; Cao, W. Electromechanical coupling coefficient k31eff for arbitrary aspect ratio resonators made of [001] and [011] poled (1−x)Pb(Mg1/3Nb2/3)O3–xPbTiO3 single crystals. J. Appl. Phys. 2009, 105, 064104. [Google Scholar] [CrossRef] [Green Version]
  44. Stein, S.C.; Liang, C.; Rogers, C.A. Power consumption of piezoelectric actuators driving a simply supported beam considering fluid coupling. J. Acoust. Soc. Am. 1994, 96, 1598–1604. [Google Scholar] [CrossRef]
  45. Zhao, P.; Li, J. Investigation of orientation effects on the electro-mechanical coupling behavior of 1–3 piezoelectric composites under compression. Smart Mater. Struct. 2009, 18, 104011. [Google Scholar] [CrossRef]
  46. Rjafallah, A.; Hajjaji, A.; Belhora, F.; El Ballouti, A.; Touhtouh, S.; Guyomar, D.; Boughaleb, Y. PZT ceramic particles/polyurethane composites formalism for mechanical energy harvesting. Eur. Phys. J. Appl. Phys. 2020, 89. [Google Scholar] [CrossRef]
  47. Topolov, V.Y.; Isaeva, A.N.; Bisegna, P. Novel lead-free composites with two porosity levels: Large piezoelectric anisotropy and high sensitivity. J. Phys. D Appl. Phys. 2020, 53. [Google Scholar] [CrossRef]
  48. Gong, H.; Zhang, Y.; Quan, J.; Che, S. Preparation and properties of cement based piezoelectric composites modified by CNTs. Curr. Appl. Phys. 2011, 11, 653–656. [Google Scholar] [CrossRef]
  49. Mohammadabadi, A.; Dugnani, R. Design and Evaluation of a Novel Low Acoustic Impedance-Based PZT Transducer for Detecting the Near-Surface Defects. Int. J. Eng. Technol. Innov. 2019, 9, 196–211. [Google Scholar]
  50. Xu, L.F.; Yu, T.C.; Feng, X.; Yang, C.P.; Chen, Y.; Chen, W.; Zhou, J. Dimension dependence of thickness resonance behavior of piezoelectric fiber composites. Mater. Chem. Phys. 2018, 218, 34–38. [Google Scholar] [CrossRef]
  51. Seema, A.; Dayas, K.R.; Varghese, J.M. PVDF-PZT-5H composites prepared by hot press and tape casting techniques. J. Appl. Polym. Sci. 2007, 106, 146–151. [Google Scholar] [CrossRef]
  52. Senthilkumar, R.; Sridevi, K.; Venkatesan, J.; Annamalai, V.; Vijaya, M.S. Investigations on Ferroelectric PZT-PVDF Composites of 0–3 Connectivity. Ferroelectrics 2005, 325, 121–130. [Google Scholar] [CrossRef]
  53. Serrano-Garcia, W.; Jayathilaka, W.; Chinnappan, A.; Tran, T.Q.; Baskar, C.; Thomas, S.W.; Ramakrishna, S. Nanocomposites for electronic applications that can be embedded for textiles and wearables. Sci. China-Technol. Sci. 2019, 62, 895–902. [Google Scholar] [CrossRef]
  54. Song, X.; He, L.; Yang, W.H.; Wang, Z.; Chen, Z.Y.; Guo, J.; Wang, H.; Chen, L. Additive Manufacturing of Bi-Continuous Piezocomposites With Triply Periodic Phase Interfaces for Combined Flexibility and Piezoelectricity. J. Manuf. Sci. Eng. Trans. ASME 2019, 141. [Google Scholar] [CrossRef]
  55. Satish, B.; Sridevi, K.; Vijaya, M.S. Study of piezoelectric and dielectric properties of ferroelectric PZT-polymer composites prepared by hot-press technique. J. Phys. D Appl. Phys. 2002, 35, 2048. [Google Scholar] [CrossRef]
  56. Song, Y.; Zhao, Z.; Yu, W.; Li, B.; Chen, X. Morphological structures of poly(vinylidene fluoride)/montmorillonite nanocomposites. Sci. China Ser. B Chem. 2007, 50, 790–796. [Google Scholar] [CrossRef]
  57. Hou, S.; Yang, X.Y.; Fei, C.L.; Sun, X.H.; Chen, Q.; Lin, P.F.; Li, D.; Yang, Y.T.; Zhou, Q.F. Fabrication of PMN-PT/Epoxy 2-2 Composite Ultrasonic Transducers and Analysis Based on Equivalent Circuit Model. J. Electron. Mater. 2018, 47, 6842–6847. [Google Scholar] [CrossRef]
  58. Ono, Y.; Kobayashi, M.; Levesque, D.; Song, L.; Sivagnanasundaram, M.; Jen, C.K. High frequency (>30 MHz) flexible broadband transducers. In 2007 IEEE Ultrasonics Symposium Proceedings; IEEE: Piscataway, NJ, USA, 2007; pp. 92–95. [Google Scholar] [CrossRef]
  59. Park, C.Y.; Sung, J.H.; Jeong, J.S. Design and fabrication of ultrasound linear array transducer based on polarization inversion technique. Sens. Actuators A Phys. 2018, 280, 484–494. [Google Scholar] [CrossRef]
  60. Lee, H.J.; Zhang, S.J. Design of Low-Loss 1-3 Piezoelectric Composites for High-Power Transducer Applications. IEEE Trans. Ultrason. Ferroelectr. Freq. Control 2012, 59, 1969–1975. [Google Scholar] [CrossRef] [PubMed]
  61. Uchino, K. Piezoelectric Composite Materials. In Advanced Piezoelectric Materials: Science and Technology, 2nd ed.; Uchino, K., Ed.; Woodhead Publishing: Cambridge, UK, 2017; pp. 353–382. [Google Scholar] [CrossRef]
  62. Li, Z.; Dong, B.; Zhang, D. Influence of polarization on properties of 0–3 cement-based PZT composites. Cem. Concr. Compos. 2005, 27, 27–32. [Google Scholar] [CrossRef]
  63. Thomas, M.; Folliard, K.; Drimalas, T.; Ramlochan, T. Diagnosing delayed ettringite formation in concrete structures. Cem. Concr. Res. 2008, 38, 841–847. [Google Scholar] [CrossRef]
  64. Yadav, K.; Smelser, C.W.; Jacob, S.; Blanchetiere, C.; Callender, C.L.; Albert, J. Simultaneous corona poling of multiple glass layers for enhanced effective second-order optical nonlinearities. Appl. Phys. Lett. 2011, 99, 031109. [Google Scholar] [CrossRef]
  65. Bao, W.S.; Meguid, S.A.; Zhu, Z.H.; Pan, Y.; Weng, G.J. A novel approach to predict the electrical conductivity of multifunctional nanocomposites. Mech. Mater. 2012, 46, 129–138. [Google Scholar] [CrossRef]
  66. Maiti, S.; Suin, S.; Shrivastava, N.K.; Khatua, B.B. Low percolation threshold in melt-blended PC/MWCNT nanocomposites in the presence of styrene acrylonitrile (SAN) copolymer: Preparation and characterizations. Synth. Met. 2013, 165, 40–50. [Google Scholar] [CrossRef]
  67. Nagarajan, V.; Ganpule, C.S.; Nagaraj, B.; Aggarwal, S.; Alpay, S.P.; Roytburd, A.L.; Williams, E.D.; Ramesh, R. Effect of mechanical constraint on the dielectric and piezoelectric behavior of epitaxial Pb(Mg1/3Nb2/3)O3(90%)–PbTiO3(10%) relaxor thin films. Appl. Phys. Lett. 1999, 75, 4183–4185. [Google Scholar] [CrossRef] [Green Version]
  68. Kok, S.L.; White, N.M.; Harris, N.R. Free-standing thick-film piezoelectric device. Electron. Lett. 2008, 44, 280–282. [Google Scholar] [CrossRef] [Green Version]
  69. Sencadas, V.; Lanceros-Mendez, S.; Filho, R.G.; Chinaglia, D.L.; Pouzada, A.S. Influence of the processing conditions and corona poling on the morphology of beta;-PVDF. In Proceedings of the 2005 12th International Symposium on Electrets, Salvador, Brazil, 11–14 September 2005; pp. 161–164. [Google Scholar]
  70. Charoonsuk, T.; Sriphan, S.; Nawanil, C.; Chanlek, N.; Vittayakorn, W.; Vittayakorn, N. Tetragonal BaTiO3 nanowires: A template-free salt-flux-assisted synthesis and its piezoelectric response based on mechanical energy harvesting. J. Mater. Chem. C 2019, 7, 8277–8286. [Google Scholar] [CrossRef]
  71. Li, W.Y.; Song, Z.Q.; Qian, J.; Tan, Z.Y.; Chu, H.Y.; Wu, X.Y.; Nie, W.; Ran, X.H. Enhancing conjugation degree and interfacial interactions to enhance dielectric properties of noncovalent functionalized graphene/poly (vinylidene fluoride) composites. Carbon 2019, 141, 728–738. [Google Scholar] [CrossRef]
  72. Yu, X.; Zhang, Y.; Jin, L.; Chen, J.Y.; Jiang, Z.H.; Zhang, Y.H. High-performance piezo-damping materials based on CNTs/BaTiO3/F-PAEK-b-PDMS under high temperature steam conditions. Appl. Surf. Sci. 2018, 452, 429–436. [Google Scholar] [CrossRef]
  73. Ounaies, Z.; Park, C.; Harrison, J.; Lillehei, P. Evidence of Piezoelectricity in SWNT-Polyimide and SWNT-PZT-Polyimide Composites. J. Thermoplast. Compos. Mater. 2008, 21, 393–409. [Google Scholar] [CrossRef]
  74. Baughman, R.H.; Zakhidov, A.A.; de Heer, W.A. Carbon Nanotubes—The Route Toward Applications. Science 2002, 297, 787–792. [Google Scholar] [CrossRef] [Green Version]
  75. Frank, S.; Poncharal, P.; Wang, Z.L.; Heer, W.A.D. Carbon Nanotube Quantum Resistors. Science 1998, 280, 1744–1746. [Google Scholar] [CrossRef] [PubMed] [Green Version]
  76. Liang, W.; Bockrath, M.; Bozovic, D.; Hafner, J.H.; Tinkham, M.; Park, H. Fabry—Perot interference in a nanotube electron waveguide. Nature 2001, 411, 665–669. [Google Scholar] [CrossRef]
  77. Gao, G.; Çagin, T.; Goddard, W.A., III. Energetics, structure, mechanical and vibrational properties of single-walled carbon nanotubes. Nanotechnology 1998, 9, 184. [Google Scholar] [CrossRef] [Green Version]
  78. Biercuk, M.J.; Llaguno, M.C.; Radosavljevic, M.; Hyun, J.K.; Johnson, A.T.; Fischer, J.E. Carbon nanotube composites for thermal management. Appl. Phys. Lett. 2002, 80, 2767–2769. [Google Scholar] [CrossRef]
  79. Chen, H.; Muthuraman, H.; Stokes, P.; Zou, J.; Liu, X.; Wang, J.; Huo, Q.; Khondaker, S.I.; Zhai, L. Dispersion of carbon nanotubes and polymer nanocomposite fabrication using trifluoroacetic acid as a co-solvent. Nanotechnology 2007, 18, 415606. [Google Scholar] [CrossRef]
  80. Schmidt, R.H.; Kinloch, I.A.; Burgess, A.N.; Windle, A.H. The Effect of Aggregation on the Electrical Conductivity of Spin-Coated Polymer/Carbon Nanotube Composite Films. Langmuir 2007, 23, 5707–5712. [Google Scholar] [CrossRef] [PubMed]
  81. Bao, W.S.; Meguid, S.A.; Zhu, Z.H.; Weng, G.J. Tunneling resistance and its effect on the electrical conductivity of CNT nanocomposites. J. Appl. Phys. 2012, 111, 093726. [Google Scholar] [CrossRef]
  82. Leon, V.; Parret, R.; Almairac, R.; Alvarez, L.; Babaa, M.R.; Doyle, B.P.; Ienny, P.; Parent, P.; Zahab, A.; Bantignies, J.L. Spectroscopic study of double-walled carbon nanotube functionalization for preparation of carbon nanotube/epoxy composites. Carbon 2012, 50, 4987–4994. [Google Scholar] [CrossRef] [Green Version]
  83. Yao, S.-H.; Dang, Z.-M.; Jiang, M.-J.; Bai, J. BaTiO3-carbon nanotube/polyvinylidene fluoride three-phase composites with high dielectric constant and low dielectric loss. Appl. Phys. Lett. 2008, 93, 182905. [Google Scholar] [CrossRef]
  84. Bauhofer, W.; Kovacs, J.Z. A review and analysis of electrical percolation in carbon nanotube polymer composites. Compos. Sci. Technol. 2009, 69, 1486–1498. [Google Scholar] [CrossRef]
  85. Lu, X.X.; Zhang, A.N.; Dubrunfaut, O.; He, D.L.; Pichon, L.; Bai, J.B. Numerical modeling and experimental characterization of the AC conductivity and dielectric properties of CNT/polymer nanocomposites. Compos. Sci. Technol. 2020, 194. [Google Scholar] [CrossRef]
  86. Berhan, L.; Sastry, A.M. Modeling percolation in high-aspect-ratio fiber systems. II. The effect of waviness on the percolation onset. Phys. Rev. E 2007, 75. [Google Scholar] [CrossRef] [Green Version]
  87. Berhan, L.; Sastry, A.M. Modeling percolation in high-aspect-ratio fiber systems. I. Soft-core versus hard-core models. Phys. Rev. E 2007, 75. [Google Scholar] [CrossRef] [Green Version]
  88. Tian, S.; Wang, X. Fabrication and performances of epoxy/multi-walled carbon nanotubes/piezoelectric ceramic composites as rigid piezo-damping materials. J. Mater. Sci. 2008, 43, 4979–4987. [Google Scholar] [CrossRef]
  89. Heimann, M.; Wirts-Ruetters, M.; Boehme, B.; Wolter, K.J. Investigations of carbon nanotubes epoxy composites for electronics packaging. In Proceedings of the 58th Electronic Components and Technology Conference, Lake Buena Vista, FL, USA, 27–30 May 2008; pp. 1731–1736. [Google Scholar]
  90. Sun, L.-H.; Ounaies, Z.; Gao, X.-L.; Whalen, C.A.; Yang, Z.-G. Preparation, characterization, and modeling of carbon nanofiber/epoxy nanocomposites. J. Nanomater. 2011, 2011, 1–8. [Google Scholar] [CrossRef] [Green Version]
  91. Hermant, M.C. Manipulating the Percolation Threshold of Carbon Nanotubes in Polymeric Composites. Ph.D. Thesis, Department of Chemical Engineering and Chemistry, Eindhoven University of Technology, Cambridge, MA, USA, 2009. [Google Scholar]
  92. Cob, J.; Oliva-Aviles, A.I.; Aviles, F.; Oliva, A.I. Influence of concentration, length and orientation of multiwall carbon nanotubes on the electromechanical response of polymer nanocomposites. Mater. Res. Express 2019, 6. [Google Scholar] [CrossRef]
  93. Li, T.T.; Zhao, G.Q.; Wang, G.L. Effect of Preparation Methods on Electrical and Electromagnetic Interference Shielding Properties of PMMA/MWCNT Nanocomposites. Polym. Compos. 2019, 40, E1786–E1800. [Google Scholar] [CrossRef]
  94. Hur, O.N.; Ha, J.H.; Park, S.H. Strain-Sensing Properties of Multi-Walled Carbon Nanotube/Polydimethylsiloxane Composites with Different Aspect Ratio and Filler Contents. Materials 2020, 13, 2431. [Google Scholar] [CrossRef] [PubMed]
  95. Cardoso, P.; Silva, J.; Paiva, M.C.; van Hattum, F.; Lanceros-Mendez, S. Comparative analyses of the electrical properties and dispersion level of VGCNF and MWCNT: Epoxy composites. J. Polym. Sci. Part B Polym. Phys. 2012, 50, 1253–1261. [Google Scholar] [CrossRef]
  96. Wang, L.; Wang, H.; Li, B.; Guo, Z.; Luo, J.C.; Huang, X.W.; Gao, J.F. Highly electrically conductive polymer composite with a novel fiber-based segregated structure. J. Mater. Sci. 2020, 55, 11727–11738. [Google Scholar] [CrossRef]
  97. Zhang, Y.L.; Zang, C.G.; Jiao, Q.J. Electrical, thermal, and mechanical properties of silicone foam composites filled with carbon-based nanofillers. J. Appl. Polym. Sci. 2020, 137. [Google Scholar] [CrossRef]
  98. Arsecularatne, J.A.; Zhang, L.C. Carbon Nanotube Reinforced Ceramic Composites and their Performance. Recent Pat. Nanotechnol. 2007, 1, 176–185. [Google Scholar] [CrossRef]
  99. Zeng, X.; Xu, X.; Shenai, P.M.; Kovalev, E.; Baudot, C.; Mathews, N.; Zhao, Y. Characteristics of the Electrical Percolation in Carbon Nanotubes/Polymer Nanocomposites. J. Phys. Chem. C 2011, 115, 21685–21690. [Google Scholar] [CrossRef]
  100. McKenna, E.M.; Lin, A.S.; Mickelson, A.R.; Dinu, R.; Jin, D. Comparison of r33 values for AJ404 films prepared with parallel plate and corona poling. J. Opt. Soc. Am. B 2007, 24, 2888–2892. [Google Scholar] [CrossRef]
  101. Wegener, M.; Arlt, K. PZT/P(VDF-HFP) 0–3 composites as solvent-cast thin films: Preparation, structure and piezoelectric properties. J. Phys. D Appl. Phys. 2008, 41, 165409. [Google Scholar] [CrossRef]
  102. Park, H.; Brown, P.R.; Bulović, V.; Kong, J. Graphene As Transparent Conducting Electrodes in Organic Photovoltaics: Studies in Graphene Morphology, Hole Transporting Layers, and Counter Electrodes. Nano Lett. 2011, 12, 133–140. [Google Scholar] [CrossRef] [PubMed]
  103. Shen, Y.; Guan, Y.; Hu, Y.; Lei, Y.; Song, Y.; Lin, Y.; Nan, C.-W. Dielectric behavior of graphene/BaTiO3/polyvinylidene fluoride nanocomposite under high electric field. Appl. Phys. Lett. 2013, 103, 072906. [Google Scholar] [CrossRef]
  104. Zepu, W.; Nelson, J.K.; Jianjun, M.; Linhardt, R.J.; Schadler, L.S.; Hillborg, H.; Su, Z. Effect of high aspect ratio filler on dielectric properties of polymer composites: A study on barium titanate fibers and graphene platelets. Dielectr. Electr. Insul. IEEE Trans. 2012, 19, 960–967. [Google Scholar] [CrossRef] [Green Version]
  105. Qi, L.; Lee, B.I.; Samuels, W.D.; Exarhos, G.J.; Parler, S.G. Three-phase percolative silver–BaTiO3–epoxy nanocomposites with high dielectric constants. J. Appl. Polym. Sci. 2006, 102, 967–971. [Google Scholar] [CrossRef]
  106. Kudimova, A.; Nasedkin, A. Analysis of porosity influence on the effective moduli of ceramic matrix PZT composite using the simplified finite element model. J. Adv. Dielectr. 2019, 9. [Google Scholar] [CrossRef]
  107. Haghgoo, M.; Ansari, R.; Hassanzadeh-Aghdam, M.K.; Darvizeh, A. Fully coupled thermo-magneto-electro-elastic properties of unidirectional smart composites with a piezoelectric interphase. Proc. Inst. Mech. Eng. Part C J. Mech. Eng. Sci. 2019, 233, 2813–2829. [Google Scholar] [CrossRef]
  108. Kim, H.J.; Kim, Y.J. High performance flexible piezoelectric pressure sensor based on CNT-sdoped 0-3 ceramic-epoxy nanocomposites. Mater. Des. 2018, 151, 133–140. [Google Scholar] [CrossRef]
  109. Banerjee, S.; Cook-Chennault, K.A. An investigation into the influence of electrically conductive particle size on electromechanical coupling and effective dielectric strain coefficients in three phase composite piezoelectric polymers. Compos. Part A Appl. Sci. Manuf. 2012, 43, 1612–1619. [Google Scholar] [CrossRef]
  110. Sappati, K.K.; Bhadra, S. Flexible Piezoelectric 0-3 PZT-PDMS Thin Film for Tactile Sensing. IEEE Sens. J. 2020, 20, 4610–4617. [Google Scholar] [CrossRef]
  111. Esslinger, S.; Geller, S.; Hohlfeld, K.; Gebhardt, S.; Michaelis, A.; Gude, M.; Schonecker, A.; Neumeister, P. Novel poling method for piezoelectric 0-3 composites and transfer to series production. Sens. Actuators A Phys. 2018, 270, 231–239. [Google Scholar] [CrossRef]
  112. Zhang, H.M.; He, X.D.; Yang, F.; Hao, L.F.; Xu, Z.H.; Wang, R.G. Piezoelectric Modal Damping Performance of 0-3 piezoelectric Composite With Conducting Phase: Numerical Analysis and Experiments. Polym. Polym. Compos. 2014, 22, 261–268. [Google Scholar] [CrossRef]
  113. Banerjee, S.; Du, W.; Sundar, U.; Cook-Chennault, K.A. Piezoelectric and Dielectric Characterization of MWCNT-Based Nanocomposite Flexible Films. J. Nanomater. 2018, 2018. [Google Scholar] [CrossRef]
  114. Banerjee, S.; Cook-Chennault, K.A.; Du, W.; Sundar, U.; Halim, H.; Tang, A. Piezoelectric and dielectric characterization of corona and contact poled PZT-epoxy-MWCNT bulk composites. Smart Mater. Struct. 2016, 25. [Google Scholar] [CrossRef]
  115. Yamada, T.; Ueda, T.; Kitayama, T. PIEZOELECTRICITY OF A HIGH-CONTENT LEAD ZIRCONATE TITANATE POLYMER COMPOSITE. J. Appl. Phys. 1982, 53, 4328–4332. [Google Scholar] [CrossRef]
  116. Nan, C.W.; Weng, G.J. Influence of polarization orientation on the effective properties of piezoelectric composites. J. Appl. Phys. 2000, 88, 416–423. [Google Scholar] [CrossRef]
Figure 1. Variation in the piezoelectric strain coefficient, d33 for bulk PZT-epoxy-multi-walled carbon nanotube (MWCNT) composites as a function of polarization voltage from 0.7–2.7 kV/mm; for (A) corona poling and (B) contact poling methods. Both the figures show an increase in d33 with an increase in the poling voltage.
Jcs 04 00141 g001
Figure 2. Variation in the dielectric constant as a function of polarization voltage and volume fraction of MWCNTs for corona (A) and (B) contact polarization techniques applied to bulk samples.
Jcs 04 00141 g002
Figure 3. Variation in the dielectric loss, tan δ, as a function of polarization voltage and volume fraction of MWCNT for (A) corona and (B) contact polarized samples.
Jcs 04 00141 g003
Figure 4. Variation in piezoelectric strain coefficient, d33 for bulk disks as a function of temperature (45–75 °C) for (A) corona and (B) contact polarization techniques.
Jcs 04 00141 g004
Figure 5. Variation in the dielectric constant as a function of temperature, volume fraction of MWCNTs, for (A) corona and (B) contact polarization techniques for bulk/disk samples.
Jcs 04 00141 g005
Figure 6. Dielectric loss as a function of polarization temperature and MWCNT volume fraction for thick films (A) corona and (B) contact poled.
Jcs 04 00141 g006
Figure 7. Piezoelectric strain coefficient, d33, for thick films as a function of polarization voltage and volume fraction of MWCNTs for (A) corona and (B) contact polarized samples.
Jcs 04 00141 g007
Figure 8. Dielectric constant of thick films as a function of polarization voltage and volume fraction of MWCNTs for (A) corona and (B) contact polarization conditions.
Jcs 04 00141 g008
Figure 9. Dielectric loss, tan δ, of thick films as a function of polarization voltage and volume fraction of MWCNTs for (A) corona and (B) contact polarization conditions.
Jcs 04 00141 g009
Figure 10. Piezoelectric strain coefficient of thick films as a function of polarization temperature and volume fraction of MWCNTs for (A) corona and (B) contact polarization conditions.
Jcs 04 00141 g010
Figure 11. Dielectric constant of thick films as a function of polarization temperature and volume fraction of MWCNTs for (A) corona and (B) contact polarization conditions.
Jcs 04 00141 g011
Figure 12. Dielectric loss, tan δ, of thick films as a function of polarization temperature and volume fraction of MWCNTs for (A) corona and (B) contact polarization conditions.
Jcs 04 00141 g012
Figure 13. Cross-sectional SEM micrograph of a PZT-epoxy-MWCNT thick film with MWCNT volume fractions of (A) 0.04 (4%) and (B) 0.06 (6%) showing the thick film of thickness ~150 μm spin coated over a flexible stainless substrate of thickness 20 μm. SEM images (C,D) show the fractured surface of the three phase composite with MWCNT volume fractions of 0.04 (4%) and 0.06 (6%). Both images illustrate the distribution of the PZT clusters and MWCNT clusters in the epoxy matrix, where larger spherical elements of the image are PZT particles.
Jcs 04 00141 g013
Figure 14. The SEM micrograph of the surface of the flexible composite thick film, shows the distribution of PZT particles and MWCNTs in the epoxy matrix with a MWCNT volume fraction of 0.06 (6%). The EDS layered image also shows the dispersion of the different elements present in the composite. The peaks for the selective elemental analysis are shown in the EDS spectrum.
Jcs 04 00141 g014
Figure 15. Interrelationship between the polarization ratio for PZT particles as a function of voltage and volume fraction of MWCNTs.
Jcs 04 00141 g015
Table 1. Variation of percolation threshold with the variation in aspect ratio of the electrically conductive inclusion (CNTs).
Electrically Conductive FillerComposite/Fabrication MethodPercolation
(%, Vol. Fraction)
MWCNT (aspect ratio = 3333–6250) [93]MWCNT/polymethyl methacrylate solution melt blending with compression molding1.15%
MWCNT/polymethyl methacrylate solution blending with melt compounding0.25%
MWCNT/polymethyl methacrylate solution blending with compression molding0.55%
MWCNT (aspect ratio = ~86.7) [92]Fragmented MWCNTs/PMMA/ solution cast0.11%
MWCNT (aspect ratio = 250–1500) [96]Electro-spun polystyrene fibers decorated with MWCNTs, followed by hot press 0.084%
MWCNT (aspect ratio = 2400) [94]MWCNT/PDMS three-roll milling method0.027%
MWCNT (aspect ratio = 900) [94]MWCNT/PDMS three-roll milling method0.29%
MWCNT (aspect ratio = 2000) [97]Functional nanocarbon-based fillers made of MWCNTs and graphene oxide within a silicone foam10%
MWCNT (aspect ratio = 157.9) [95]MWCNTs/two-part epoxy (Epikote Resin 862 and Ethacure 100 Curative)6.9%
MWCNT (aspect ratio = 400) [83]MWCNT-PVDF/sol-gel and hot molding1.0%
MWCNT(aspect ratio ~ 100) [91] MWCNT-PMMMA/compression molding2.4%
SWCNT (aspect ratio ~ 100) [91]SWCNT-PMMA/compression molding3.4%
SWCNT (aspect ratio ~ 1000) [73]SWCNT-PZT-PMMA/solution casting0.8%
CNT (aspect ratio ~ 100) [98]CNT-alumina/colloidal processing1.2%
MWCNT (aspect ratio ~ 99) [88]MWCNT-epoxy/sol-gel sintering1–1.5%
Double Walled CNTs (aspect ratio >1000) [82]CNT-epoxy/vacuum sintering0.25%
MWCNT (aspect ratio >100) [99]MWCNT-epoxy/sol-gel sintering3.2%
CNT (aspect ratio = 200–1000) [89] CNT-epoxy/sol-gel sintering0.5–1.5%
Table 2. Overview of the piezoelectric, dielectric, and physical properties of lead zirconate titanate (PZT) and epoxy.
MaterialDielectric Constant
(ε’)
Piezoelectric Strain
d33/d31 (pC/N)
Dielectric Loss
(tan δ)
Young’s Modulus
(1010 N/m2)
Density
(kg/m3)
PZT 1850 @ 110 Hz (measured)400/175≤2.506.47500
Epoxy 2.9 @ 110 Hz (measured)N/A~10.15–0.20 1160 (wet state)

