
Effect of Ce Content on Properties of Al-Ce-Based Composites by Powder-in-Tube Method

 ,
,  , ,
, ,
Abstract
:1. Introduction
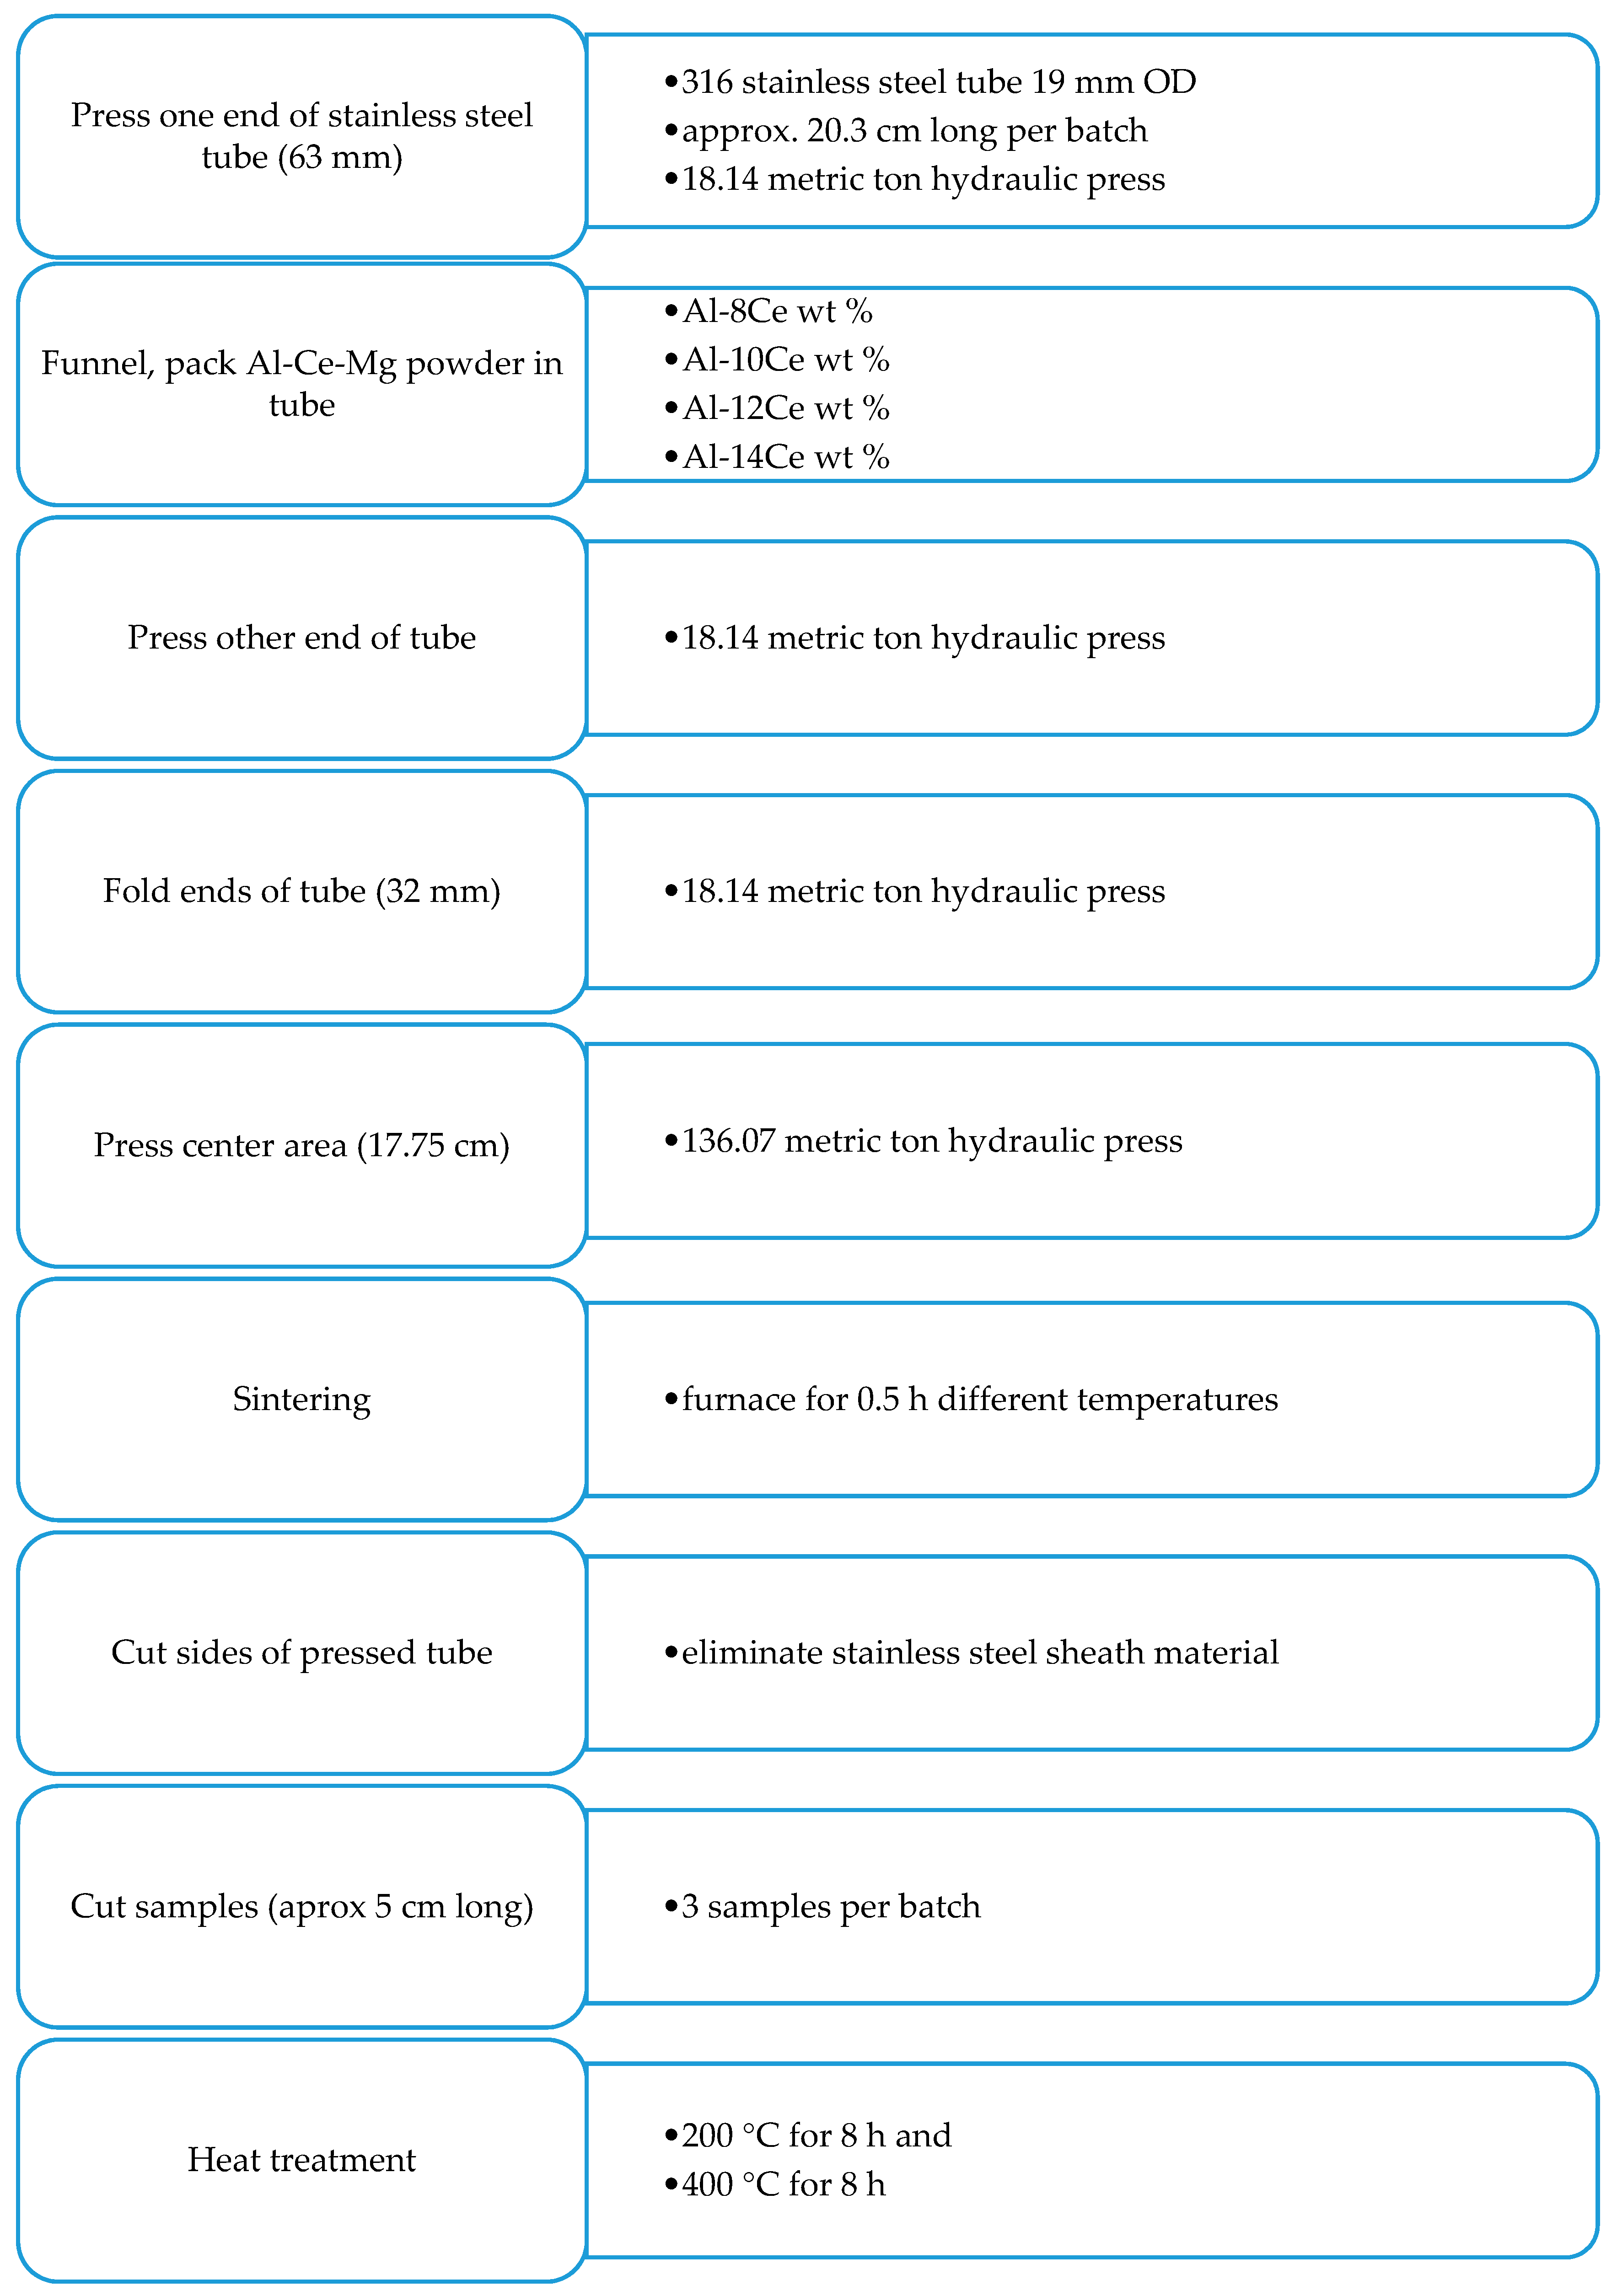
2. Materials and Methods
3. Results and Discussion
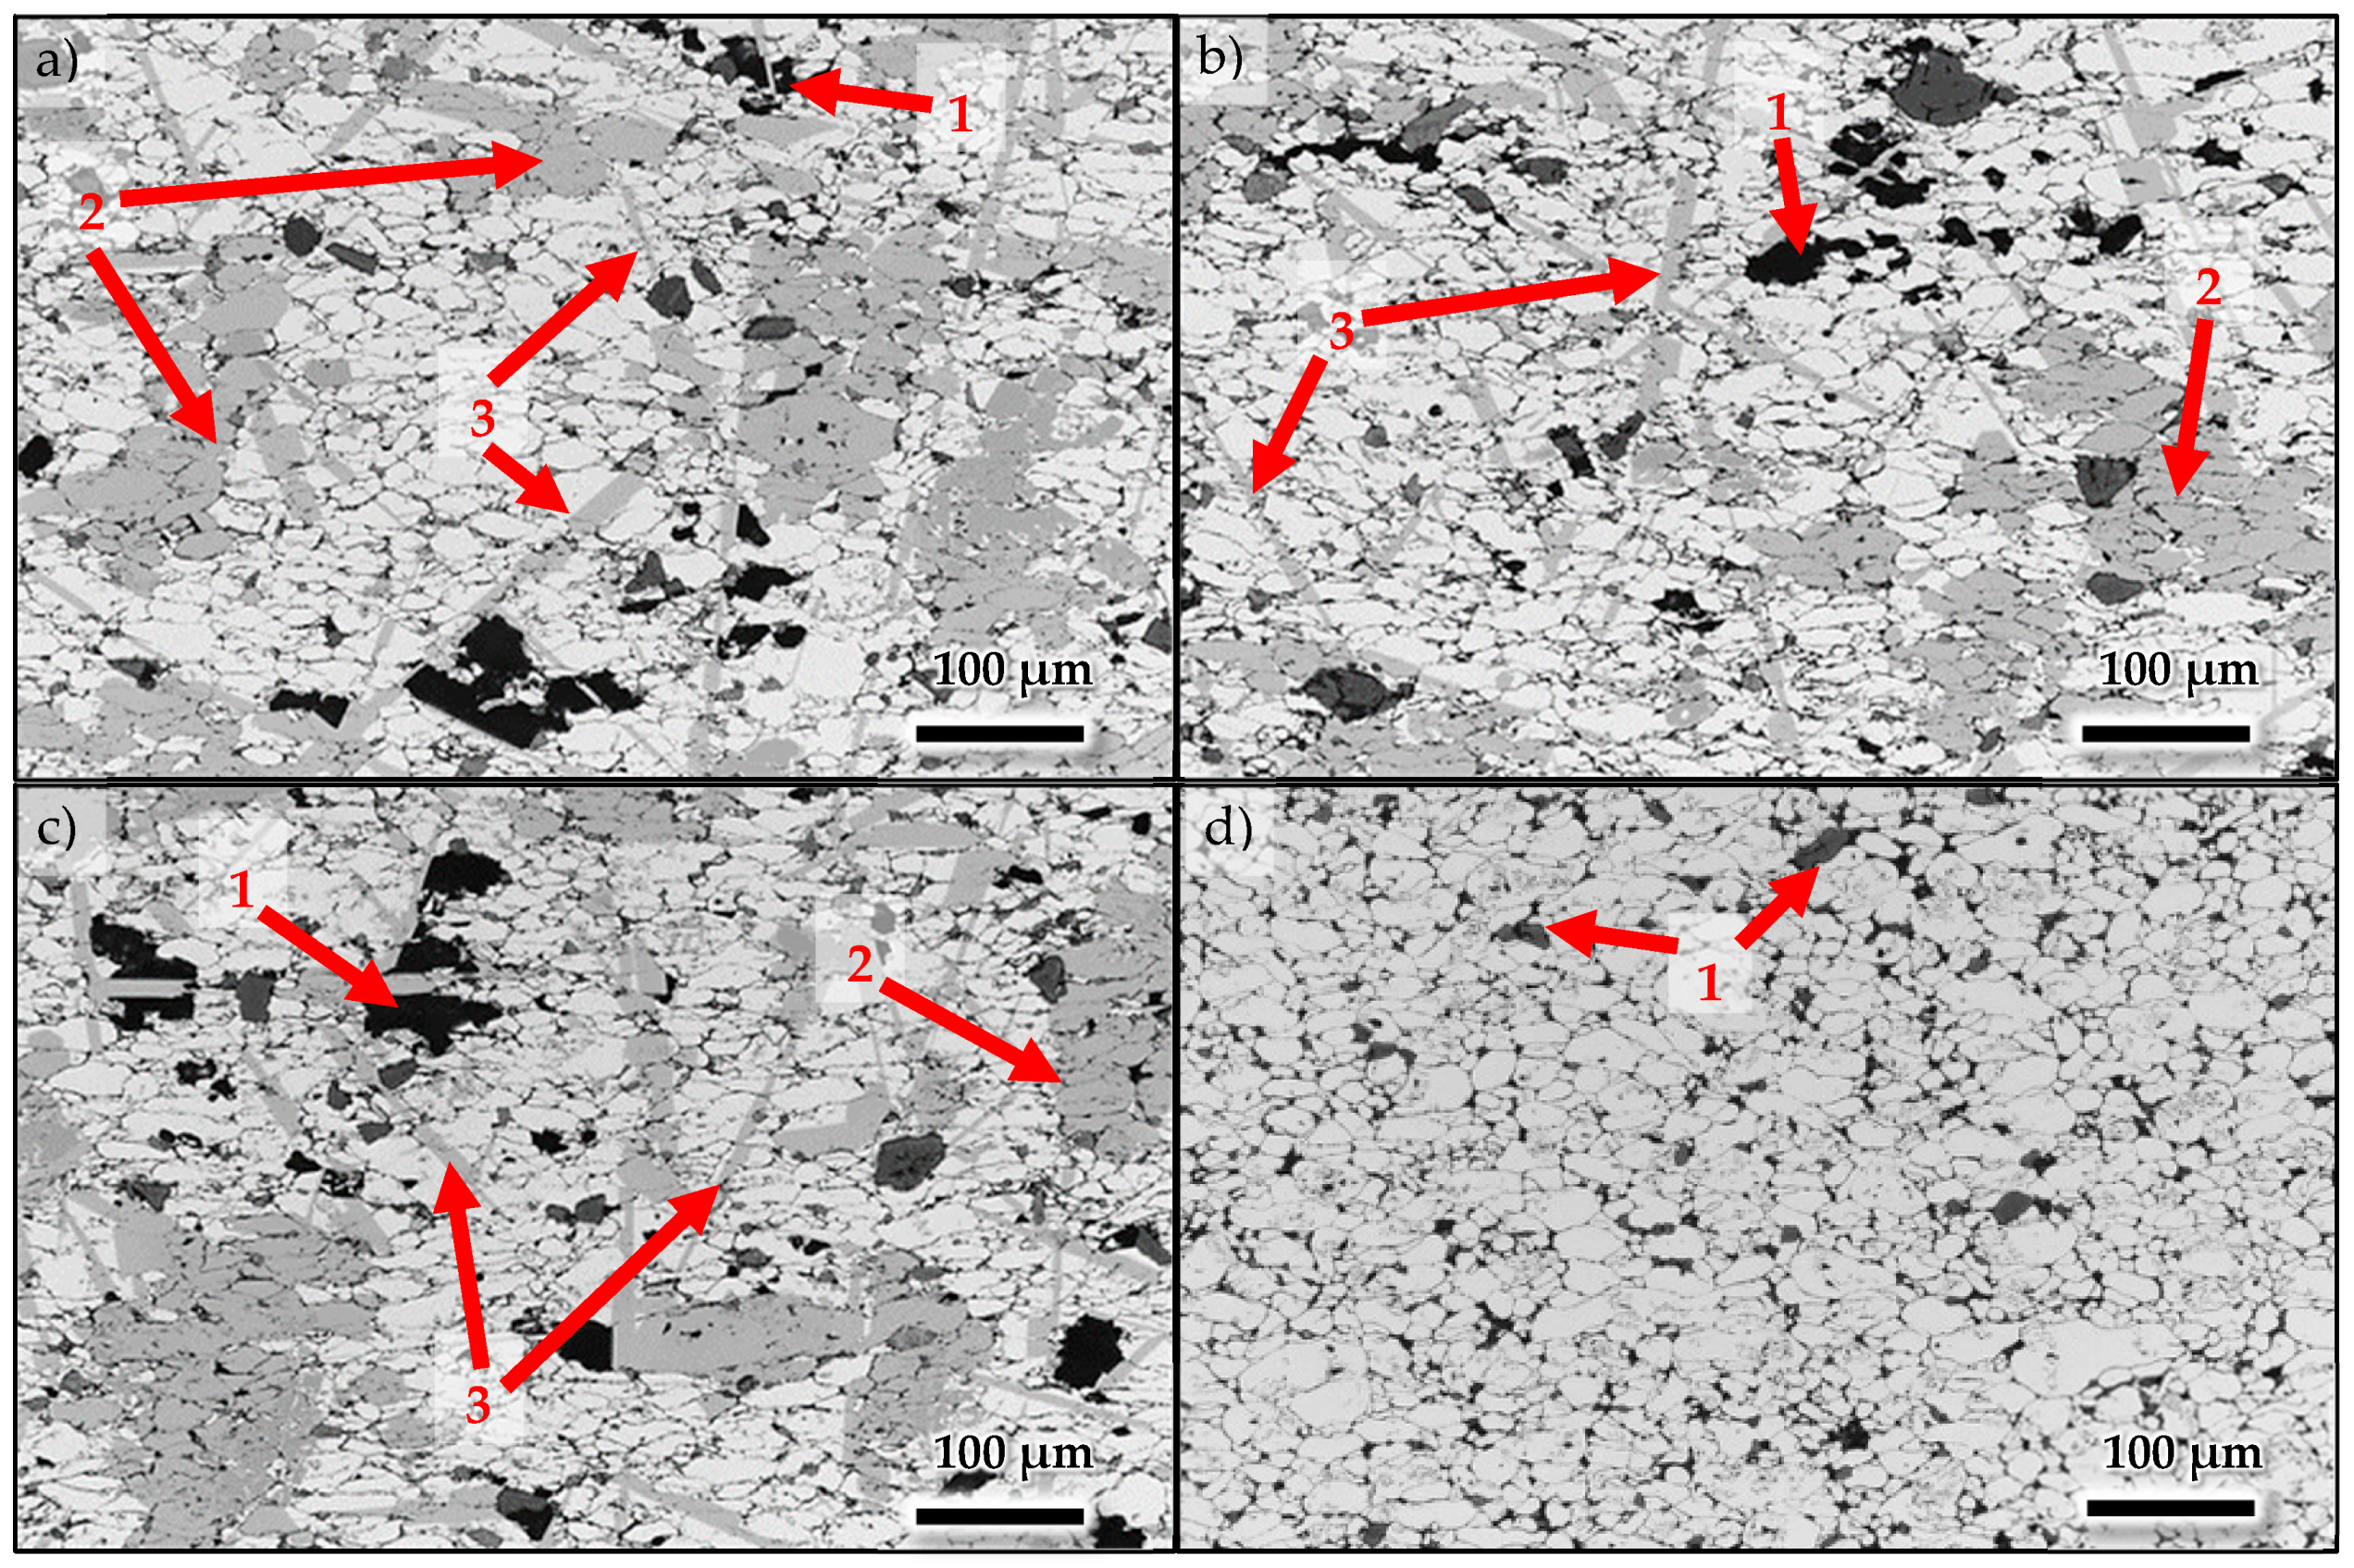
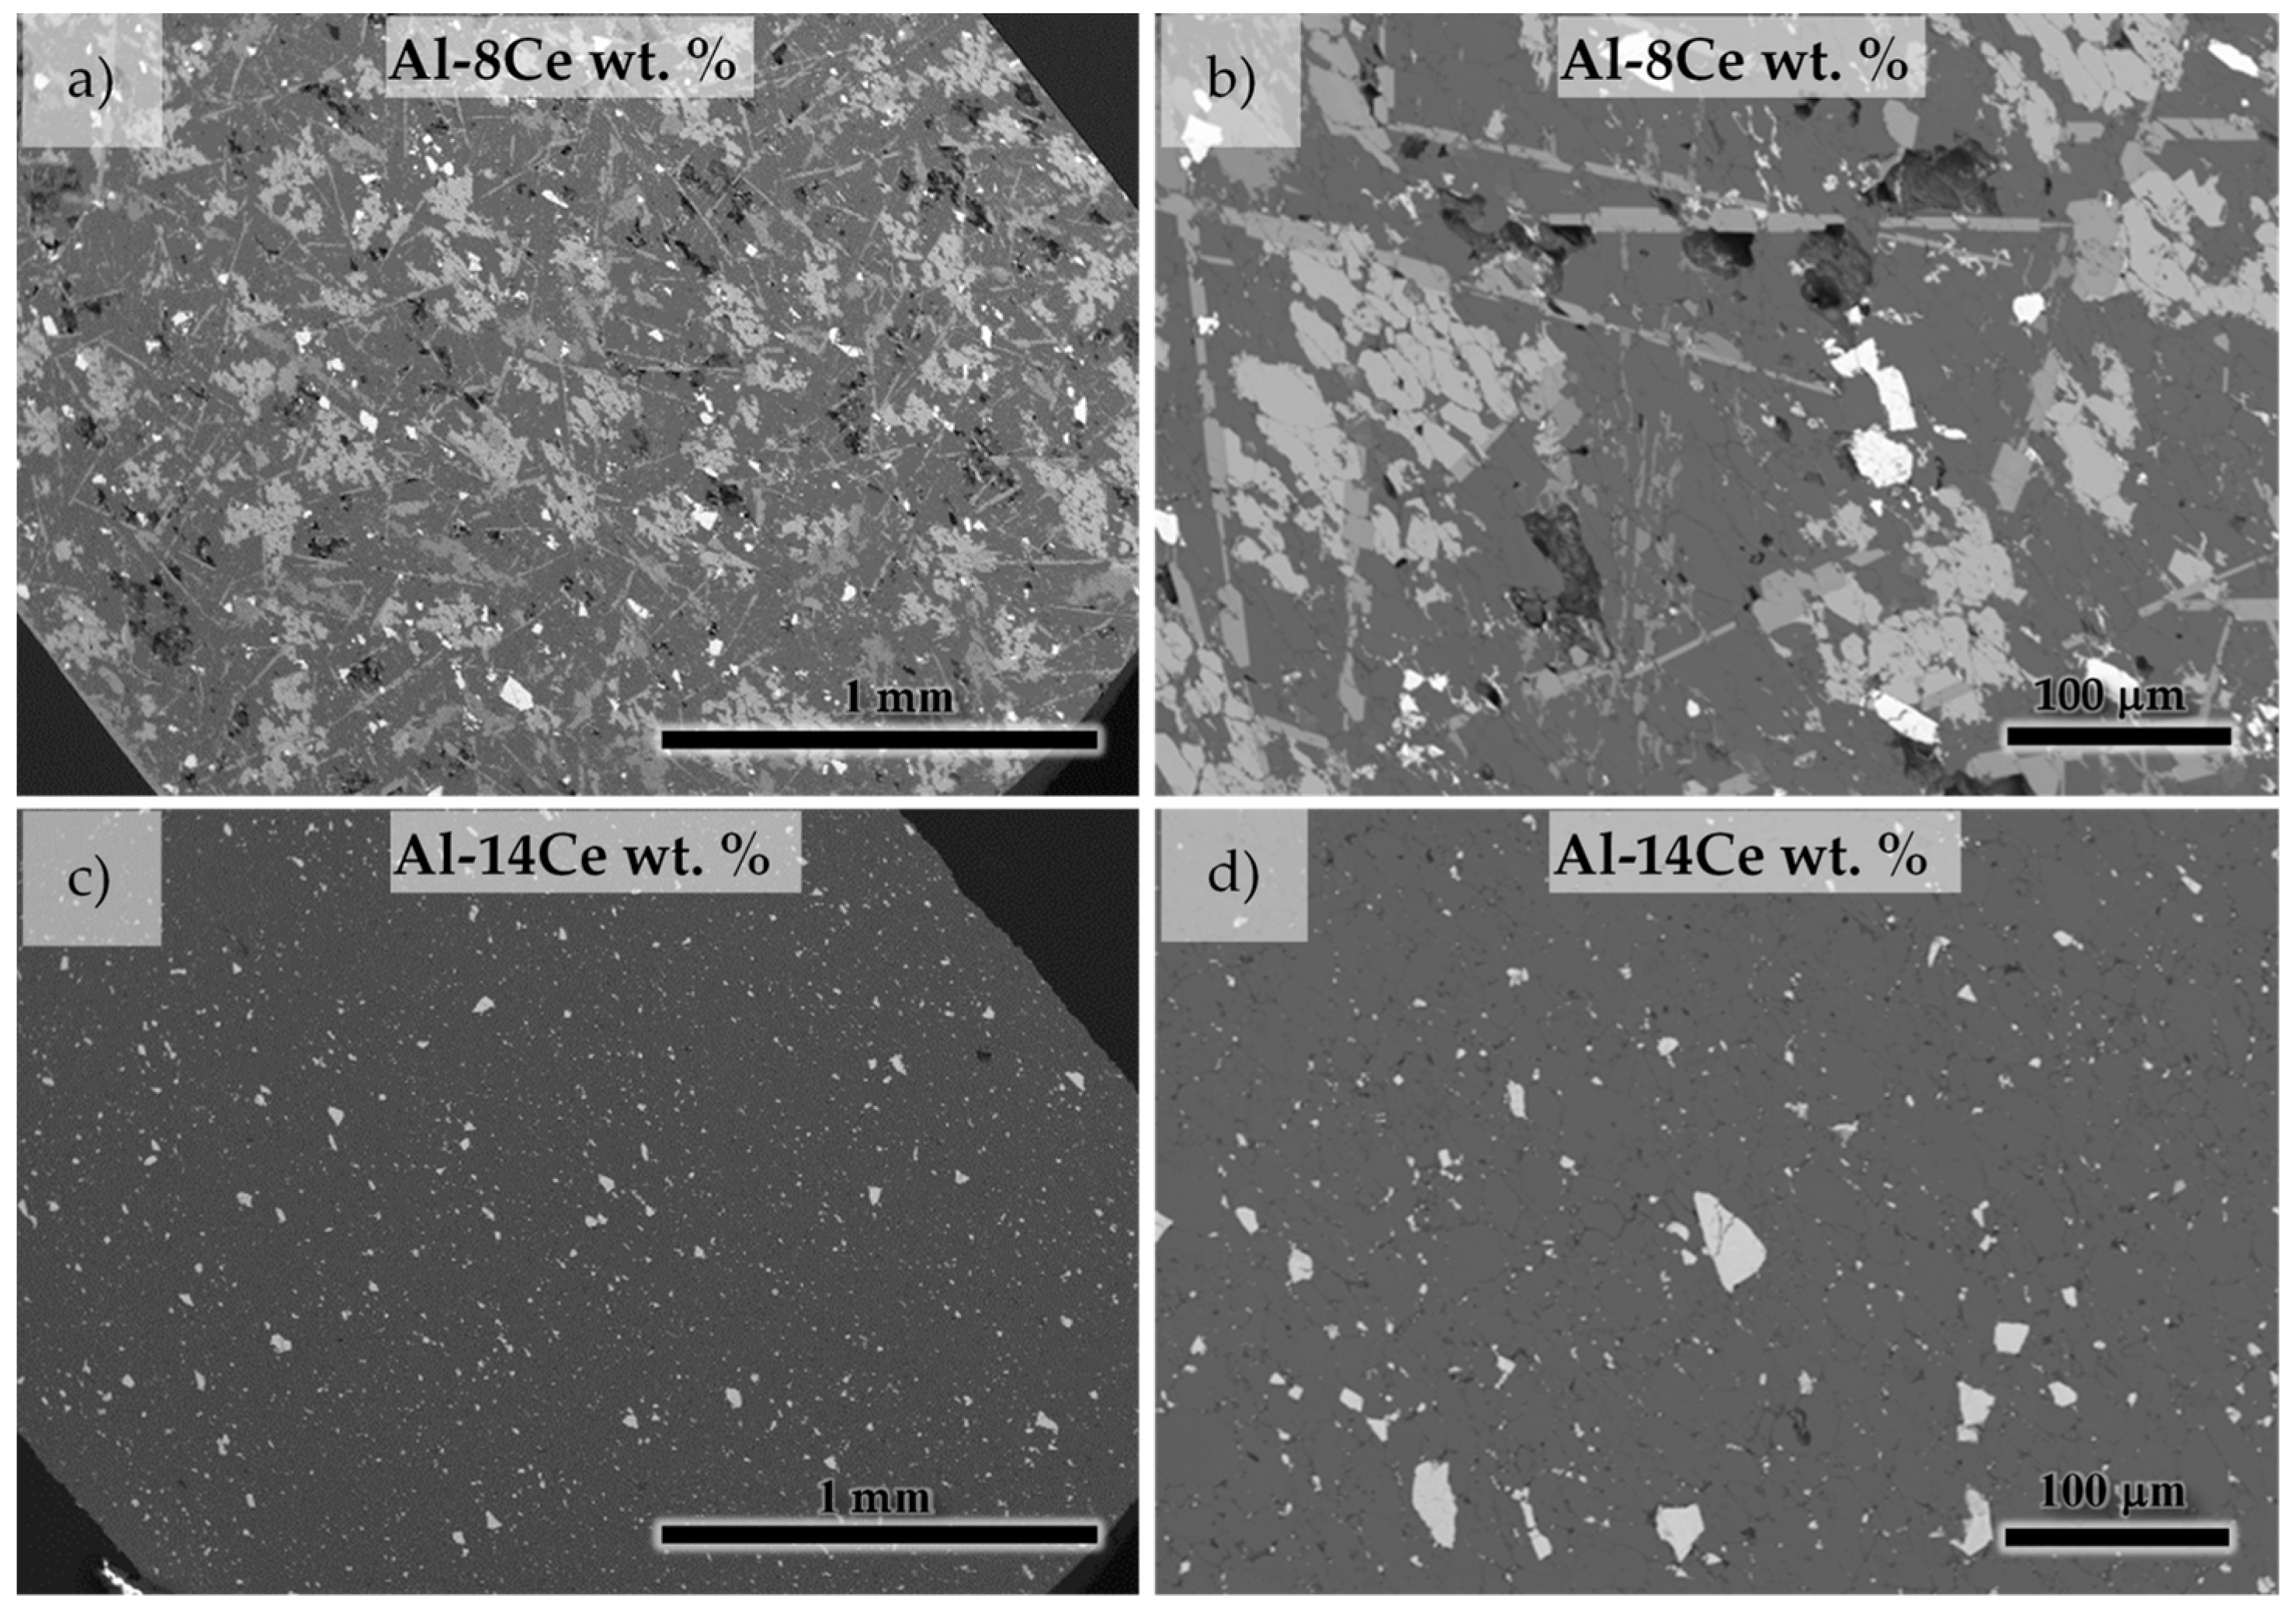
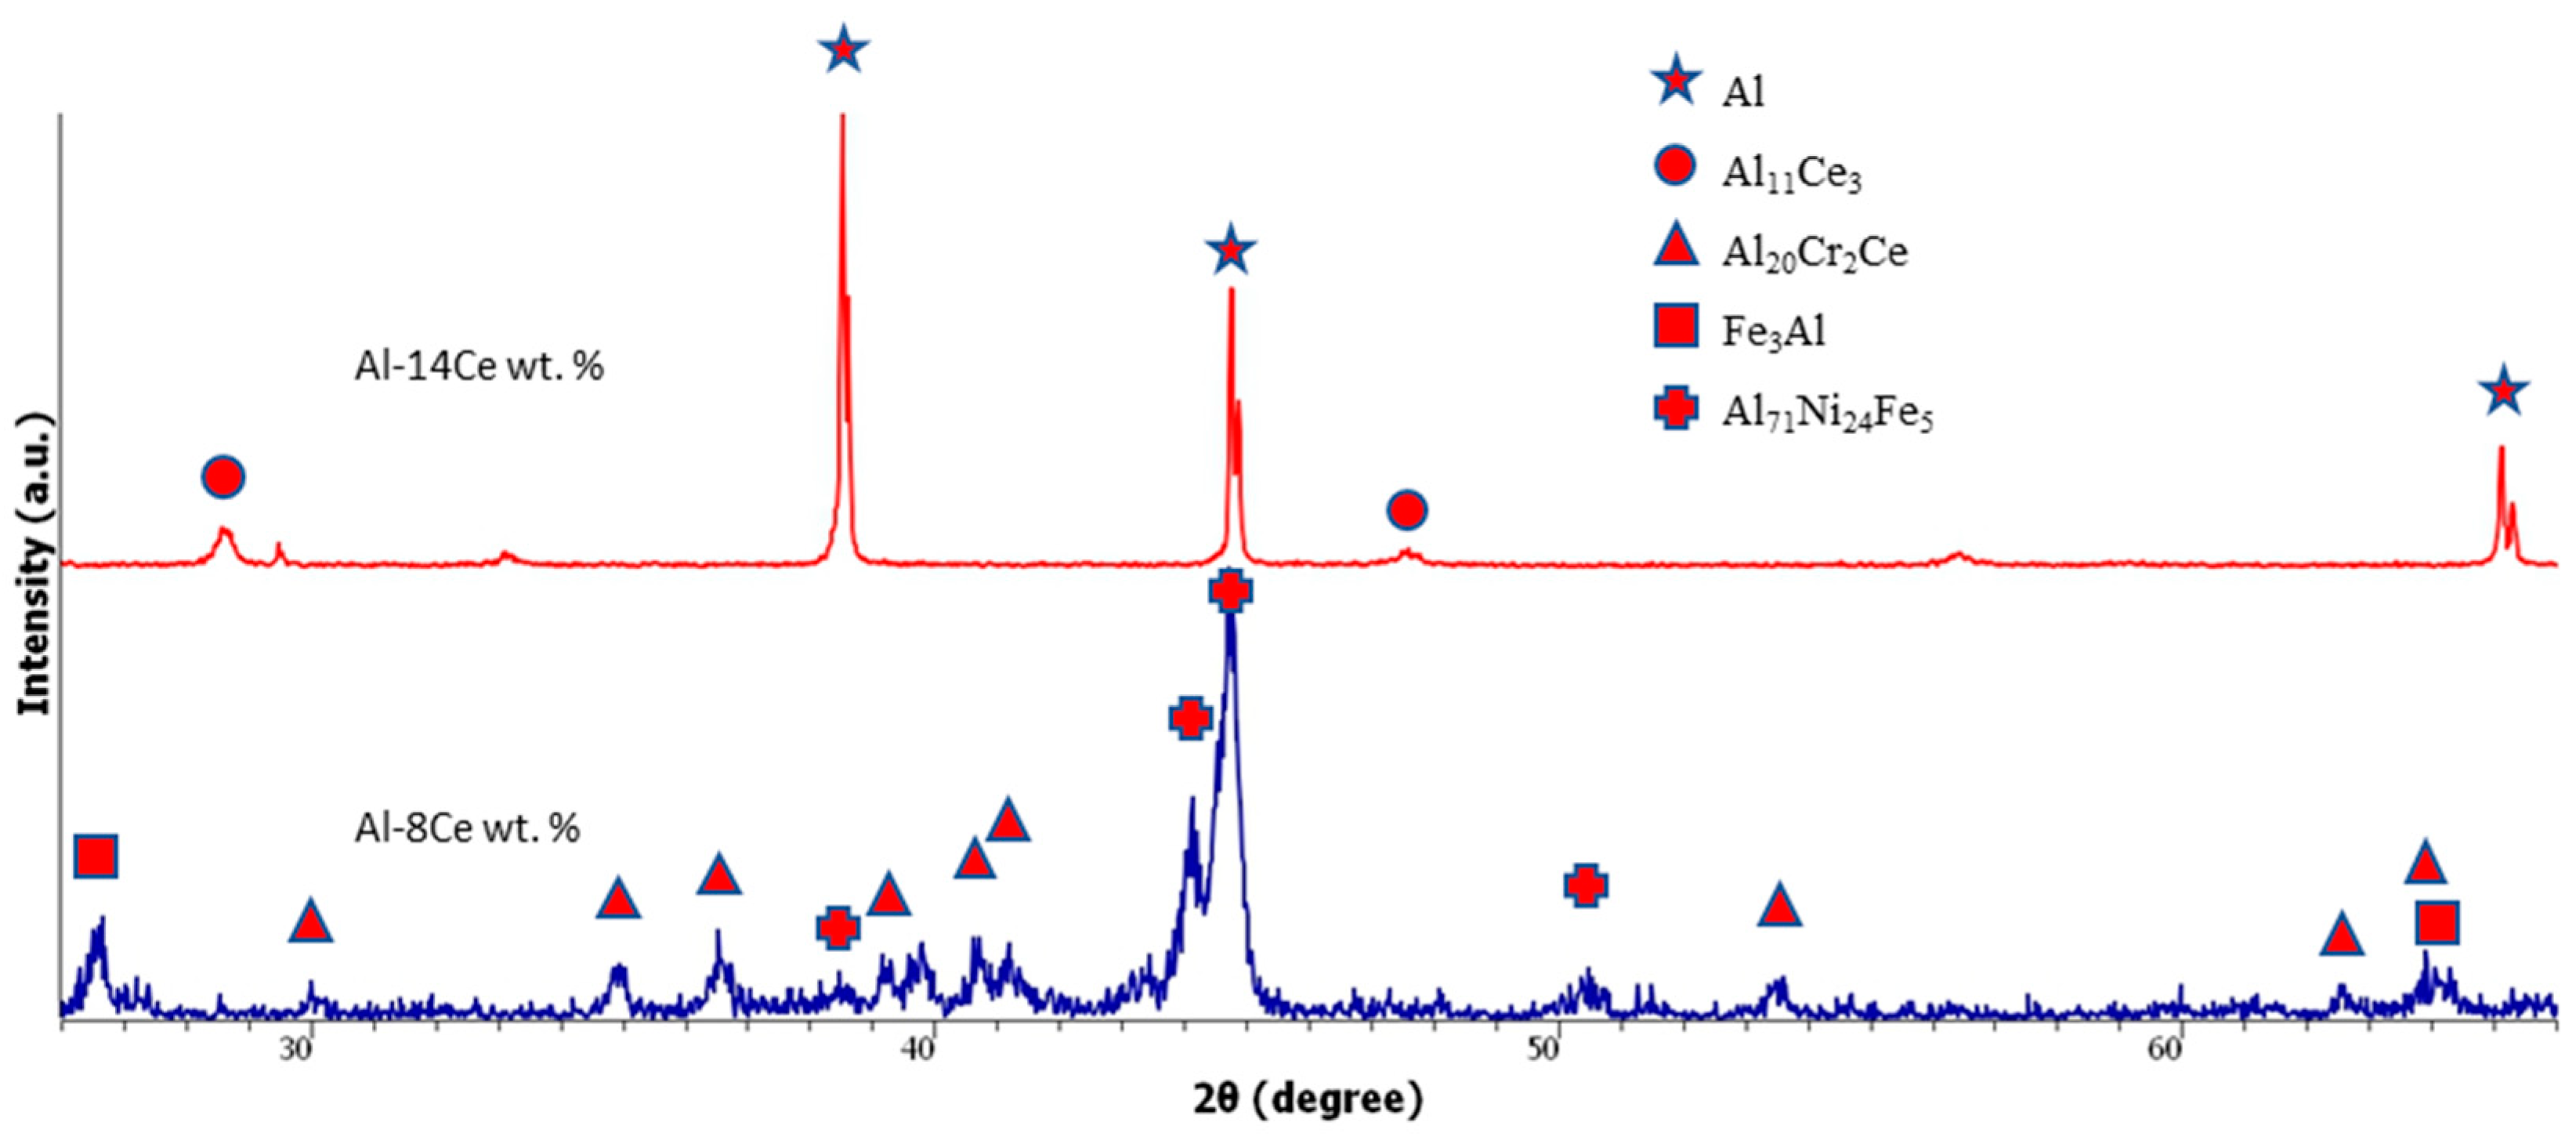
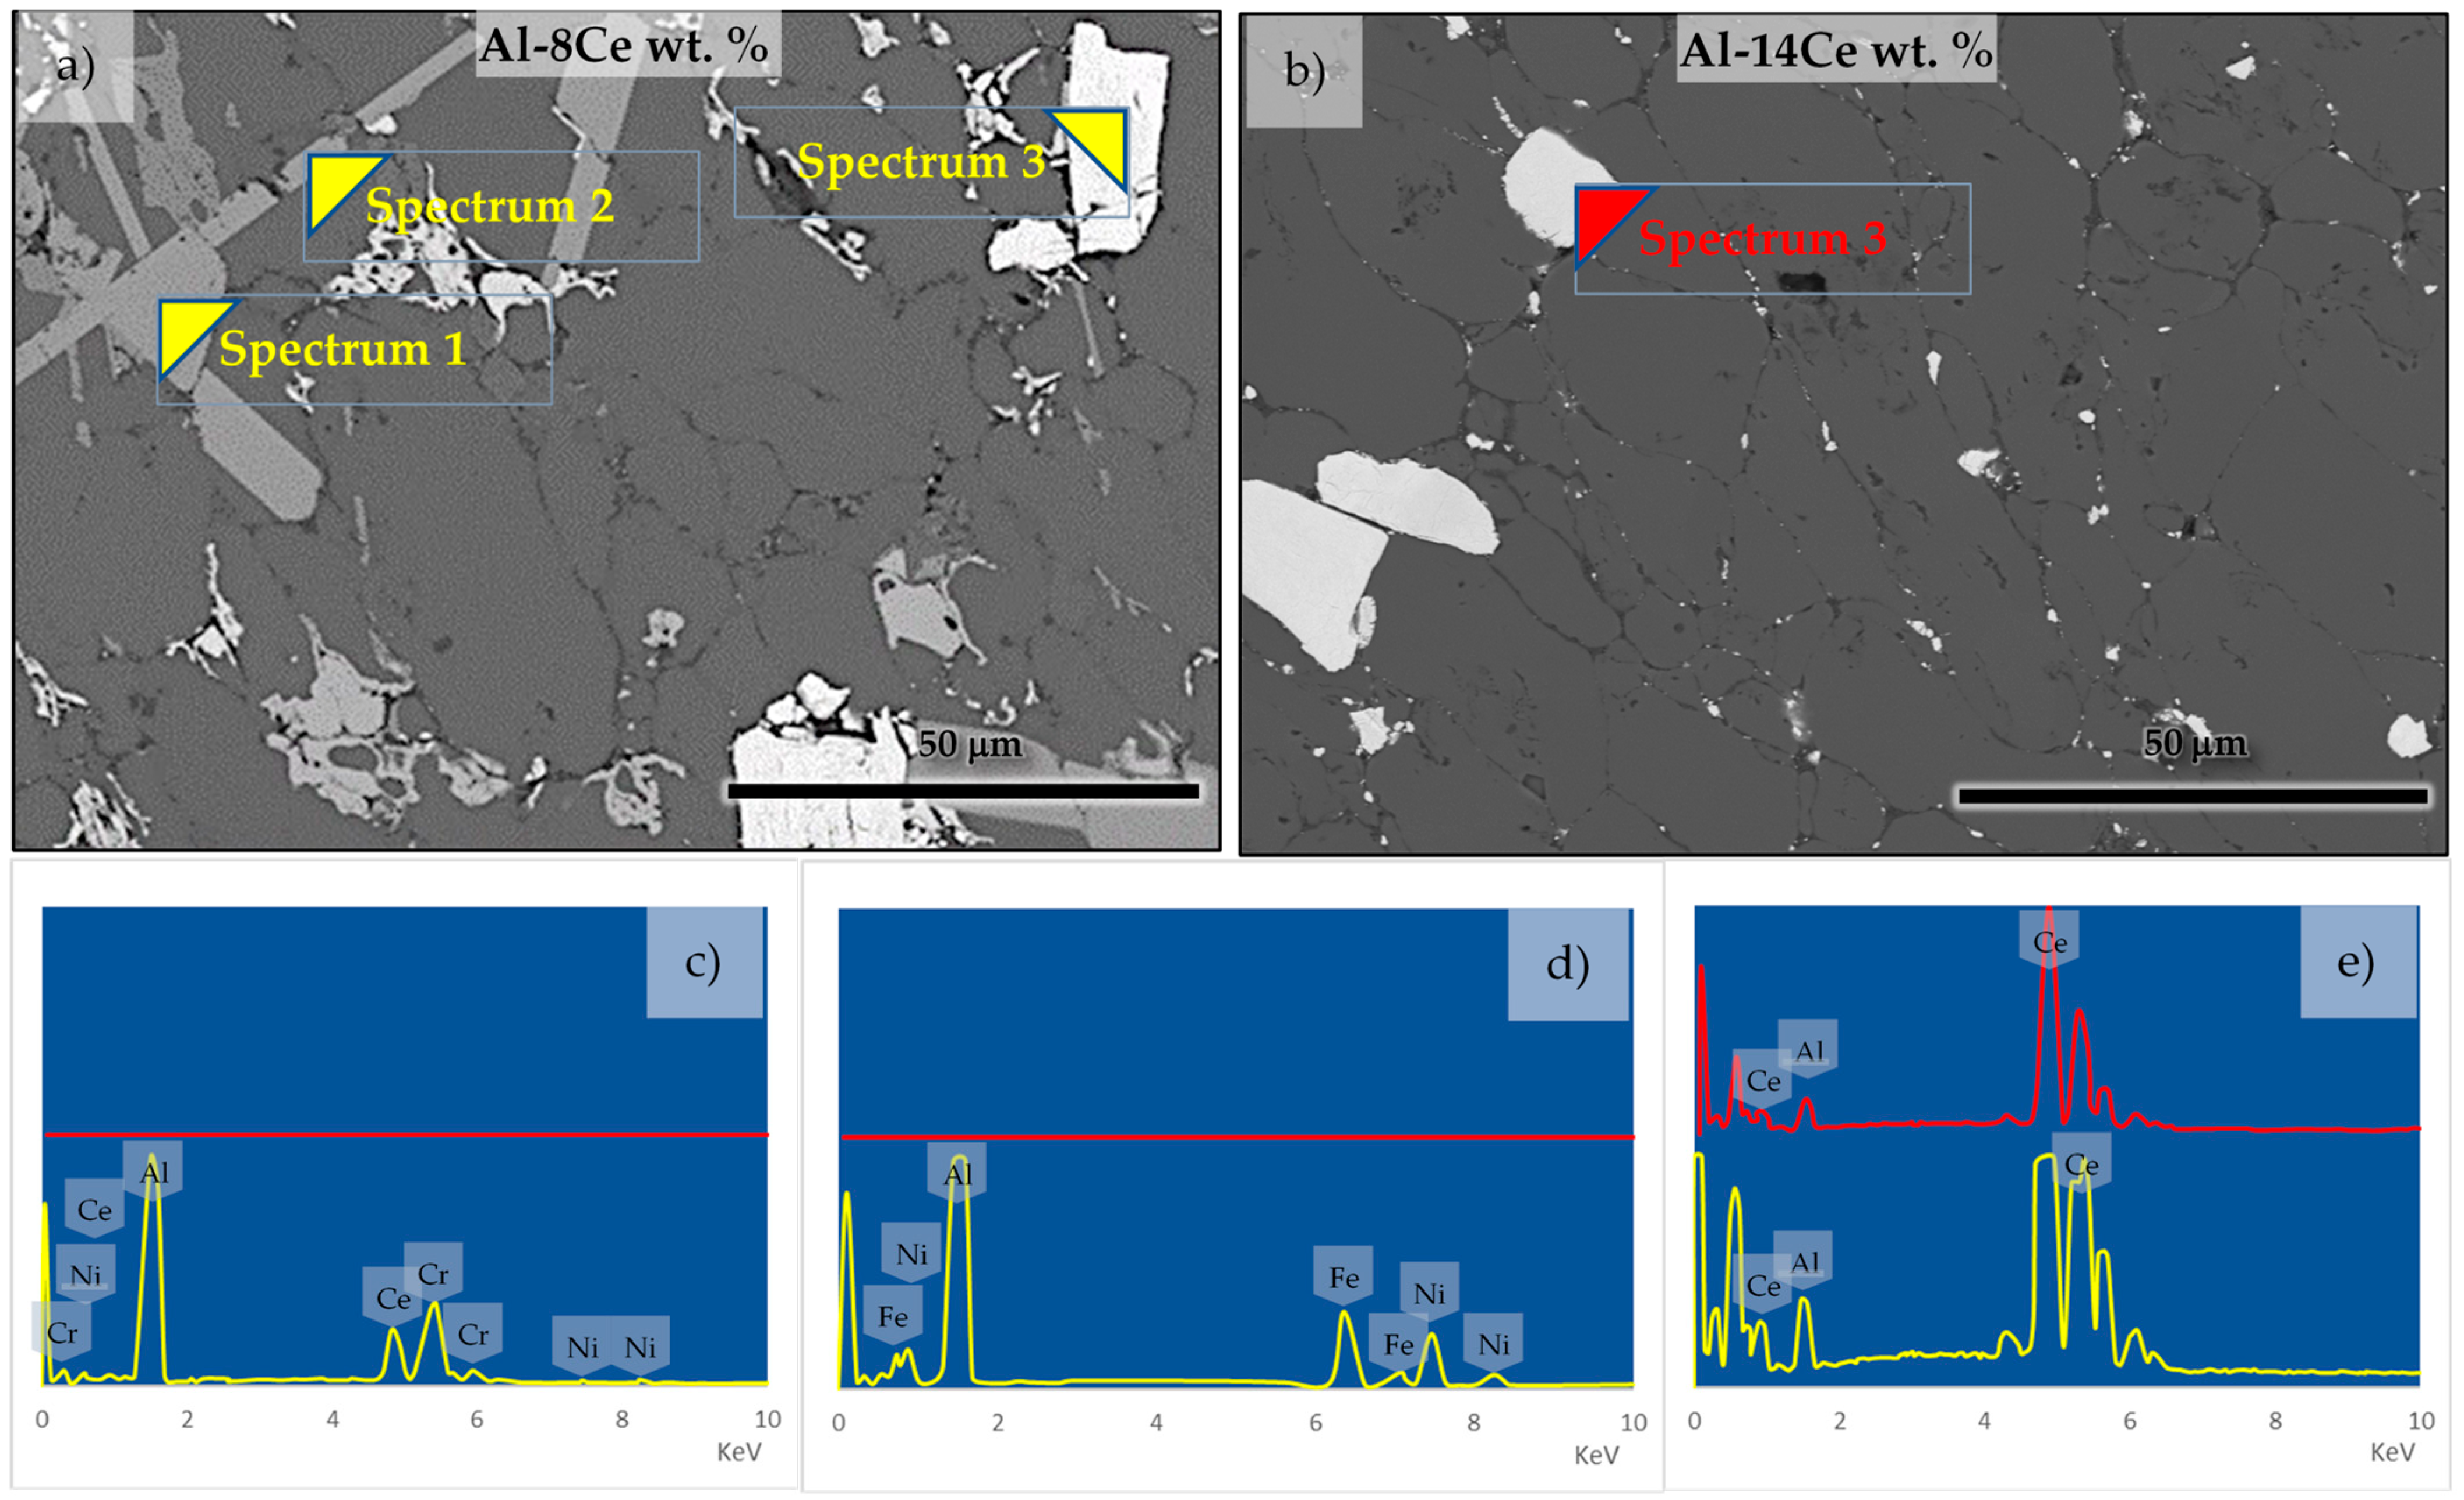
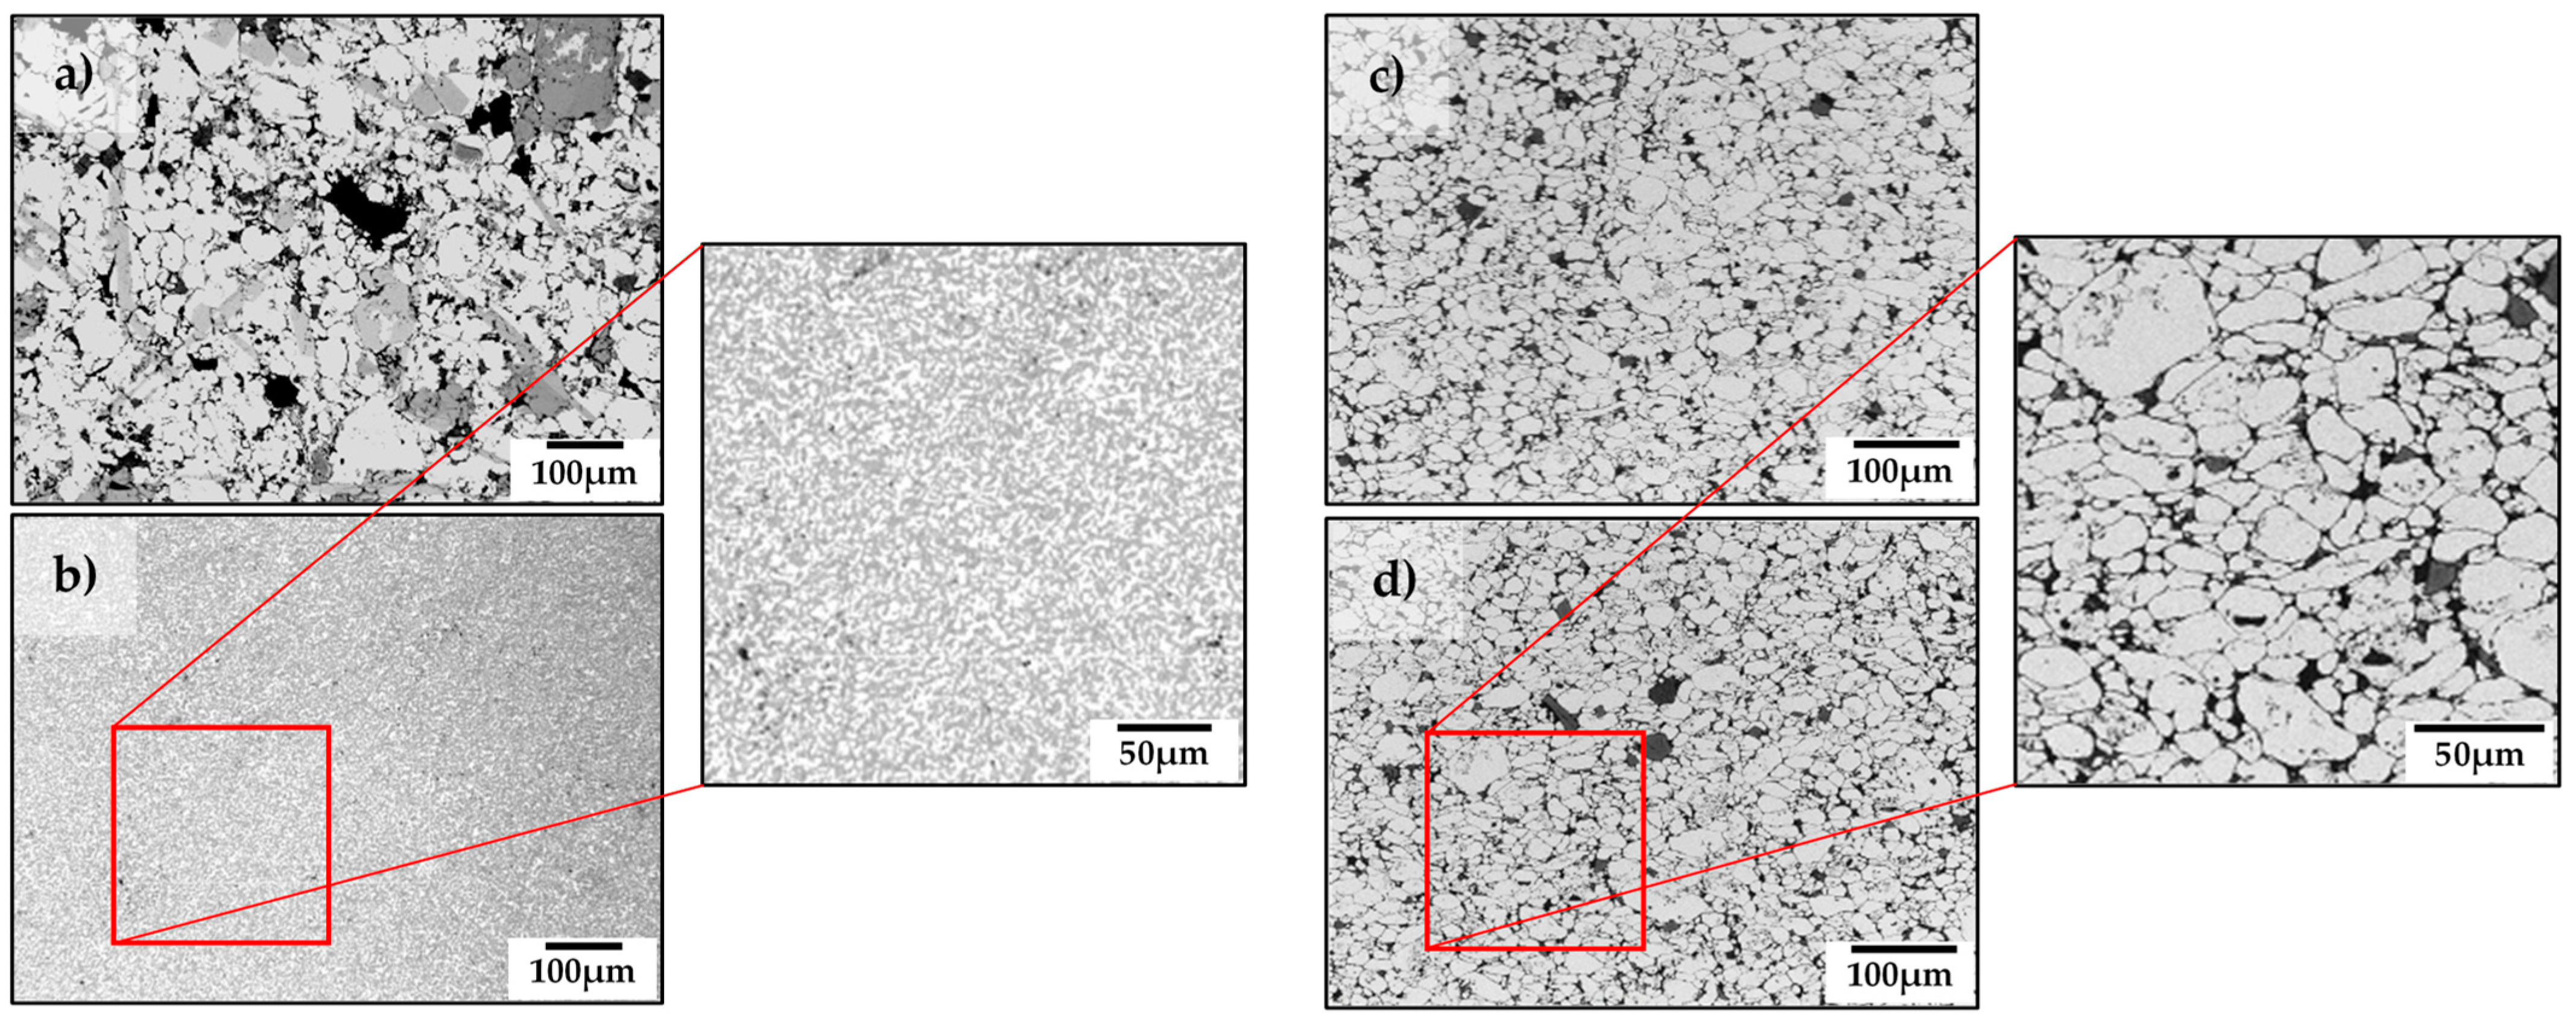
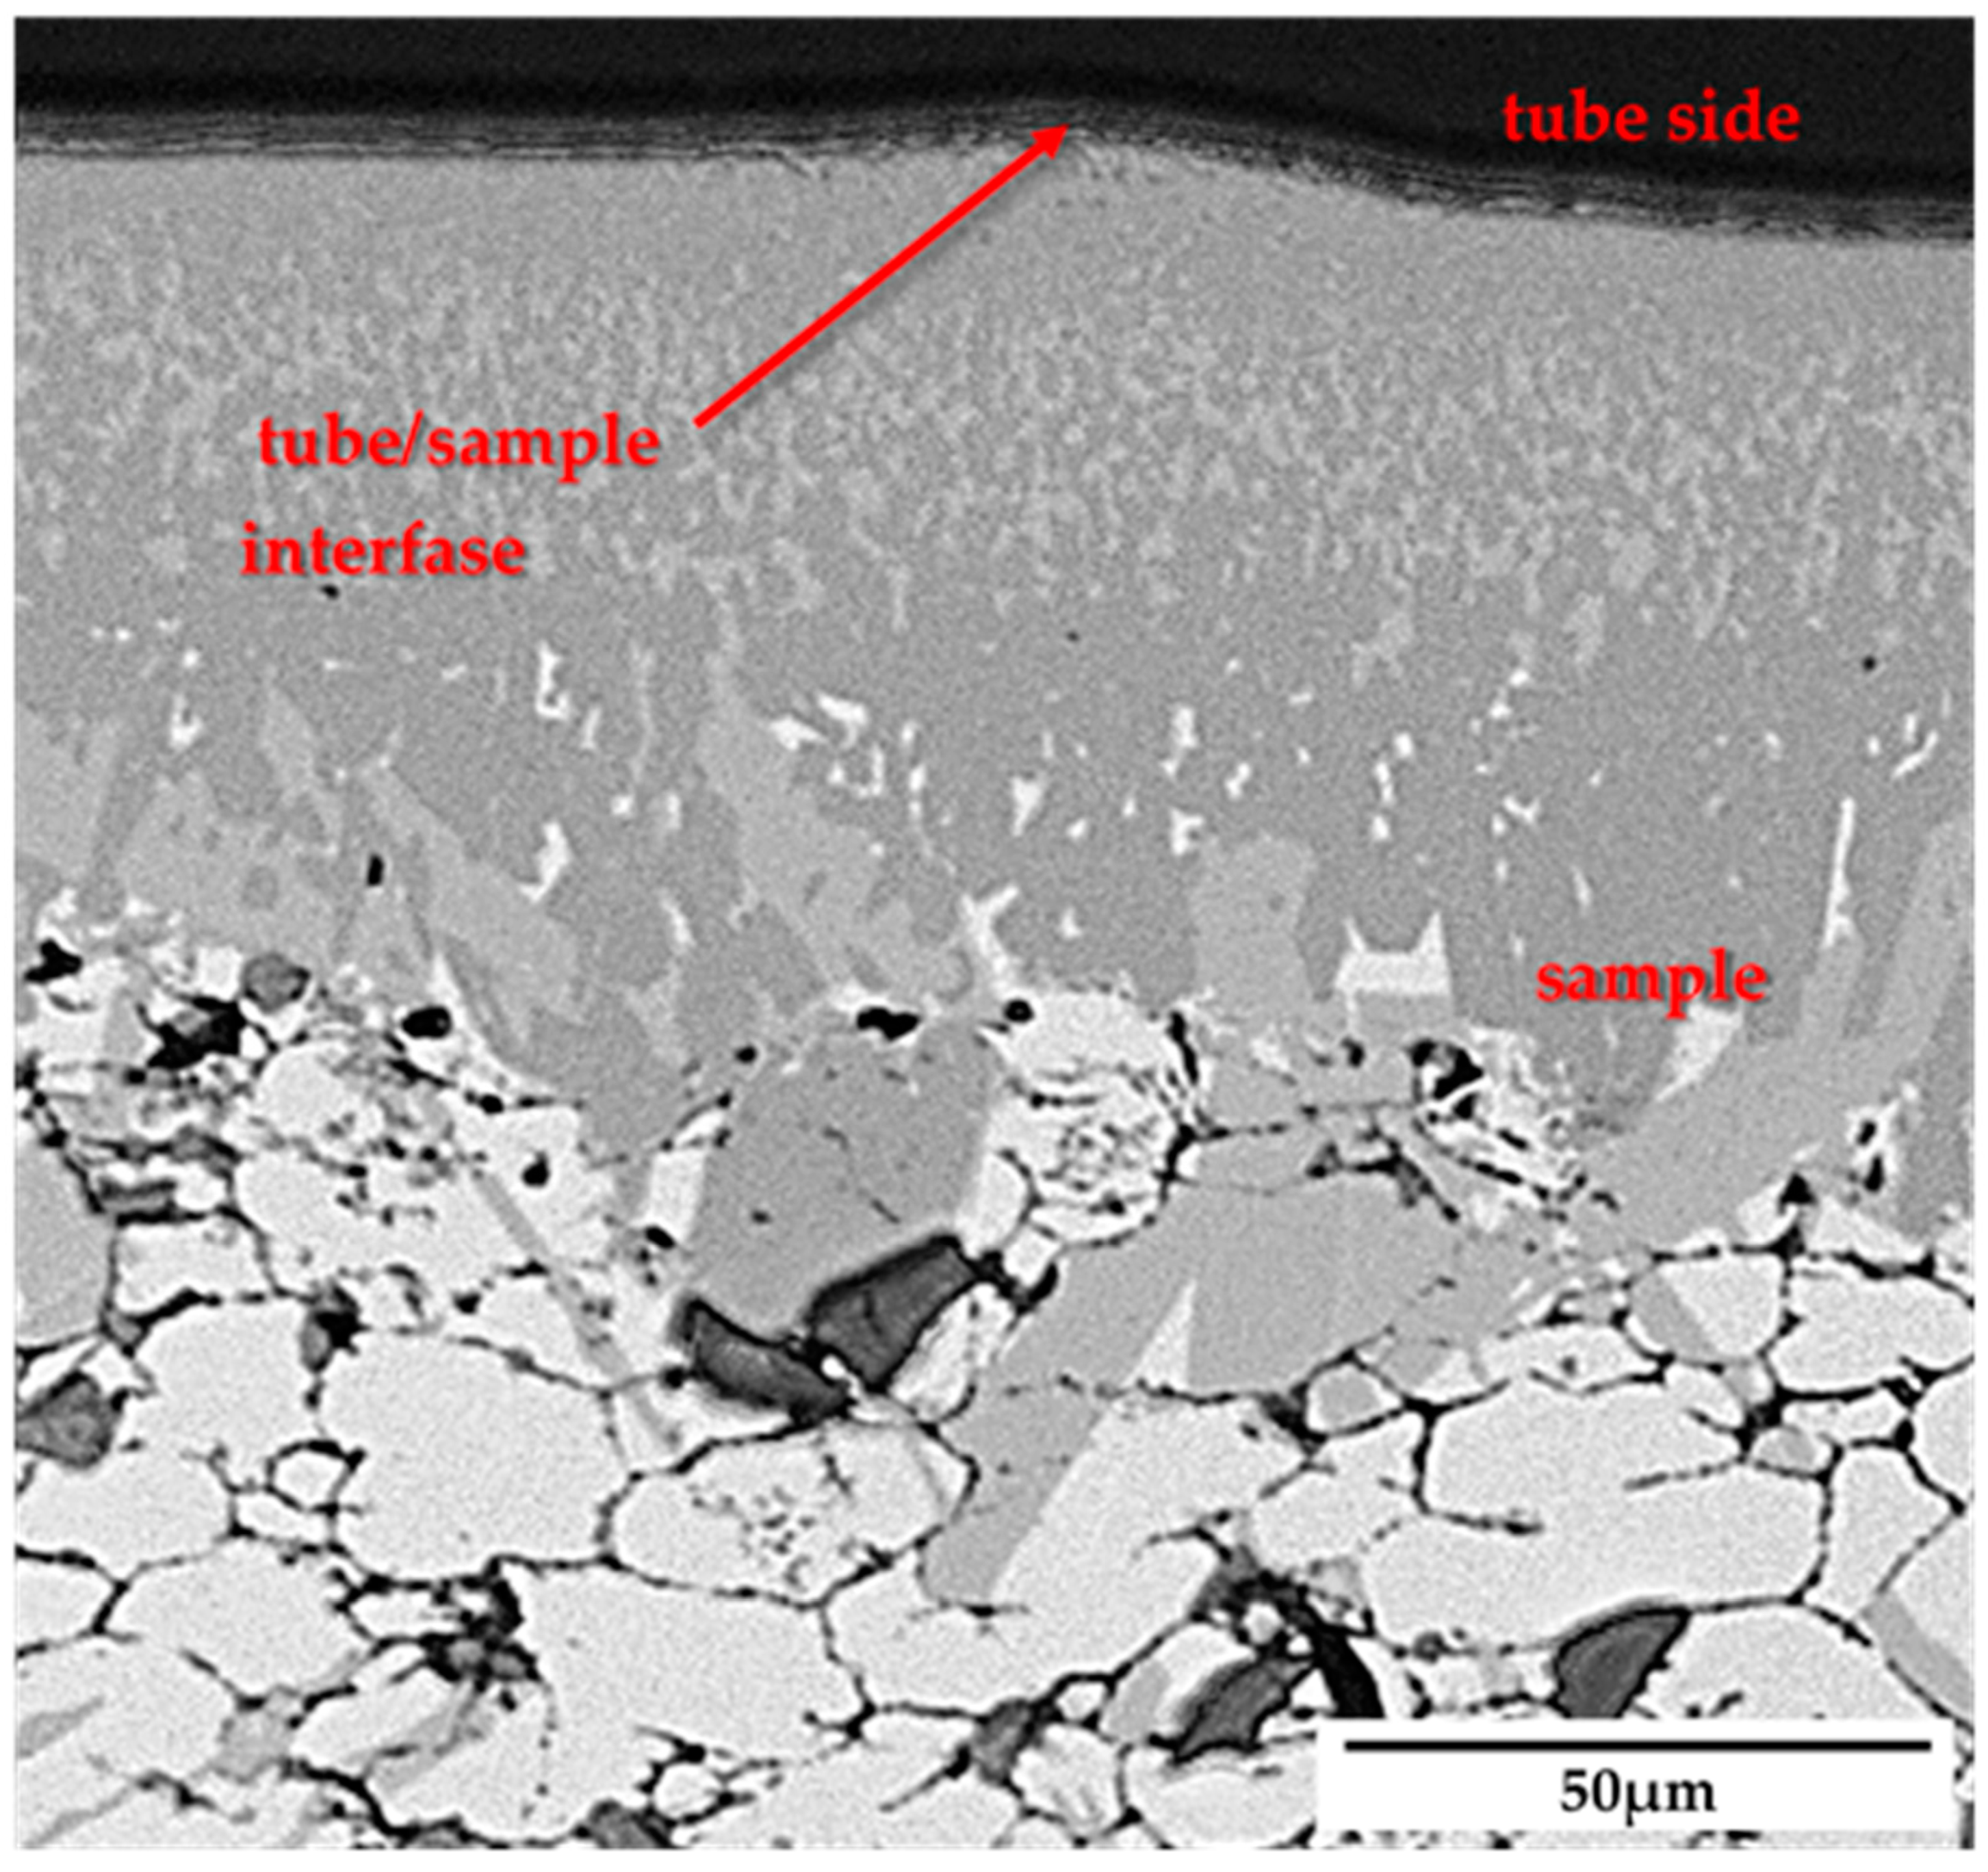
3.1. PIT Reacted Al and Ce Powder
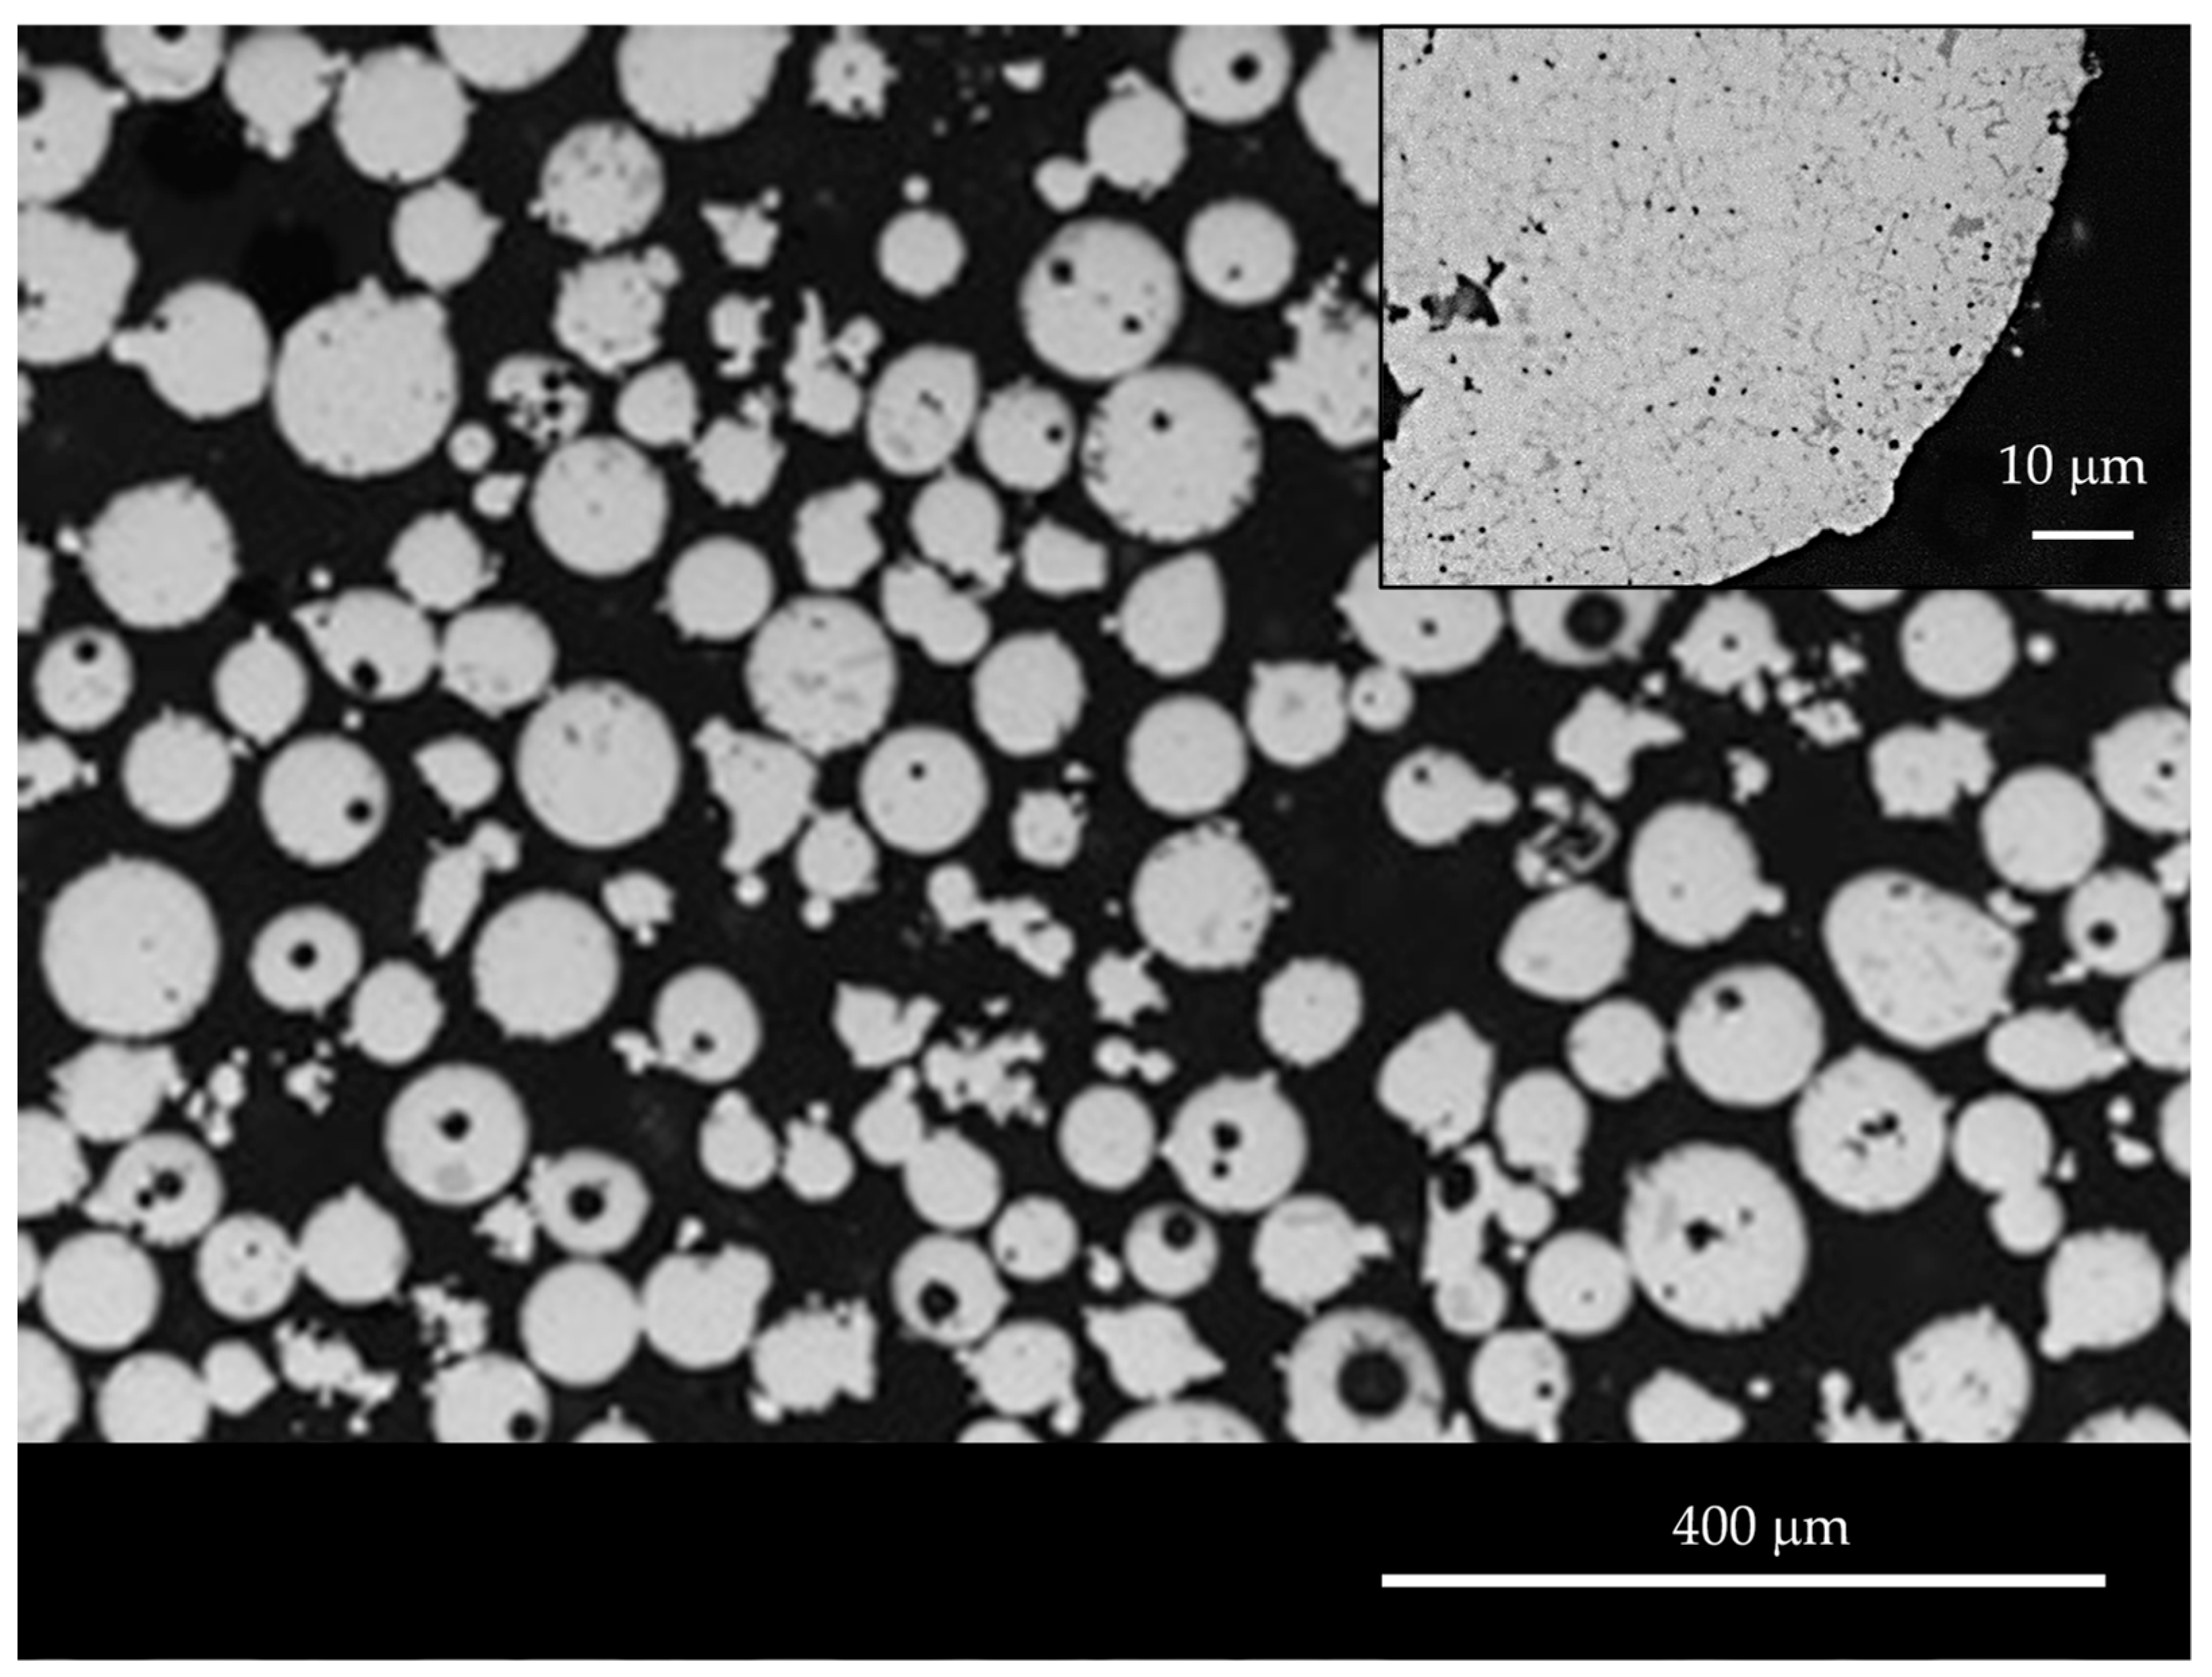
3.2. PIT Al-8Ce-10Mg wt % Composite Powder
4. Conclusions
Author Contributions
Funding
Acknowledgments
Conflicts of Interest
Appendix A


| No. Samples | Composition | Sintering Temp (°C) | Sintering Time (h) | Sample | HT Temp (°C) | HT Time (h) |
|---|---|---|---|---|---|---|
| 4 | Al-8Ce wt % | 751 | 0.5 | A8 | RT | |
| B8 | 200 | 8 | ||||
| C8 | 400 | 8 | ||||
| 3 | Al-10Ce wt % | 747 | 0.5 | A10 | RT | |
| B10 | 200 | 8 | ||||
| C10 | 400 | 8 | ||||
| 3 | Al-12Ce wt % | 741 | 0.5 | A12 | RT | |
| B12 | 200 | 8 | ||||
| C12 | 400 | 8 | ||||
| 3 | Al-14Ce wt % | 771 | 0.5 | A14 | RT | |
| B14 | 200 | 8 | ||||
| C14 | 400 | 8 |
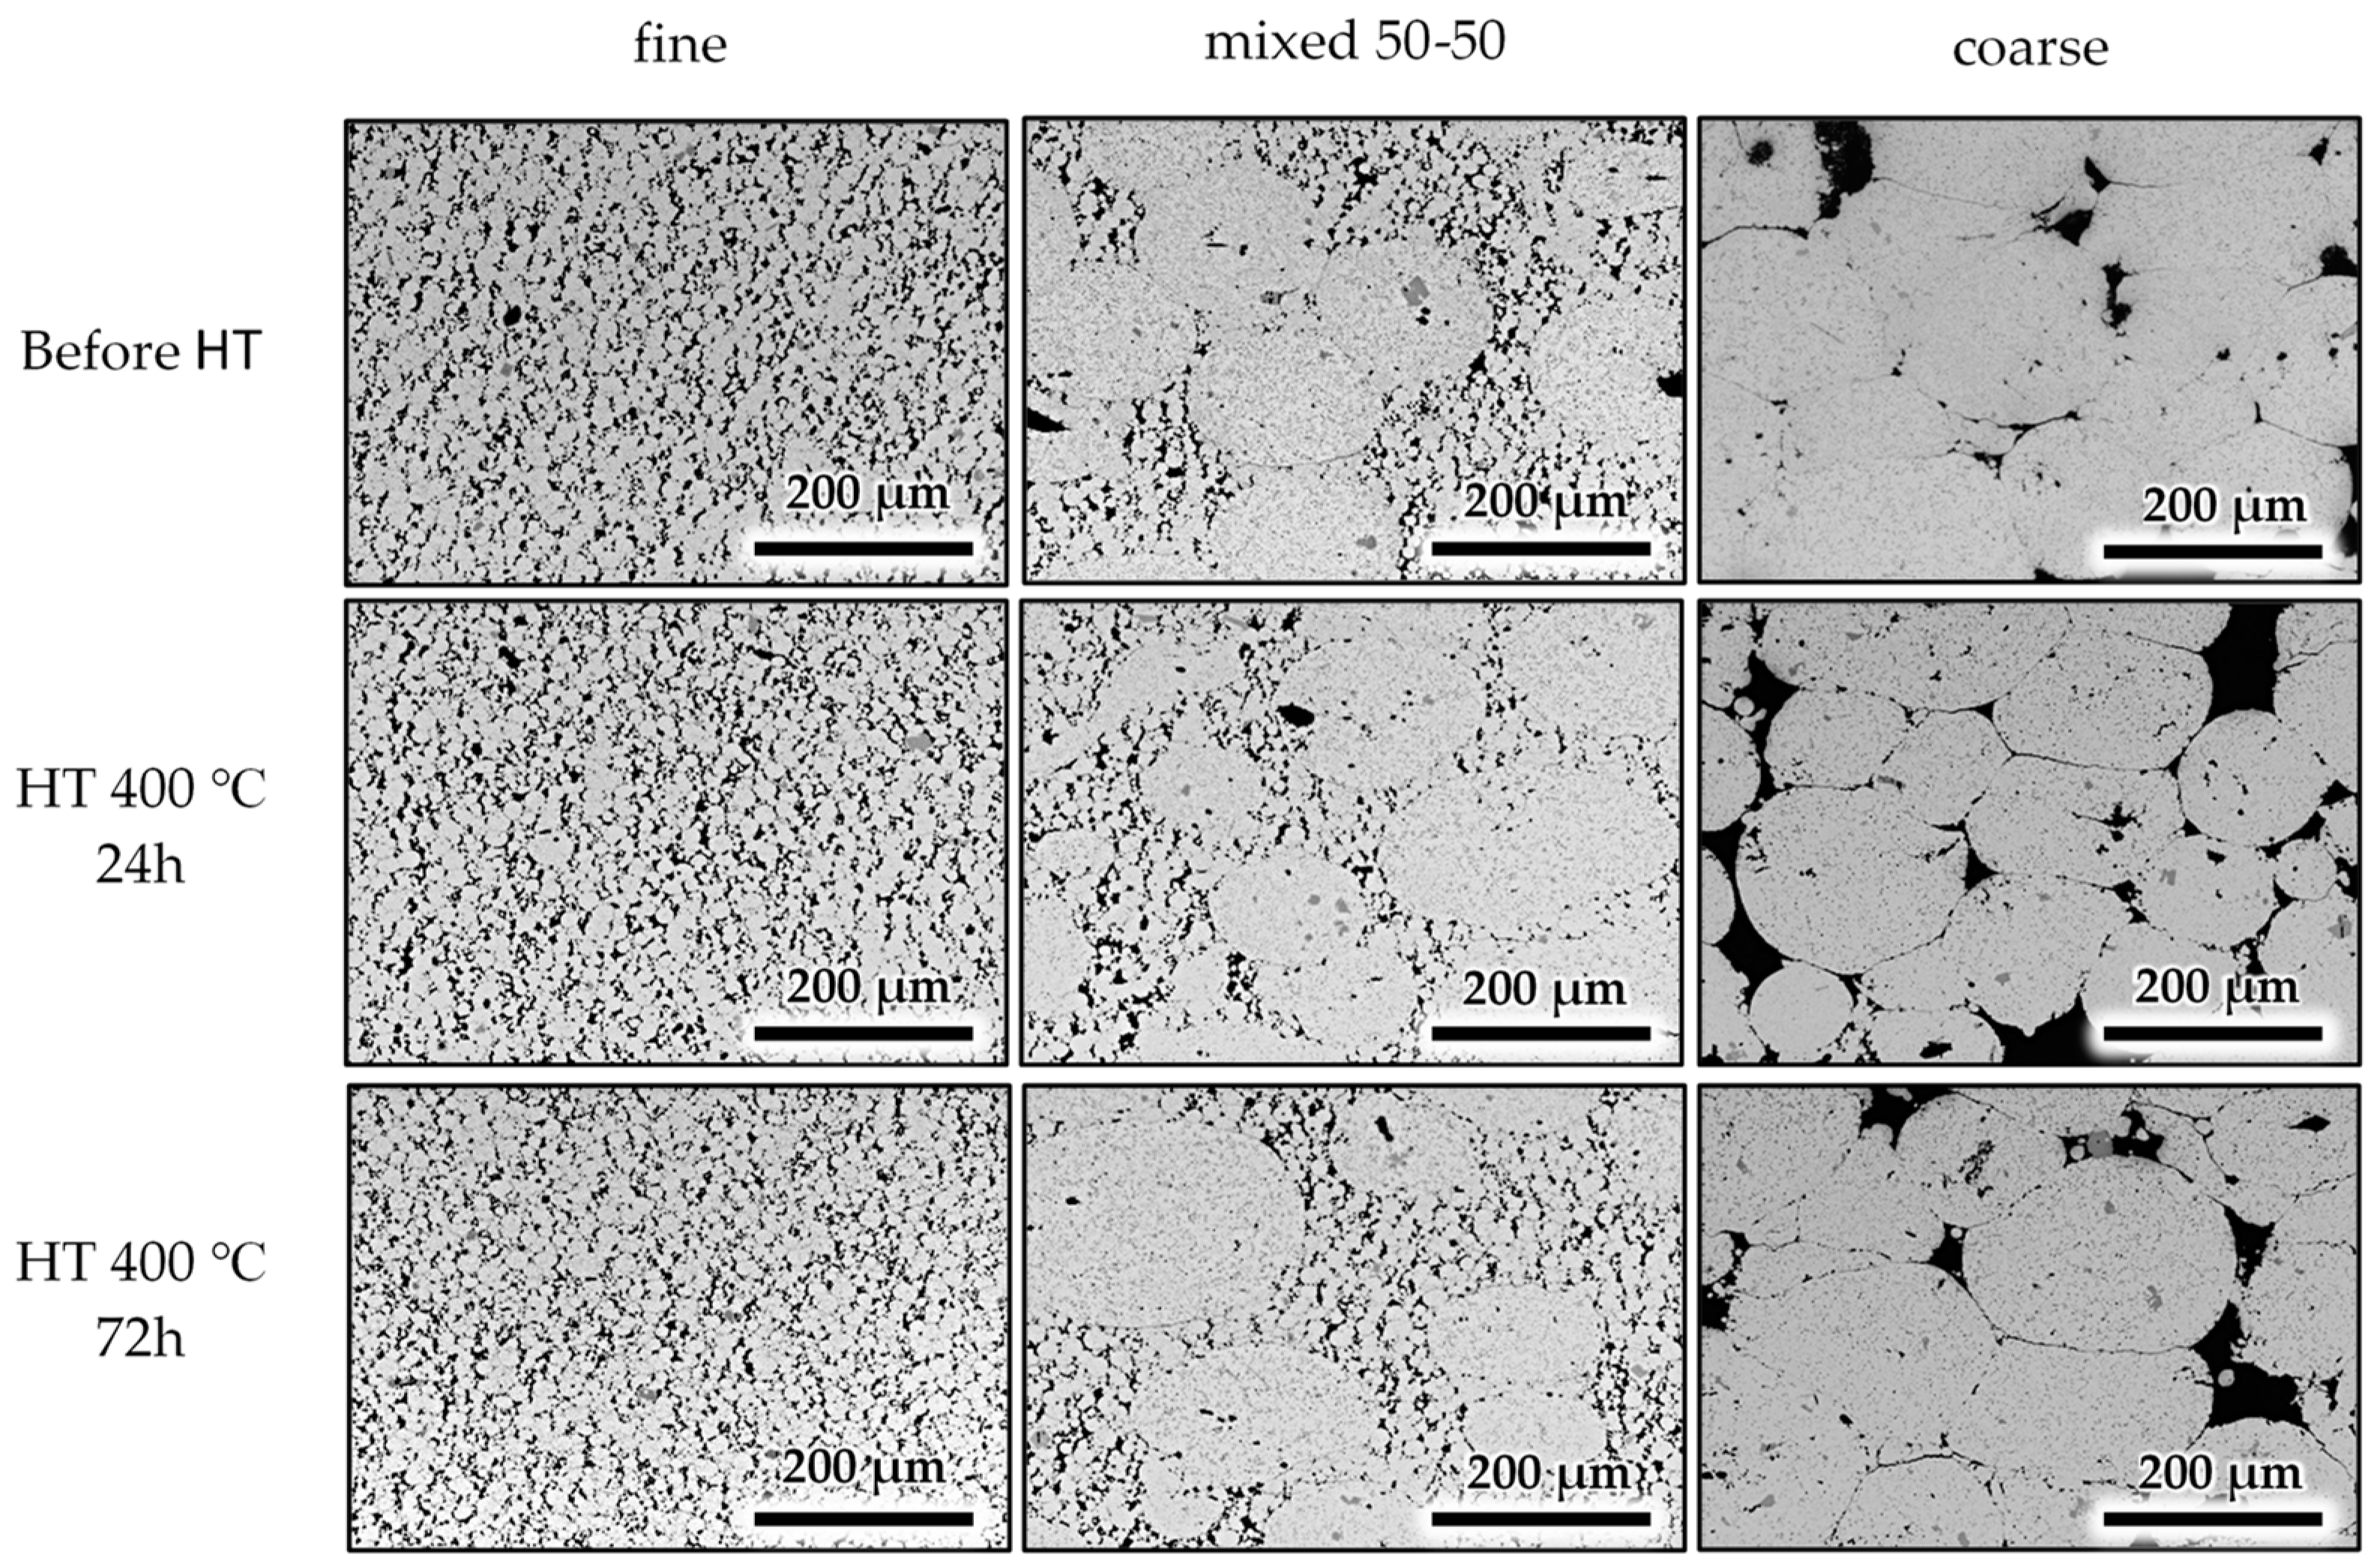
| No. Samples | Composition | Sintering Temp (°C) | Sintering Time (h) | Sample | Heat Treatment Temp (°C) | Heat Treatment Time (h) |
|---|---|---|---|---|---|---|
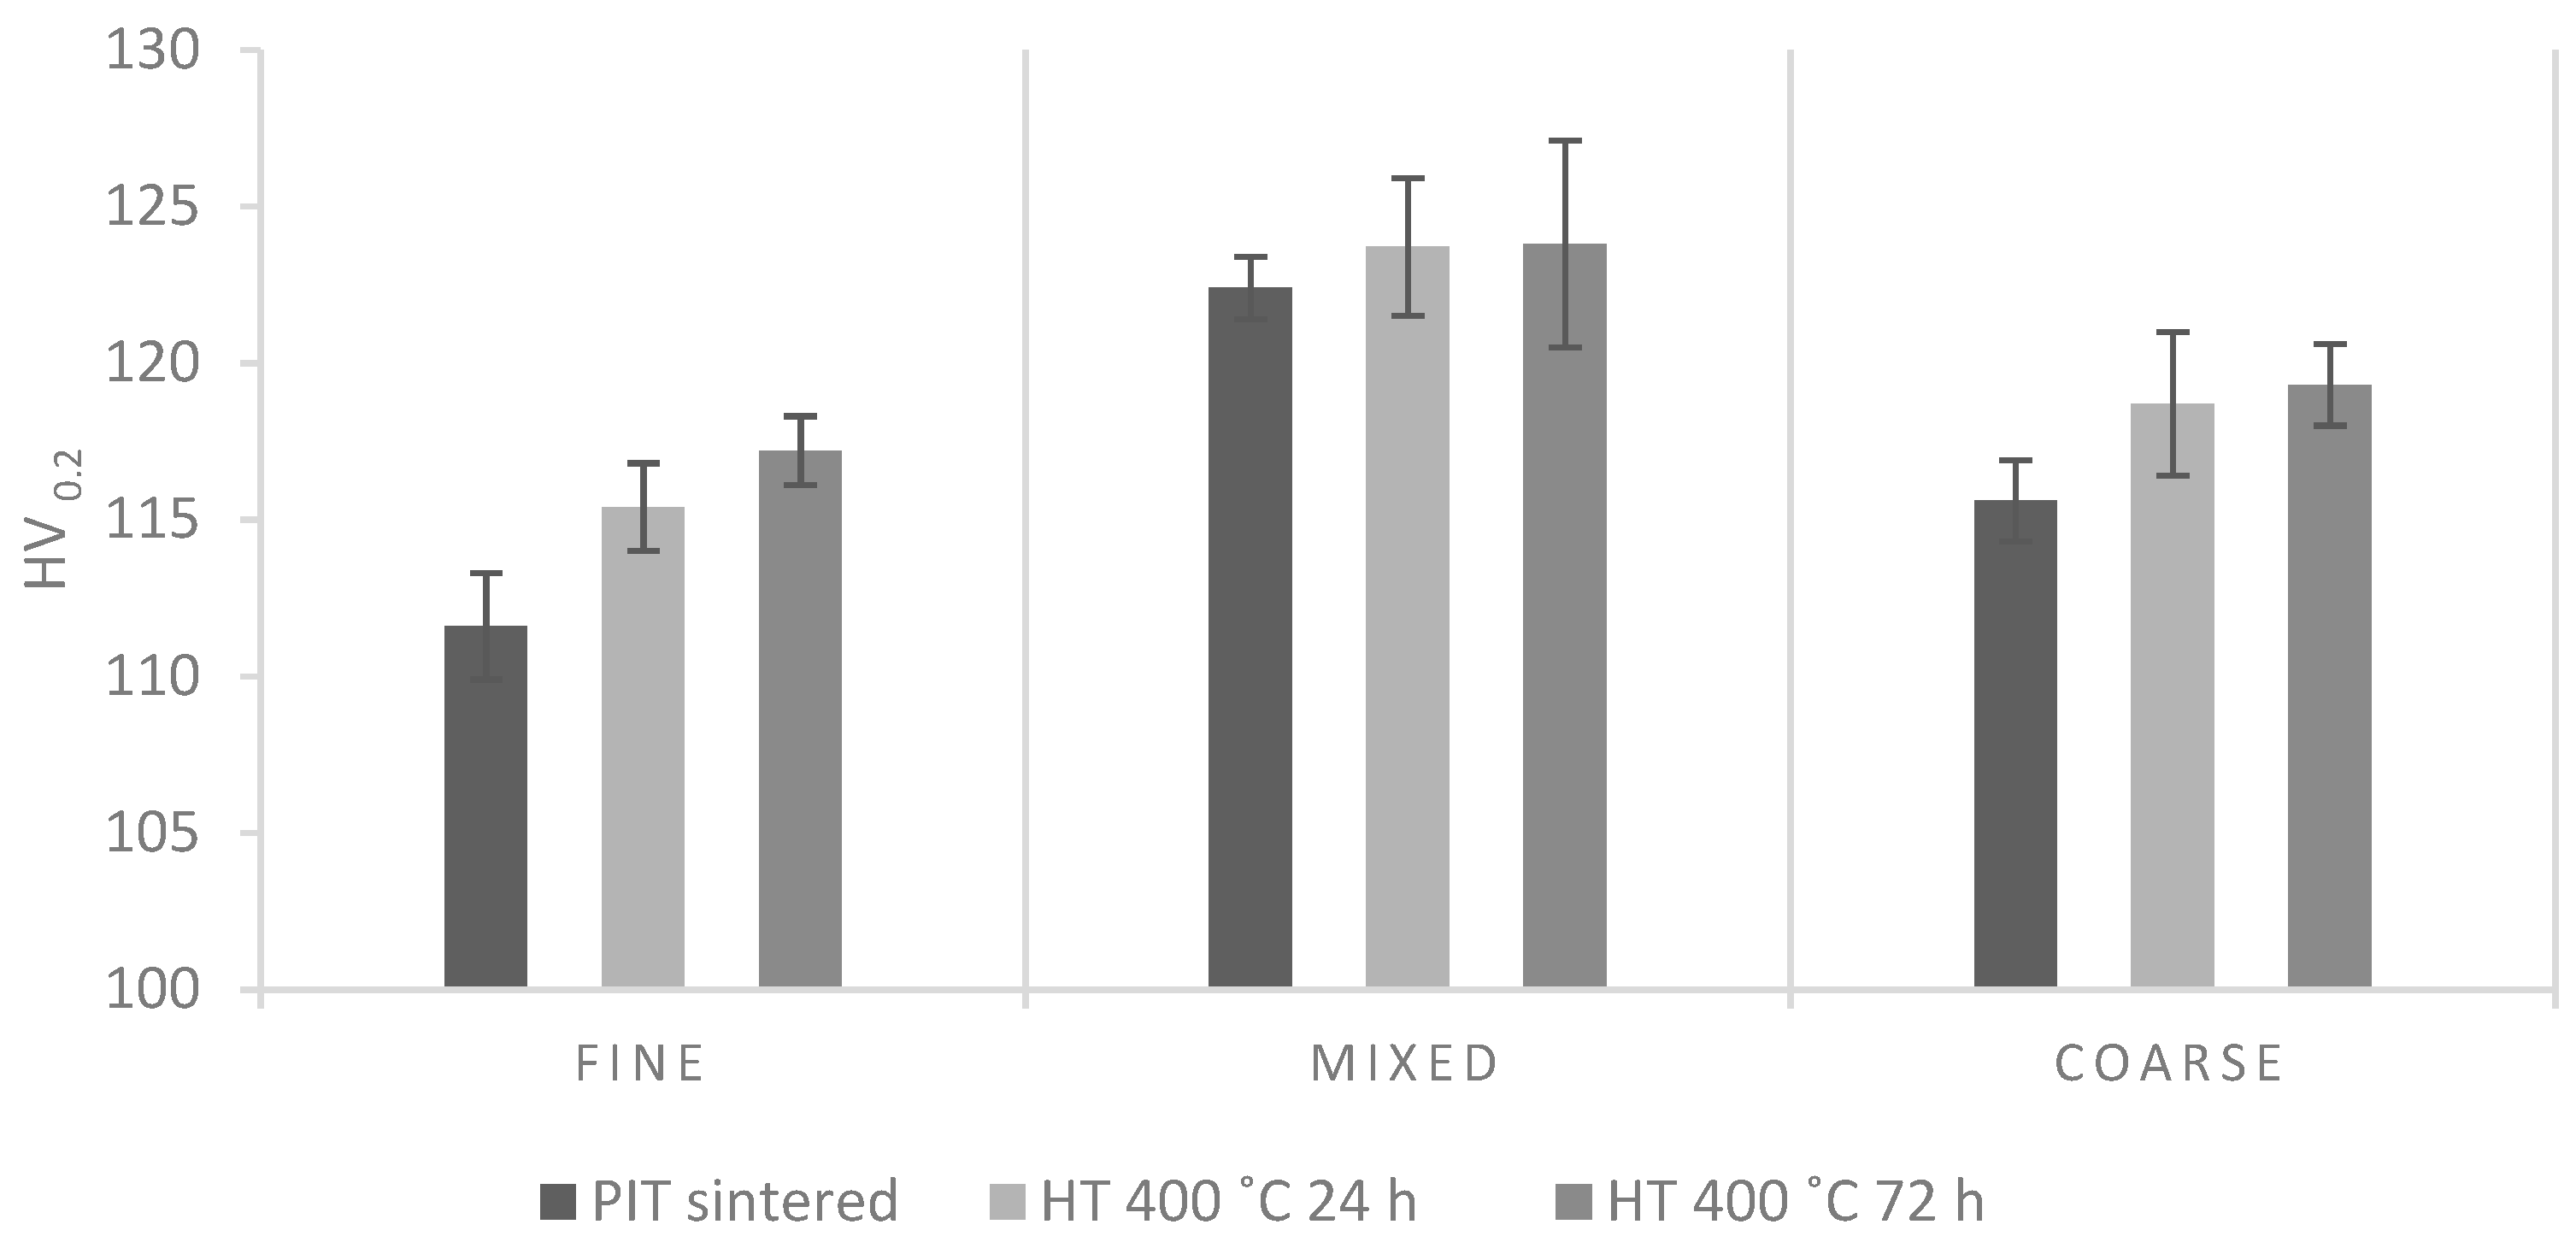
| 3 | fine powder Al-8Ce-10Mg wt % | 450 | 3 | fine-RT | RT | |
| fine-HT24h | 400 | 24 | ||||
| fine-HT72h | 400 | 72 | ||||
| 3 | mixed 50-50 Al-8Ce-10Mg wt % | 450 | 3 | mixed-RT | RT | |
| mixed-HT24h | 400 | 24 | ||||
| mixed-HT72h | 400 | 72 | ||||
| 3 | coarse Al-8Ce-10Mg wt % | 450 | 3 | coarse-RT | RT | |
| coarse-HT24h | 400 | 24 | ||||
| coarse-HT72h | 400 | 72 |


References
- Sims, Z.; Rios, O.; McCall, S.; Van Buuren, T.; Ott, R. Characterization of Near Net-Shape Castable Rare Earth Modified Aluminum Alloys for High Temperature Application. In Light Metals; Springer: Cham, Switzerland, 2016; pp. 111–114. [Google Scholar] [CrossRef]
- Sims, Z.C.; Rios, O.R.; Weiss, D.; Turchi, P.E.; Perron, A.; Lee, J.R.; Willey, T.M. High performance aluminum–cerium alloys for high-temperature applications. Mater. Horiz. 2017, 4. [Google Scholar] [CrossRef] [Green Version]
- Sims, Z.; Weiss, D.; McCall, S.; McGuire, M.; Ott, R.; Geer, T.; Turchi, P. Cerium-based, intermetallic-strengthened aluminum casting alloy: High-volume co-product development. JOM 2016, 68, 1940–1947. [Google Scholar] [CrossRef]
- Gao, M.; Ünlü, N.; Shiflet, G. Reassessment of Al-Ce and Al-Nd binary systems supported by critical experiments and first-principles energy calculations. Metall. Mater. Trans. A 2005, 3269–3279. [Google Scholar] [CrossRef] [Green Version]
- Okamoto, H. Al-Ce (Aluminum-Cerium). J. Phase Equilib. Diffus. 2011, 32, 392. [Google Scholar] [CrossRef]
- Cao, Z.; Kong, G.; Che, C.; Wang, Y.; Peng, H. Experimental investigation of eutectic point in Al-rich Al-La, Al-Ce, Al-Pr and Al-Nd systems. J. Rare Earths 2017, 35, 1022–1028. [Google Scholar] [CrossRef]
- Okamoto, H. Al-Ce (Aluminum-Cerium). J. Phase Equilib. Diffus. 1998, 19, 396. [Google Scholar] [CrossRef]
- Bodukuri, A.K.; Eswaraiah, K.; Rajendar, K.; Sampath, V. Fabrication of Al–SiC–B4C metal matrix composite by powder metallurgy technique and evaluating mechanical properties. Perspect. Sci. 2016, 8, 428–431. [Google Scholar] [CrossRef] [Green Version]
- Glowacki, B.A.; Majoros, M.; Vickers, M.; Evetts, J.E.; Shi, Y. Superconductivity of powder-in-tube MgB2 wires. Supercond. Sci. Technol. 2001, 14, 193–199. [Google Scholar] [CrossRef]
- Jin, S.; Mavoori, H.; Bower, C.; Van Dover, R. High critical currents in iron-clad superconducting MgB2 wires. Nature 2001, 411, 563–565. [Google Scholar] [CrossRef] [PubMed]
- Bindi, L.; Yao, N.; Lin, C.; Hollister, L.; Andronicos, C.; Distler, V.; Effy, M.; Kostin, A.; Kryachko, V.; MacPherson, G.; et al. Decagonite, Al71Ni24Fe5, a quasicrystal with decagonal symmetry from the Khatyrka CV3 carbonaceous chondrite. Am. Miner. 2005, 100, 2340–2343. [Google Scholar] [CrossRef]
- Buschow, K.H.J.; Van Engen, P.G.; Jongebreur, R. Magneto-optical properties of metallic ferromagnetic materials. J. Magn. Magn. Mater. 1983, 38, 1. [Google Scholar] [CrossRef]
- Shabestari, S.G. The effect of iron and manganese on the formation of intermetallic compounds in aluminum-silicon alloys. Mater. Sci. Eng. A 2004, 383, 289–298. [Google Scholar] [CrossRef]
- Bian, Z.; Dai, S.; Wua, L.; Chen, Z.; Wang, M.; Chen, D.; Wang, H. Thermal stability of Al–Fe–Ni alloy at high temperatures. J. Mater. Res. Technol. 2019, 8, 2538–2548. [Google Scholar] [CrossRef]


| Element | wt % | |||
|---|---|---|---|---|
| Spectrum 1 Al-8Ce | Spectrum 2 Al-8Ce | Spectrum 3 Al-8Ce | Spectrum 3 Al-14Ce | |
| Al | 68.25 | 68.97 | 7.3 | 6.7 |
| Ce | 18.96 | 0 | 92.7 | 93.3 |
| Cr | 12.25 | 0 | 0 | 0 |
| Ni | 0.54 | 15.92 | 0 | 0 |
| Fe | 0 | 15.11 | 0 | 0 |
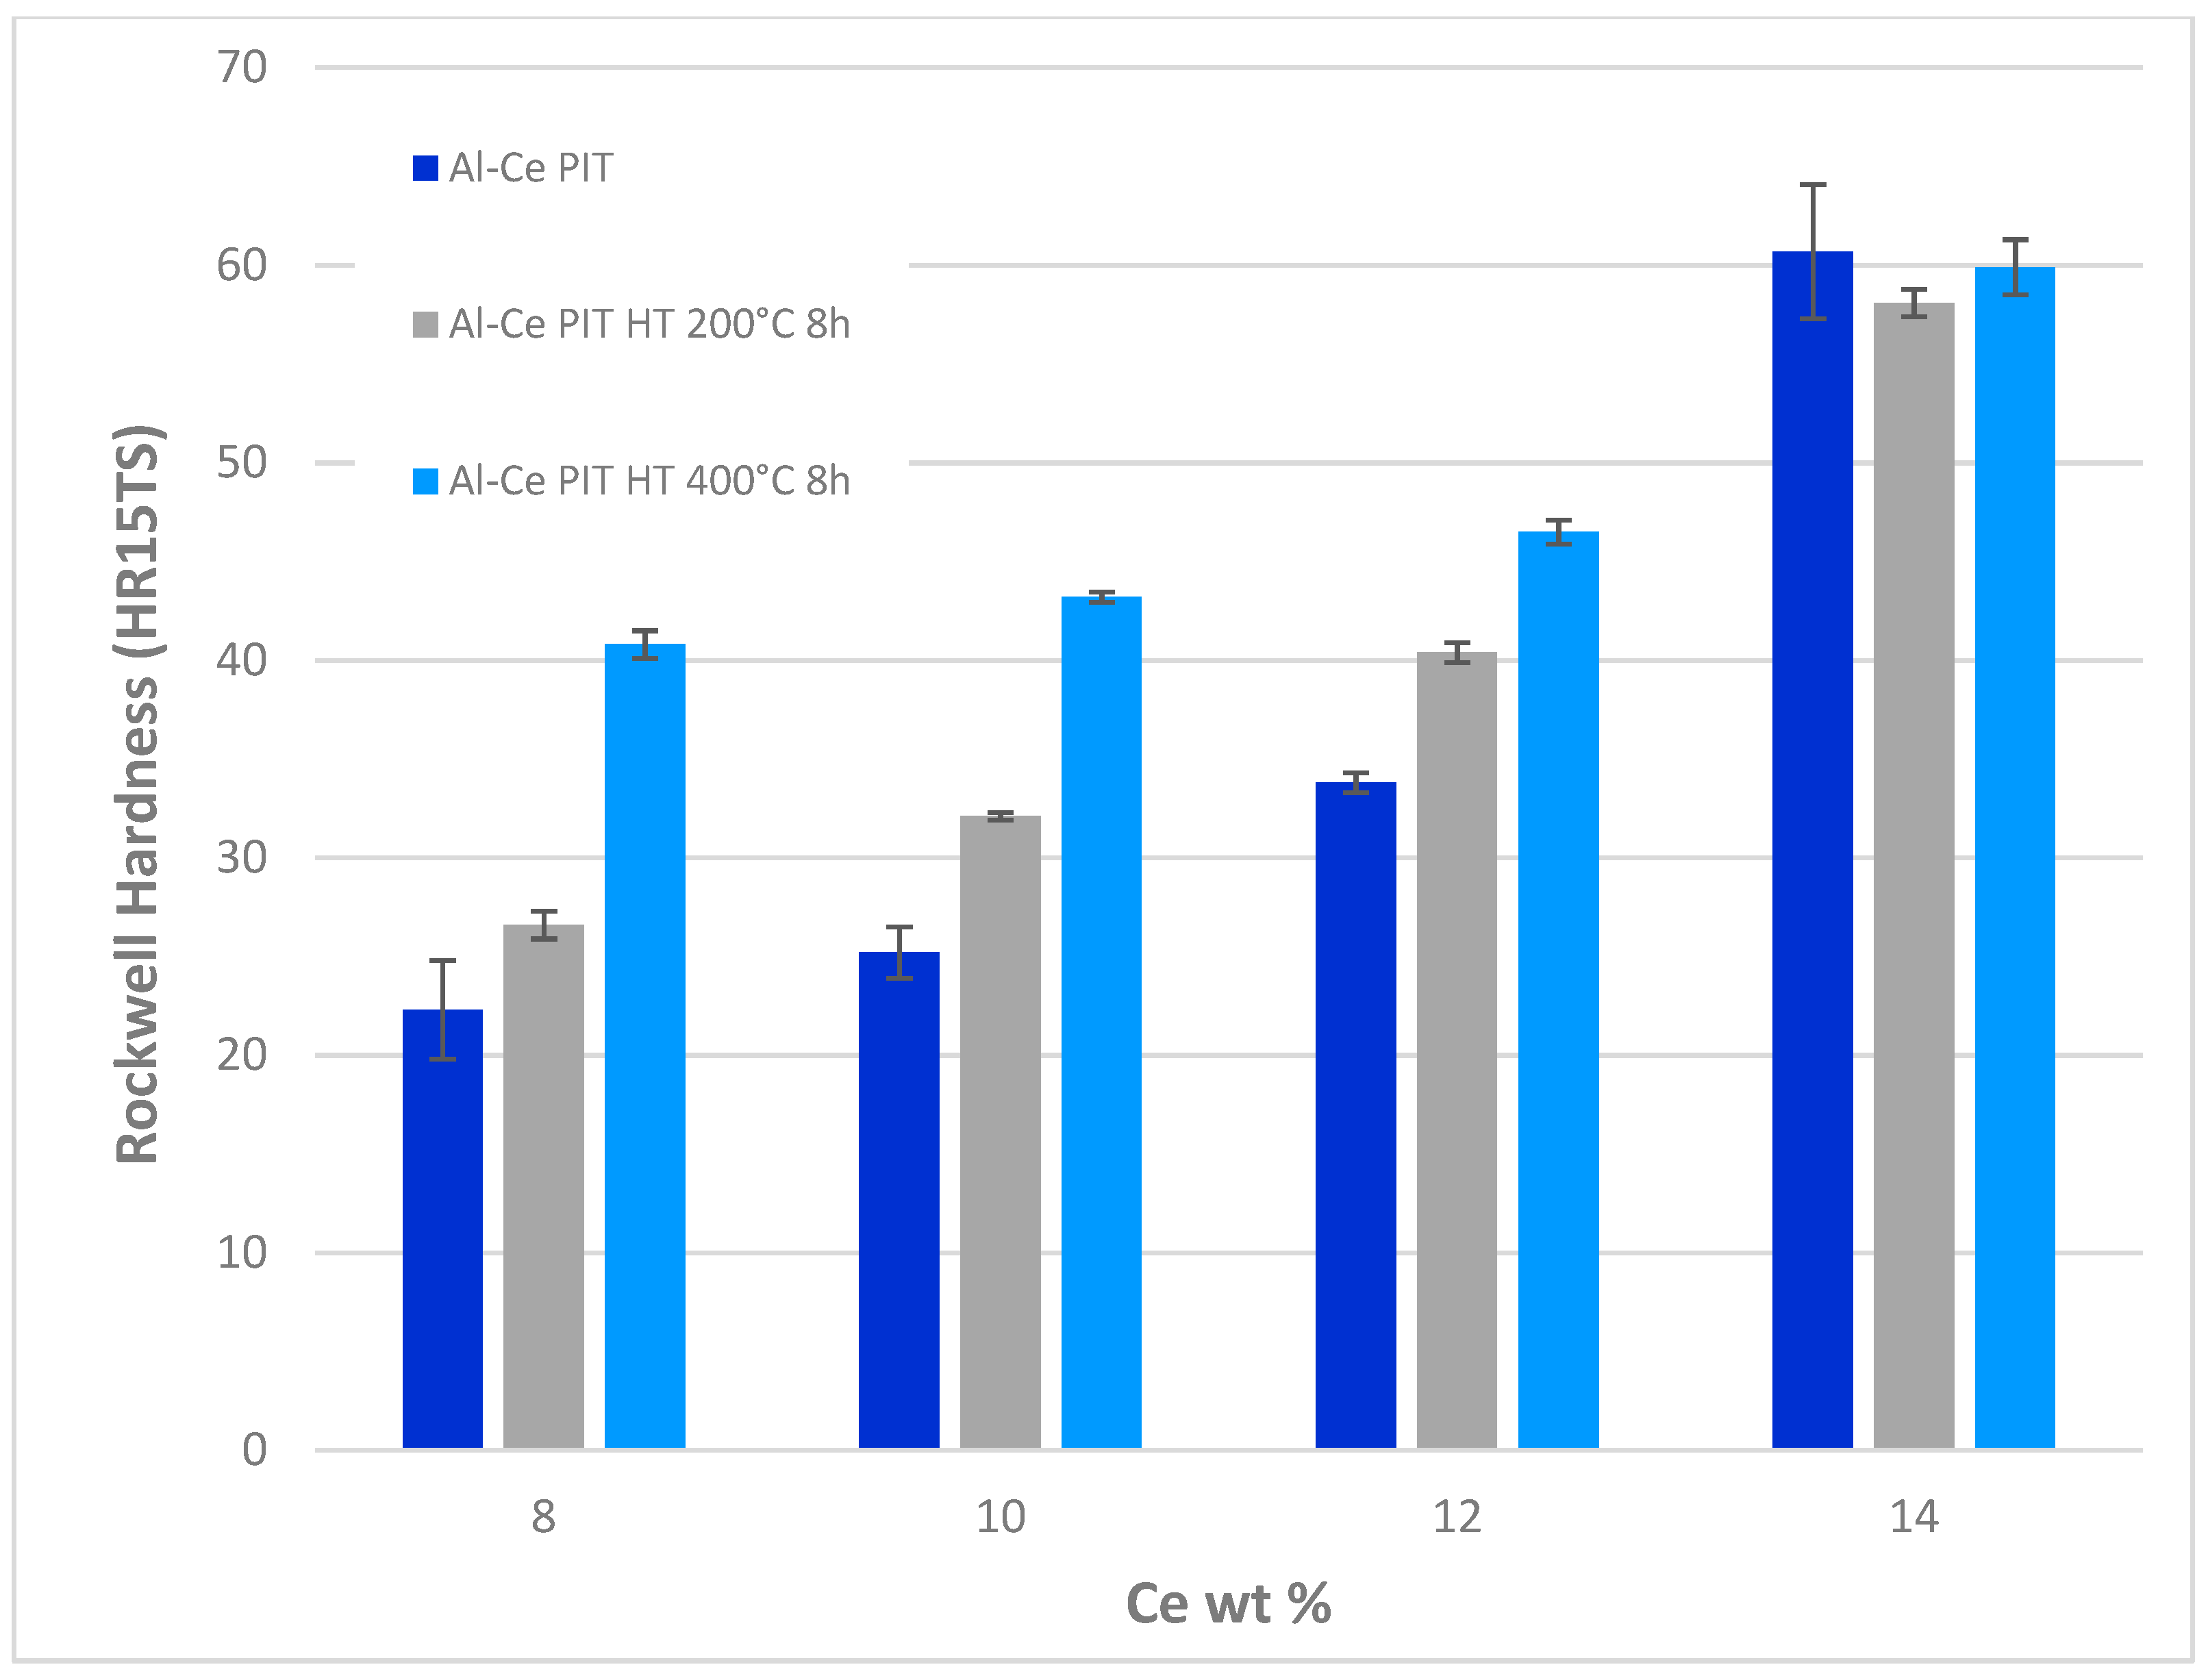
| Cerium Content (wt %) | ||||||||||||||||||||||||
|---|---|---|---|---|---|---|---|---|---|---|---|---|---|---|---|---|---|---|---|---|---|---|---|---|
| PIT | PIT Heat Treated (200 °C 8 h) | PIT Heat Treated (400 °C 8 h) | ||||||||||||||||||||||
| 8 | 10 | 12 | 14 | 8 | 10 | 12 | 14 | 8 | 10 | 12 | 14 | |||||||||||||
| HR | 22.3 | 25.2 | 33.8 | 60.7 | 26.6 | 32.1 | 40.4 | 58.1 | 40.8 | 43.2 | 46.5 | 59.9 | ||||||||||||
| s.e. | 2.5 | 1.3 | 0.5 | 3.4 | 0.7 | 0.2 | 0.5 | 0.7 | 0.7 | 0.25 | 0.6 | 1.4 | ||||||||||||
| Density (g/cm3) | |||
|---|---|---|---|
| Al-Ce wt % | PIT | PIT Heat Treat. 200 °C 8 h | PIT Heat Treat. 400 °C 8 h |
| 8% | 2.716 | 2.734 | 2.747 |
| 10% | 2.760 | 2.772 | 2.810 |
| 12% | 2.812 | 2.817 | 2.839 |
| 14% | 2.849 | 2.966 | 2.972 |
Publisher’s Note: MDPI stays neutral with regard to jurisdictional claims in published maps and institutional affiliations. |
© 2021 by the authors. Licensee MDPI, Basel, Switzerland. This article is an open access article distributed under the terms and conditions of the Creative Commons Attribution (CC BY) license (https://creativecommons.org/licenses/by/4.0/).
Share and Cite
Vázquez, M.; Suárez, O.M.; Thompson, M.; Jang, H.; Gong, N.; Weiss, D.; Rios, O. Effect of Ce Content on Properties of Al-Ce-Based Composites by Powder-in-Tube Method. J. Compos. Sci. 2021, 5, 255. https://0-doi-org.brum.beds.ac.uk/10.3390/jcs5100255
Vázquez M, Suárez OM, Thompson M, Jang H, Gong N, Weiss D, Rios O. Effect of Ce Content on Properties of Al-Ce-Based Composites by Powder-in-Tube Method. Journal of Composites Science. 2021; 5(10):255. https://0-doi-org.brum.beds.ac.uk/10.3390/jcs5100255
Chicago/Turabian StyleVázquez, Mairym, Oscar Marcelo Suárez, Michael Thompson, Haneul Jang, Na Gong, David Weiss, and Orlando Rios. 2021. "Effect of Ce Content on Properties of Al-Ce-Based Composites by Powder-in-Tube Method" Journal of Composites Science 5, no. 10: 255. https://0-doi-org.brum.beds.ac.uk/10.3390/jcs5100255