Article

Dielectric Spectroscopy of Melt-Mixed Polypropylene and Pyrolytically Stripped Carbon Nanofiber Composites

by
Zineb Samir
1,
Antonio J. Paleo
2,*,
Najoia Aribou
1,
Yassine Nioua
1,
Jaime Oliveira da Silva
3,
Maria F. Cerqueira
4,5,
Joaquim Agostinho Moreira
6 and
Mohammed E. Achour
1
1
Laboratory of Material Physics and Subatomic, Faculty of Sciences, Ibn Tofail University, BP 242, Kenitra 14000, Morocco
2
2C2T-Centre for Textile Science and Technology, University of Minho, Campus de Azurém, 4800-058 Guimarães, Portugal
3
CFisUC, Department of Physics, University of Coimbra, Rua Larga, 3004-516 Coimbra, Portugal
4
INL—International Iberian Nanotechnology Laboratory, Av. Mestre. Jose Veiga, 4715-330 Braga, Portugal
5
CFUM—Center of Physics of the University of Minho, Campus de Gualtar, 4710-057 Braga, Portugal
6
IFIMUP and IN-Institute of Nanoscience and Nanotechnology, Departamento de Física e Astronomia, Faculdade de Ciências da Universidade do Porto, Rua do Campo Alegre 687, 4169-007 Porto, Portugal
*
Author to whom correspondence should be addressed.
J. Compos. Sci. 2022, 6(12), 368; https://0-doi-org.brum.beds.ac.uk/10.3390/jcs6120368
Submission received: 25 October 2022 / Revised: 5 November 2022 / Accepted: 30 November 2022 / Published: 5 December 2022
(This article belongs to the Special Issue Polymer Composites and Fibers)

Abstract

:
In this work, pyrolytically stripped carbon nanofiber (CNF) polypropylene (PP) composites were synthesized following a scalable melt-mixing method, and the effects of CNF weight concentrations on the electrical conductivity, dielectric permittivity, electrical modulus and electrical impedance of PP/CNF composites were studied. Quite unexpectedly, the electrical conductivity of PP/CNF composites improved only slightly as the incorporation of CNFs was raised, yielding a maximum of ~10−10 S m−1 for PP/CNF 5 wt. % composites. The increase corresponded to a gradual improvement of the dielectric constant up to a maximum of ~9 for PP/CNF 5 wt. % composites at 1 MHz, which was attributed to the raise of interface polarization effect. Moreover, the Cole–Cole model was used to analyze the effects of CNF concentrations on the dielectric relaxation of PP/CNF composites, from which was deduced that the incorporation of CNFs increases their dielectric strength and relaxation times. The analysis gathered here aims to provide a better insight into the enhanced dielectric properties observed in low-conducting polymer composites filled with CNFs.

1. Introduction

Electrically conductive polymer composites (CPCs) based on insulating polymers have been studied with much interest during recent decades since they are utilized in a wide variety of applications including circuit boards, leakage current controllers, passive protection, electromagnetic interference (EMI) shielding, etc. [1,2,3,4,5]. In this respect, the increasing request for lightweight advanced materials in the car and aviation industries has guided specialists to use carbon materials as alternatives to metal fillers in the production of CPCs [6]. Due to their remarkable electrical conductivities (σ~104 S m−1), the vapor-grown carbon nanofibers (CNFs), produced by chemical vapor deposition (CVD) of catalyst nanoparticles under a mixture of gaseous hydrocarbons [7], constitute an attractive option among other carbon materials such as carbon black (CB), carbon nanotubes (CNTs), and graphene [8,9]. In particular, the vapor-grown carbon nanofibers manufactured by Applied Sciences, Inc. (Cedarville, OH, USA) since 1991 have been largely investigated in the production of CPCs [10]. More specifically, the CNFs provided by this company and labeled as Pyrograf®-III vary in their diameter (PR 24 < PR 19~PR 25) and grade (PS, LHT, or HHT), which defines the as-grown CNFs thermal post-treatment from lower to higher temperatures, respectively [11]. Morphologically, the Pyrograf®-III CNFs have tubular hollow cores surrounded by ordered inner stacked-cup and disordered outer layers, and lengths and diameters ranging from 50 to 100 µm, and 50 to 200 nm, respectively [12,13].
In developing CPCs, on the one hand, melt mixing is preferred to solution processing since the production in melt state permits obtaining large material volumes and prevents the need for using toxic solvents [14]. On the other hand, because polypropylene (PP) is one of the most widely used commodity thermoplastics with adequate physical properties at low cost [15], the production of CPCs based on CNFs and PP by melt-mixing has been the subject of extensive investigation [16,17]. Notably, the broad dispersion of electrical conductivity reported for all these melt-mixed PP/CNF composites shows that the root causes of their electrical properties are far from being completely resolved [18]. Moreover, despite intensive research on the production and further analysis of carbon-based CPCs with outstanding electrical conductivities [5], research on low-conducting carbon-based polymer composites with enhanced dielectric properties is still limited. In this regard, it is noted that CPCs must have high dielectric constants and low dielectric losses for electric charge storage applications [19]; therefore, this study is addressed within this framework. Specifically, previous work involving the improved dielectric permittivity of PP composites melt-mixed with different contents of pyrolytically stripped (PS) Pyrograf®-III carbon nanofibers [20] is revisited in this study. Currently, the effects of CNFs on the AC electrical conductivity and dielectric permittivity of PP/CNF composites are discussed under the electrical modulus formalism, from which the phenomenological Cole-Cole model is utilized. Furthermore, the AC impedance is analyzed with the aim of understanding better the physics governing the enhanced, quite stable dielectric constants, and low dielectric loses of this type of dielectric materials.

2. Materials and Methods

2.1. Materials

The constituent materials of all the studied polymer composites are PP powder Daplen™ EE002AE (Borealis AG, Vienna, Austria), and Pyrograf®-III PR 25 PS XT carbon nanofibers (ASI, Cedarville, OH, USA). PR 25 PS XT CNFs are produced by CVD at 1100 °C. They have average outer diameters between 125 and 150 nm and lengths of 50–100 µm over a graphitic tubular core. According to the manufacturer, the PS label means that the as-produced CNF has been pyrolytically stripped to remove polyaromatic hydrocarbons (PAH) from the surface. Moreover, the as-produced PR 25 PS XT CNFs are subjected to a debulked process (labeled as XT) to improve their dispersion within the polymer. Their average bulk densities range from 0.0192 to 0.0480 g/cm3 [20,21,22].

2.2. Polymer Composites Processing

PP/CNF composites were fabricated on a modular lab-scale intermeshing mini-co-rotating twin-screw extruder, with a screw diameter of 13 mm, a barrel length of 31 cm, and an approximate L/D ratio of 26, coupled to a cylindrical rod dye of approximate 2.85 mm of diameter. A well-documented description of the melt extrusion conditions has been previously published [23]. The extruded PP/CNF composites were pelletized and pressed into compression-molded specimens with the appropriate square-form geometries for AC electrical measurements. In this work, six different samples were prepared with weight % concentrations between 0 and 5 wt. % CNF.

2.3. Morphological and Structural Analysis

Morphological characterization and CNF dispersion of the PP/CNF composites were examined using a scanning electron microscope (SEM) (JSM-6400, JEOL Ltd., Tokyo, Japan) at an accelerating voltage of 20 kV. The samples were broken under cryogenic conditions and then sputter-coated with a thin layer of gold before testing. An analytical transmission electron microscope (TEM) (JEM-1010, JEOL Ltd., Tokyo, Japan) was used to observe the morphology of the CNF. CNFs were dispersed in isopropanol and a drop was placed in a grid for direct observation. Infrared measurements (FTIR) (IRAffinity-1S, Shimadzu, Kyoto, Japan) were performed at room temperature in transmission mode from 600 to 2000 cm−1. FTIR spectra were collected with 40 scans and a resolution of 4 cm−1. Raman spectroscopy measurements were carried out on a Confocal Raman Microscope (ALPHA300 R, WITec GmbH, Ulm, Germany) using a 532 nm laser for excitation in backscattering geometry. The laser beam, with P = 1.5 mW, was focused on the sample by ×50 lens (Zeiss, Jena, Germany), and the spectra were collected with 600 groove/mm grating using 10 acquisitions with 2 s acquisition time.

2.4. Electrical Measurements

Squared films of dimensions 0.5 × 10 × 10 mm3 with Au electrodes deposited in both sides by thermal evaporation method were prepared for the AC electrical analysis. The capacity C and dielectric losses t a n   δ of the produced films were measured using a Quadtech 1929 LCR precision meter (Maynard, WI, USA) at room temperature at frequencies between 200 Hz and 2 MHz with an applied signal of 0.5 V. The real ε ( ω ) and the imaginary ε ( ω ) parts of the complex dielectric permittivity ε * ( ω ) were calculated using the equations:
ε ( ω ) = C   ( ω ) · d ε 0 A  
ε ( ω ) = ε ( ω ) t a n δ ( ω )  
Here, d is the thickness, A is the surface area of the squared films (10 × 10 mm2), ε 0 is the permittivity of vacuum (8.85 × 10⁻¹² F m−1), and ω = 2 π f is the circular frequency.
The electrical complex modulus M * ( ω ) was calculated by:
M * ( ω ) = 1 ε * ( ω ) = M ( ω ) + i M ( ω )
Here, M ( ω ) and M ( ω ) are the real and imaginary parts of the electrical complex modulus, which can be expressed by using the complex dielectric permittivity [24]:
M ( ω ) = ε ( ω ) ( ε 2 ( ω ) + ε 2 ( ω ) )
The complex impedance Z * ( ω ) was obtained from ε * ( ω ) using the following relations [25]:
Z * ( ω ) = Z ( ω ) + j Z ( ω ) = i ω C 0 ε * ( ω )
Z ( ω ) = 1 2 π f C 0 [ ε ( ω ) ε ( ω ) + ε ( ω ) ]
Here, Z ( ω ) and Z ( ω ) are the real and imaginary parts of Z * ( ω ) , and C 0 is the capacitance of vacuum [26].

3. Results and Discussion

3.1. Morphological and Structural Analysis

The morphologies of both neat CNF and PP/CNF samples were characterized to understand the influence of CNF on the physical properties of filled PP composites. A representative TEM image of an individual CNF is shown in Figure 1a. A tubular core surrounded by two different structural layers can be seen. The inner layer is comprised of crystalline graphite basal planes stacked at a certain angle from the longitudinal axis of the nanofiber. This structure generated a CNF with exposed edge planes along the hollow core and the outer layer [22]. However, the graphene sheets in the outer layer were not as evident as in the inner layer. Overall, the total diameter was around 120 nm, whereas the surrounding layers showed a diameter of ~30 nm. The SEM of the 2 wt. % CNF filled PP/CNF composite shown in Figure 1b demonstrates that the CNFs have some tendency to agglomerate. At this point, it must be noted that the PR 25 PS XT CNFs used in this study have a lower aspect ratio than other Pyrograf®-III grades such as PR 24 LHT XT and PR 19 LHT XT, which would explain their worse dispersion [23].
Figure 2a presents the FTIR spectra at room temperature of neat PP and the polypropylene filled with 1, 3, and 5 wt. % CNFs, in the 600–2000 cm−1 range. The PP showed one band at 840 cm−1 assigned to CH2 rocking and C-CH3 stretching vibrations [27]. More bands were observable: at 973 cm−1, ascribed to CH3 rocking, CH2 wagging and CH bending vibrations; at 998 cm−1, imputed to CH bending and wagging vibrations and CH3 rocking vibration; at 1170 cm−1, assigned to CH2 twisting and CH wagging vibrations. Finally, between 1290 and 1500 cm−1, the PP showed the characteristic bands ascribed to the symmetric and asymmetric bending of CH3 [28]. The peaks previously ascribed to the PP remained unaffected in 1, 3, and 5 wt. % PP/CNF composites, though a reduction in the intensity of the peaks was detected as the CNF content increased in PP/CNF composites. Additionally, a decrease of transmittance between 600 and 800 cm−1, attributed to the CNF, was observed in all PP/CNF composites.
Figure 2b shows the Raman spectra obtained from PP and PP/CNF composites with 1, 3, and 5 wt. % CNFs, in the 600–2000 cm−1 range. Polypropylene showed rich Raman spectra with modes in the range 800–1500 cm−1 assigned to CHn vibrations [29,30]. Notably, the most intense modes of PP (dotted lines in Figure 2b) were clearly observable in PP/CNF 1 wt. % composites, along with the G-band at 1580 cm−1 belonging to CNFs, and characteristic of the ideal graphitic lattice vibration of carbon materials [31]. Moreover, peaks 1 and 2 of PP hide the disordered-induced D-band of CNFs at 1352 cm−1, observable when defects are present in the aromatic structure of carbon materials [32], in PP/CNF 1 wt. % composites. However, the D peak was present in PP/CNF 1 wt. % composites, as could be seen by the increased background signal of PP peaks 1 and 2. Interestingly, the peak at 1460 cm−1, corresponding to PP (numbered 3 in Figure 2b), showed practically the same intensity as the D and G bands in the PP/CNF 3 wt. % composite, and the D mode in this latter composite became more clearly seen, although with a slight presence of PP modes (enumerated as 1 and 2 in Figure 2b). Finally, only modes D and G corresponding to the CNFs were appreciable in the PP/CNF 5 wt. % composite. The Raman spectra was fitted with Lorentzian functions to obtain the peak position and respective full-width-half-maximum (FWHM) of modes. It must be noted that this fitting provided the intensity ratios among modes, which could not only be used to compare the same component in the polymer composite, but also to compare modes between the different components. The main parameters obtained are shown in Table 1. Thus, wG and wD were the mean maximum peak position of the G and D peaks (in cm−1), respectively. FWHMG and FWHMD were the full widths at half maximum of the G and D peaks (in cm−1), respectively, and ID and IG corresponded to the maximum intensity of the D and G peaks. In particular, the intensity ratios ID/IG of the CNF, and the intensity ratios between the G mode of CNF and the mode numbered as 2 of the PP (IG/IPP), are presented. Table 1 also shows the average graphitic size obtained according to La(nm) = 4.4/(ID/IG) [33]. The peak positions of G and D modes from CNFs were practically the same for all PP/CNF composites. The same happened with their respective FWHMG and FWHMD. However, the ID/IG of PP/CNF composites decreased clearly with the increased wt. % content of the CNF, indicating that their disorder became more pronounced as the CNF concentration increased [34]. Moreover, La increased with the increasing concentration of the CNFs, which can be explained by the enhancement of crystallinity in the PP/CNF composites [35]. As mentioned before, the presence of the PP modes decreased as the CNF content increased in the composites. This effect was clearly seen by the increase of the intensity ratio between the G mode from the CNFs and mode 2 of the PP (IG/IPP) in PP/CNF 1 wt. % and PP/CNF 3 wt. % composites, with this mode 2 becoming absent in the Raman spectra for PP/CNF 5 wt. %.

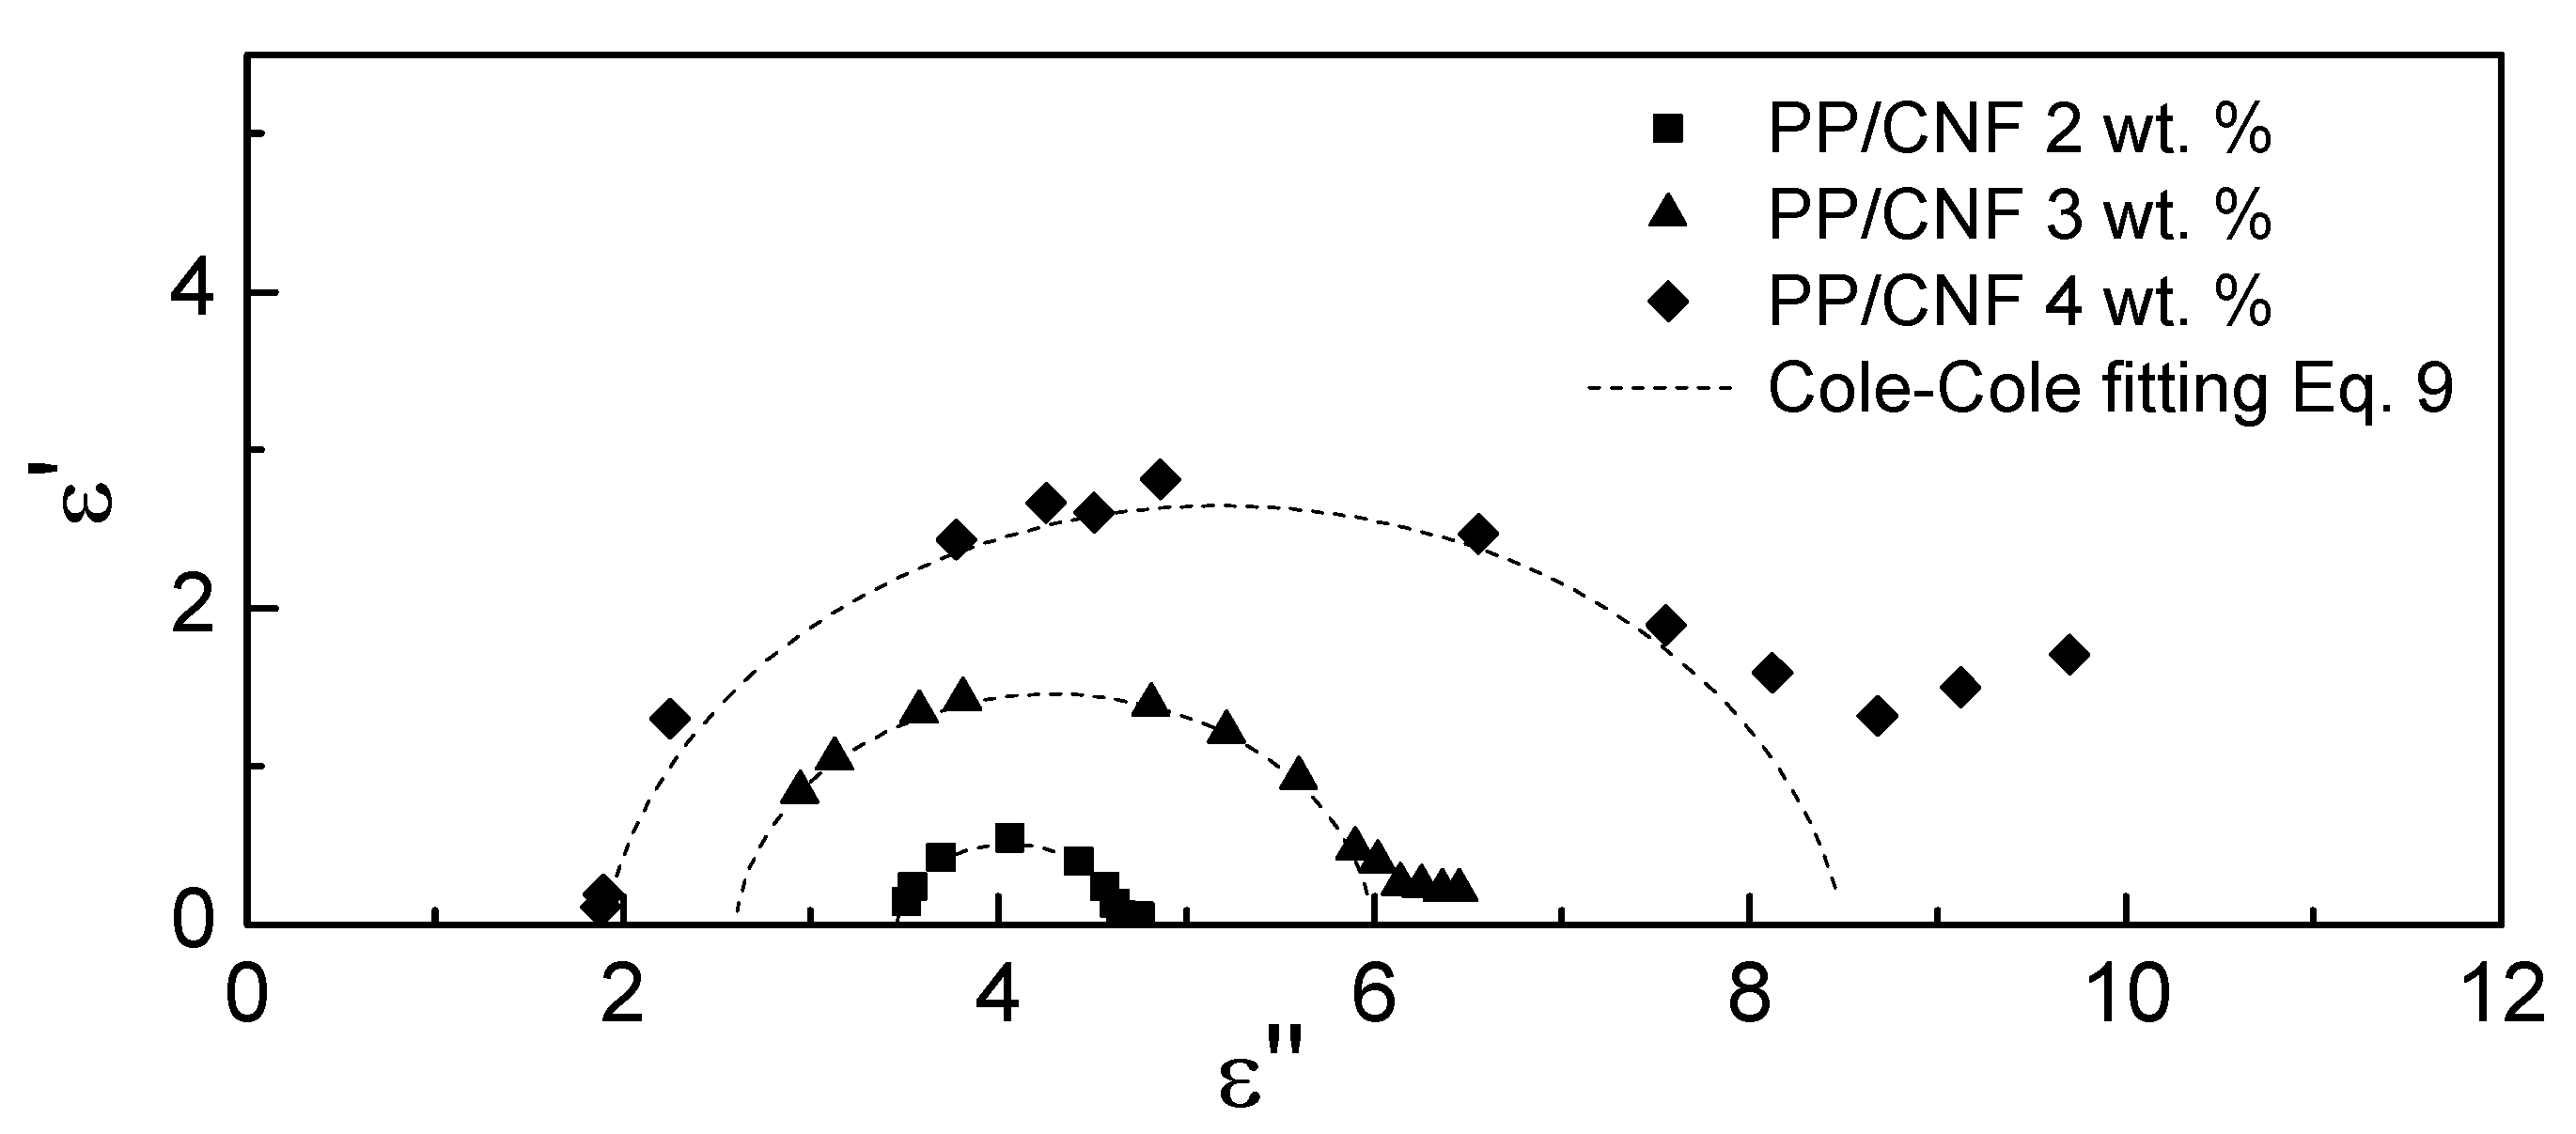
3.2. Electrical Analysis and Cole-Cole Modeling

The AC electrical conductivity σAC (ω) from 200 to 2 × 10⁶ Hz and at room temperature for the PP/CNF composites is shown in Figure 3. At a first sight, σAC (ω) increased with the rise of the CNFs. Moreover, the σAC (ω) of the PP/CNF composites with up to 4 wt. % CNFs was linearly dependent over the entire frequency range, which can be associated with a nearly insulating character. In contrast, σAC (ω) was almost frequency independent for PP/CNF 5 wt. % composites in the low-frequency regime. This latter finding points to a slight transition towards higher levels of conductivity in PP/CNF composites filled with CNF content of 4 wt. % and 5 wt. %. However, the highest levels of conductivity achieved in PP/CNF 5 wt. % composites were always within the range of insulator materials [36]. Interestingly, these values were similar to the PP composites melt-extruded with a different grade of CNFs (PR 24 PS), produced by the same manufacturer (ASI, Cedarville, OH, USA), for which values of~10−10 S m−1 have been reported for PP filled with 5 wt. % of CNFs [37]. Notably, it must be recognized that epoxy composites prepared with the same type of CNFs (Pyrograf®-III PR 25 PS XT) used in this study achieved values of ~10−3 S m−1 for CNF content of 1 wt. % [22], and thereby the origins of the low values of σAC found here were not clear.
Figure 4 depicts the frequency dependence from 200 to 2 × 10⁶ Hz of the dielectric permittivity of PP/CNF composites at room temperature. As Figure 4a shows, the ε ( ω ) of PP and PP/CNF 1 wt. % composites were similar and frequency independent over the entire frequency range. However, as the amount of CNFs increased in PP, ε ( ω ) became higher and frequency-dependent. There are different reasons to explain this ε ( ω ) enhancement. Of these, the Maxwell-Wagner-Sillars effect (MWS), defined as the charge accumulation produced at the conductor-insulator interface, is principally used in the literature to explain the noticeable increase of ε ( ω ) found at low frequencies in this type of polymer composite [38]. In particular, ε ( ω ) gradually changes from 2.4 for PP to 8.7 for PP/CNF 5 wt. % composites at 1 MHz. On the other hand, however, the ε ( ω ) depicted in Figure 4b is nearly frequency independent, with an increase from 0.005 for PP to 0.05 for PP/CNF 2 wt. % composites at 1 MHz. As expected from the σAC (ω) analysis, higher loadings of CNFs cause higher values of ε ( ω ) , and a change towards a frequency dependent behaviour [39]. This was reflected in an increase of the loss factor from 0.2 for PP/CNF 3 wt. % composites to 2.4 for PP/CNF 5 wt. % composites at 1 MHz.
The dielectric relaxation of PP/CNF composites with 2 wt. %, 3 wt. % and 4 wt. % of CNFs were analyzed in the framework of the Cole-Cole model [40]:
ε * ( ω ) = ε + ε s ε 1 + ( i ω τ ) 1 α
Here, ε is the relative permittivity at infinite frequency, ε s is the static relative permittivity at zero frequency, τ is the average relaxation time, ω is the angular frequency ( ω = 2 π f ), and α is the dispersion coefficient, which takes values in the range 0–1 [26]. Note that the absence of the Cole-Cole model analysis in the PP/CNF 1 wt. % and PP/CNF 5 wt. % samples was because no arc was found when ε ″ was represented as a function of ε ′ in the range of the frequencies tested in this study. As is shown in Figure 5, the three PP/CNF composites showed different curves. Thus, PP/CNF 2 wt. % composites showed the lowest relaxation corresponding to the semicircle with the smallest radius, while PP/CNF 4 wt. % composites showed the highest relaxation. In particular, PP/CNF composites with 3 wt. % and 4 wt. % of CNFs showed a straight line for low frequencies, which can be related to some conductance relaxation [41], although it has also been related to evidence of surface plasmons [42]. In general, the relaxation phenomenon observed in the three PP/CNF composites resulted from the polarization caused by the MWS in the interface between the PP and the CNFs, which increased as the content of the CNFs increased in the PP/CNF composites. As is seen in Figure 5, the Cole-Cole model presented a very good adjustment of the experimental values (Table 2). As expected, the dielectric strength represented by the values of ( ε s ε ) increased with CNF concentration [43]. The calculated α was close to 0 for the three PP/CNF composites, pointing to a limited dispersion of their respective relaxation times. In addition, the relaxation times of the polarization caused by the MWS in PP/CNF composites were between 0.2 and 0.8 μs. In this regard, it must be noted that the shorter the relaxation times are, the higher is the stability of the dielectric permittivity [44].

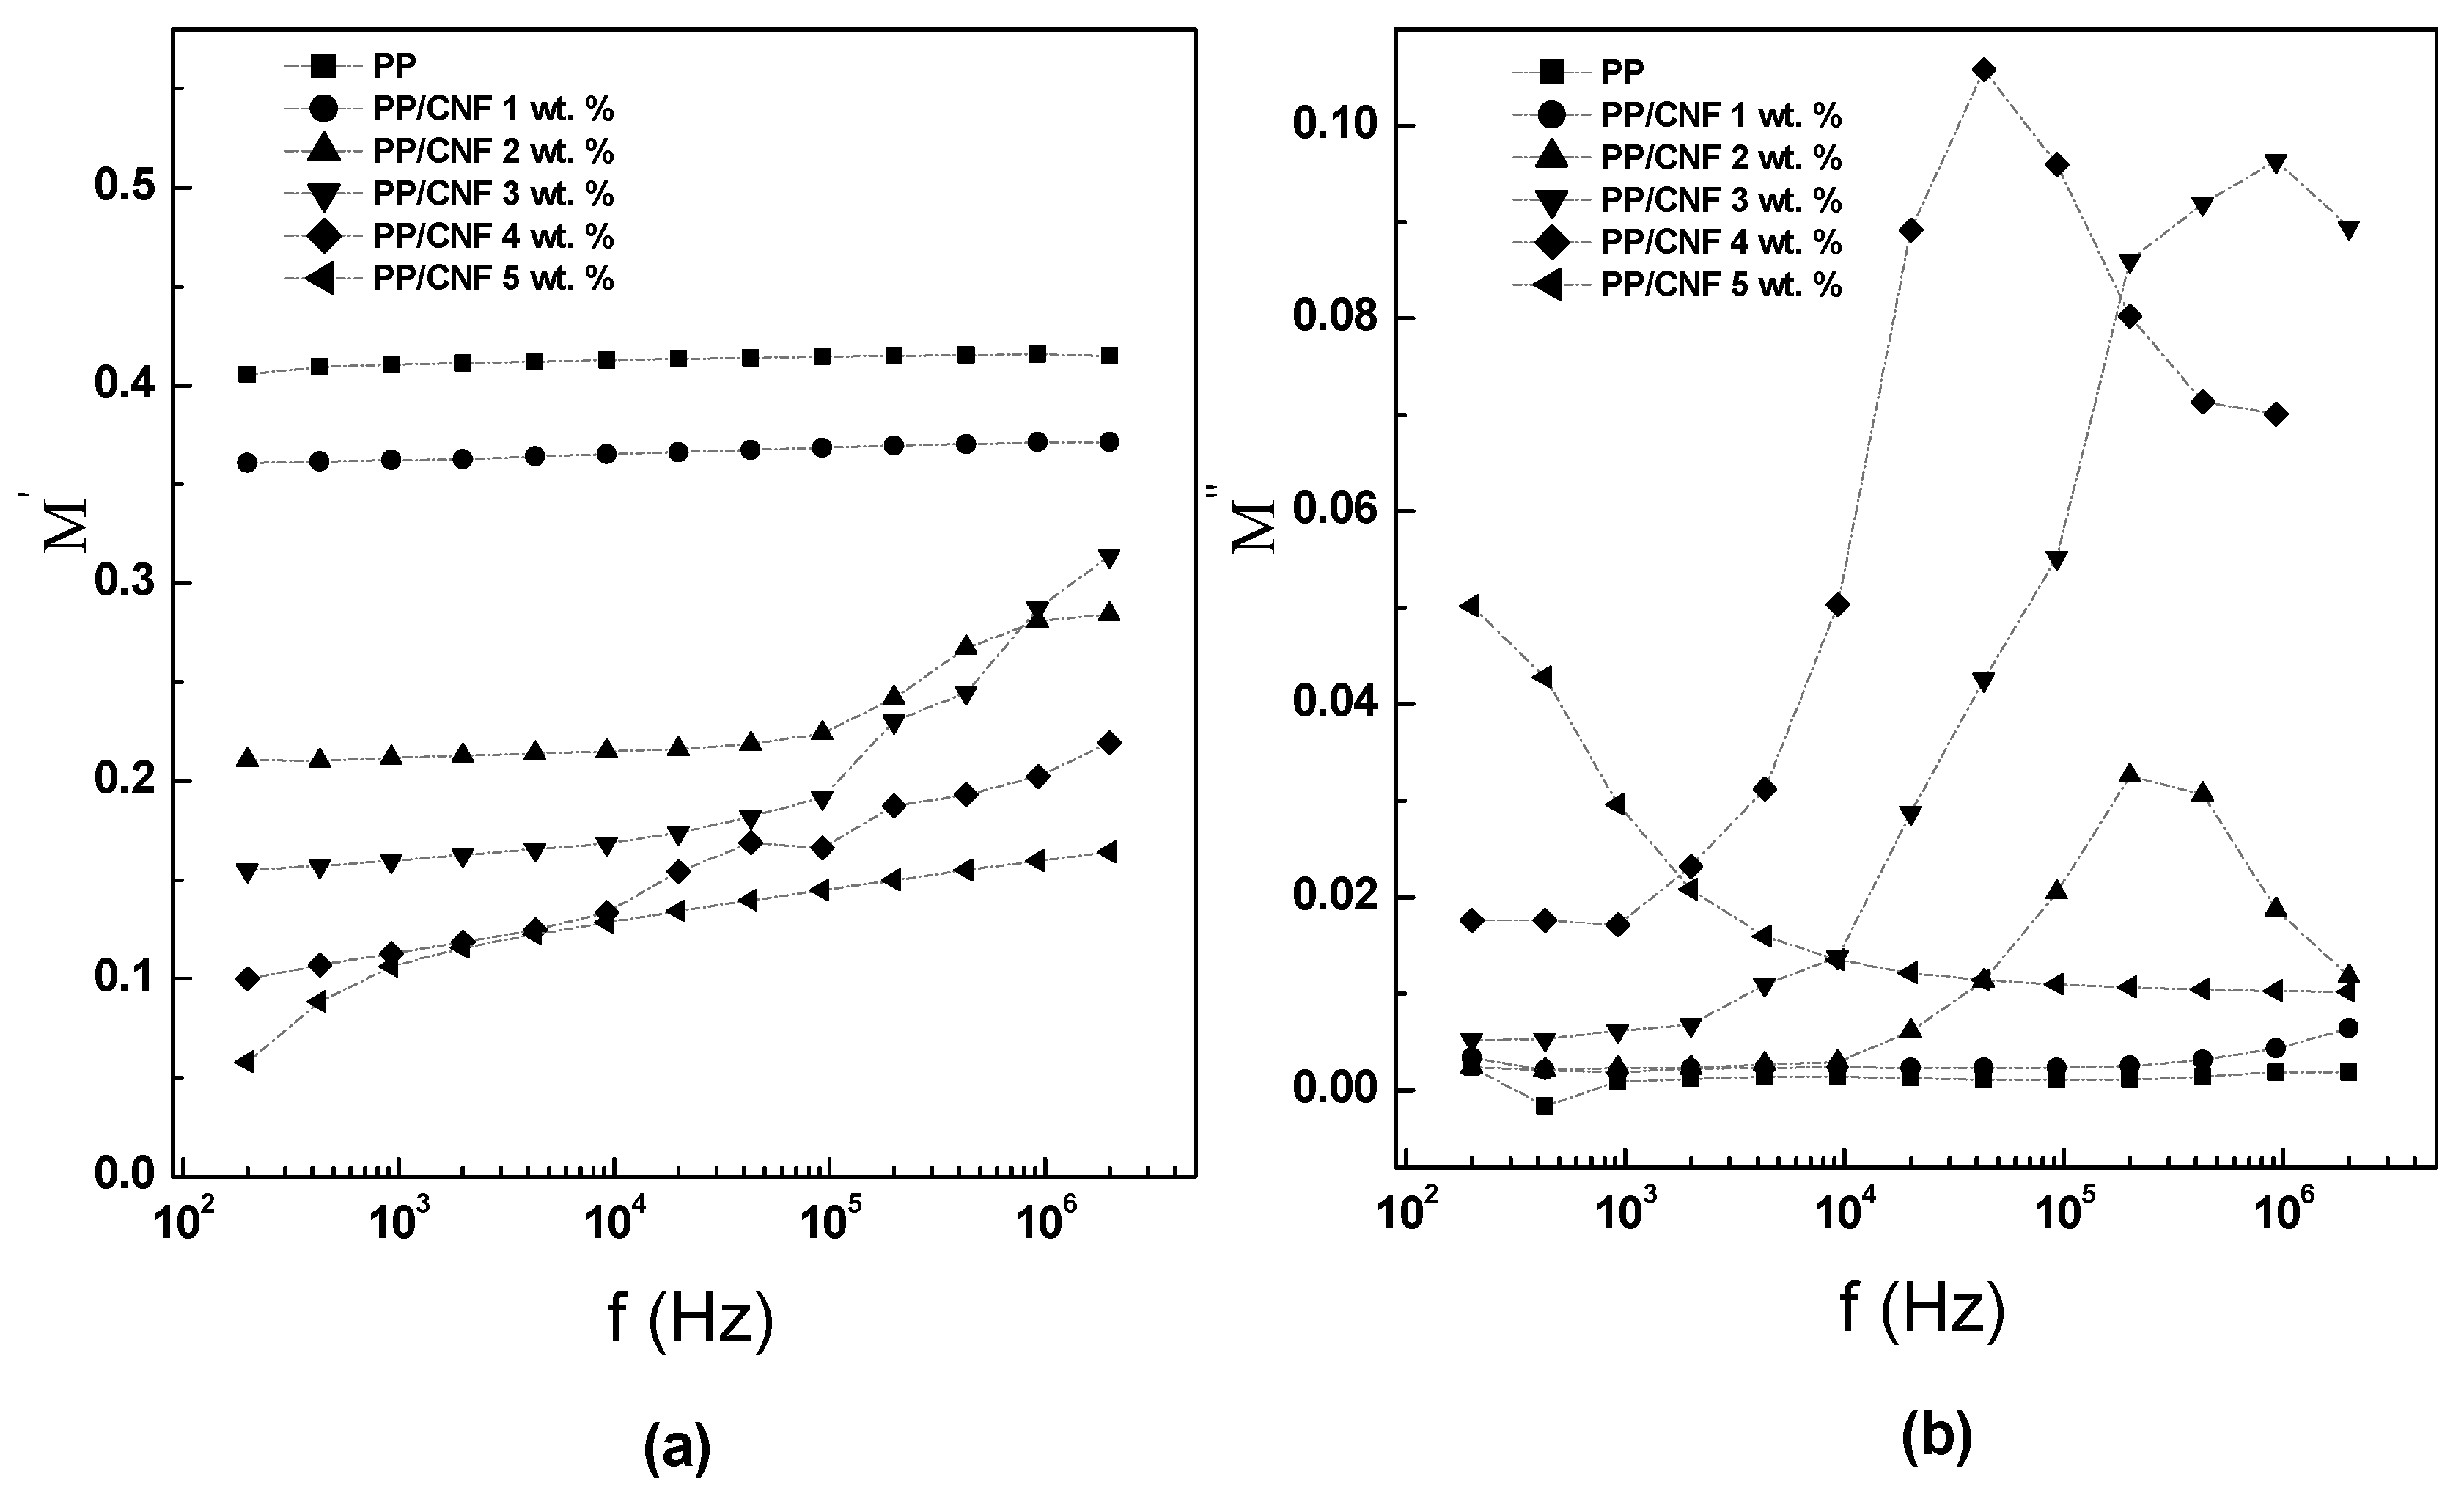
3.3. Electrical Analysis and Cole-Cole Modeling by the Modulus Formalism

The electrical modulus formalism was used to provide additional information on the dielectric permittivity of the PP/CNF composites. As is noted in Figure 6a, a decrease of M ( ω ) was observed as the content of CNFs increased in the PP. This decrease was related to the enhanced dielectric permittivity observed in Figure 4. It can also be seen that M ( ω ) is almost linear in the whole range of frequencies for PP and PP/CNF 1 wt. % composite. In contrast PP/CNF composites with 2 wt. %, 3 wt. % and 4 wt. % CNFs showed two different behaviors at low and high frequencies. At low frequencies, M ( ω ) showed frequency-dependent straight lines that increased slightly with the increase of the frequency, whereas at high frequencies M ( ω ) approached a maximum. At low frequencies, the M ( ω ) found for these PP/CNF composites was attributed to the increase of interfacial polarization caused by the higher content of CNFs [45]. Notably, the existence of a step-wise increase in M ( ω ) from low to high values of frequency in those PP/CNF 2, 3, and 4 wt. % composites implies a relaxation process, which was confirmed by the pronounced peaks observed in M ( ω ) in the range 104–106 Hz (Figure 6b). These relaxation processes are again connected with the interfacial polarization [46]. Interestingly, the PP/CNF 5 wt. % composite did not show any relaxation in M ( ω ) and M ( ω ) plots, which could be related to ohmic conduction losses that hinder the relaxation process due to interfacial polarization [47].
Figure 7 shows the Nyquist diagrams of PP/CNF composites with an exception for the PP/CNF 1 wt. % samples due to their insulating character. It is worth mentioning that the dash-dot curves seen in Figure 7 are fitted by the Cole–Cole model [48]:
M * ( ω ) = M + M s M 1 + ( i ω τ ) 1 α    
Here M is the modulus at high frequency, M s is the static modulus, ω is the angular frequency, whereas τ and α can be defined exactly as in Equation (9). As is shown in Table 3, the constants ( M s M ) , τ and α obtained for PP/CNF composites with CNF contents 2, 3, and 4 wt. % were different from the parameters obtained for PP/CNF 5 wt. % composite. Particularly, ( M s M ) values increased with the rise of CNF concentration for PP/CNF composites with CNF content from 2 to 4 wt. %, which corresponded to the increased dielectric strength discussed in the former section. In this regard, ternary polyester composites filled with CNTs and graphite showed similar increases of ( M s M ) with an increase in the filler content [49]. Moreover, the values of α close to 0 (in the range 0.02–0.04) obtained for those PP/CNF composites, confirmed dielectric relaxations with almost single relaxation times, which is in good agreement with other investigations [50,51]. Figure 7, similarly to Figure 5 in the previous section, shows that the PP/CNF 2 wt. % composite presents the semicircle with the smallest radius corresponding to the lowest relaxation, while a PP/CNF 4 wt. % composite presents the semicircle with the highest radius, and therefore the highest relaxation process. In contrast, the PP/CNF 5 wt. % composite exhibits a semicircle located at the low-frequency region (left side of Figure 7). In this latter case, the displacement of the semicircle towards the origin was attributed to the increase of τ with the larger heterogeneity of the system [52]. Moreover, the PP/CNF 5 wt. % composite showed a straight line at high frequency (inset of Figure 7), which could be related to the conductance relaxation caused by its higher levels of conductivity.

3.4. Electrical Impedance Analysis

The electrical impedance analysis as a function of frequency for all the PP/CNF composites is presented in Figure 8. Overall, the impedance modulus ( | Z | ) of the PP/CNF composites with CNF content from 1 wt. % to 4 wt. % (Figure 8a) exhibited a high capacitive behavior typically observed in insulating materials ( | Z |   ~   1 / ω ) [53]. On the contrary, at a certain critical frequency, the impedance modulus of PP/CNF 5 wt. % composite became practically constant, whereas its impedance phase angle ( Φ ) approached −90° and 0° at the high and low-frequency regions, respectively (Figure 8b). The | Z | and Φ observed at lower frequencies in PP/CNF 5 wt. % composite can be related to the tunneling and hopping of electrons [54]. Whereas at higher frequencies, the | Z | and Φ observed can be related to the formation of capacitor networks [39]. Thereby, the combination of both effects contributed to the impedance of the PP/CNF 5 wt. % composite. Finally, the Nyquist diagram of all the PP/CNF composites (Figure 8c) is represented in order to better understand Figure 8a,b. As was expected, a capacitive response was observed for the PP/CNF composites with CNF concentrations from 1 wt. % to 4 wt. %, which means that the insulating properties of polypropylene dominated in these PP/CNF composites. However, PP/CNF 5 wt. % composite showed a semi-circular response, which confirmed its higher conductivity.

4. Conclusions

Different weight contents of pyrolytically stripped carbon nanofiber, produced by chemical vapor deposition, were melt-extruded with polypropylene. The electrical conductivity of the PP/CNF composites achieved values of ~10−10 S m−1 for PP/CNF 5 wt. % composites, which place them within the range of insulator materials. Nevertheless, these low values of conductivity corresponded to a remarkable improvement of their dielectric constants with low dielectric losses due to the interfacial polarization between the polymer and CNFs. This significant enhancement of the dielectric properties was examined using the Cole–Cole model, from which was deduced that the incorporation of CNFs increases the dielectric strength and relaxation times of these PP/CNF composites. Finally, the complex impedance and Nyquist plots were also analyzed in order to complete this study, which aimed to contribute to the limited research studying the enhanced dielectric properties of low-conducting polymer composites filled with CNFs.

Author Contributions

All authors of this manuscript contributed to the development of this work. A.J.P. and Z.S. conceived the study and contributed to formal analysis, data curation, and writing-the original draft preparation. N.A., Y.N. and M.E.A. were responsible for electric analysis modeling and review writing. J.O.d.S. was responsible for electrical analysis reviewing. M.F.C. was responsible for the Raman analysis. J.A.M. was responsible for electrical characterization resources and review writing. All authors have read and agreed to the published version of the manuscript.

Funding

A. J. Paleo gratefully acknowledges support from FCT-Foundation for Science and Technology by the project UID/CTM/00264/2021 of 2C2T under the COMPETE and FCT/MCTES (PIDDAC) co-financed by FEDER through the PT2020 program and “plurianual” 2020–2023 Project UIDB/00264/2020.

Data Availability Statement

The data presented in this study are available on request from the corresponding author.

Acknowledgments

The authors would like to thank Provost Office at Mercer University for supporting this work through the SEED grant program.

Conflicts of Interest

The authors declare no conflict of interest.

References

  1. Foulger, S.H. Electrical properties of composites in the vicinity of the percolation threshold. J. Appl. Polym. Sci. 1999, 72, 1573–1582. [Google Scholar] [CrossRef]
  2. Jing, X.; Zhao, W.; Lan, L. The effect of particle size on electric conducting percolation threshold in polymer/conducting particle composites. J. Mater. Sci. Lett. 2000, 19, 377–379. [Google Scholar] [CrossRef]
  3. Knite, M.; Teteris, V.; Aulika, I.; Kabelka, H.; Fuith, A. Alternating-current properties of elastomer-carbon nanocomposites. Adv. Eng. Mater. 2004, 6, 746–749. [Google Scholar] [CrossRef]
  4. Logakis, E.; Pandis, C.; Peoglos, V.; Pissis, P.; Pionteck, J.; Pötschke, P.; Mičušík, M.; Omastová, M. Electrical/dielectric properties and conduction mechanism in melt processed polyamide/multi-walled carbon nanotubes composites. Polymer 2009, 50, 5103–5111. [Google Scholar] [CrossRef]
  5. Khan, T.; Irfan, M.S.; Ali, M.; Dong, Y.; Ramakrishna, S.; Umer, R. Insights to low electrical percolation thresholds of carbon-based polypropylene nanocomposites. Carbon 2021, 176, 602–631. [Google Scholar] [CrossRef]
  6. Gogoi, R.; Maurya, A.K.; Manik, G. A review on recent development in carbon fiber reinforced polyolefin composites. Compos. Part C Open Access 2022, 8, 100279. [Google Scholar] [CrossRef]
  7. Aldica, G.V.; Ciurea, M.L.; Chipara, D.M.; Lepadatu, A.M.; Lozano, K.; Stavarache, I.; Popa, S.; Chipara, M. Isotactic polypropylene–vapor grown carbon nanofibers composites: Electrical properties. J. Appl. Polym. Sci. 2017, 134, 45297. [Google Scholar] [CrossRef]
  8. Raimondo, M.; Guadagno, L.; Vertuccio, L.; Naddeo, C.; Barra, G.; Spinelli, G.; Lamberti, P.; Tucci, V.; Lafdi, K. Electrical conductivity of carbon nanofiber reinforced resins: Potentiality of Tunneling Atomic Force Microscopy (TUNA) technique. Compos. Part B Eng. 2018, 143, 148–160. [Google Scholar] [CrossRef]
  9. Guadagno, L.; Pantelakis, S.; Strohmayer, A.; Raimondo, M. High-Performance Properties of an Aerospace Epoxy Resin Loaded with Carbon Nanofibers and Glycidyl Polyhedral Oligomeric Silsesquioxane. Aerospace 2022, 9, 222. [Google Scholar] [CrossRef]
  10. Al-Saleh, M.H.; Sundararaj, U. A review of vapor grown carbon nanofiber/polymer conductive composites. Carbon 2009, 47, 2–22. [Google Scholar] [CrossRef]
  11. Available online: https://apsci.com/products/pyrograf/ (accessed on 24 October 2022).
  12. Burton, D.J.; Glasgow, D.G.; Lake, M.L.; Kwag, C.; Finegan, J.C. In Influence of carbon nanofibers surface characteristics on composite properties. In Proceedings of the 46th International SAMPE Symposium and Exhibition, Long Beach, CA, USA, 6–10 May 2001; p. 647. [Google Scholar]
  13. Gordeyev, S.A.; Macedo, F.J.; Ferreira, J.A.; van Hattum, F.W.J.; Bernardo, C.A. Transport properties of polymer-vapour grown carbon fibre composites. Phys. B 2000, 279, 33–36. [Google Scholar] [CrossRef]
  14. Luo, J.; Cerretti, G.; Krause, B.; Zhang, L.; Otto, T.; Jenschke, W.; Ullrich, M.; Tremel, W.; Voit, B.; Pötschke, P. Polypropylene-based melt mixed composites with singlewalled carbon nanotubes for thermoelectric applications: Switching from p-type to n-type by the addition of polyethylene glycol. Polymer 2017, 108, 513–520. [Google Scholar] [CrossRef]
  15. Gogoi, R.; Kumar, N.; Mireja, S.; Ravindranath, S.S.; Manik, G.; Sinha, S. Effect of Hollow Glass Microspheres on the Morphology, Rheology and Crystallinity of Short Bamboo Fiber-Reinforced Hybrid Polypropylene Composite. JOM 2019, 71, 548–558. [Google Scholar] [CrossRef]
  16. Lozano, K.; Bonilla-Rios, J.; Barrera, E.V. A study on nanofiber-reinforced thermoplastic composites (II): Investigation of the mixing rheology and conduction properties. J. Appl. Polym. Sci. 2001, 80, 1162–1172. [Google Scholar] [CrossRef]
  17. Muñoz-Ávila, J.M.; Sánchez-Valdes, S.; Yáñez-Flores, I.; Rodriguez-Fernandez, O.S.; Neira-Velázquez, M.G.; Hernández-Hernández, E.; Flores-Gallardo, S.; Avalos-Belmontes, F.; Lozano-Ramírez, T.; Morales-Cepeda, A.; et al. Influence of carbon nanofiber functionalization and compatibilizer on the physical properties of carbon nanofiber reinforced polypropylene nanocomposites. Polym. Compos. 2018, 39, 3575–3585. [Google Scholar] [CrossRef]
  18. Paleo, A.J.; Aribou, N.; Nioua, Y.; Samir, Z.; Fernandes, L.; Moreira, J.A.; Achour, M.E. Electrical properties of melt-mixed polypropylene and as-grown carbon nanofiber composites: Analysis of their interphase via the AC conductivity modeling. J. Compos. Mater. 2022, 56, 1879–1889. [Google Scholar] [CrossRef]
  19. Wang, S.; Yang, C.; Li, X.; Jia, H.; Liu, S.; Liu, X.; Minari, T.; Sun, Q. Polymer-based dielectrics with high permittivity and low dielectric loss for flexible electronics. J. Mater. Chem. C 2022, 10, 6196–6221. [Google Scholar] [CrossRef]
  20. Paleo, A.J.; Zille, A.; Van Hattum, F.W.; Ares-Pernas, A.; Agostinho Moreira, J. Dielectric relaxation of near-percolated carbon nanofiber polypropylene composites. Phys. B Condens. Matter 2017, 516, 41–47. [Google Scholar] [CrossRef]
  21. Tessonnier, J.-P.; Rosenthal, D.; Hansen, T.W.; Hess, C.; Schuster, M.E.; Blume, R.; Girgsdies, F.; Pfänder, N.; Timpe, O.; Su, D.S.; et al. Analysis of the structure and chemical properties of some commercial carbon nanostructures. Carbon 2009, 47, 1779–1798. [Google Scholar] [CrossRef] [Green Version]
  22. Guadagno, L.; Raimondo, M.; Vittoria, V.; Vertuccio, L.; Lafdi, K.; De Vivo, B.; Lamberti, P.; Spinelli, G.; Tucci, V. The role of carbon nanofiber defects on the electrical and mechanical properties of CNF-based resins. Nanotechnology 2013, 24, 305704. [Google Scholar] [CrossRef]
  23. Paleo, A.J.; Sencadas, V.; van Hattum, F.W.J.; Lanceros-Méndez, S.; Ares, A. Carbon nanofiber type and content dependence of the physical properties of carbon nanofiber reinforced polypropylene composites. Polym. Eng. Sci. 2014, 54, 117–128. [Google Scholar] [CrossRef] [Green Version]
  24. Tsangaris, G.M.; Psarras, G.C.; Kouloumbi, N. Electric modulus and interfacial polarization in composite polymeric systems. J. Mater. Sci. 1998, 33, 2027–2037. [Google Scholar] [CrossRef]
  25. Sharma, S.; Basu, T.; Shahee, A.; Singh, K.; Lalla, N.P.; Sampathkumaran, E.V. Complex dielectric and impedance behavior of magnetoelectric Fe2TiO5. J. Alloy. Compd. 2016, 663, 289–294. [Google Scholar] [CrossRef] [Green Version]
  26. Jonscher, A.K. Dielectric relaxation in solids. J. Phys. D Appl. Phys. 1999, 32, R57–R70. [Google Scholar] [CrossRef]
  27. Chibani, N.; Djidjelli, H.; Dufresne, A.; Boukerrou, A.; Nedjma, S. Study of effect of old corrugated cardboard in properties of polypropylene composites: Study of mechanical properties, thermal behavior, and morphological properties. J. Vinyl Addit. Technol. 2016, 22, 231–238. [Google Scholar] [CrossRef]
  28. Khafagy, R.M.; Badr, Y.A. In situ FTIR spectroscopic study of the recently detected low-temperature-induced structural changes in isotactic polypropylene. J. Polym. Sci. Part B Polym. Phys. 2005, 43, 2829–2842. [Google Scholar] [CrossRef]
  29. Snyder, R.G.; Schachtschneider, J.H. Valence force calculation of the vibrational spectra of crystalline isotactic polypropylene and some deuterated polypropylenes. Spectrochim. Acta 1964, 20, 853–869. [Google Scholar] [CrossRef]
  30. Nielsen, A.S.; Batchelder, D.N.; Pyrz, R. Estimation of crystallinity of isotactic polypropylene using Raman spectroscopy. Polymer 2002, 43, 2671–2676. [Google Scholar] [CrossRef]
  31. Lehman, J.H.; Terrones, M.; Mansfield, E.; Hurst, K.E.; Meunier, V. Evaluating the characteristics of multiwall carbon nanotubes. Carbon 2011, 49, 2581–2602. [Google Scholar] [CrossRef]
  32. Wang, Y.; Alsmeyer, D.C.; McCreery, R.L. Raman spectroscopy of carbon materials: Structural basis of observed spectra. Chem. Mater. 1990, 2, 557–563. [Google Scholar] [CrossRef]
  33. Knight, D.S.; White, W.B. Characterization of diamond films by Raman spectroscopy. J. Mater. Res. 1989, 4, 385–393. [Google Scholar] [CrossRef]
  34. Chipara, M.; Villarreal, J.R.; Chipara, M.D.; Lozano, K.; Chipara, A.C.; Sellmyer, D.J. Spectroscopic investigations on polypropylene-carbon nanofiber composites. I. Raman and electron spin resonance spectros-copy. J. Polym. Sci. Part B Polym. Phys. 2009, 47, 1644–1652. [Google Scholar] [CrossRef] [Green Version]
  35. Paleo, A.J.; Vieira, E.M.F.; Wan, K.; Bondarchuk, O.; Cerqueira, M.F.; Goncalves, L.M.; Bilotti, E.; Alpuim, P.; Rocha, A.M. Negative thermoelectric power of melt mixed vapor grown carbon nanofiber polypropylene composites. Carbon 2019, 150, 408–416. [Google Scholar] [CrossRef]
  36. Zhan, G.; Mukherjee, A. Processing and Characterization of Nanoceramic Composites with Interesting Structural and Functional Properties. Rev. Adv. Mater. Sci 2005, 10, 185–196. [Google Scholar]
  37. Novais, R.M.; Covas, J.A.; Paiva, M.C. The effect of flow type and chemical functionalization on the dispersion of carbon nanofiber agglomerates in polypropylene. Compos. Part A Appl. Sci. Manuf. 2012, 43, 833–841. [Google Scholar] [CrossRef]
  38. Shehzad, K.; Dang, Z.-M.; Ahmad, M.N.; Sagar, R.U.R.; Butt, S.; Farooq, M.U.; Wang, T.-B. Effects of carbon nanotubes aspect ratio on the qualitative and quantitative aspects of frequency response of electrical conductivity and dielectric permittivity in the carbon nanotube/polymer composites. Carbon 2013, 54, 105–112. [Google Scholar] [CrossRef]
  39. Chang, J.; Liang, G.; Gu, A.; Cai, S.; Yuan, L. The production of carbon nanotube/epoxy composites with a very high dielectric constant and low dielectric loss by microwave curing. Carbon 2012, 50, 689–698. [Google Scholar] [CrossRef]
  40. Cole, K.S.; Cole, R.H. Dispersion and Absorption in Dielectrics I. Alternating Current Characteristics. J. Chem. Phys. 1941, 9, 341. [Google Scholar] [CrossRef] [Green Version]
  41. Vo, L.T.; Anastasiadis, S.H.; Giannelis, E.P. Dielectric study of Poly(styrene-co-butadiene) Composites with Carbon Black, Silica, and Nanoclay. Macromolecules 2011, 44, 6162–6171. [Google Scholar] [CrossRef]
  42. Silva, J.; Oliveira, M.J.T.; Lanceros-Mendez, S.; Nogueira, F. Finite-Size Effects in the Absorption Spectra of a Single-Wall Carbon Nanotube. J. Phys. Chem. C 2016, 120, 18268–18274. [Google Scholar] [CrossRef] [Green Version]
  43. Alam, R.B.; Ahmad, M.H.; Islam, M.R. Effect of MWCNT nanofiller on the dielectric performance of bio-inspired gelatin based nanocomposites. RSC Adv. 2022, 12, 14686–14697. [Google Scholar] [CrossRef]
  44. Wang, B.; Liang, G.; Jiao, Y.; Gu, A.; Liu, L.; Yuan, L.; Zhang, W. Two-layer materials of polyethylene and a carbon nanotube/cyanate ester composite with high dielectric constant and extremely low dielectric loss. Carbon 2013, 54, 224–233. [Google Scholar] [CrossRef]
  45. Singha, S.; Thomas, M.J.; Kulkarni, A. Complex permittivity characteristics of epoxy nanocomposites at low frequencies. IEEE Trans. Dielectr. Electr. Insul. 2010, 17, 1249–1258. [Google Scholar] [CrossRef]
  46. Bin-Dahman, O.A.; Rahaman, M.; Khastgir, D.; Al-Harthi, M.A. Electrical and dielectric properties of poly(vinyl alcohol)/starch/graphene nanocomposites. Can. J. Chem. Eng. 2018, 96, 903–911. [Google Scholar] [CrossRef]
  47. Samir, Z.; El Merabet, Y.; Graça, M.; Soreto Teixeira, S.; Achour, M.; Costa, L. Dielectric behaviour of carbon nanotubes particles-filled polyester polymer composites. J. Compos. Mater. 2017, 51, 1831–1837. [Google Scholar] [CrossRef]
  48. Cole, K.S.; Cole, R.H. Dispersion and Absorption in Dielectrics II. Direct Current Characteristics. J. Chem. Phys. 1942, 10, 98–105. [Google Scholar] [CrossRef]
  49. Belhimria, R.; Samir, Z.; Boukheir, S.; Soreto Teixeira, S.; Achour, M.E.; Anson-Casaos, A.; Gonzalez-Dominguez, J.M.; Costa, L.C.; El Hasnaoui, M. Thermal and dielectric properties of carbon nanotubes/graphite/polyester ternary composites. J. Compos. Mater. 2021, 55, 3741–3750. [Google Scholar] [CrossRef]
  50. Nioua, Y.; Melo, B.M.G.; Prezas, P.; Graça, M.F.; Achour, M.E.; Costa, L.C. Analysis of the dielectric relaxation in reduced graphene oxide/epoxy composites materials using the modulus formalism. Eur. Phys. J. E 2021, 44, 109. [Google Scholar] [CrossRef]
  51. El Hasnaoui, M.; Triki, A.; Graça, M.P.F.; Achour, M.E.; Costa, L.C.; Arous, M. Electrical conductivity studies on carbon black loaded ethylene butylacrylate polymer composites. J. Non-Cryst. Solids 2012, 358, 2810–2815. [Google Scholar] [CrossRef]
  52. Tsangaris, G.M.; Psarras, G.C.; Kontopoulos, A.J. Dielectric permittivity and loss of an aluminum-filled epoxy resin. J. Non-Cryst. Solids 1991, 131–133, 1164–1168. [Google Scholar] [CrossRef]
  53. Samir, Z.; Boukheir, S.; Belhimria, R.; Achour, M.E.; Éber, N.; Costa, L.C.; Oueriagli, A. Impedance spectroscopy and dielectric properties of carbon nanotube-reinforced epoxy polymer composites. Jordan J. Phys. 2020, 13, 113–121. [Google Scholar] [CrossRef]
  54. Cardoso, P.; Silva, J.; Paleo, A.J.; van Hattum, F.W.J.; Simoes, R.; Lanceros-Méndez, S. The dominant role of tunneling in the conductivity of carbon nanofiber-epoxy composites. Phys. Status Solidi (A) 2010, 207, 407–410. [Google Scholar] [CrossRef]
Figure 1. Pyrolytically stripped Pyrograf®-III PR 25 PS XT carbon nanofiber and melt-mixed PP/CNF composites. TEM micrograph of CNF (a) and SEM micrograph of PP/CNF 2 wt. % composites (b).
Jcs 06 00368 g001
Figure 2. Structural analysis of PP and PP/CNF composites. FTIR (a) and Raman spectra (b) of PP and PP/CNF composites (the short dot line is to guide the eyes).
Jcs 06 00368 g002
Figure 3. AC electrical conductivity of PP/CNF composites as a function of frequency (the dash-dot lines are to guide the eyes).
Jcs 06 00368 g003
Figure 4. Dependence on frequency of dielectric permittivity in PP/CNF composites. Real ε ( ω )   (a), and imaginary ε ( ω )   (b) parts of complex dielectric permittivity (the dash-dot lines are to guide the eyes). Reprinted with permission from Ref. [20]. Copyright 2017, Elsevier.
Jcs 06 00368 g004
Figure 5. Cole–Cole plots for PP/CNF composites with three wt. % concentrations of CNFs (the dash-dot curves represent the fitting of the Cole-Cole model using Equation (9)).
Jcs 06 00368 g005
Figure 6. Dependence on frequency of complex electric modulus in PP/CNF composites. Real M ( ω )   (a) and imaginary M ( ω )   (b) parts of complex electric modulus (the dash-dot lines are to guide the eyes).
Jcs 06 00368 g006
Figure 7. Nyquist plots of complex electric modulus M * ( ω ) for PP/CNF composites (the dash-dot curves represent the Cole-Cole model with Equation (10)).
Jcs 06 00368 g007
Figure 8. Dependence on frequency of electrical impedance in PP/CNF composites. Modulus | Z | of PP/CNF composites (a) Bode plot of PP/CNF 5 wt. % composite (b) Nyquist plots of PP/CNF composites (c).
Jcs 06 00368 g008
Table 1. wG and wD modes and corresponding to FWHMG and FWHMD, ID/IG, IG/IPP, and La of PP/CNF composites with 1, 3, and 5 wt. % of CNFs.
SamplewG (cm−1)FWHMG (cm−1)wD (cm−1)FWHMD (cm−1)ID/IGIG/IPPLa (nm)
PP/CNF 1 wt. %15859013471050.952.34.6
PP/CNF 3 wt. %158510013451050.806.95.5
PP/CNF 5 wt. %15849513451100.72-6.1
Table 2. Parameters τ , (εsε) and α of PP/CNF composites extracted by the Cole–Cole model using Equation (9).
Sampleτ (ms)(εsε)α
PP/CNF 2 wt. %0.7951.200.05
PP/CNF 3 wt. %0.1713.300.06
PP/CNF 4 wt. %0.3696.600.02
Table 3. Parameters τ , ( M s M ) and α of PP/CNF composites extracted by the Cole–Cole model using Equation (10).
Sampleτ (ms)(MsM)α
PP/CNF 2 wt. %0.7950.0720.04
PP/CNF 3 wt. %0.1710.2110.03
PP/CNF 4 wt. %0.3690.4050.02
PP/CNF 5 wt. %7960.1190.09
Publisher’s Note: MDPI stays neutral with regard to jurisdictional claims in published maps and institutional affiliations.

