Article

The Role of Fibre Length on the Fatigue Failure of Injection-Moulded Composites at Elevated Temperatures under a Range of Axial Loading Conditions

1
CanmetMATERIALS, Natural Resources Canada, 175 Longwood Road South, Hamilton, ON L8P 0A1, Canada
2
Department of Materials Science and Engineering, McMaster University, 1280 Main Street West, Hamilton, ON L8S 4L8, Canada
3
National Key Laboratory of Science & Technology on UAV, Northwestern Polytechnical University, 127 Youyi West Rd., Xi’an 710072, China
4
Research and Innovation Centre, Ford Motor Company, 2101 Village Road, Dearborn, MI 48124, USA
*
Author to whom correspondence should be addressed.
Submission received: 16 December 2021 / Revised: 14 January 2022 / Accepted: 18 January 2022 / Published: 20 January 2022
(This article belongs to the Special Issue Feature Papers in Journal of Composites Science in 2021)

Abstract

:
The effect of fibre length distribution on the fatigue behaviour of an injection-moulded PA66 carbon fibre composite is investigated. Two materials, short carbon fibre with a mean length of 100 microns, and long carbon fibre with a mean length of 580 microns, are subjected to fully reversed fatigue loading at room temperature and three stress ratios at 120 °C. The fatigue results are compared, and fracture surfaces are analyzed to determine the differing failure modes between the materials and loading conditions. At 120 °C, the fibre length has a significant effect on the fatigue behaviour with order of magnitudes of different fatigue life for a given stress amplitude during tensile fatigue loading. Under tensile loading, fatigue failure initates as fibre matrix debonding with pits present due to end effects in the short carbon fibre material. Under compression–compression loading, the fatigue life is matrix-dominated and should be treated as a maximum stress failure. Under this loading, a smooth crack propagates across the sample with buckling as the final failure mode.

1. Introduction

Automakers are interested in the application of injection-moulded composites for light weighting applications to increase the energy efficiency of vehicles. In semi-structural applications such as load bearing oil pans [1], fuel rails [2], and clutch pedals [3], the fatigue life of the material becomes a major concern. Many studies have been conducted on the fatigue life of injection-moulded composites for high production applications [4]. Another major consideration of automakers is the cost of the products and weighing the expense of different materials and manufacturing technologies versus the benefits in terms of reduced energy consumption. For injection-moulded composites, the temperature, fibre length, and fibre orientation are known to affect the resulting material properties. In this study, the effect of fibre length distribution (FLD) on the fatigue performance of a commercially available carbon fibre PA66 injection moulding feedstock is evaluated. The FLD has an impact on the cost of the feedstock, and it is of interest to evaluate the impact of the FLD on the resulting temperature-dependent fatigue behaviour.
Temperature has a major impact on the response of polymer materials, especially in operation near their glass transition temperature where their response changes from glass-like to more rubber-like. Handa et al. determined that internal heating during fatigue loading of a glass fibre polyamide composite results in different behaviours depending on if the temperature is above or below the matrix glass transition temperature [5]. Bellenger et al. have studied the effects of temperature and internal heating on the fatigue life of PA66 glass fibre composites, finding that 2 Hz loading frequency avoids internal heating [6]. Casado et al. have similarly studied the effect of temperature on the fatigue failure of components for structural rail fasteners operating near the glass transition temperature [7]. The temperature effects on the fatigue failure of injection-moulded PA66 glass fibre composites have been studied by Esmaeillou et al. [8]. Sonsino and Moosbrugger have shown how fatigue strength is reduced with increasing temperature for a glass-fibre-reinforced PA66 for fully reversed loading [2]. High temperature fatigue life under compression–compression fatigue loading has not been investigated.
The FLD in injection moulding composites has been shown to affect the material properties and fatigue life. Karsli et al. have shown that slight changes to the FLD with differing initial fibre lengths has minimal effect on the mechanical properties for monotonic loadings at room temperature [9]. Yilmazer and Cansever have shown that there is a correlation between the FLD average length and the tensile strength of resulting injection moulding [10]. Similar tends in strength have been shown by Thomason with initial elastic modulus being independent of FLD [11]. Karger-Kocsis and Friedrich have studied the effect of two fibre lengths and have shown that longer fibres increase the fatigue life [12]. Meneghetti et al. have studied the effect of two fibre lengths, 1 mm and 10 mm, on the fatigue life of injection-moulded composites at room temperature under fully reversed loading and found there to be a slight decrease for the longer fibre length [13]. Subramanian and Senthilvelan have studied the effect of two FLD on the fatigue internal heating under tension–tension displacement-controlled fatigue of glass-fibre-reinforced polypropylene. The FLDs had average fibre lengths of 1.35 mm and 0.28 mm, and the short fibres increased internal heating during the fatigue life [14]. Sasayama et al. have shown that both the FLD and fibre orientation have effects on the resulting material properties [15]. A combination of temperature and FLD have not been studied for injection-moulded composites.
Fibre orientation evolution during manufacturing has a strong effect on the resulting material properties of injection moulding material [16]. Launay et al. have shown how the fibre orientation affects the resulting material properties and how it can be accounted for in fatigue loading [17,18]. De Monte et el. have studied the effect of macro-scale fibre orientation on the fatigue life of injection-moulded glass fibre PA66 at room and elevated temperatures under tension–tension and fully reversed loading [19]. Jain et al. found that the fibre orientation does not change the loss of stiffness during fatigue loading of injection-moulded materials [20]. Sabiston et al. have shown that the variability in the fatigue life prediction can be significantly reduced by accounting for fibre orientation in injection-moulded composites [21]. The effects of fibre orientation will not be considered in the present study, but its importance cannot be overlooked.
The effect of the stress ratio and other properties have been studied for injection-moulded composites. Capela et al. have studied the effects of fibre volume content on the fatigue life of short-fibre-reinforced composites [22]. Mallick and Zhou studied the effect of mean stress on the fatigue life of tension–tension injection-moulded glass fibre PA6.6 [23]. De Monte et al. studied the fatigue life of injection-moulded PA66 glass fibre composite under different loadings and at 130 °C [24].
To fully understand the fatigue life of composites, the micromechanics-based failure methods must be considered. Horst and Spoormaker proposed that fatigue failure in injection-moulded composites initiates by void formation, and that cracks do not travel, but many form, leading to reduction in strength which leads to final failure [25]. Noda et al. suggested that these effects are also temperature-dependent when operating around the glass transition temperature [26]. It was not until recently that these fatigue damage mechanisms could be confirmed. Klimkeit et al. showed that damage has a spatial distribution, and that final failure is due to the accumulation of damaged regions and not the growth of a single crack [27]. Arif et al. studied the damage initiation mechanisms using X-ray micro computed tomography (μCT) of tension–tension fatigue loading of glass-fibre-reinforced PA66, and found that damage nucleates in the form of fibre-matrix debonding along the interface [28]. Cosmi and Bernasconi also applied μCT to investigate damage nucleation during tension–tension fatigue loading in short glass fibre injection-moulded composites and found that micro voids appear in the matrix during fatigue loading; no comment was made on the preferential location of these voids [29]. Belmonte et al. have studied the crack initiation of notched short-fibre-reinforced polyamide subjected to tension–tension fatigue where a μCT measured microstructure was used as input to a finite element model to simulate the local stress fields to develop a fracture initiation criterion [30]. These micromechanics-based failure criteria are only for tension-based fatigue loading, and there is little on the compression fatigue failure of injection-moulded composite materials.
In this study, the effect of FLD on the fatigue performance of and injection-moulded carbon-fibre-reinforced PA66 is investigated. Fully reversed fatigue loading at room temperature along with three different stress ratios at 120 °C was conducted to evaluate the effect of temperature and FLD on the fatigue life. Preliminary results of these fatigue tests were presented in [31]. Failed specimens are subjected to electron microscopy to evaluate the primary failure methods and contrast differences, depending on the temperature and fibre length. Compression–compression fatigue life and failure are evaluated at 120 °C for the first time.

2. Materials and Methods

In this study, 305 mm square flat plaques of carbon fibre-reinforced PA66 injection-moulded material were manufactured using an industrial injection moulding machine operating under steady state conditions. The average thickness of the plaques was 4 mm. Two different feedstocks were used for production of the plaques. Both feedstocks contain 40 weight percent carbon fibres in the same PA66 polymer. The fibres were premixed in the feedstock, preventing testing of the neat matrix material. The difference between the feedstocks is the FLD one with shorter fibres, which will be referred to as short carbon fibre (SCF), and the other with longer fibres, referred to as long carbon fibre (LCF). The PA66 matrial used in this study was produced by BASF (Ludwigshafen, Germany).
It is of interest to test the effects of the FLD on the mechanical properties and failure of the injection-moulded composites. It is of interest to evaluate the fatigue and mechanical properties of the injection-moulded composite at room and elevated temperatures. For this study, a high temperature of 120 °C was used for applications in internal combustion engines.
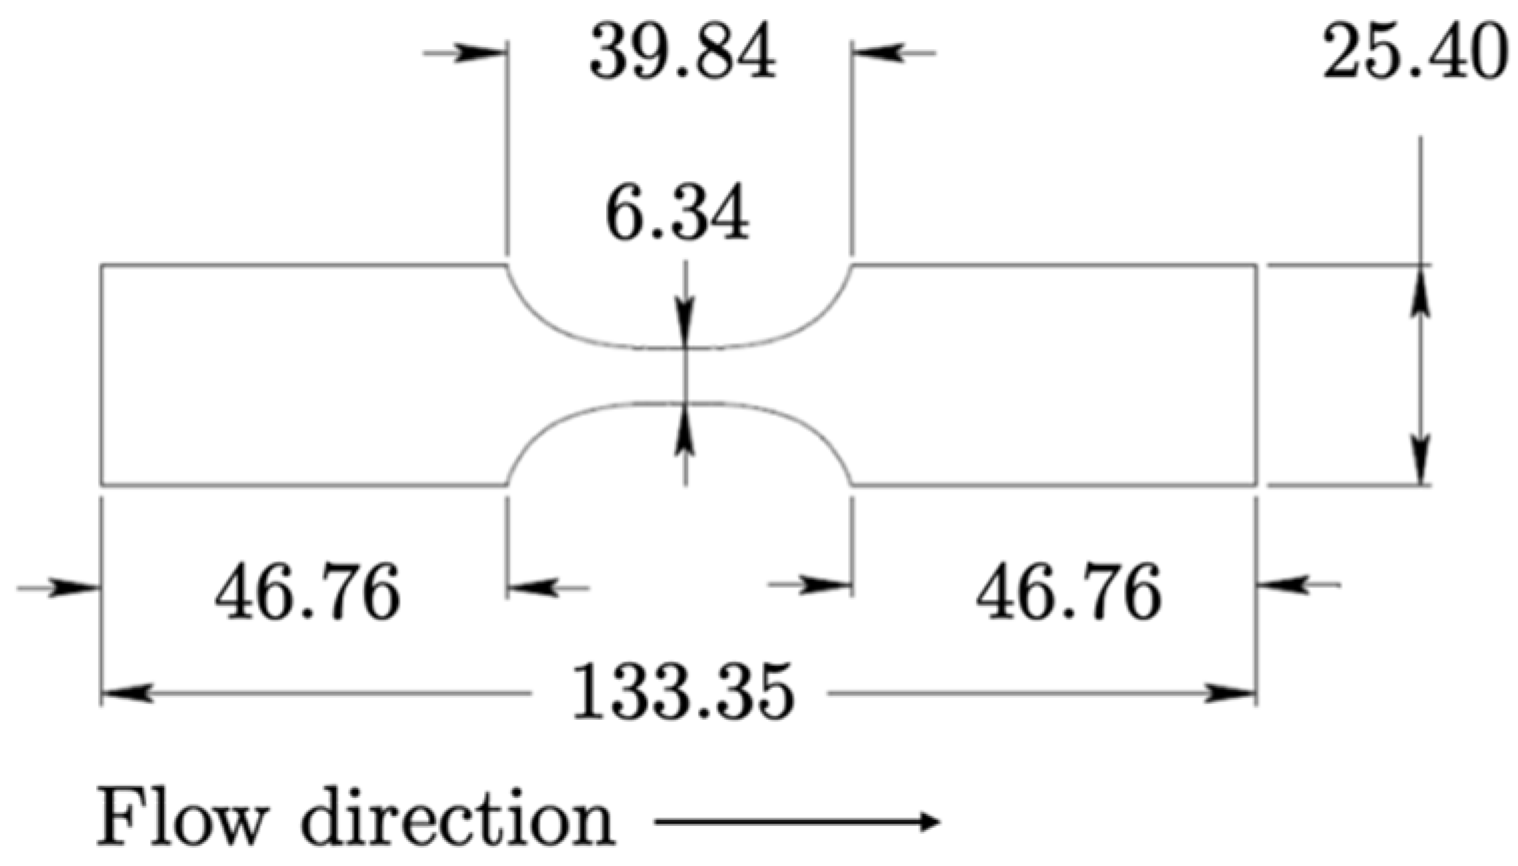
The flat plaques were cut into fatigue test coupons with their main axis aligned with the direction of flow during the injection moulding process. The samples were prepared with waterjet cutting, followed by grinding with 800 grit sandpaper to remove any visible machining imperfections. The fatigue coupon geometry has been presented in [31,32,33] and shown to work for both tensile and compression without use of anti-buckling fixtures. The specimen geometry is shown in Figure 1.

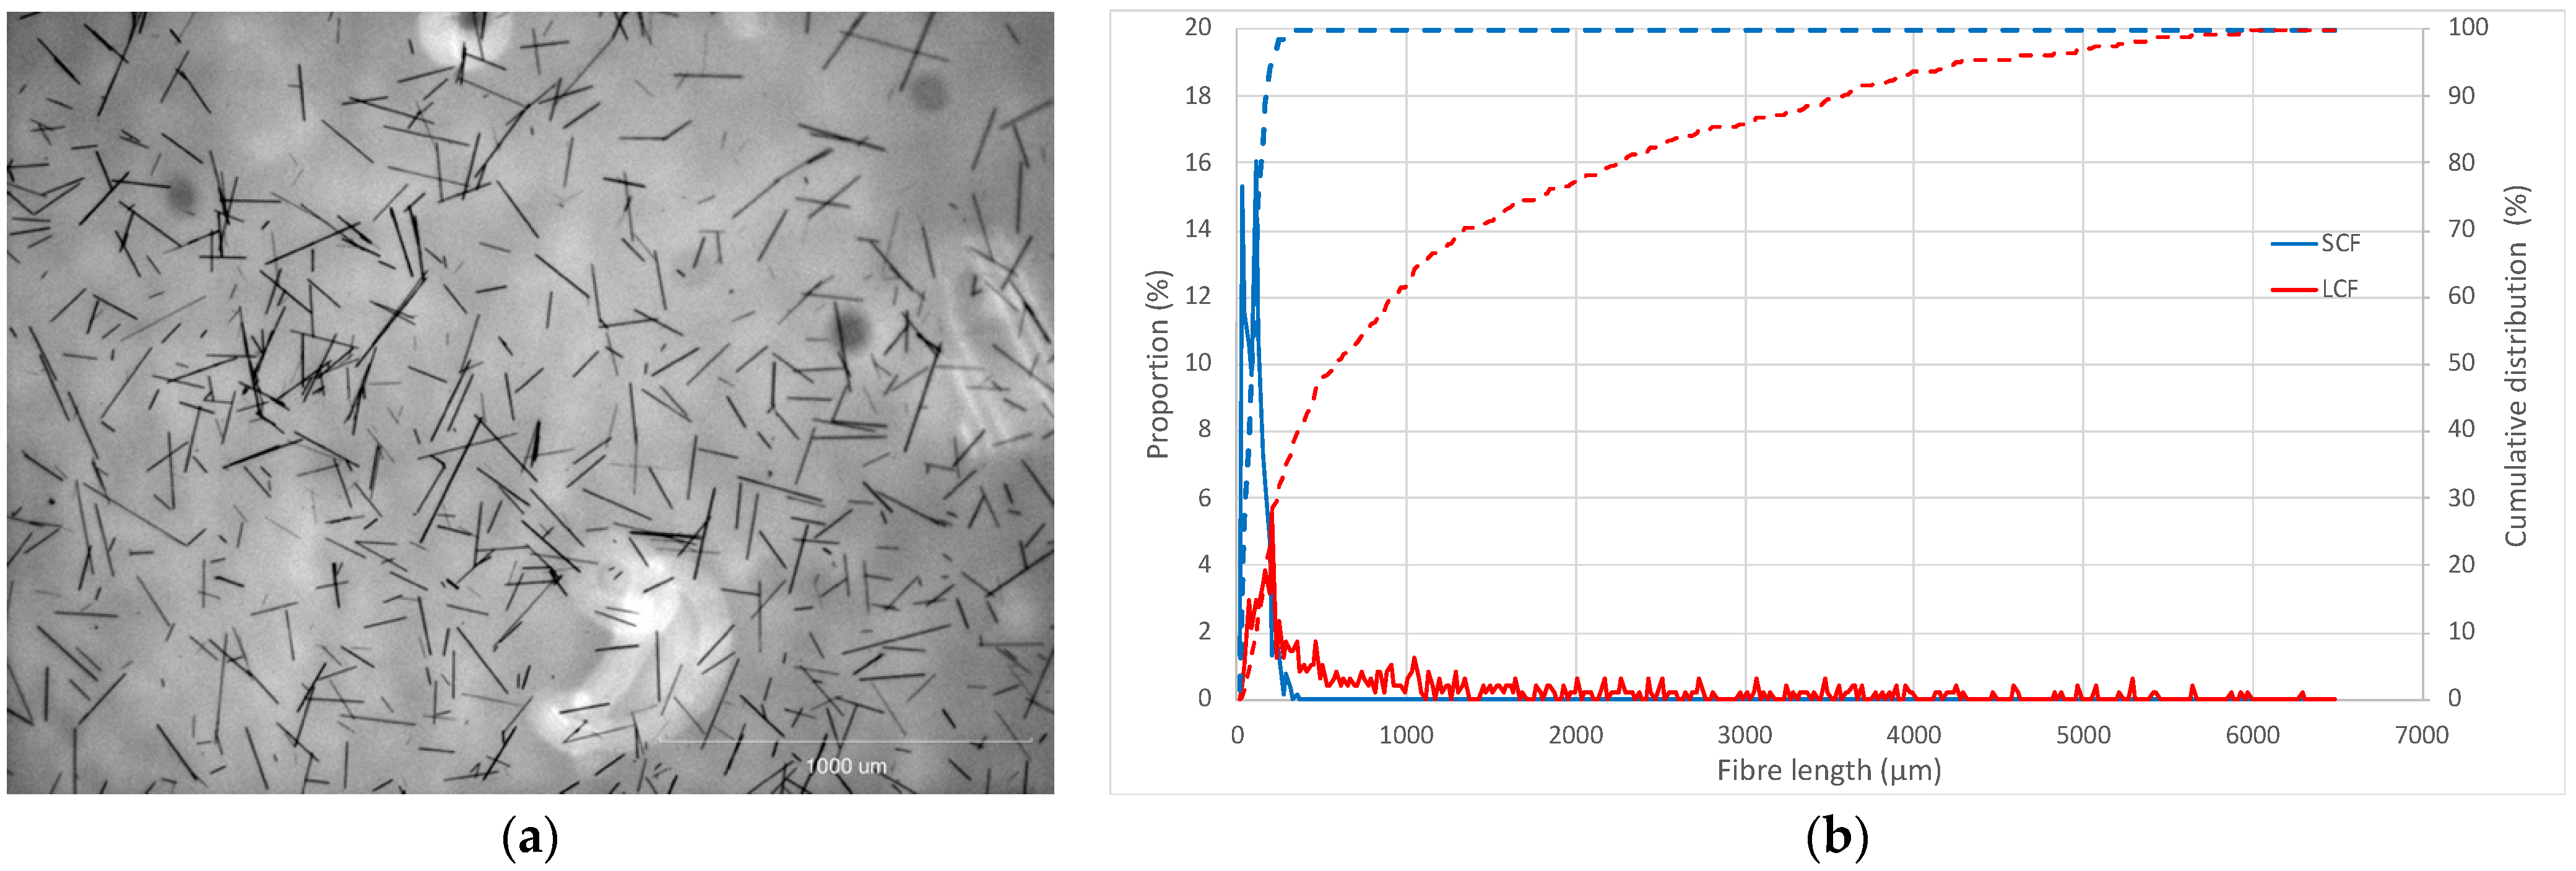
2.1. Fibre Length Measurement

Fibre length measurement was conducted using pyrolysis of the gauge section on the samples. The gauge section was placed in a ceramic crucible within a furnace in an air environment for burning off the PA66. The samples were heated from room temperature to 285 °C at 5 °C/min and held for 1 h at 285 °C. The sample was then heated from 285 °C to 450 °C at 5 °C/min and held for an hour at 450 °C. The samples were then cooled to room temperature. The fibres were placed in a glass container and separated using an aqueous solution. The glass containers were subjected to optical microscopy. The fibre length was measured from the optical microscopy images using Image J. Approximately 500 fibres for both the SCF and LCF were measured to create the FLD.

2.2. Mechanical Testing

Both the LCF and SCF composites were subjected to a series of mechanical testing including static monotonic loading along with fatigue testing with three different stress ratios.

2.2.1. Monotonic Loading

Tension and compression testing were completed using MTS (Eden Prairie, MN, USA) servo hydraulic test frames. The tests were conducted using quasi static (<1 × 10⁻³/s) strain rates until failure. The crosshead speeds used for these tests was 0.2 mm/min. The tests were conducted using the same specimen geometry as the fatigue tests. This was carried out to negate the need for anti-buckling fixtures for the compression tests. Strain was measured using digital image correlation for the monotonic loadings.

2.2.2. Fatigue Loading

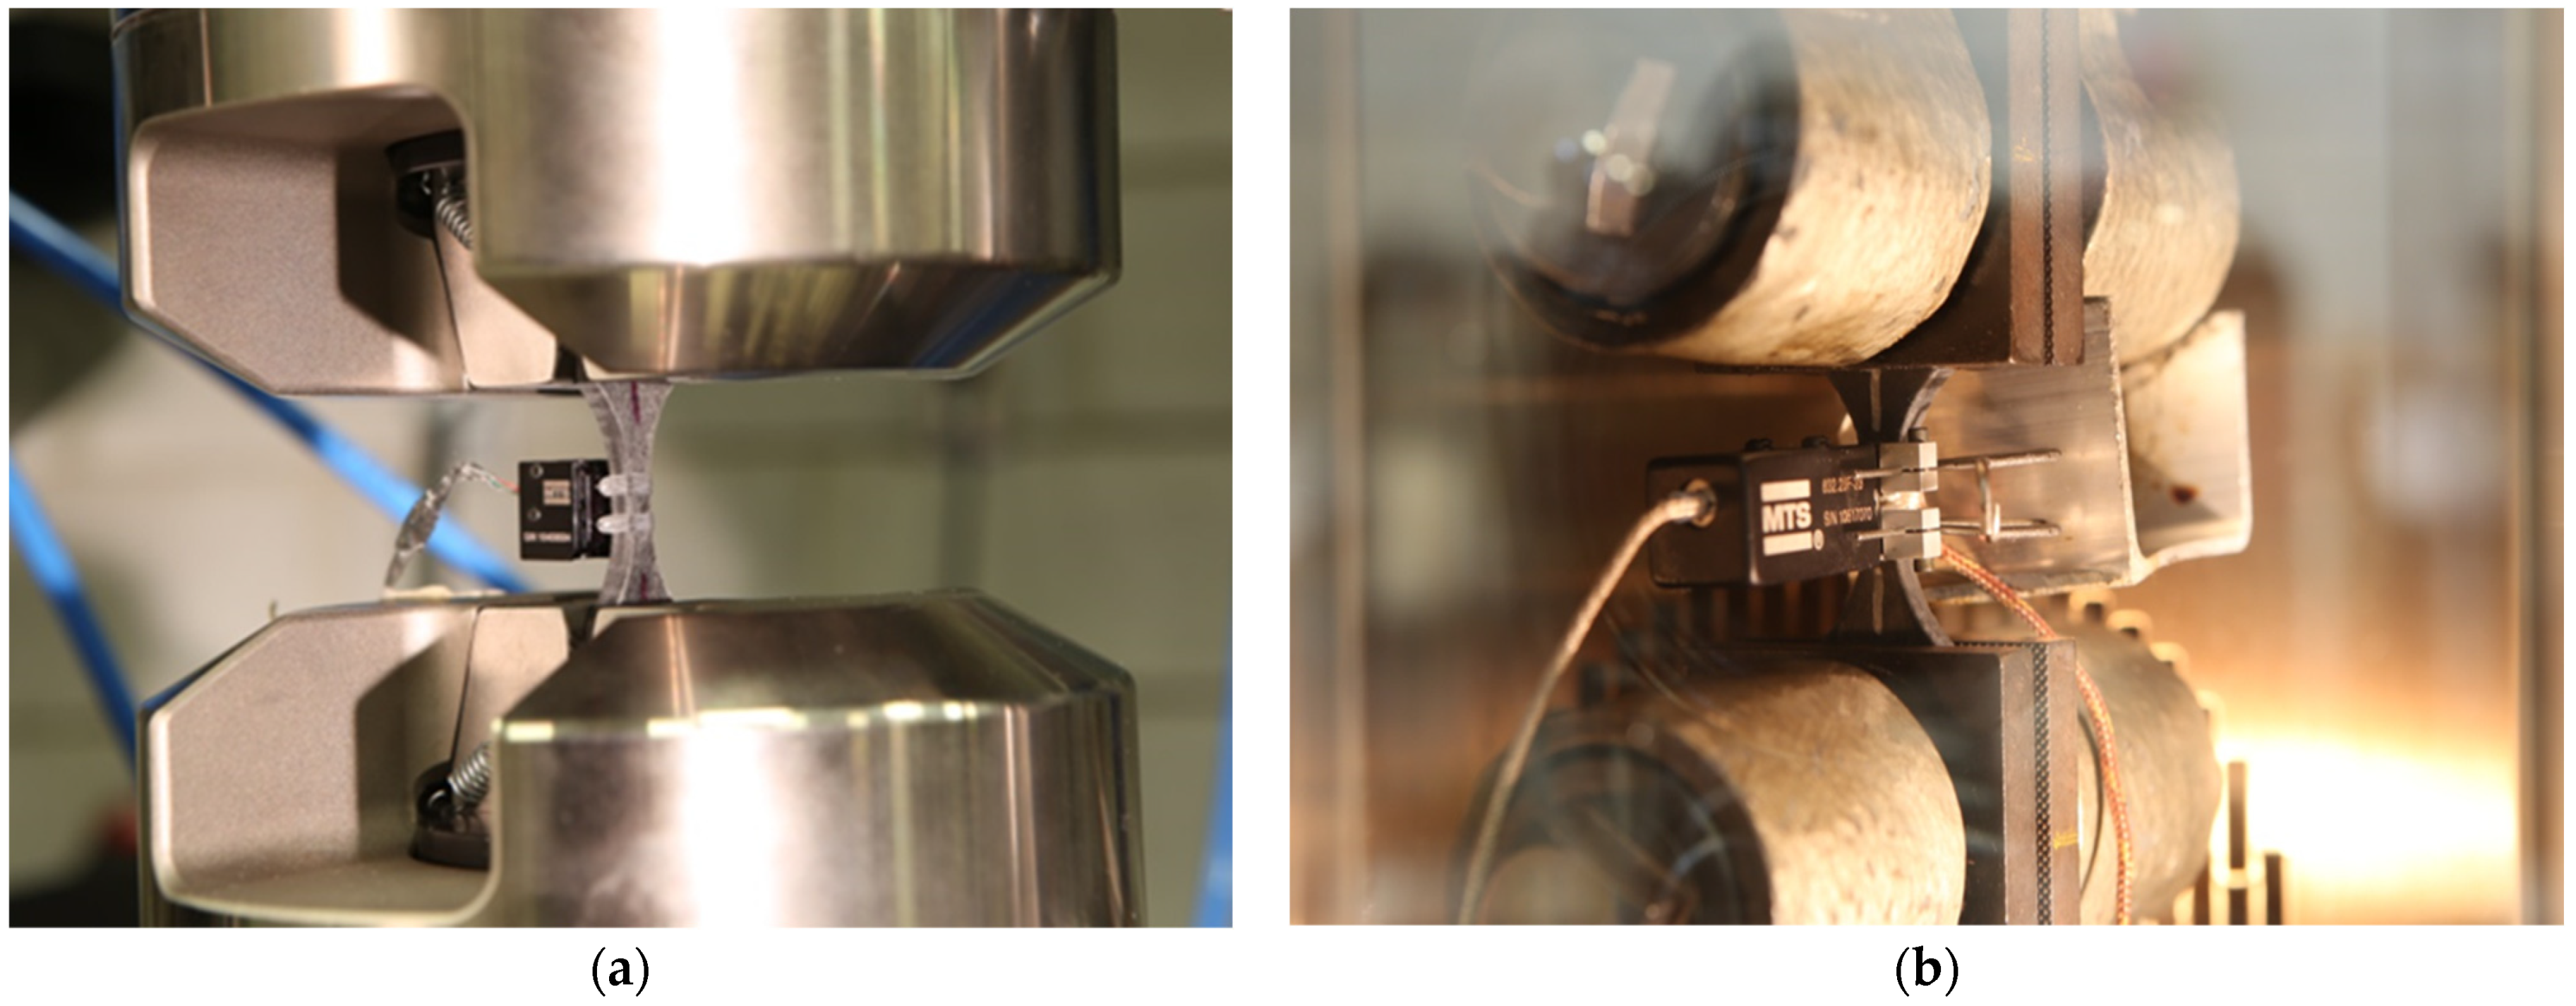
Fatigue testing was conducted under load control on MTS (Eden Prairie, MN, USA) servo hydraulic test frames. Tests were conducted until failure or 2 million cycles as a run-out value. The strain during the fatigue tests was measured using an extensometer with a 6 mm gauge length. For testing at 120 °C, an environmental chamber was added to the test setup and the temperature of the specimens was monitored with a thermocouple. A test frequency of 2 Hz was used for all testing to avoid internal heating of the samples due to the cyclic loading. The same loading frequency has been shown to avoid internal heating in [6]. An image of the fatigue test setup is shown in Figure 2 for room and elevated temperature testing.
The fatigue test loads were established using the staircase method based on the progress in the fatigue tests. This method involves completing a test, then if there is a run-out point, to increase the stress amplitude by one step and progress until the sample fails during the test procedure. Conversely, if there is a failure at a given amplitude, the stress amplitude is reduced by one step to establish the stress level, which causes the sample to not fail during fatigue testing.
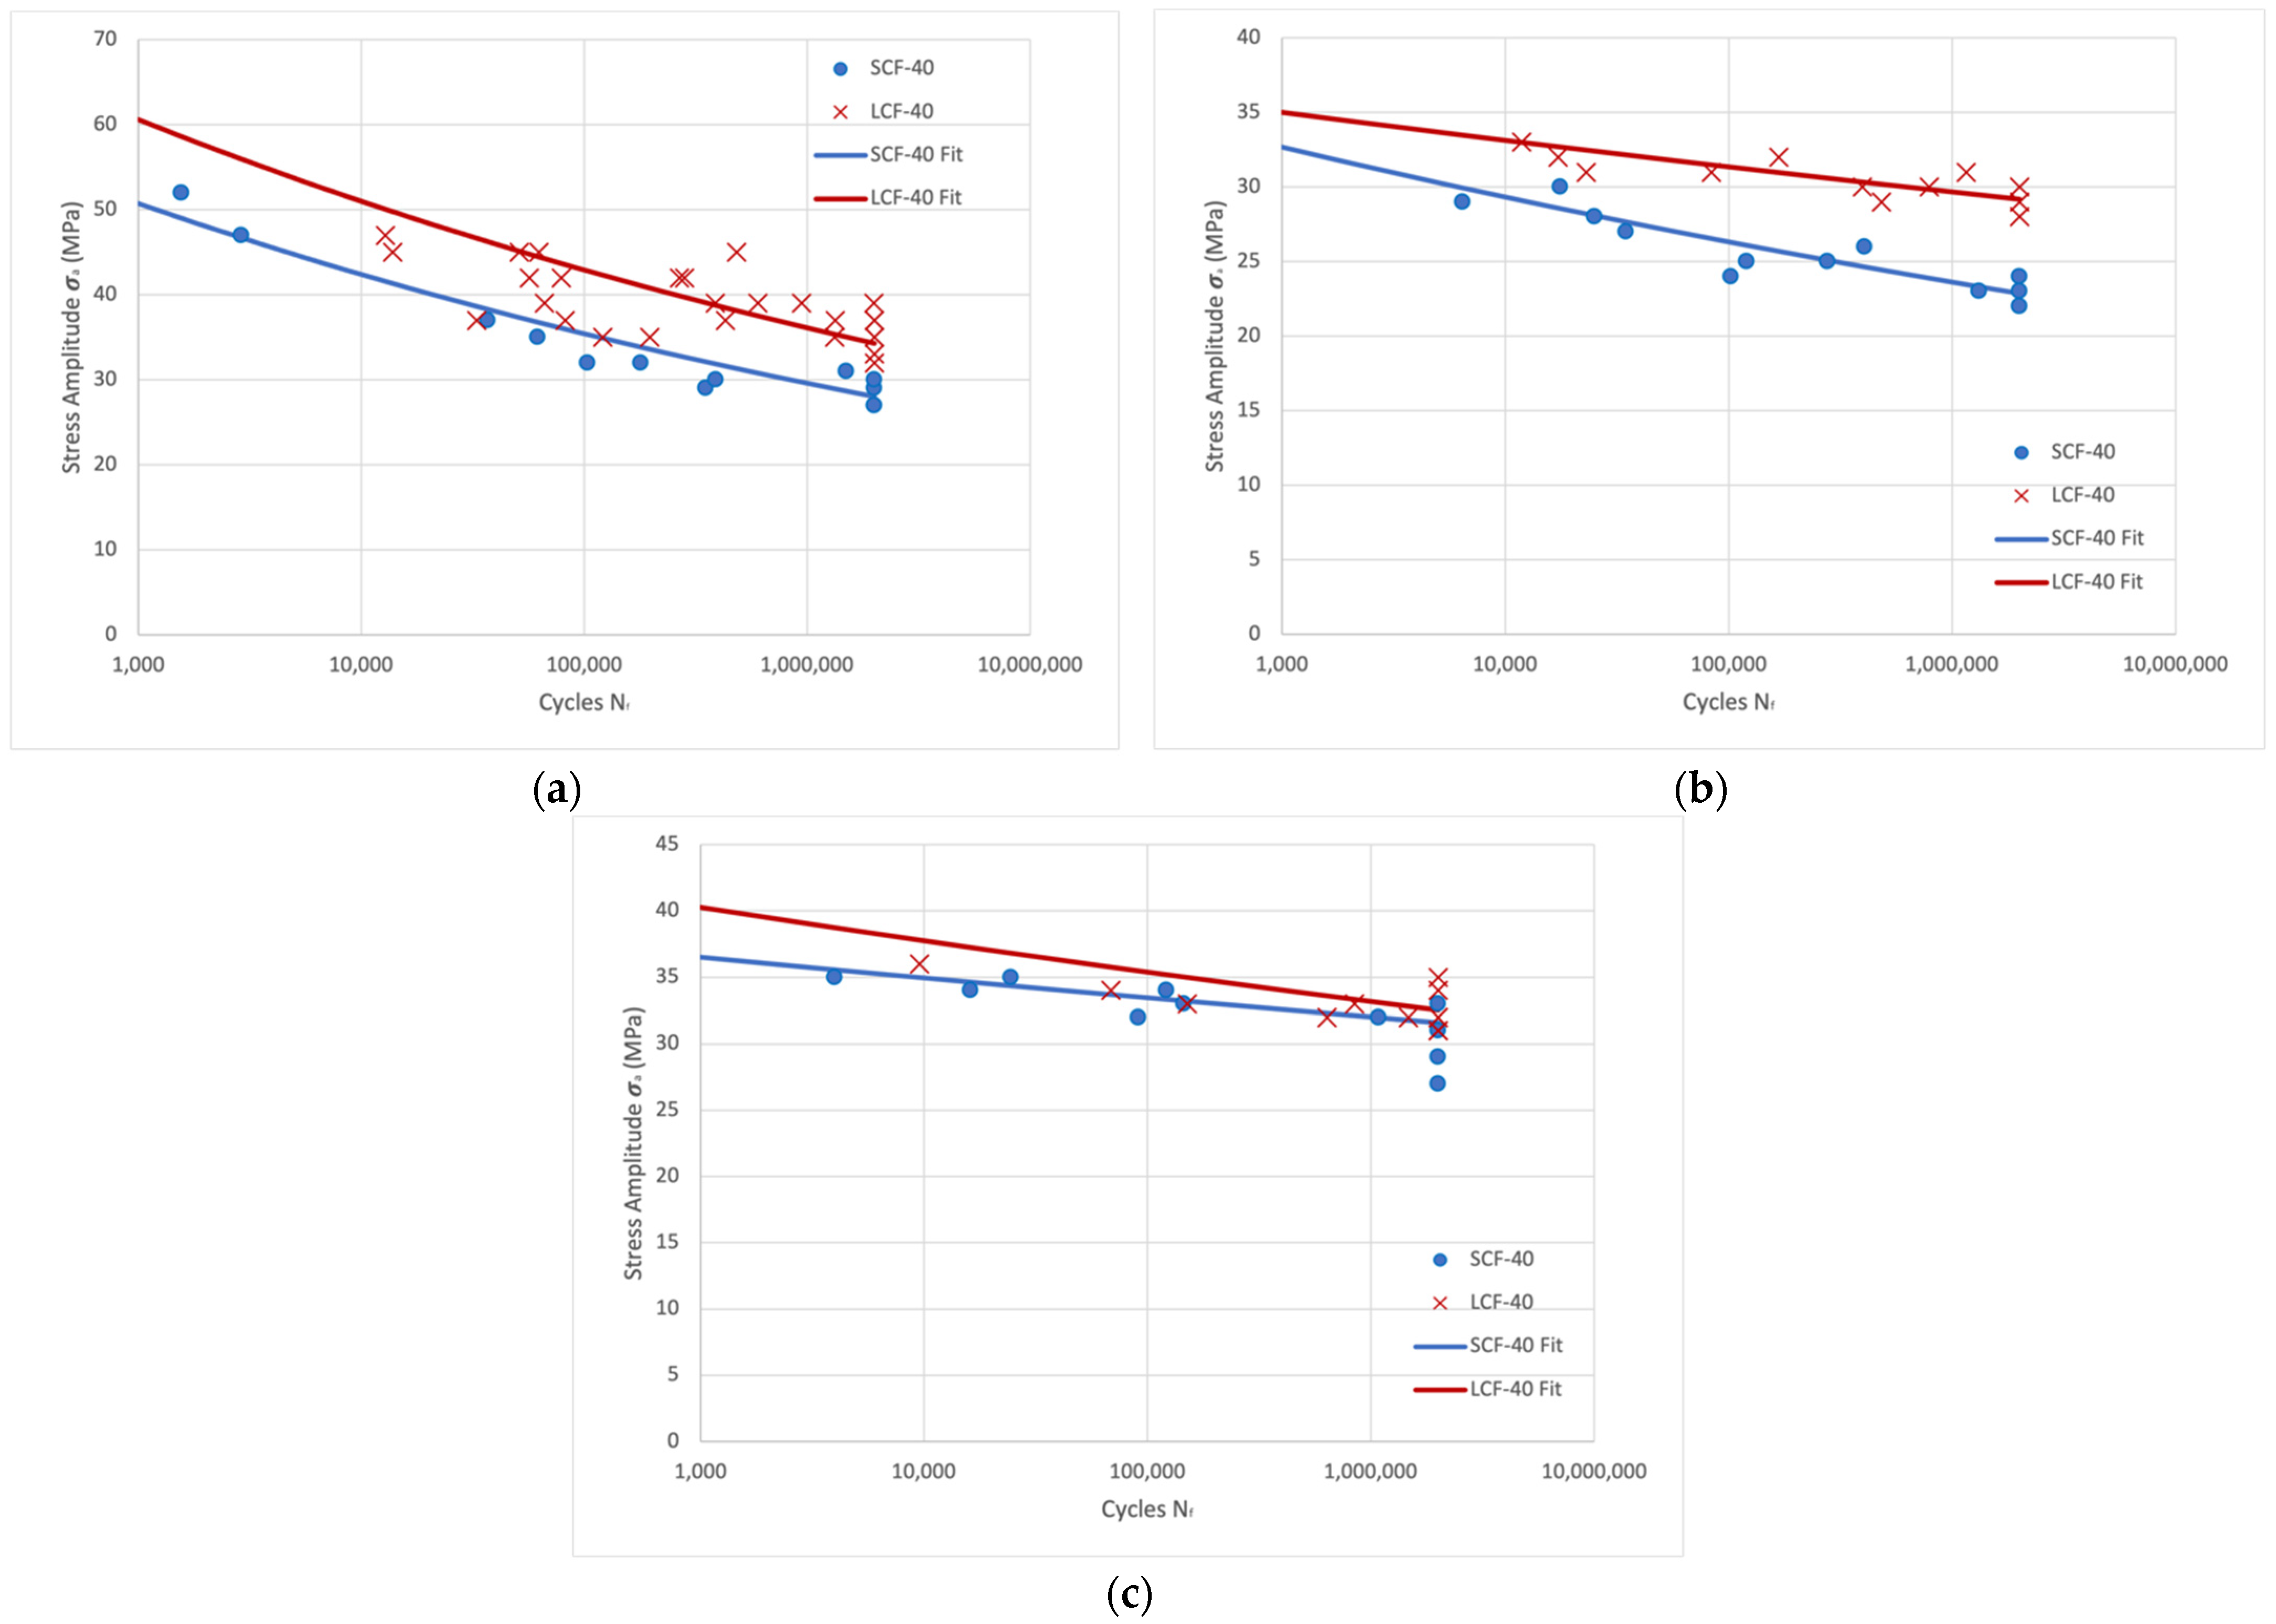
Fully reversed loading was completed at room temperature. At 120 °C, testing under three different stress ratios was completed with R ratios of R = 0.1, R = −1, and R = 10 for tension–tension, tension–compression, and compression–compression, respectively. These test conditions were repeated for both SCF and LCF coupons.
The fatigue test results were fit to a Basquin fatigue equation using the maximum likelihood method for fitting, which accounts for both the failed specimens and run-out points [34]. The Basquin equation is given as
σ a = σ f ( 2 N f ) b
where σ a is the stress amplitude, σ f is the fatigue strength coefficient, N f is the number of cycles to failure, and b is the fatigue strength exponent. In log space σ f represents the y-intercept value and b the slope of the fatigue curve. For the tension–tension and compression–compression fatigue tests, an equivalent stress amplitude was used.

2.3. Fracture Surface Analysis

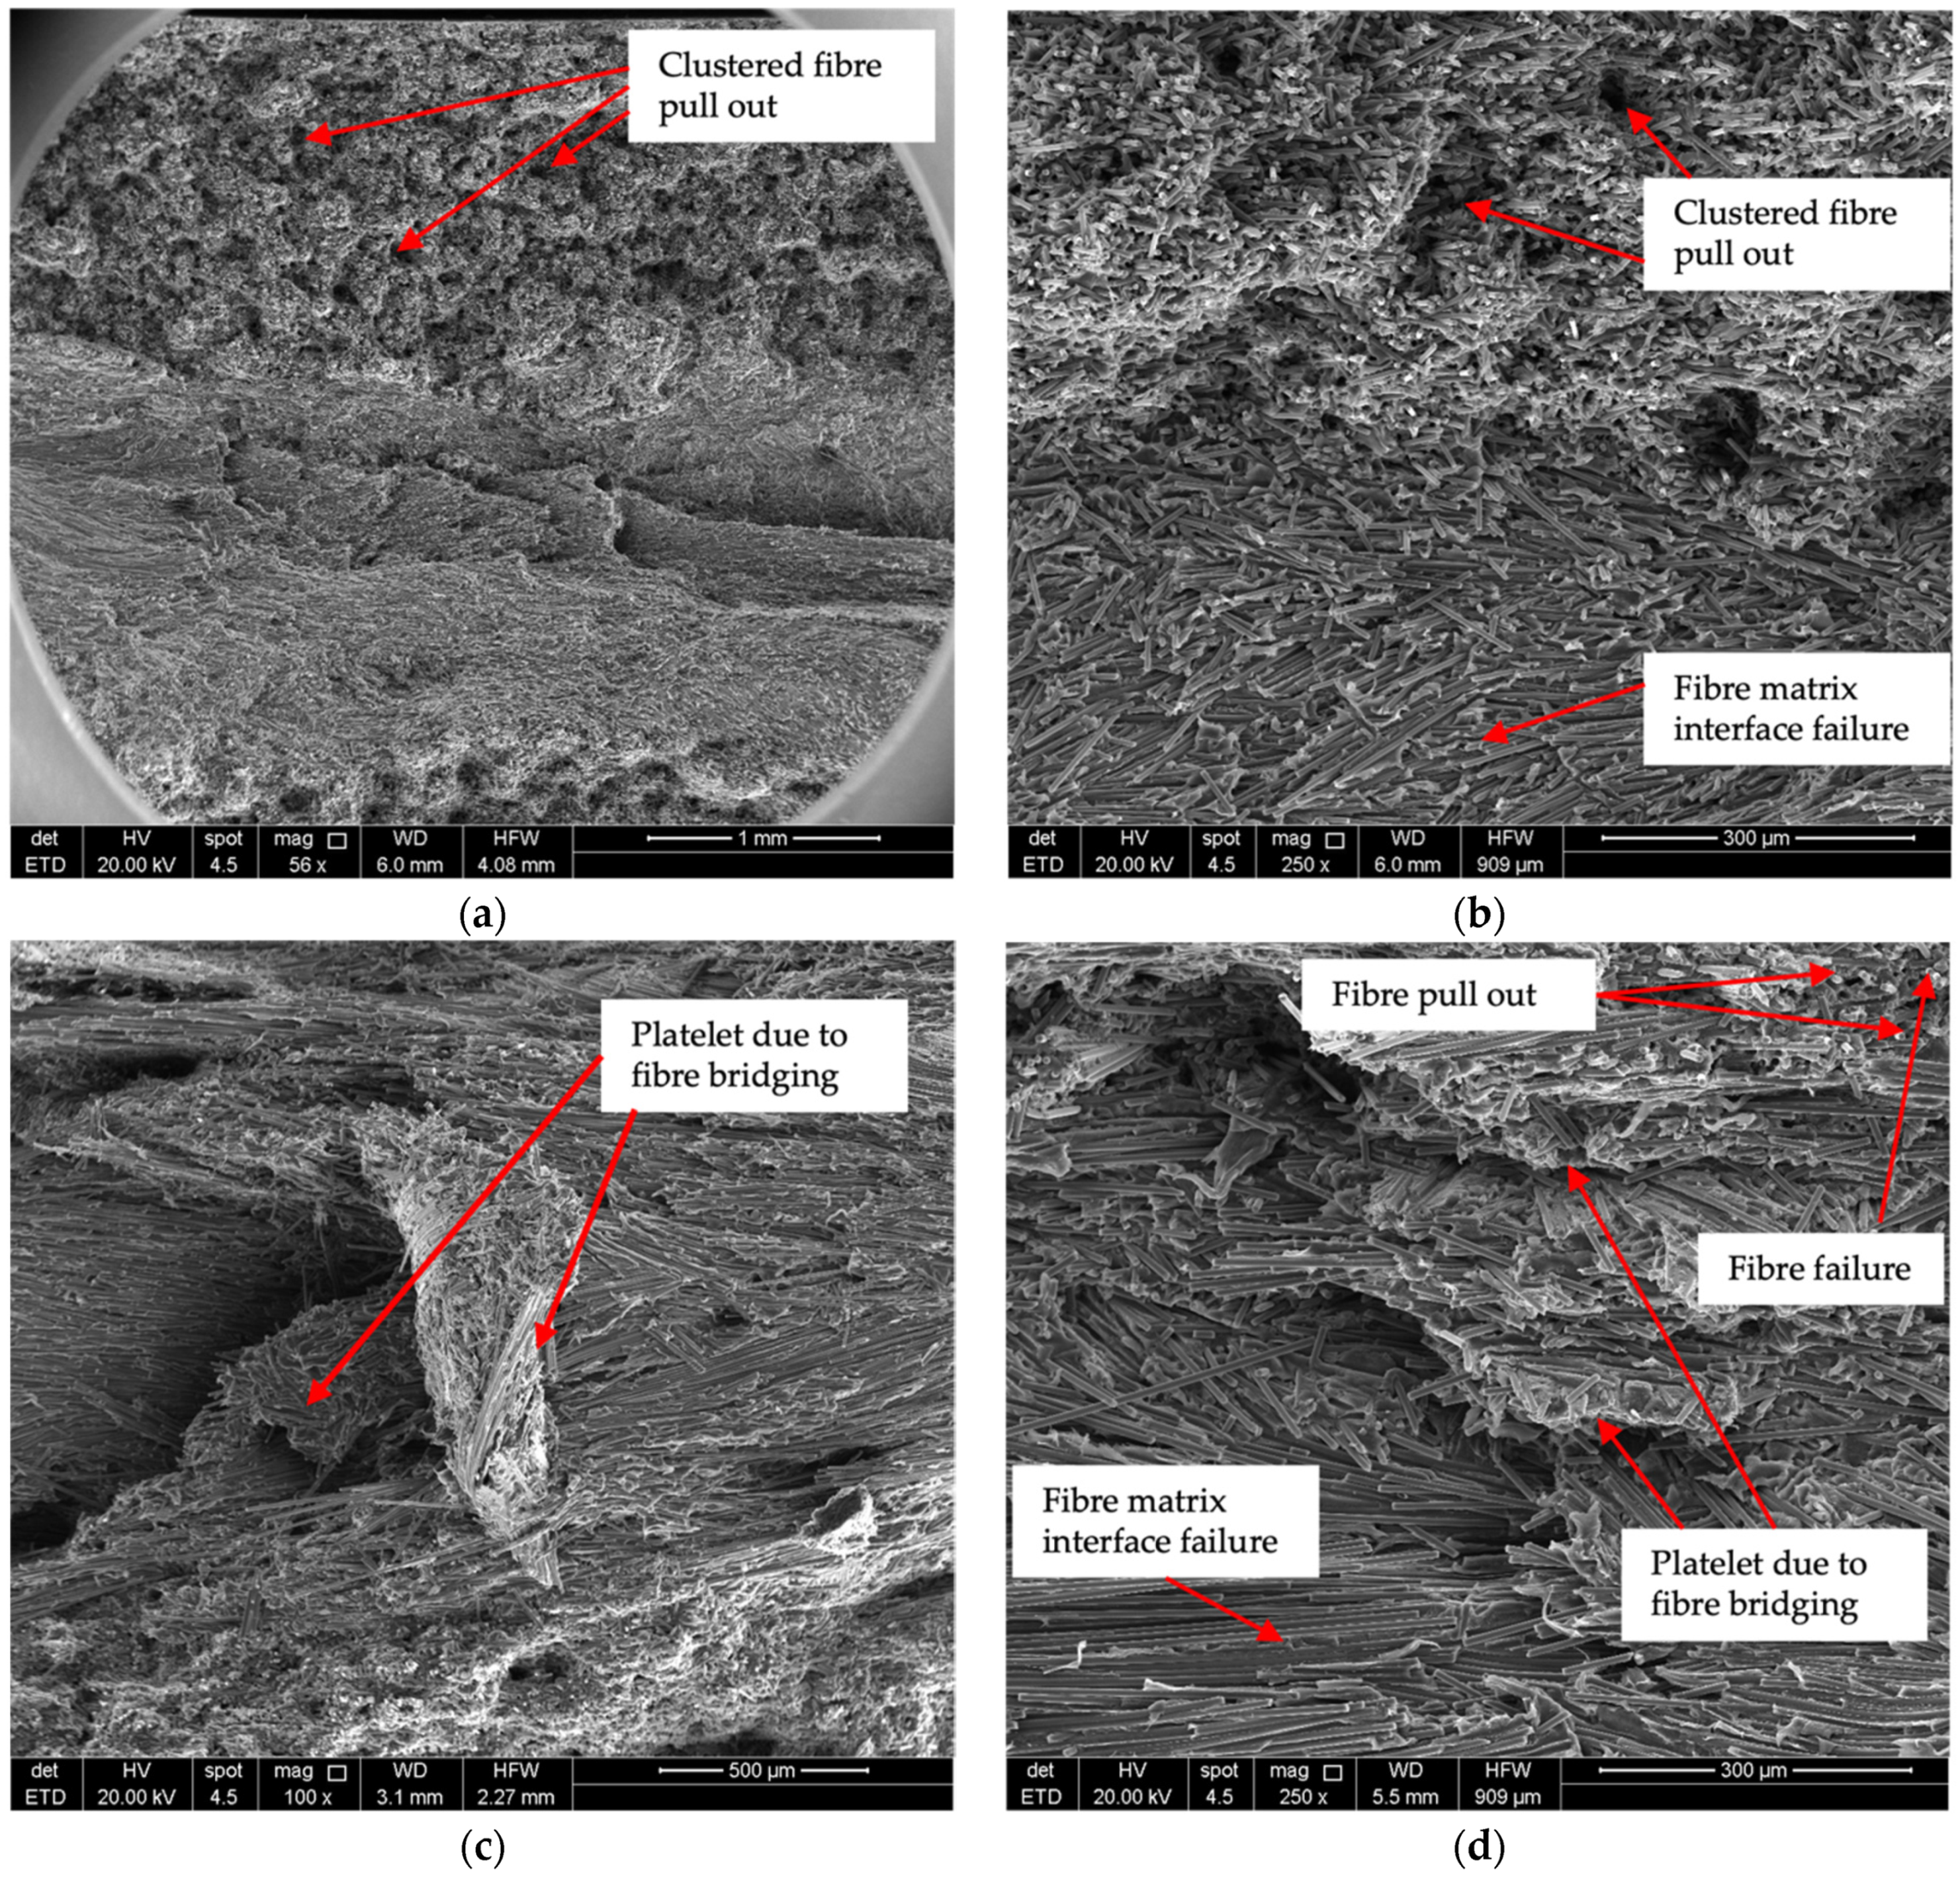
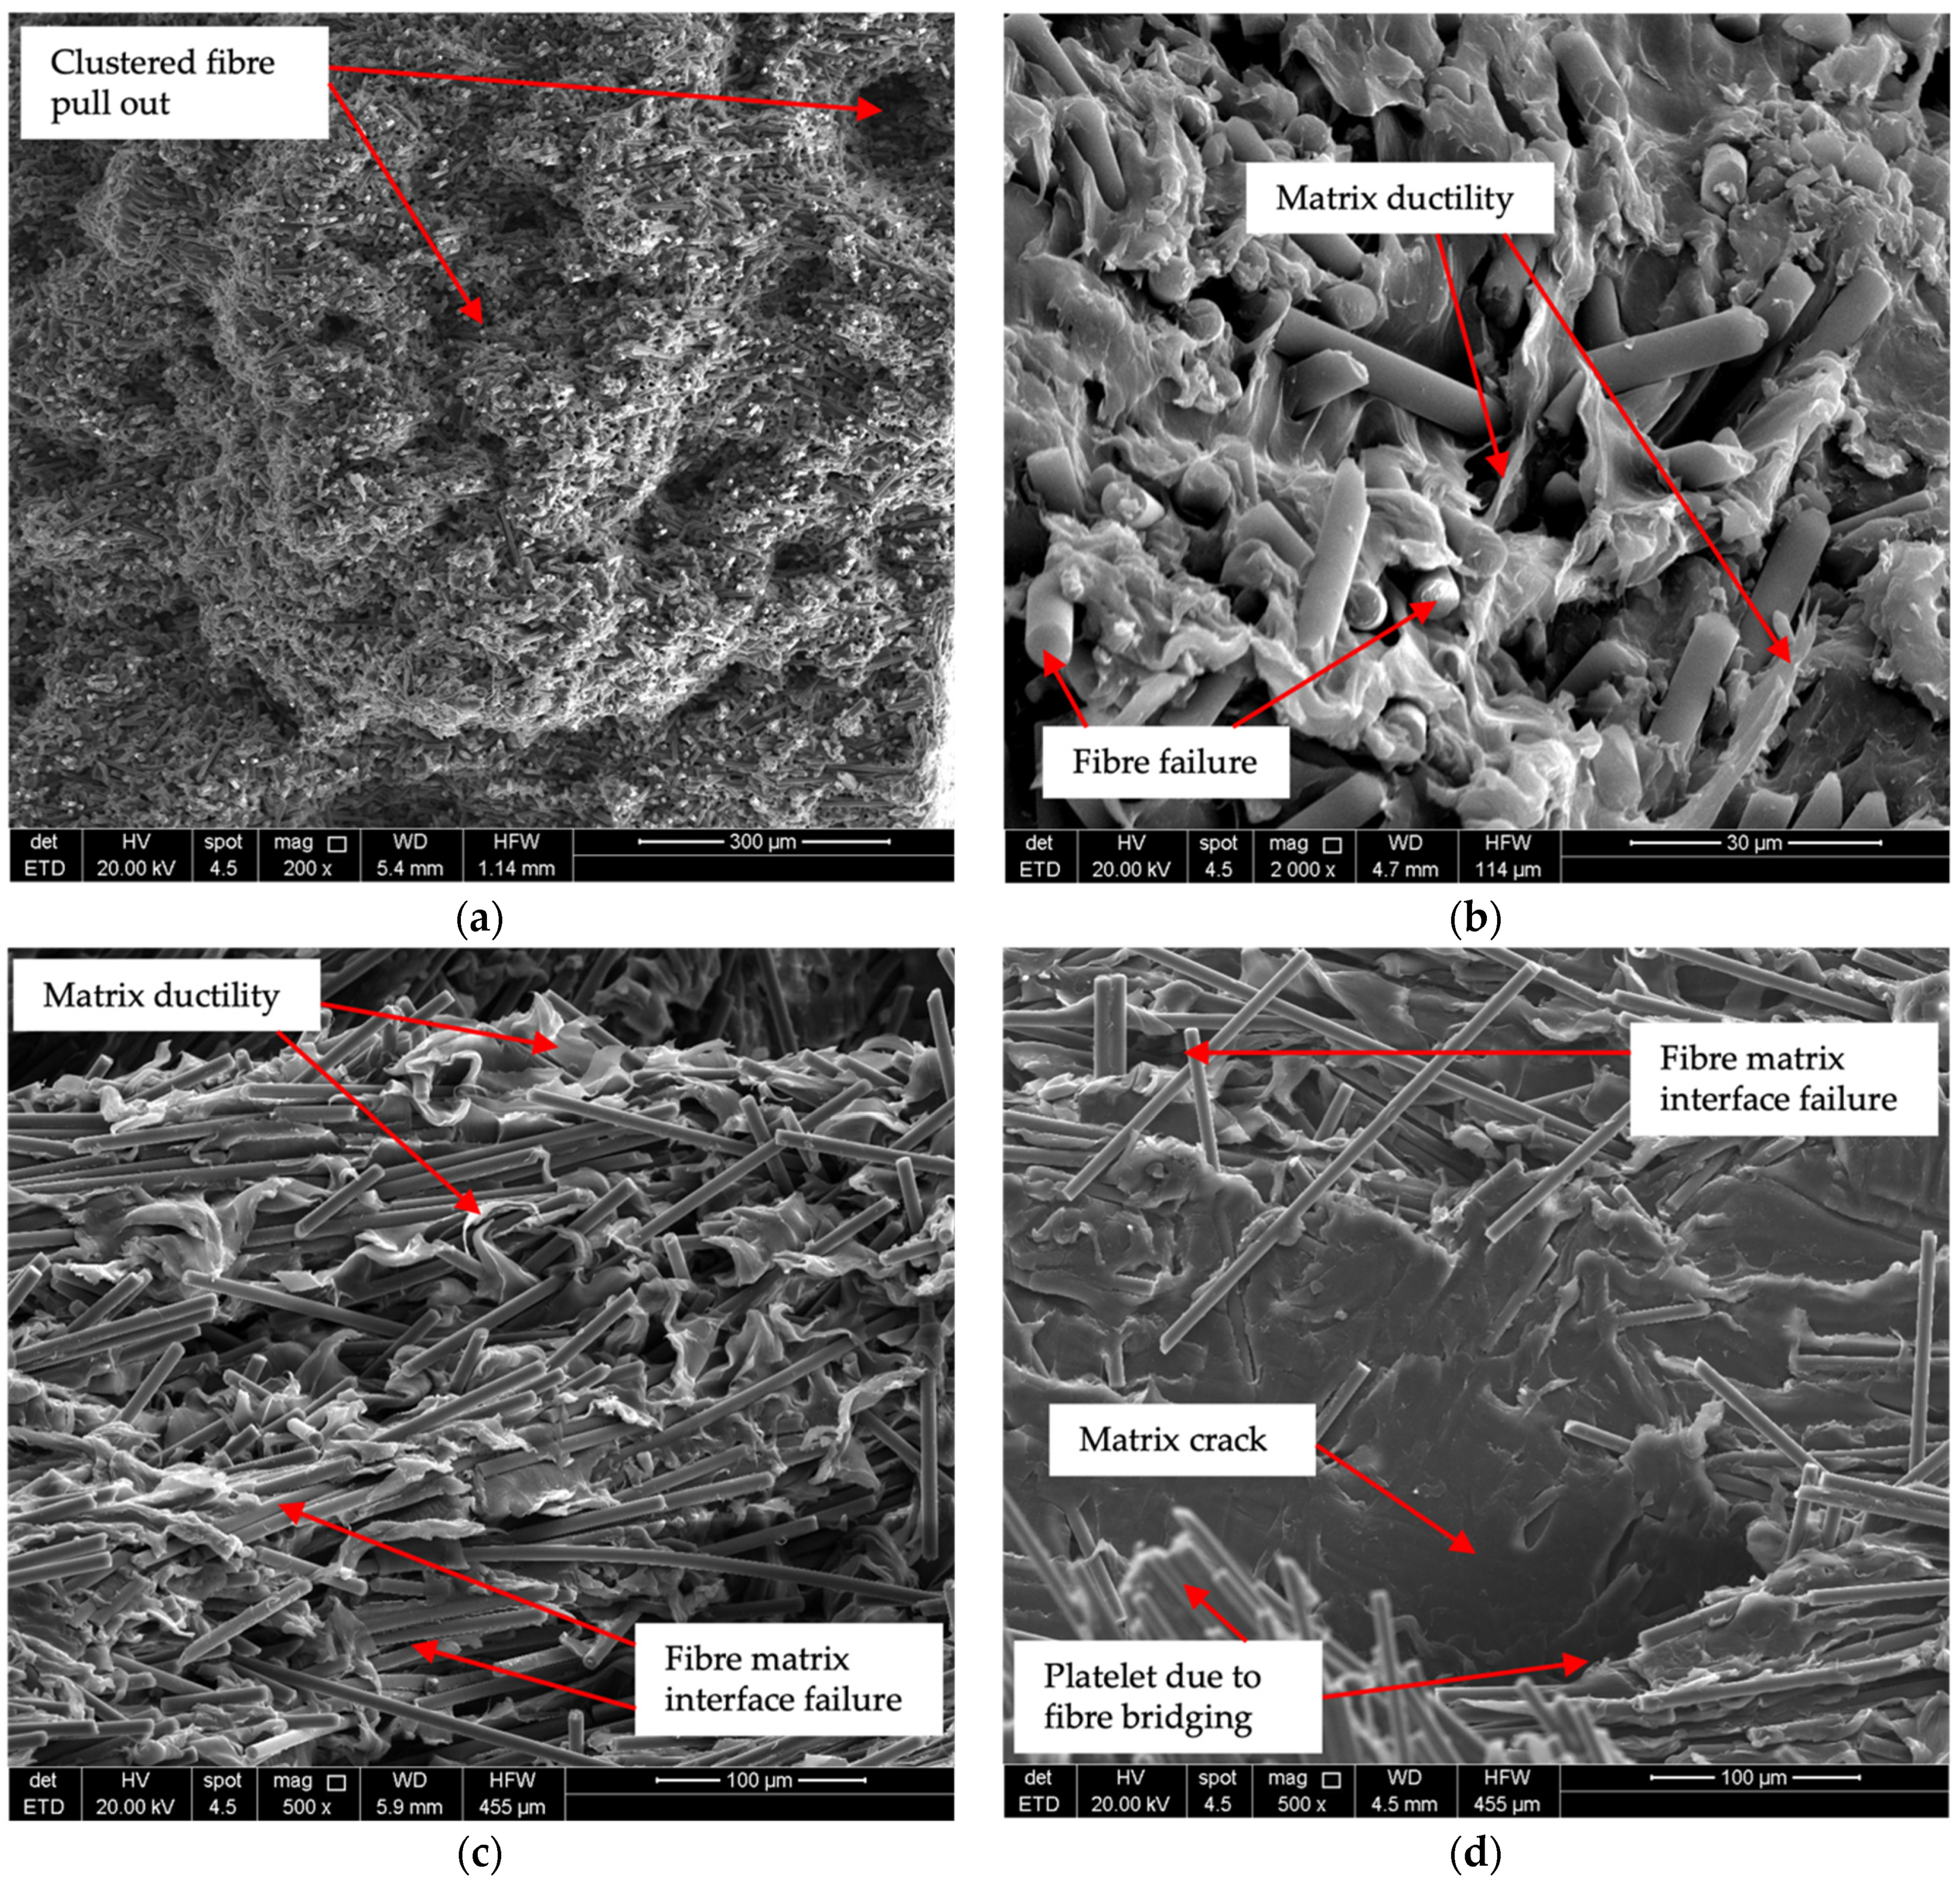
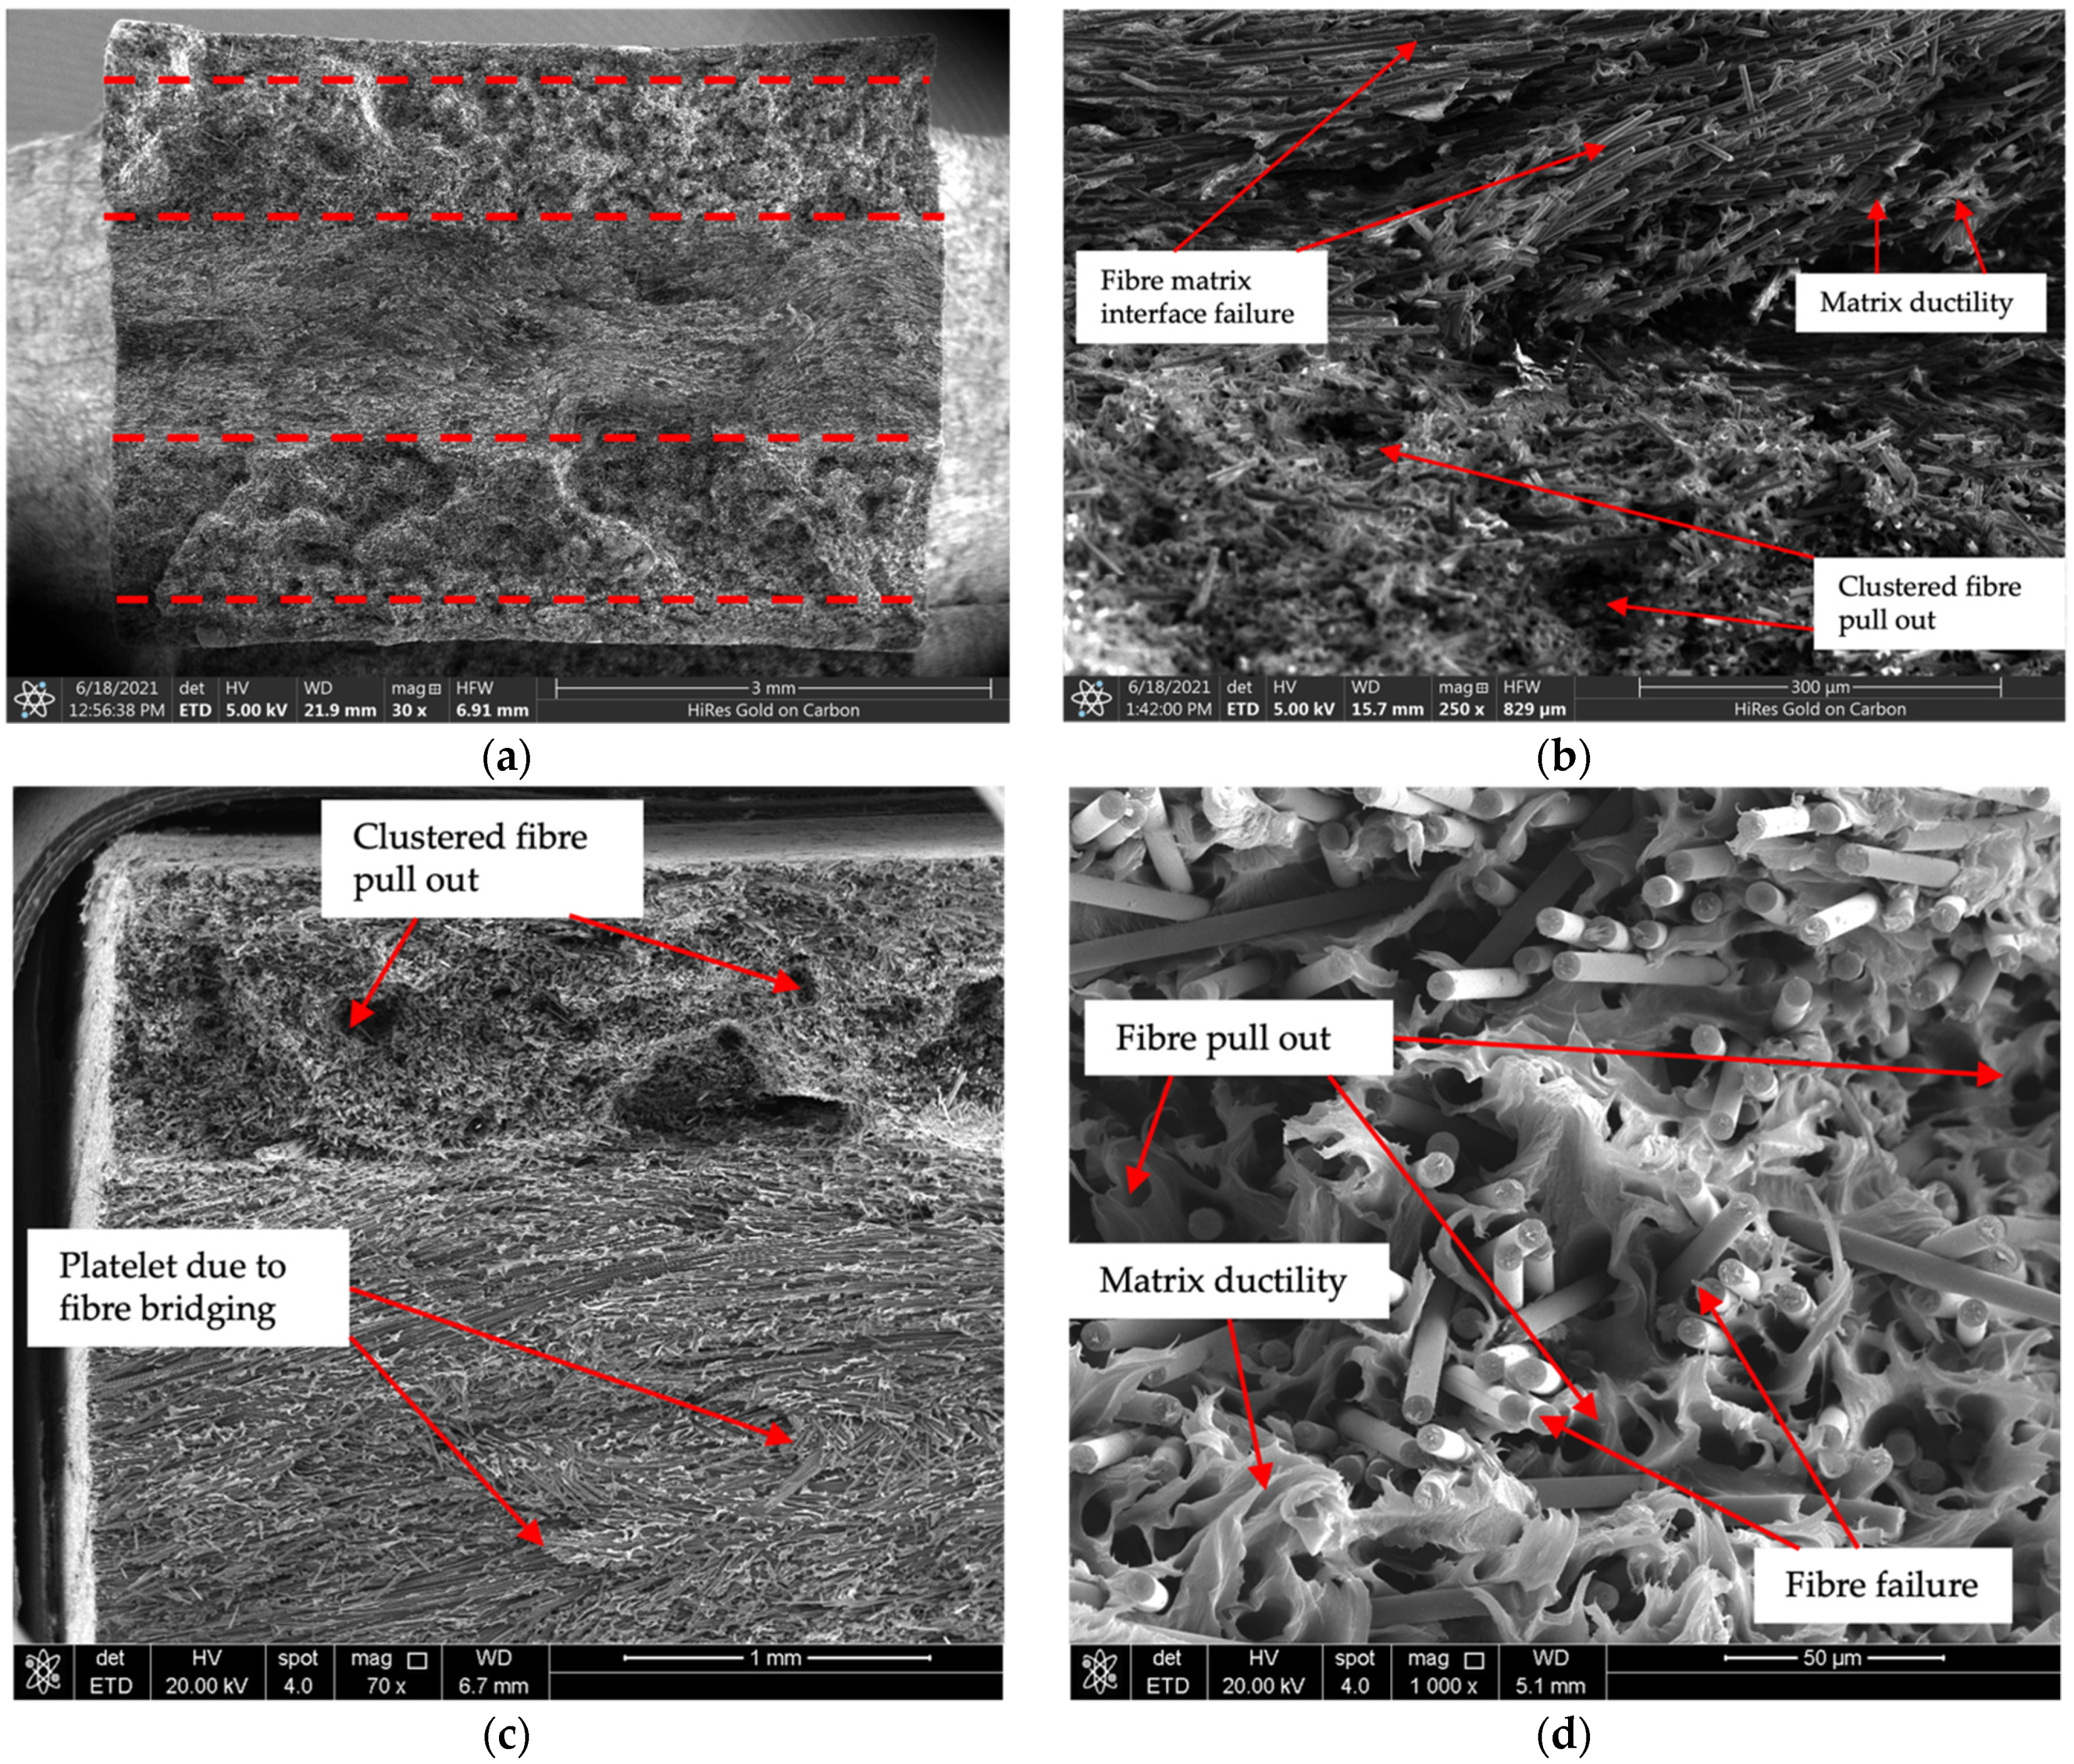
After testing to failure, selected fatigue test specimens were subjected to scanning electron microscopy (SEM) to evaluate the failure modes present under the different fatigue loading conditions. SEM was used to evaluate the fracture surfaces as it does not require mounting or polishing of the samples before viewing, allowing preservation of the fracture details such as fibre breakage, matrix cracking, fibre pull-out, fibre buckling, and interfacial failure. The SEM analysis allows for qualitative analysis of the fracture modes present and to compare the differences between the observed failure for the different load cases.

3. Results

3.1. Fibre Length Distributions

The FLDs for both SCF and LCF materials along with an example micrograph used for fibre length measurement of SCF are shown in Figure 3. Bin sizes of 20 microns were used to create the FLDs. The proportion represents the percentage of the fibres which have a length within the 20-micron increment for the bin. The cumulative distribution is the integration of the proportion and represents the proportion of all measured fibres under a given fibre length.
For the SCF material a fibre length of 100 microns corresponds to 50% of the cumulative distribution and will be used to represent the average fibre length. For the LCF material a fibre length of 580 microns corresponds to half of the number-weighted cumulative distribution. The maximum fibre length detected in the SCF material was 357.2 microns which is less than the average fibre length of the LCF material. For the LCF material a maximum measured fibre length was 6.29 mm. The fibre length distribution for the LCF material contains much more fibre length variation, especially for longer fibre lengths where 10% of the fibres are longer than 3.57 mm. These longer fibres are expected to affect the resulting material properties in terms of strength.

3.2. Monotonic Loading Results

Monotonic tensile testing of the fatigue test coupons shown in Figure 1 was completed at room temperature and 120 °C. Compressive testing was also completed at 120 °C to evaluate the monotonic properties for the samples subjected to compression–compression fatigue loading. At least three repeats were conducted for each load case. The standard deviation in properties for the test set is reported as the plus minus quantity for each value. The room temperature results are given in Table 1.
The SCF material is 12.0% stiffer than the LCF material, whereas the LCF material is 21.9% stronger than the SCF material at room temperature. From the standard deviation, it is observable that the error bars for the modulus nearly overlap; however, there is a significant difference in the tensile strength. The elevated temperature tensile and compressive properties of the materials are given in Table 2.
Similarly to the room temperature results, the LCF material is 22.9% stronger than the SCF material in tension. The LCF material is 4.6% stiffer than the SCF at 120 °C, however the error bars overlap each other making the modulus very similar between the two materials. The compressive strength is 6.7% higher in the LCF material than the SCF material. The margin of error for the SCF material overlaps with the margin of error for the LCF material during compressive testing and are therefore very similar. It is also noted that the standard deviation is always larger for the SCF material at 120 °C. The difference in tensile strength is significantly higher than the compressive strength and is likely due to the difference in fracture mechanisms. It is interesting the note that the compressive strength of the SCF material is slightly higher than the tensile strength at 120 °C. This further confirms that the sample geometry does not negatively impact the compressive test results. The temperature increase causes a 41% reduction in the elastic modulus and a 57.3% reduction in strength in the LCF material. For the SCF material, there is a 57.7% reduction in strength from room temperature to 120 °C. These results demonstrate the temperature dependence on the mechanical properties of the injection-moulded PA66 composite material. For the matrix material at room temperature the stiffness is 1.54 GPa and at 120 °C the stiffness is 325 MPa [35]. These values are significantly lower than the stiffnesses of the reinforced material. The room temperature strength in 60 MPa; however, testing at 120 °C was not conducted by the supplier [35].

3.3. Fatigue Results

The fatigue results for the LCF and SCF material tested at room temperature are shown in Figure 4.
The fit parameters to the Basquin Equation (1) for both LCF and SCF material along with the number of experiments to create Figure 4 are given in Table 3.
Although the fatigue tests results are very similar for the SCF and LCF materials, the fitting parameters show that there is a slight difference. The fitted slope of the SCF curve is higher than the LCF curve; however, the results are within the expected scatter of each curve. Thus, the LCF and SCF material have nearly identical fatigue properties under fully reversed loading at room temperature.
The fatigue results for the LCF and SCF materials at 120 °C for the three stress ratios are given in Figure 5. At elevated temperatures the FLD has a significant impact on the fatigue properties for tensile load cases. For the compression–compression fatigue test shown in Figure 5c, the fatigue life indicates that there may be threshold stress below which the samples reach run out without failure. This indicates that a different failure mode might be dominant during compression fatigue loading at elevated temperatures. The fitting parameters for the Basquin Equation (1) for the fatigue results at 120 °C along with the number of experiments for each load case are given in Table 4.
The slope of the S-N curve given by the fatigue strength exponent is significantly lower for R = 0.1 and R = 10 compared with the R = −1 results. The slope of the S-N curve for both SCF and LCF are similar for R = −1; however, the fatigue strength coefficient is 15.4 MPa lower for the SCF material. This results in nearly 10 times shorter fatigue life for a given loading for the SCF material when compared with the LCF material under fully reversed loading. For the tension–tension fatigue, the slope of the S-N curve is steeper for the SCF material, and although the fatigue strength coefficient is higher for the SCF material, the fatigue life is always shorter for a given stress amplitude than the LCF material. Stress amplitudes that resulted in failures of the SCF material below 100,000 cycles result in run-out points for the LCF material showing the difference in fatigue life between the two materials. For the compression–compression fatigue, the slope for the LCF material is higher than the SCF material; however, the curves never intersect, and the LCF fatigue curve remain above the SCF material. The low slope of the S-N curves indicates that the relationship between stress amplitude and number of cycles to failure is weaker than the other load conditions. It may be appropriate to consider a minimum stress threshold for fatigue failure in compression–compression loading.

3.4. Fractography Results

Fracture surfaces of the fatigue specimens were subjected to SEM to evaluate the micro-mechanics-based failure modes present under the different loading conditions. The room temperature fracture surfaces are presented in Figure 6; the samples were selected to have one with shorter fatigue life and one with longer fatigue life to contrast similarities and differences in the observed failure mode.
The images for the SCF material denote that there is a clear delineation between two separate regions due to fibre orientation. Towards the bottom of the image, the fibres are aligned parallel to the fracture surface in the core region of the injection moulding. In this area, the apparent failure mode is due to cracks along the interface between the fibres and matrix, which is clearly visible in Figure 6b at a higher magnification than Figure 6a. The shell region where the fibres are aligned with the flow is shown in the upper portion of Figure 6a,b, normal to the fracture surface. In this area, clustered fibre pull out due to interface failure appears to be the primary failure mode with some fibre failure. The clustered fibre pull out results in the pits seen in the fracture surface at the top of Figure 6a,b.
For the LCF material, the fracture surface seems less smooth resulting in platelets of the composite material staying intact. Based on how matrix-free the exposed fibres are, it suggests that failure once again occurs along the interface between the fibre and matrix, as seen in Figure 6d. Some of the core shell fibre orientation alignment is visible, with most of the image in Figure 6c,d being in the core region where the fibres are aligned perpendicular to the flow. Towards the bottom and top of the images there is evidence of fibre pull out and breakage in fibres aligned with the loading direction. This supports the theory that under R = −1 failure initiates as damage along the fibre matrix interface [21,25].
For 120 °C under fully reversed loading, the fracture surfaces are shown in Figure 7. For the SCF material, the fracture features are similar to those observed at room temperature with a fracture surface where fibres are broken or have pulled out of the matrix material in the shell orientation region. Similarly, there are also pits from clusters of fibres pulling out together as seen in Figure 6b and Figure 7a for room temperature. Fibre breakage and pull out are clearly visible in Figure 7b. For the LCF material, the fracture surfaces again show signs of interfacial failure between the fibre and the matrix. The matrix failure in Figure 7c shows signs of more ductile failure as it appears to have stretched during final failure, resulting in the curled portions of the matrix being visible. In Figure 7d there is a prominent matrix crack that runs appears similar to the platelets experienced at room temperature shown in Figure 6c,d. The exposed fibres are free of matrix material again indicating that there was fibre matrix decohesion as the material fatigued. The key difference between the two fibre lengths is the presence of the longer fibres in the LCF bridge across crack fronts which contribute to the increased fatigue life observed in Figure 5a.
For the tension–tension at 120 °C, the fatigue fracture surfaces are shown in Figure 8. The lower magnification image of the fracture surface for SCF material shown in Figure 8a shows the distinct fibre orientation state of short-fibre injection-moulded composites with a distinct skin-shell-core–shell-skin orientation structure. This structure is marked with dashed red lines on Figure 8a. The fracture surface is relatively smooth compared with the fracture surfaces of the LCF material under fully reversed loading shown in Figure 7c,d. The higher magnification image of a fracture surface of the SCF material given in Figure 8b shows the core region at the top of the image and the shell region at the bottom of the image. Similar to fully reversed loading the fracture seems to form from fibre matrix debonding based on how the fibres do not have residual matrix material on them. Figure 8b has similar ductility signs in the matrix final fracture as Figure 7c for the LCF material under fully reversed loading, where the matrix indicates stretching before the final failure, resulting in curled regions on the fracture surface in the core region of the specimen. There are pits in the shell region of the SCF material consistent with the other tensile fatigue tests where a group of fibres pull out together. The skin-shell-core orientation structure is also visible in the LCF material in Figure 8c. There is evidence of pitting in the shell region of the microstructure which has previously only been observed in the SCF material. The fibres in the core region show that fibre matrix debonding is once again the suspected primary failure mode. Signs of matrix ductile final failure are visible in the LCF material in Figure 8d, where there are curls in the failure. Figure 8d shows fibre failure along with fibre pull out as the failure mechanisms present in the LCF material under tension–tension fatigue loading.
For fatigue, fracture surfaces for the compression–compression fatigue loading at 120 °C are given in Figure 9. The effect of the fibre orientation is less apparent in the SCF material shown in Figure 9a. The bottom of the fracture surface is inclined at an angle indicative of a buckling final failure mode. Higher magnification images of the fracture surface shown in Figure 9b show that the fibres are debonded from the matrix material; this indicates that fatigue failure may also initiate at the fibre matrix interface during compression–compression loading. Due to the smooth nature of the fracture surfaces, it is likely that the failure is matrix-dominated and that cracks travel through the matrix material. The LCF material shows similar fracture behaviour to the SCF material shown in Figure 9c,d. The fracture surface in Figure 9c is very smooth and the bottom surface is at an inclined angle, indicating buckling or out of plane deformation in final failure. The smoothness of the surface indicates that a crack travelled transversely though the matrix material and resulted in fibre fracture. Some fibres oriented through the thickness are visible on the fracture surface which is unique to R = 10. In the image at higher magnification in Figure 9d, there are signs of fibre micro-bulking with some of the exposed fibres being kinked. The surface of the fibres is clean, which again shows that there was a breakdown of the fibre–matrix interface.

4. Discussion

Our findings on the monotonic loading properties of injection-moulded material in terms of stiffness are consistent with those of [9]. However, our findings on strength differ as the average fibre lengths in the FLDs studied by [9] were much more similar (230–280 μm) than the ones considered in this study (100–580 μm). Our trends match those of Yilazer and Cansever, where the tensile strength is proportional to the average fibre length in the FLD [10]. The trends observed also match those of Thomason in terms of strength and stiffness dependence on fibre length [11]. Overall, matching earlier observations confirms that the material is acting as expected with respect to FLD, and that the specimens work well for monotonic characterization.
Our fatigue results at room temperature show different trends to Meneghetti et al. with respect to FLD where 10 mm fibres lead to decreased fatigue life under fully reversed loading compared with 1 mm fibres, but the difference may be due to the fibre lengths considered [13]. The trends in our fatigue data match those of Karger-Kocsis and Friedrich where increased fibre length increases the fatigue life [12]. However, there experiments showed a larger change, which is likely due to the tension–tension fatigue loading considered [12]. In our study, only fully reversed loading at room temperature was considered.
Following general observations on material properties and fatigue, it is important to consider the fracture surfaces observed in this study compared with previous research. Bellenger et al. have shown a similar temperature-dependent fracture surface appearance to the ones shown in this study where above the glass transition temperature the final matrix tensile failure has a stretched and curved appearance [6]. De Monte et al. have shown similar fracture surface appearance during fatigue loading at 130 °C to those shown here where there is matrix plasticity and fibre pull out [24]. Esmaeillou et al. have shown that there appears to be a sheath of matrix material around the fibres under tension–tension fatigue loading at elevated temperatures [8]. In our study, these sheaths were not present under tension–tension loading, which may be influenced by the loading frequency used by Esmaeillou [8] being an order of magnitude higher than the frequency in the current study.
Belmonte et al. have predicted that the likely cause of fatigue failure in injection mouldings is stress concentrations surrounding the fibre [30]. This has been shown to be the case by Arif et al. who identified the damage initiation mechanism for injection-moulded glass fibre PA66 subjected to tension–tension fatigue as fibre matrix debonding [28]. This is consistent with our observed fracture surfaces where there appears to be no matrix material bonded with the fibres on fracture planes. The presented fracture surfaces for tension–tension fatigue show expected shell-core orientation differences where the fracture surfaces match the behaviour shown in [4].
Pitting behaviour of SCF material may be attributed to stress concentrations at fibre ends which are reduced in the LCF material. Karger-Kocsis and Friedrich have shown similar pitting behaviour for their short fibre length tension–tension fatigue [12]. Horst and Spoormaker [25] have suggested that multiple voids will form at different locations, leading to localized cracking and a rough fracture surface, which is the phenomenon observed here. Longer fibres likely lead to more fibre bridging which increases the fatigue life as observed in this study. Similar distribution of damage has been evaluated in Klimkeit et al. for tension–tension fatigue loading [27]. The fibre-length-dependent fracture surfaces presented by Meneghetti et al. do not exhibit the pitting failure, which is likely due to a combination of the longer fibres used in their study along with lower fibre volume content [13].
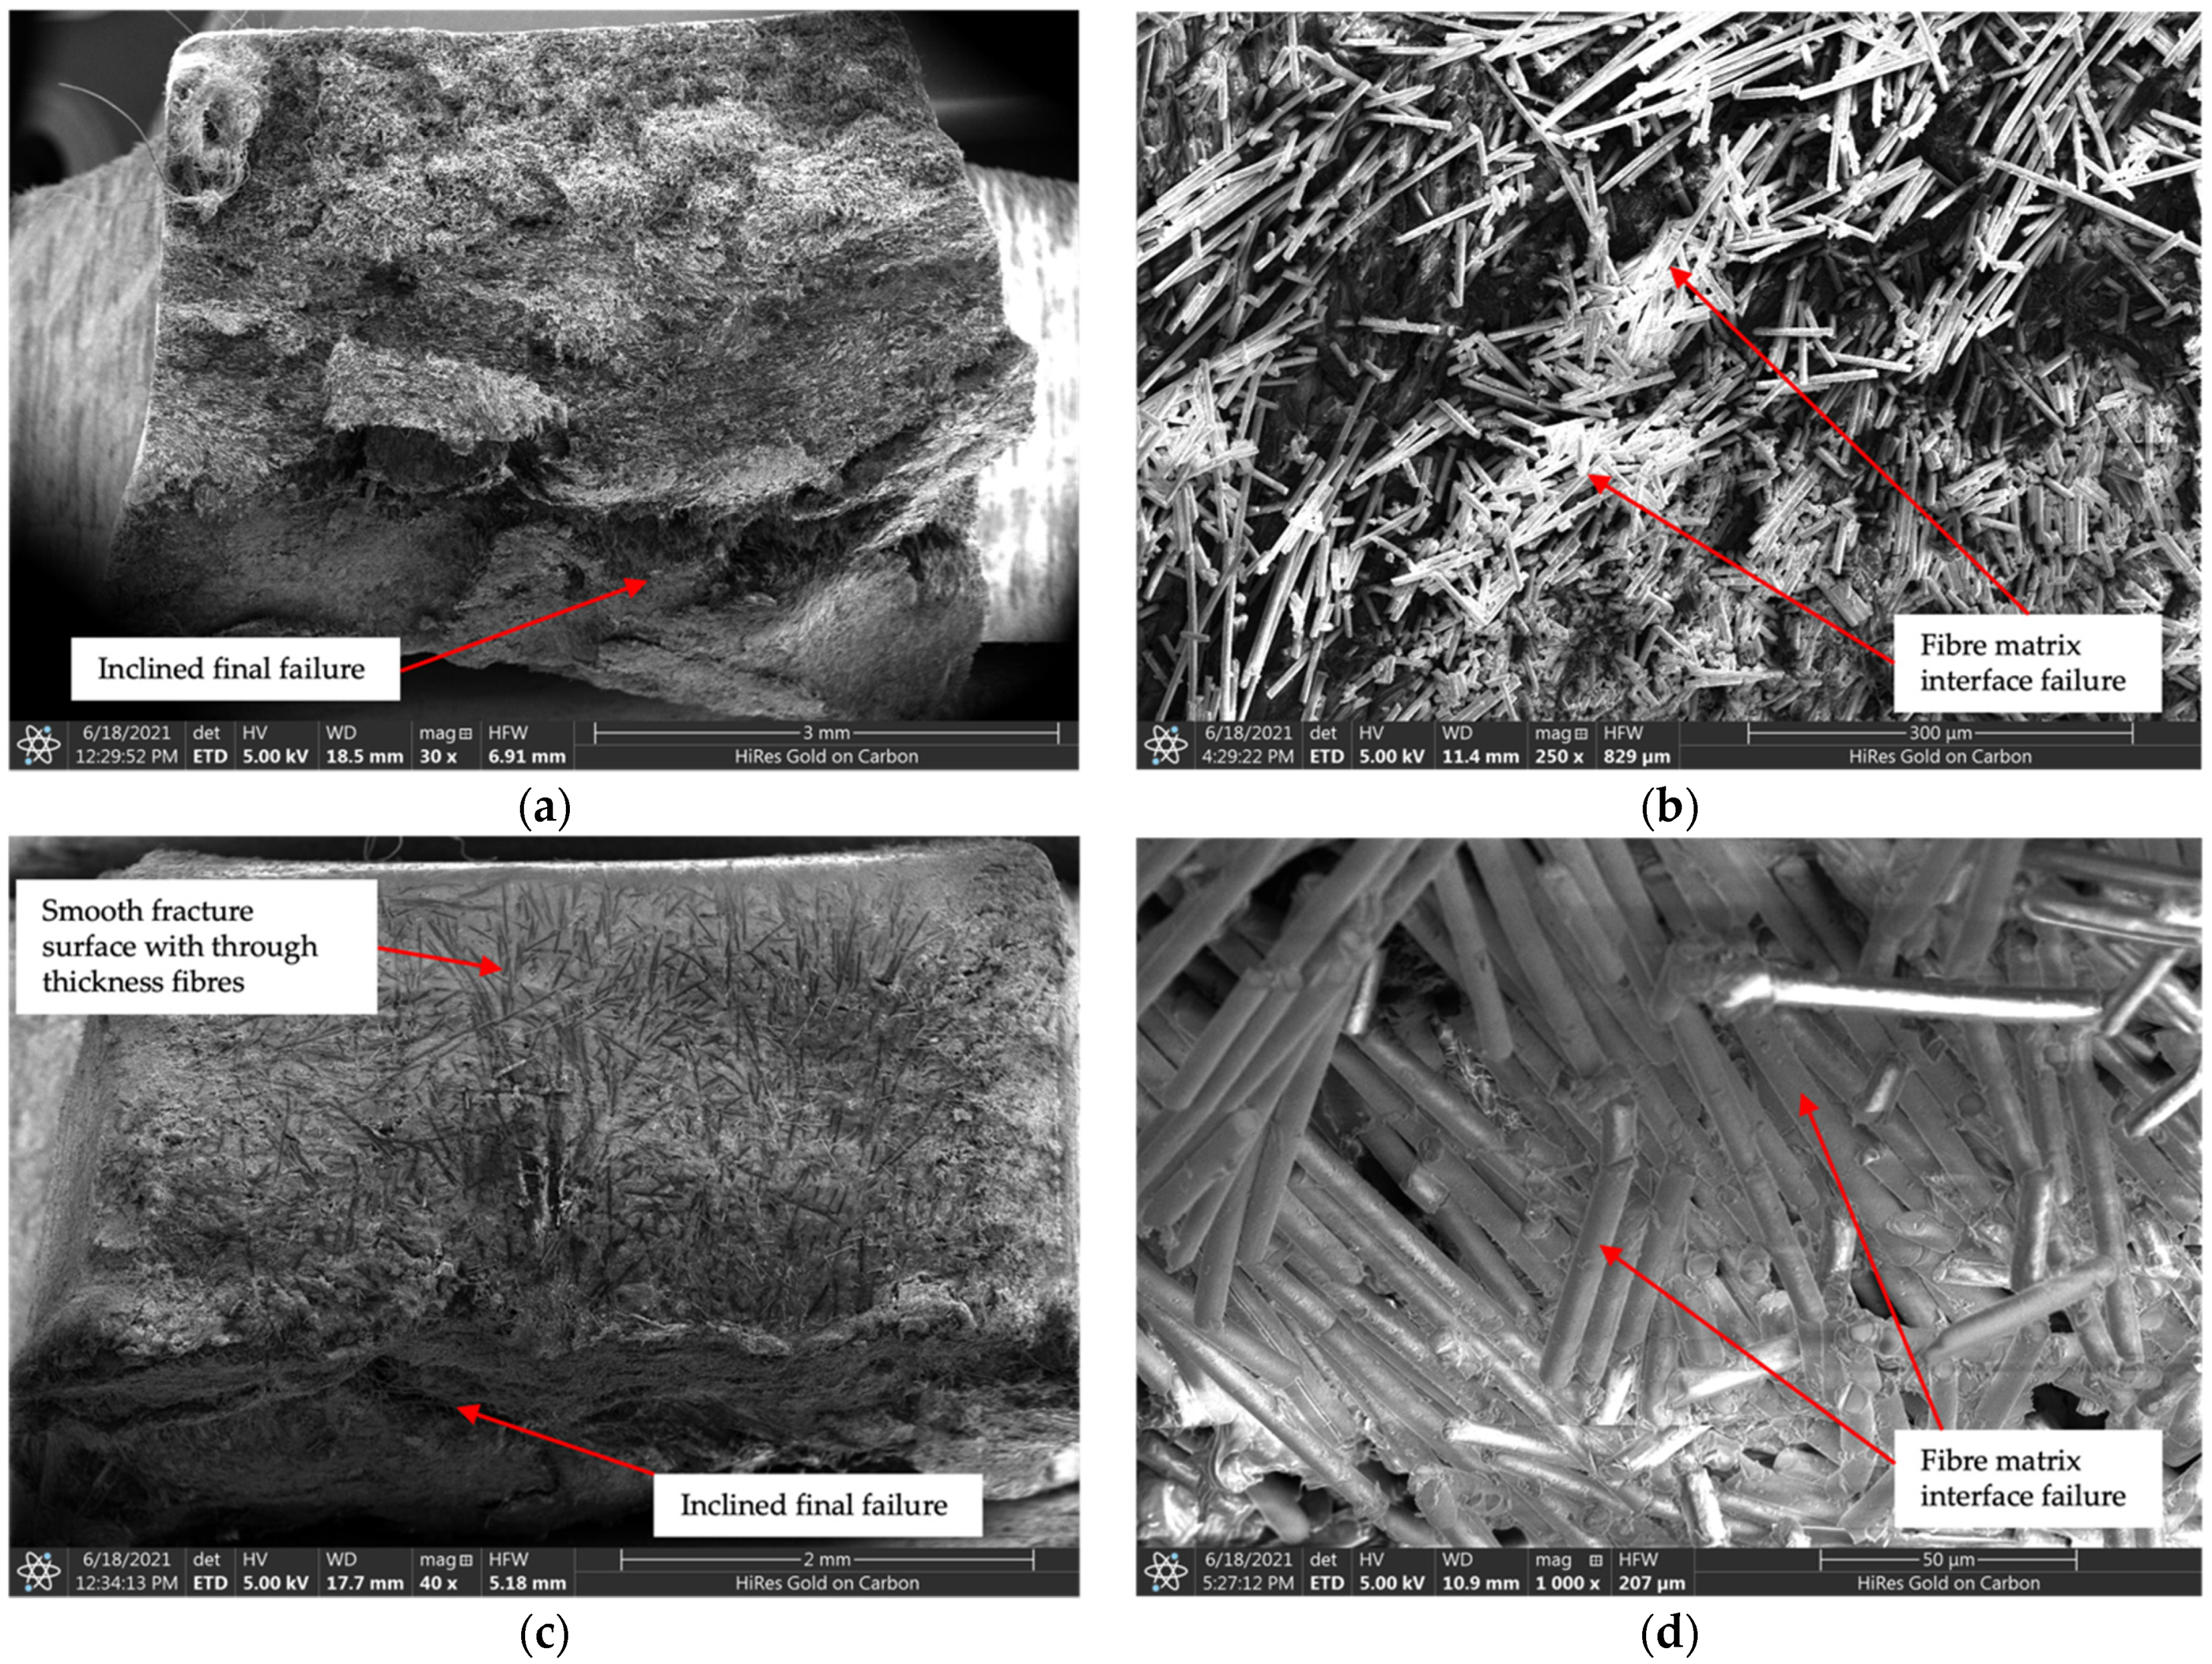
For the compression–compression fatigue, the failure mechanism is matrix-dominated. This results in very little difference in the fatigue life between the SCF and LCF material, as seen in Figure 5c. The low slope of the S-N curve shows that the fatigue failure is dominated by a maximum stress level, below which the samples reach the run-out point. The similar behaviour of the two FLD in compression–compression compared with the other load cases further support this theory.

5. Conclusions

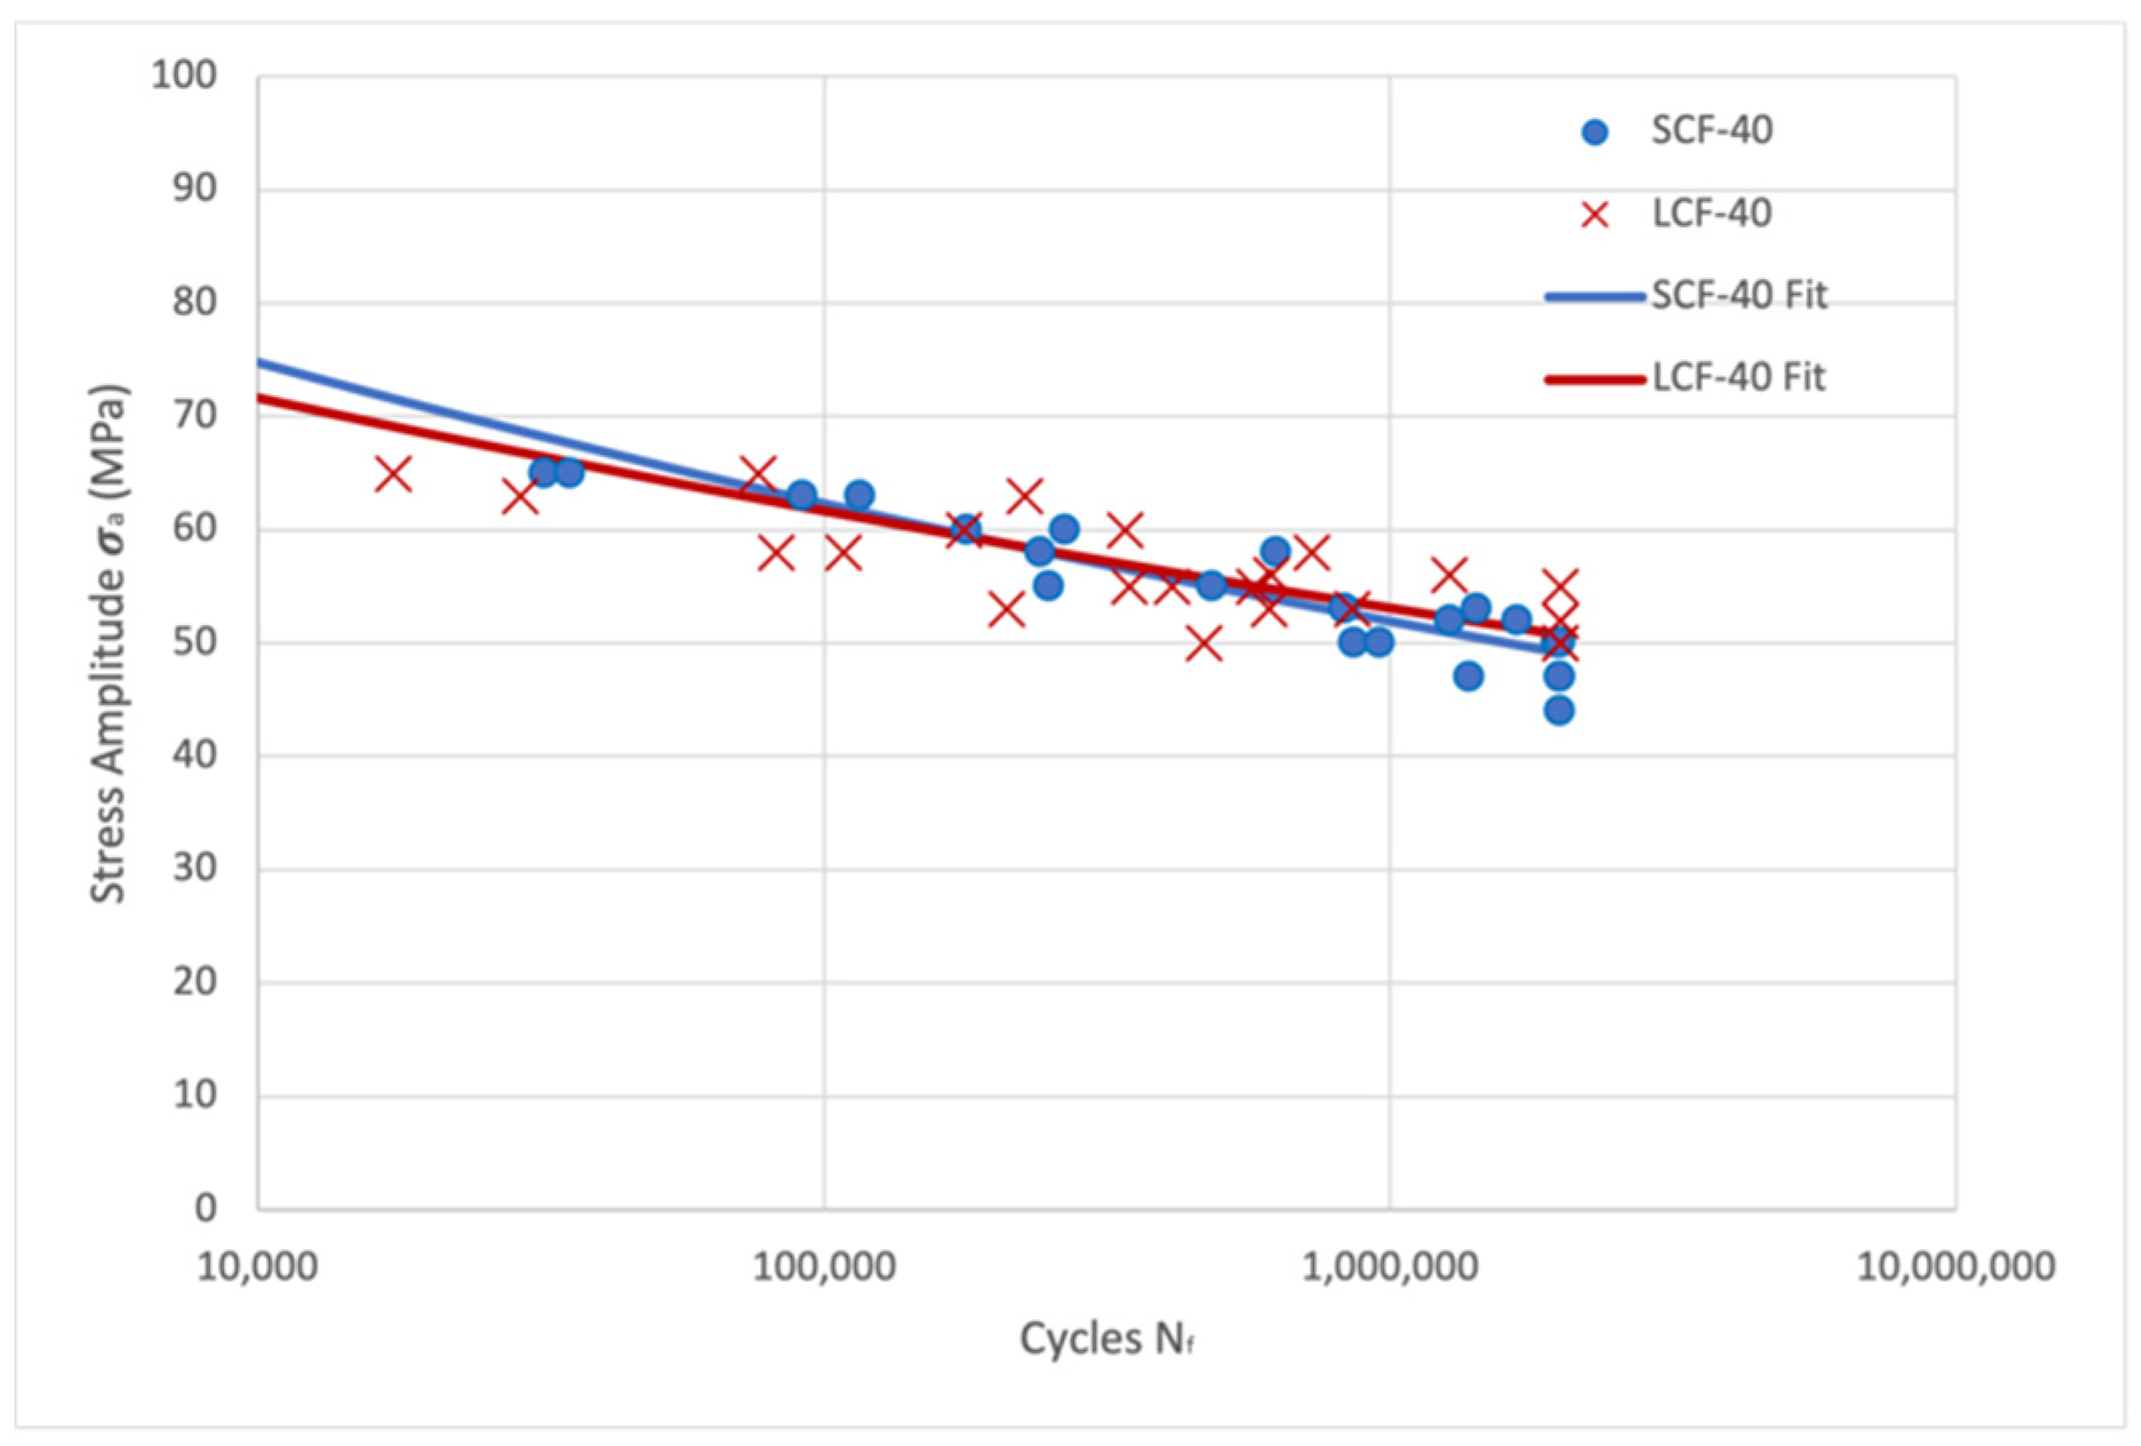
The results from 136 fatigue tests conducted on injection-moulded carbon-fibre-reinforced PA66 with two distinct FLD are presented. The SCF material has an average fibre length of 100 microns, and the LCF material has an average fibre length of 580 microns. When subjected to quasi-static tensile testing, there is a 22.4% reduction in the tensile stress from the LCF material to the SCF material. When subjected to compressive loading at 120 °C, the LCF material is 6.7% stronger than the SCF material. The FLD has minimal effect on the elastic modulus as reported in previous studies on the subject.
At room temperature, there is little separating the fatigue performance of the SCF and LCF material. However, at 120 °C there is a significant difference in the fatigue life between the two materials under tension–tension and fully reversed fatigue loading. Under fully reversed loading, the fatigue life of the SCF material is 10 times shorter than the LCF material. Under tension–tension fatigue the SCF material results in failure below 100,000 cycles for stress amplitudes which are run-out points in the LCF material. For compression–compression fatigue loading, the failure is matrix dominated and should be treated as a maximum compressive stress failure criterion.
The fatigue failures are dominated by fibre matrix decohesion leading to reduced strength, propagation of cracks and final failure. The tensile-loaded SCF material fracture surfaces exhibit pitting in regions where the fibres are aligned with the loading direction, indicative of cracks propagating across bundles of fibres. These failures are attributed to stress concentrations at fibre ends which are suppressed in the LCF material due to increased fibre length. The LCF material under fully reversed loading results in fragments or chips of material, which remain intact across the fracture surface indicating how the longer fibres contribute to increased fatigue life for a given loading. Under compression–compression fatigue it appears that failure still initiates along the fibre matrix interface; however, the fracture surface is very smooth indicating that the fibres likely fail due to out of plane bending along the crack surface and final failure due to buckling.

Author Contributions

Conceptualization, T.S., B.L., C.E.-P. and J.K.; methodology, T.S., B.L. and J.K.; software, C.E.-P.; validation, T.S.; formal analysis, T.S.; investigation, B.L., T.S. and W.M.; resources, J.K. and C.E.-P.; data curation, T.S.; writing—original draft preparation, T.S.; writing—review and editing, J.K., B.L. and C.E.-P.; visualization, T.S.; supervision, J.K.; project administration, J.K.; funding acquisition, J.K. and C.E.-P. All authors have read and agreed to the published version of the manuscript.

Funding

This research was funded by Ford Motor Company.

Acknowledgments

The authors acknowledge employees at CanmetMATERIALS laboratory in Hamilton Ontario for their aid in completion of the experimental work to support this study.

Conflicts of Interest

The authors declare no conflict of interest.

References

  1. Mouti, Z.; Westwood, K.; Long, D.; Njuguna, J. An experimental investigation into localized low-velocity impact loading on glass fibre-reinforced polyamide automotive product. Compos. Struct. 2013, 104, 43–53. [Google Scholar] [CrossRef]
  2. Sonsino, C.M.; Moosbrugger, E. Fatigue design of highly loaded short-glass-fibre reinforced polyamide parts in engine compartments. Int. J. Fatigue 2008, 30, 1279–1288. [Google Scholar] [CrossRef]
  3. Bernascinu, A.; Davoli, P.; Armanni, C. Fatigue strength of a clutch pedal mode of reprocessed short glass fibre reinforced polyamide. Int. J. Fatigue 2010, 32, 100–107. [Google Scholar] [CrossRef]
  4. Mortazavian, S.; Fatemi, A. Fatigue behavior and modeling of short fiber reinforced polymer composites: A literature review. Int. J. Fatigue 2015, 70, 297–321. [Google Scholar] [CrossRef]
  5. Handa, K.; Kato, A.; Narisawa, I. Fatigue characteristics of glass-fiber-reinforced polyamide. J. Appl. Polym. Sci. 1999, 72, 1783–1793. [Google Scholar] [CrossRef]
  6. Bellenger, V.; Tcharkhtchi, A.; Castaing, P. Thermal and mechanical fatigue of a PA66/glass fibers composite material. Int. J. Fatigue 2006, 28, 1348–1352. [Google Scholar] [CrossRef]
  7. Casado, J.A.; Carrascal, I.; Polanco, J.A.; Gutierrez-Solana, F. Fatigue failure of short glass fiber reinforced PA 6.6 structural pieces for railway track fasteners. Eng. Fail. Anal. 2006, 13, 182–197. [Google Scholar] [CrossRef]
  8. Esmaeillou, B.; Ferreira, P.; Bellenger, V.; Tcharkhtchi, A. Fatigue behavior of polyamide66/glass fiber under various kinds of applied load. Polym. Compos. 2012, 33, 540–547. [Google Scholar] [CrossRef]
  9. Karsli, N.G.; Aytac, A.; Deniz, V. Effects of initial fiber length and fiber length distribution on the properties of carbon-fiber-reinforced-polypropylene composites. J. Reinf. Plast. Compos. 2012, 31, 1053–1060. [Google Scholar] [CrossRef]
  10. Yilmazer, U.; Cansever, M. Effects of processing conditions on the fiber length distributions and mechanical properties of glass fiber reinforced nylon-6. Polym. Compos. 2002, 23, 61–71. [Google Scholar] [CrossRef]
  11. Thomason, J.L. The influence of fibre length and concentration on the properties of glass fibre reinforced polypropylene: 5. Injection moulded long and short fibre PP. Compos. Part A 2002, 33, 1641–1652. [Google Scholar] [CrossRef]
  12. Karger-Kocsis, J.; Friedrich, K. Fatigue crack propagation in short and long fibre-reinforced injection moulded PA 6.6 composites. Composites 1988, 19, 105–114. [Google Scholar] [CrossRef]
  13. Meneghetti, G.; Ricotta, M.; Lucchetta, G.; Carmignato, S. An hysteresis energy-based synthesis of fully reversed axial fatigue behaviour of different polypropylene composites. Compos. Part B 2014, 65, 17–25. [Google Scholar] [CrossRef]
  14. Subramanian, C.; Senthilvelan, S. Effect of fiber length on hysteretic heating of discontinuous fiber-reinforced polypropylene. Int. J. Polym. Mater. 2009, 58, 347–354. [Google Scholar] [CrossRef]
  15. Sasayama, T.; Okabe, T.; Aoyagi, Y.; Nishikawa, M. Prediction of failure properties of injection-molded short glass fiber-reinforced polyamide 6,6. Compos. Part A 2013, 52, 45–54. [Google Scholar] [CrossRef]
  16. Kim, E.G.; Park, J.K.; Jo, S.H. A study on fiber orientation during the injection molding of fiber-reinforced polymeric composites (Comparison between image processing results and numerical simulations). J. Mater. Processing Technol. 2001, 111, 225–232. [Google Scholar] [CrossRef]
  17. Launay, A.; Maitournam, M.H.; Marco, Y.; Raoult, I. Multiaxial fatigue models for short glass fiber reinforced polyamide—Part I: Nonlinear anisotropic constitutive behavior for cyclic response. Int. J. Fatigue 2013, 47, 382–389. [Google Scholar] [CrossRef] [Green Version]
  18. Launay, A.; Maitournam, M.H.; Marco, Y.; Raoult, I. Multiaxial fatigue models for short glass fiber reinforced polyamide—Part II: Fatigue life estimation. Int. J. Fatigue 2013, 47, 390–406. [Google Scholar] [CrossRef] [Green Version]
  19. De Monte, M.; Moosbrugger, E.; Quaresimin, M. Influence of temperature and thickness on the off-axis behaviour of short glass fibre reinforced polyamide 6.6—cyclic loading. Compos. Part A 2010, 41, 1368–1379. [Google Scholar] [CrossRef]
  20. Jain, A.; Van Paepegem, W.; Verpoest, I.; Lomov, S.V. A statistical treatment of the loss of stiffness during cyclic loading for short fiber reinforced injection molded composites. Compos. Part B 2016, 103, 40–50. [Google Scholar] [CrossRef] [Green Version]
  21. Sabiston, T.; Li, B.; Kang, J.; Wilkinson, D.; Engler-Pinto, C. Accounting for the microstructure in the prediction of the fatigue life of injection moulded composites for automotive applications. Compos. Struct. 2021, 255, 112898. [Google Scholar] [CrossRef]
  22. Capela, C.; Oliveira, S.E.; Ferreira, J.A.M. Fatigue behavior of short carbon fiber reinforced epoxy composites. Compos. Part B 2019, 164, 191–197. [Google Scholar] [CrossRef]
  23. Mallick, P.K.; Zhou, Y. Effect of mean stress on the stress-controlled fatigue of a short E-glass fiber reinforced polyamide-6,6. Int. J. Fatigue 2004, 26, 941–946. [Google Scholar] [CrossRef]
  24. De Monte, M.; Moosbrugger, E.; Jaschek, K.; Quaresimin, M. Multiaxial fatigue of a short glass fibre reinforced polyamide 6.6—Fatigue and fracture behaviour. Int. J. Fatigue 2010, 32, 17–28. [Google Scholar] [CrossRef]
  25. Horst, J.J.; Spoormaker, J.L. Fatigue fracture mechanisms and fractography of short-glassfibre-reinforced polyamide 6. J. Mater. Sci. 1997, 32, 3641–3651. [Google Scholar] [CrossRef]
  26. Noda, K.; Takahara, A.; Kajiyama, T. Fatigue failure mechanisms of short glass-fiber reinforced nylon 66 based on nonlinear dynamic viscoelastic measurement. Polymer 2001, 42, 5803–5811. [Google Scholar] [CrossRef]
  27. Klimkeit, B.; Castagnet, S.; Nadot, Y.; El Habib, A.; Benoit, G.; Bergamo, S.; Dumas, C.; Achard, S. Fatigue damage mechanisms in short fiber reinforced PBT+PET GF30. Mater. Sci. Eng. A 2011, 528, 1577–1588. [Google Scholar] [CrossRef]
  28. Arif, M.F.; Saintier, N.; Meraghni, F.; Fitoussi, J.; Chemisky, Y.; Robert, G. Multiscale fatigue damage characterization in short glass fiber reinforced polyamide-66. Compos. Part B 2014, 61, 55–65. [Google Scholar] [CrossRef] [Green Version]
  29. Cosmi, F.; Bernasconi, A. Micro-CT investigation on fatigue damage evolution in short fibre reinforced polymers. Compos. Sci. Technol. 2013, 79, 70–76. [Google Scholar] [CrossRef]
  30. Belmonte, E.; De Monte, M.; Riedel, T.; Quaresimin, M. Local microstructure and stress distributions at the crack initiation site in a short fiber reinforced polyamide under fatigue loading. Polym. Test. 2016, 54, 250–259. [Google Scholar] [CrossRef]
  31. Kang, J.; Li, B.; Liang, J.; Engler-Pinto, C. Fatigue testing and fatigue life prediction of injection molded carbon-fibre reinforced plastics for automotive oil-pan application. In Proceedings of the ECCM 18—18th European Conference on Composite Materials, Athens, Greece, 24–28 June 2018. [Google Scholar]
  32. Sabiston, T.; Li, B.; Kang, J.; Liang, J.; Engler-Pinto, C. Fatigue behaviour of carbon/epoxy Non-Crimp Fabric composites for automotive applications. Procedia Struct. Integr. 2019, 17, 666–673. [Google Scholar] [CrossRef]
  33. Sabiston, T.; Li, B.; Kang, J.; Liang, J.; Wilkinson, D.; Engler-Pinto, C. Effect of stress ratio on fatigue behaviour of Non-Crimp Fabric composites at room and elevated temperatures. Appl. Compos. Mater. 2020, 27, 575–596. [Google Scholar] [CrossRef]
  34. Engler-Pinto, C.; Lasecki, J.; Frisch, R.; Allison, J. Statistical approaches applied to very high cycle fatigue. In Proceedings of the Fourth International Conference on very High Cycle Fatigue (VHCF-4), Ann-Arbor, MI, USA, 19–22 August 2007; Volume 2007, pp. 369–376. [Google Scholar]
  35. BASF. Ultramid (PA) Product Brochure. BASF SE Ludwigshafen; BASF: Florham Park, NJ, USA, 2013. [Google Scholar]
Figure 1. Fatigue test sample geometry.
Jcs 06 00038 g001
Figure 2. Fatigue test setup for: (a) room temperature testing; (b) elevated temperature in an environmental chamber.
Jcs 06 00038 g002
Figure 3. (a) Example micrograph of SCF material used for automated fibre length measurement (b) fibre length distributions for SCF and LCF material (solid (proportion), dashed (cumulative)).
Jcs 06 00038 g003
Figure 4. Fatigue tests results at room temperature with R = −1 for the SCF and LCF materials.
Jcs 06 00038 g004
Figure 5. Fatigue test results at 120 °C for SCF and LCF materials for, (a) R = −1, (b) R = 0.1, (c) R = 10.
Jcs 06 00038 g005
Figure 6. Fatigue fracture surfaces at room temperature under fully reversed loading (a) SCF N f = 1,968,298; (b) SCF N f = 32,125; (c) LCF N f = 17,338; (d) LCF N f = 411,401.
Jcs 06 00038 g006
Figure 7. Fatigue fracture surfaces at 120 °C under fully reversed loading (a) SCF N f = 2891; (b) SCF N f = 390,023; (c) LCF N f = 13,791; (d) LCF N f = 1,334,906.
Jcs 06 00038 g007
Figure 8. Fatigue fracture surfaces at 120 °C under tension–tension fatigue loading R = 0.1 (a) SCF N f = 277,212, red dashed lines separate skin-shell-core–shell-skin fibre orientation (b) SCF N f = 16,138; (c) LCF N f = 23,021; (d) LCF N f = 1,154,468.
Jcs 06 00038 g008
Figure 9. Fatigue fracture surfaces at 120 °C under compression–compression fatigue loading R = 10 (a) SCF N f = 277,212; (b) SCF N f = 16,138; (c) LCF N f = 23,021; (d) LCF N f = 1,154,468.
Jcs 06 00038 g009
Table 1. Monotonic tensile test results at room temperature for the injection-moulded materials with standard deviation reported as plus minus.
PropertySCF-40LCF-40
Elastic Modulus (GPa) 24.67   ±   1.10 22.03   ±   1.34
Tensile Strength (Mpa) 196   ±   9.57 239   ±   10.06
Table 2. Monotonic tensile test results at 120 °C for the injection-moulded materials with standard deviation reported as plus minus.
PropertySCF-40LCF-40
Elastic Modulus (GPa) 12.43   ±   0.58 13.0   ±   0.30
Tensile Strength (MPa) 83   ±   7.23 102   ±   2.65
Compressive Strength (MPa) 89   ±   5.51 95   ±   2.08
Table 3. Fatigue test Basquin equation fit parameters for room temperature.
ParameterSCF-40LCF-40
Fatigue   Strength   coefficient   σ f (MPa)163.4136.4
Fatigue   Strength   Exponent   b −0.079−0.065
Number of Tests2423
Table 4. Fatigue test Basquin equation fit parameters for 120 °C tests.
ParameterRSCF-40LCF-40
Fatigue   Strength   Coefficient   σ f (MPa)−191.8107.2
0.146.742
1042.249.8
Fatigue   Strength   Exponent   b −1−0.078−0.075
0.1−0.047−0.024
10−0.019−0.028
Number of Tests−11427
0.11212
101212
Publisher’s Note: MDPI stays neutral with regard to jurisdictional claims in published maps and institutional affiliations.

