Article

Investigating the Effects of Ironing Parameters on the Dimensional Accuracy, Surface Roughness, and Hardness of FFF-Printed Thermoplastics

School of Engineering and Built Environment, Faculty of Science and Engineering, Anglia Ruskin University, Chelmsford CM1 1SQ, UK
*
Author to whom correspondence should be addressed.
J. Compos. Sci. 2022, 6(5), 121; https://0-doi-org.brum.beds.ac.uk/10.3390/jcs6050121
Submission received: 27 March 2022 / Revised: 13 April 2022 / Accepted: 20 April 2022 / Published: 22 April 2022
(This article belongs to the Special Issue Feature Papers in Journal of Composites Science in 2022)

Abstract

:
Ironing is a useful feature for parts made by fused filament fabrication (FFF), as it can smooth out surfaces using heat and extruding a small amount of material. Like any other processing parameter for FFF, ironing also requires optimisation to ensure a smooth surface can be achieved with limited adverse effects on the other features of the printed part. Even with such a beneficial use case, ironing is still considered experimental and, therefore, this study aims to investigate its effects on dimensional accuracy, surface roughness, and the hardness of two commonly used amorphous thermoplastics, i.e., ABS (acrylonitrile butadiene styrene) and ASA (acrylonitrile styrene acrylate). An extensive comparative analysis has been provided where parts have been manufactured using a low-cost, desktop-based 3D printer, with the two materials at three different ironing line spacings (0.1 mm, 0.2 mm, 0.3 mm), three different ironing flows (10%, 20%, 30%), and three different ironing speeds (50 mm/s, 100 mm/s, 150 mm/s). The study focuses on evaluating the effects of these different ironing parameters and determining the optimal combination for bespoke product requirements. The results showed that ASA was more adversely affected by the changes in ironing parameters compared to ABS. However, the different ironing parameters were proven to improve the smoothness as well as hardness of the parts, compared to the un-ironed samples of ABS and ASA. This work provides a good comparison between two popular amorphous materials and offers ways to leverage ironing parameters to achieve dimensional accuracy, optimal surface finish, and better hardness values.

Graphical Abstract

1. Introduction

Thermoplastics are widely used for a variety of different applications ranging from prototype development to functional products [1]. One of the most popular users of thermoplastics is an additive manufacturing process (AM) called fused filament fabrication (FFF) that is based on the principle of material extrusion [2]. Fused deposition modelling (FDM) is also based on the same principle but is a trademark of Stratasys. Different types of thermoplastics (in filament form) used by FFF are softened through heating and fed through an extruder to deposit layers for product development [3,4]. PLA (polylactic acid) and ABS (acrylonitrile butadiene styrene) are two of the most used thermoplastics for FFF [5]. To leverage the benefits of the FFF process (e.g., ease of operation, wide variety of materials), significant research is being undertaken to develop materials with better performance. In this context, ASA (acrylonitrile styrene acrylate) is becoming a popular choice due to its benefits over ABS, such as better mechanical properties, superior aesthetics, and enhanced UV resistance. Both ABS and ASA are amorphous materials, meaning they are easy to thermoform, possess better dimensional stability (compared to semi-crystalline thermoplastics such as PLA), and are less likely to warp during the FFF process. Even with the recent advancements in the development of new materials, the optimisation of process parameters remains a rigorous investigative avenue to achieve optimal results from FFF-printed parts. This becomes more complicated considering the layer-by-layer build-up of products that can lead to dimensional inaccuracies, poor surface finish, and issues with mechanical properties [6,7,8]. Different processing parameters require optimisation to achieve desirable results for FFF parts, ranging from layer height to line width, and extruder/bed temperature to infill pattern/percentage [9,10].
Nuñez et al. [11], analysed the dimensional accuracy, flatness, and surface texture of FDM-printed ABS parts. They found that the layer thickness and infill density influence the surface finish and the dimensional accuracy of the parts. The results showed that low layer thicknesses and high infill densities were favourable for a better surface finish. However, improved dimensional accuracy was found to be a result of high layer thicknesses and infill densities. Similarly, Vyavahare et al. [12] investigated the effect of five process parameters, namely, layer thickness, wall print speed, build orientation, wall thickness, and extrusion temperature on the surface roughness, dimensional accuracy, and fabrication time of FDM parts. They found layer thickness and build orientation to be significant process parameters for the surface roughness of the parts. Layer thickness, wall print speed, and build orientation are significant process parameters for dimensional accuracy. Layer thickness and build orientation are significant process parameters for fabrication time. They developed statistical non-linear quadratic models for prediction and optimised the process parameters using the desirability function. Pramanik et al. [13] studied the impact of processing parameters on the surface roughness of ABS, and found that print speed as well as extruder temperature were the most dominant factors, followed by infill density and layer height. They made use of the statistical design of the experiment and the optimisation techniques for the determination of the optimum process parameters. In addition to optimising process parameters, post processes are also useful in achieving desired results in products. In this context, Khan and Mishra [14] made use of the acetone vapor smoothing post process to improve the surface finish of ABS parts, and concluded that air–gap, temperature, time, and number of cycles all played a significant role in achieving the desired results. They made use of ANOVA (analysis of variance) and developed regression equations to calculate the optimal parameter settings. Similarly, Chohan et al. [15] developed a mathematical model for the average surface roughness of vapour-treated FDM parts using Taguchi and ANOVA analysis. They validated their findings using Buckingham’s Pi dimensional analysis approach for the relationship between six input parameters and four vapor smoothing parameters.
Similarly to ABS, there has also been a substantial focus on the optimisation of processing parameters for ASA. Camposeco-Negrete [16] analysed five process parameters (layer thickness, filling pattern, orientation angle, printing plane, and positioning on the build platform) for ASA to optimise five responses (energy consumption of the 3D printer, processing time, dimensional accuracy, quantity of material, and mechanical strength). Using the Taguchi method, ANOVA, and desirability analysis, the researchers simultaneously optimised all the variables, resulting in the improved sustainability of the process without a significant reduction in productivity or part quality. Kumar et al. [17] studied the influence of infill percentage and build direction on the tensile strength and flexural strength of the ASA parts. The results showed that the tensile strength of the ASA parts made by FDM was higher compared to the injection-moulded parts when compared with results in the literature. However, lower flexural strength was also observed upon comparison. Barreno-Avila et al. [18] investigated the impact of layer height and printing speed on the surface roughness of PLA, PET-G, ASA, Wood Filament, and TPU. They made use of ANOVA and found that layer height showed a significant correlation (<0.05) with the surface roughness of the lateral plane of the tested samples. El Magri et al. [19] analysed the effects of nozzle temperature, printing speed, and layer thickness on the tensile properties of ASA in the Z direction. They used ANOVA and response surface methodology to identify and establish the optimum input parameters for an enhanced tensile performance of ASA in the Z direction. Martínez et al. [20] investigated the effects of layer thickness and printing temperatures on the mechanical and tribological response of ASA parts. They found that ASA parts with higher layer thickness resulted in lower resistance to tribological wear effects with lower tensile strength. They achieved a reduction of 65% in the coefficient of friction through the variation of the layer thickness of the ASA parts. This discussion highlights the significance of optimising the process parameters of FFF-printed parts.
One of the main criticisms for FFF is the uneven and rough top surface of its printed parts [9,21]. As the nozzle draws the perimeters and solid infill, small gaps and ridges remain visible between the toolpath lines. Different software packages (e.g., Ultimaker Cura, PrusaSlicer) used to run FFF systems have a feature known as ironing to smooth the top surfaces by running a special second infill phase in the same layer. As the hot nozzle travels over the top layer, it flattens any plastic that might have curled up. The nozzle also extrudes a small amount of material to fill in any holes in the top surface. This creates a smooth finish at the top layer; however, it has some disadvantages including higher printing time, suitability only for flat surfaces, and the optimisation of process parameters (e.g., ironing line spacing, flow, speed). Furthermore, the usage of this feature has not been researched extensively and lacks information on the optimisation of its features. Therefore, this work aims to investigate the effects of three different ironing line spacings, ironing flows, and ironing speeds on two materials (ABS and ASA) manufactured using a low-cost, desktop-based 3D printer. The next section (Section 2) details the materials and methods used in this study. An extensive comparative analysis is presented in Section 3 to discuss the influence of ironing on the dimensional accuracy, surface texture, and hardness of the two materials. Material quality characterization is discussed in Section 4, and the conclusions are outlined in Section 5.

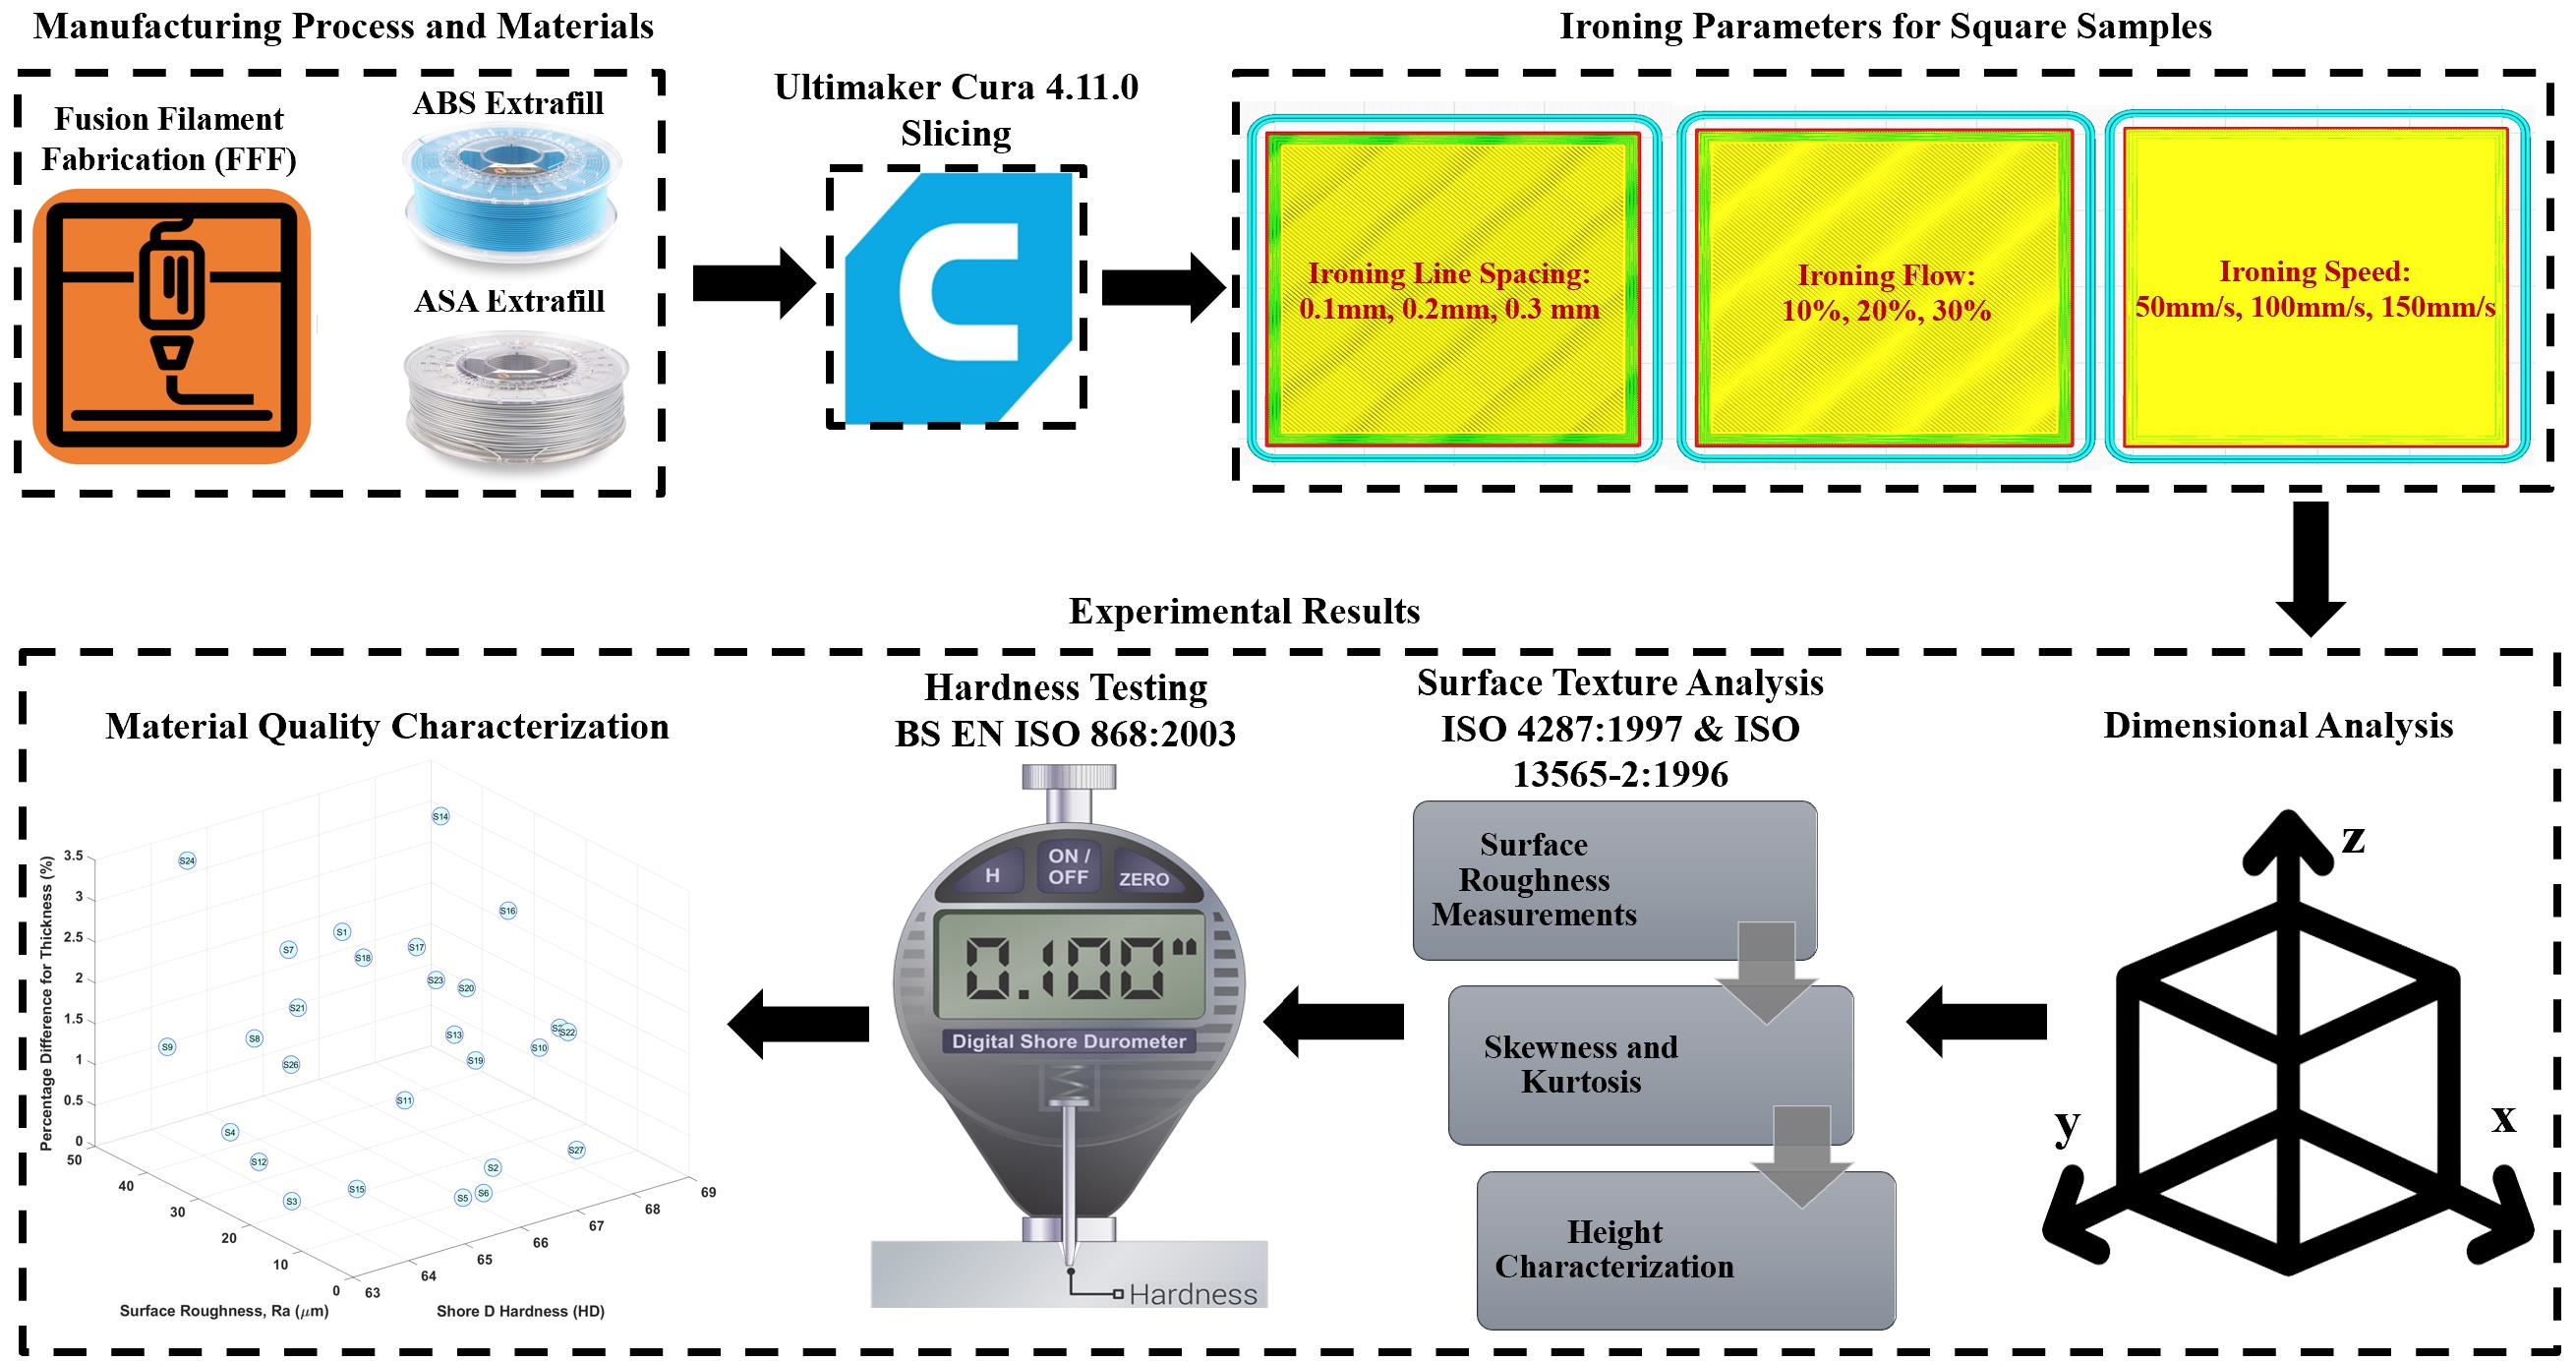
2. Materials and Methods

ABS Extrafill [22] and ASA Extrafill [23] were purchased from 3D FilaPrint, UK. From here onwards, these materials will be referred to as ABS and ASA, respectively. Anet® ET4 Pro desktop 3D printer was used to manufacture simple square samples of 40 mm × 40 mm × 15 mm [24] to analyse the effects of different ironing parameters. This printer did not have a heated enclosure/chamber and, therefore, all the samples were printed at room temperature. Ultimaker Cura 4.11.0 [25] was used to generate G-code files and to control all the process parameters. Three different ironing parameters were used, i.e., ironing line spacing, ironing flow, and ironing speed. The chosen ironing pattern was zigzag, and a total of 27 samples were printed for each material. Furthermore, samples without the use of ironing were also manufactured for both ABS and ASA to provide a comparison with the ironed samples. The processing parameters of the square blocks are shown in Table 1, and Table 2 shows the combinations of different ironing parameters used in this study.
The dimensions of the square samples were measured using a digital Vernier calliper. The surface texture analysis was undertaken using a Surftest SJ-210 (Mitutoyo, UK) contact-type surface profilometer with a detector measuring force of 0.75 mN and a range of 360 µm [26] at room temperature in a controlled laboratory environment, as per ISO 291:2008 [27]. The traverse direction was diagonal to the building direction at an angle of 45°, as per ISO 4287:1997 [28]. Several surface parameters of the samples were quantitatively measured at a micro-meter level. These amplitude parameters include average surface roughness (Ra), root mean square (Rq), skewness (Rsk), and kurtosis (Rku). Other parameters such as height characterization (core roughness depth, Rk; reduced peak height, Rpk; reduced valley depth, Rvk; material portion 1, Mr1; and material portion 2, Mr2) using the linear material ratio curve ISO 13565-2:1996 standard [29] were also quantitatively measured. The parameters were selected based on the literature [30,31,32,33,34]. Three measurements were taken at three different locations on the square samples at 0.5 mm/s. After surface analysis, the square samples were subjected to indentation hardness, as per BS EN ISO 868:2003 [35], using a Shore D durometer without any surface treatment. The indentation was measured at five different points to obtain an average hardness value for all the samples at room temperature in a controlled laboratory environment, as per ISO 291:2008 [27].

3. Experimental Results and Discussions

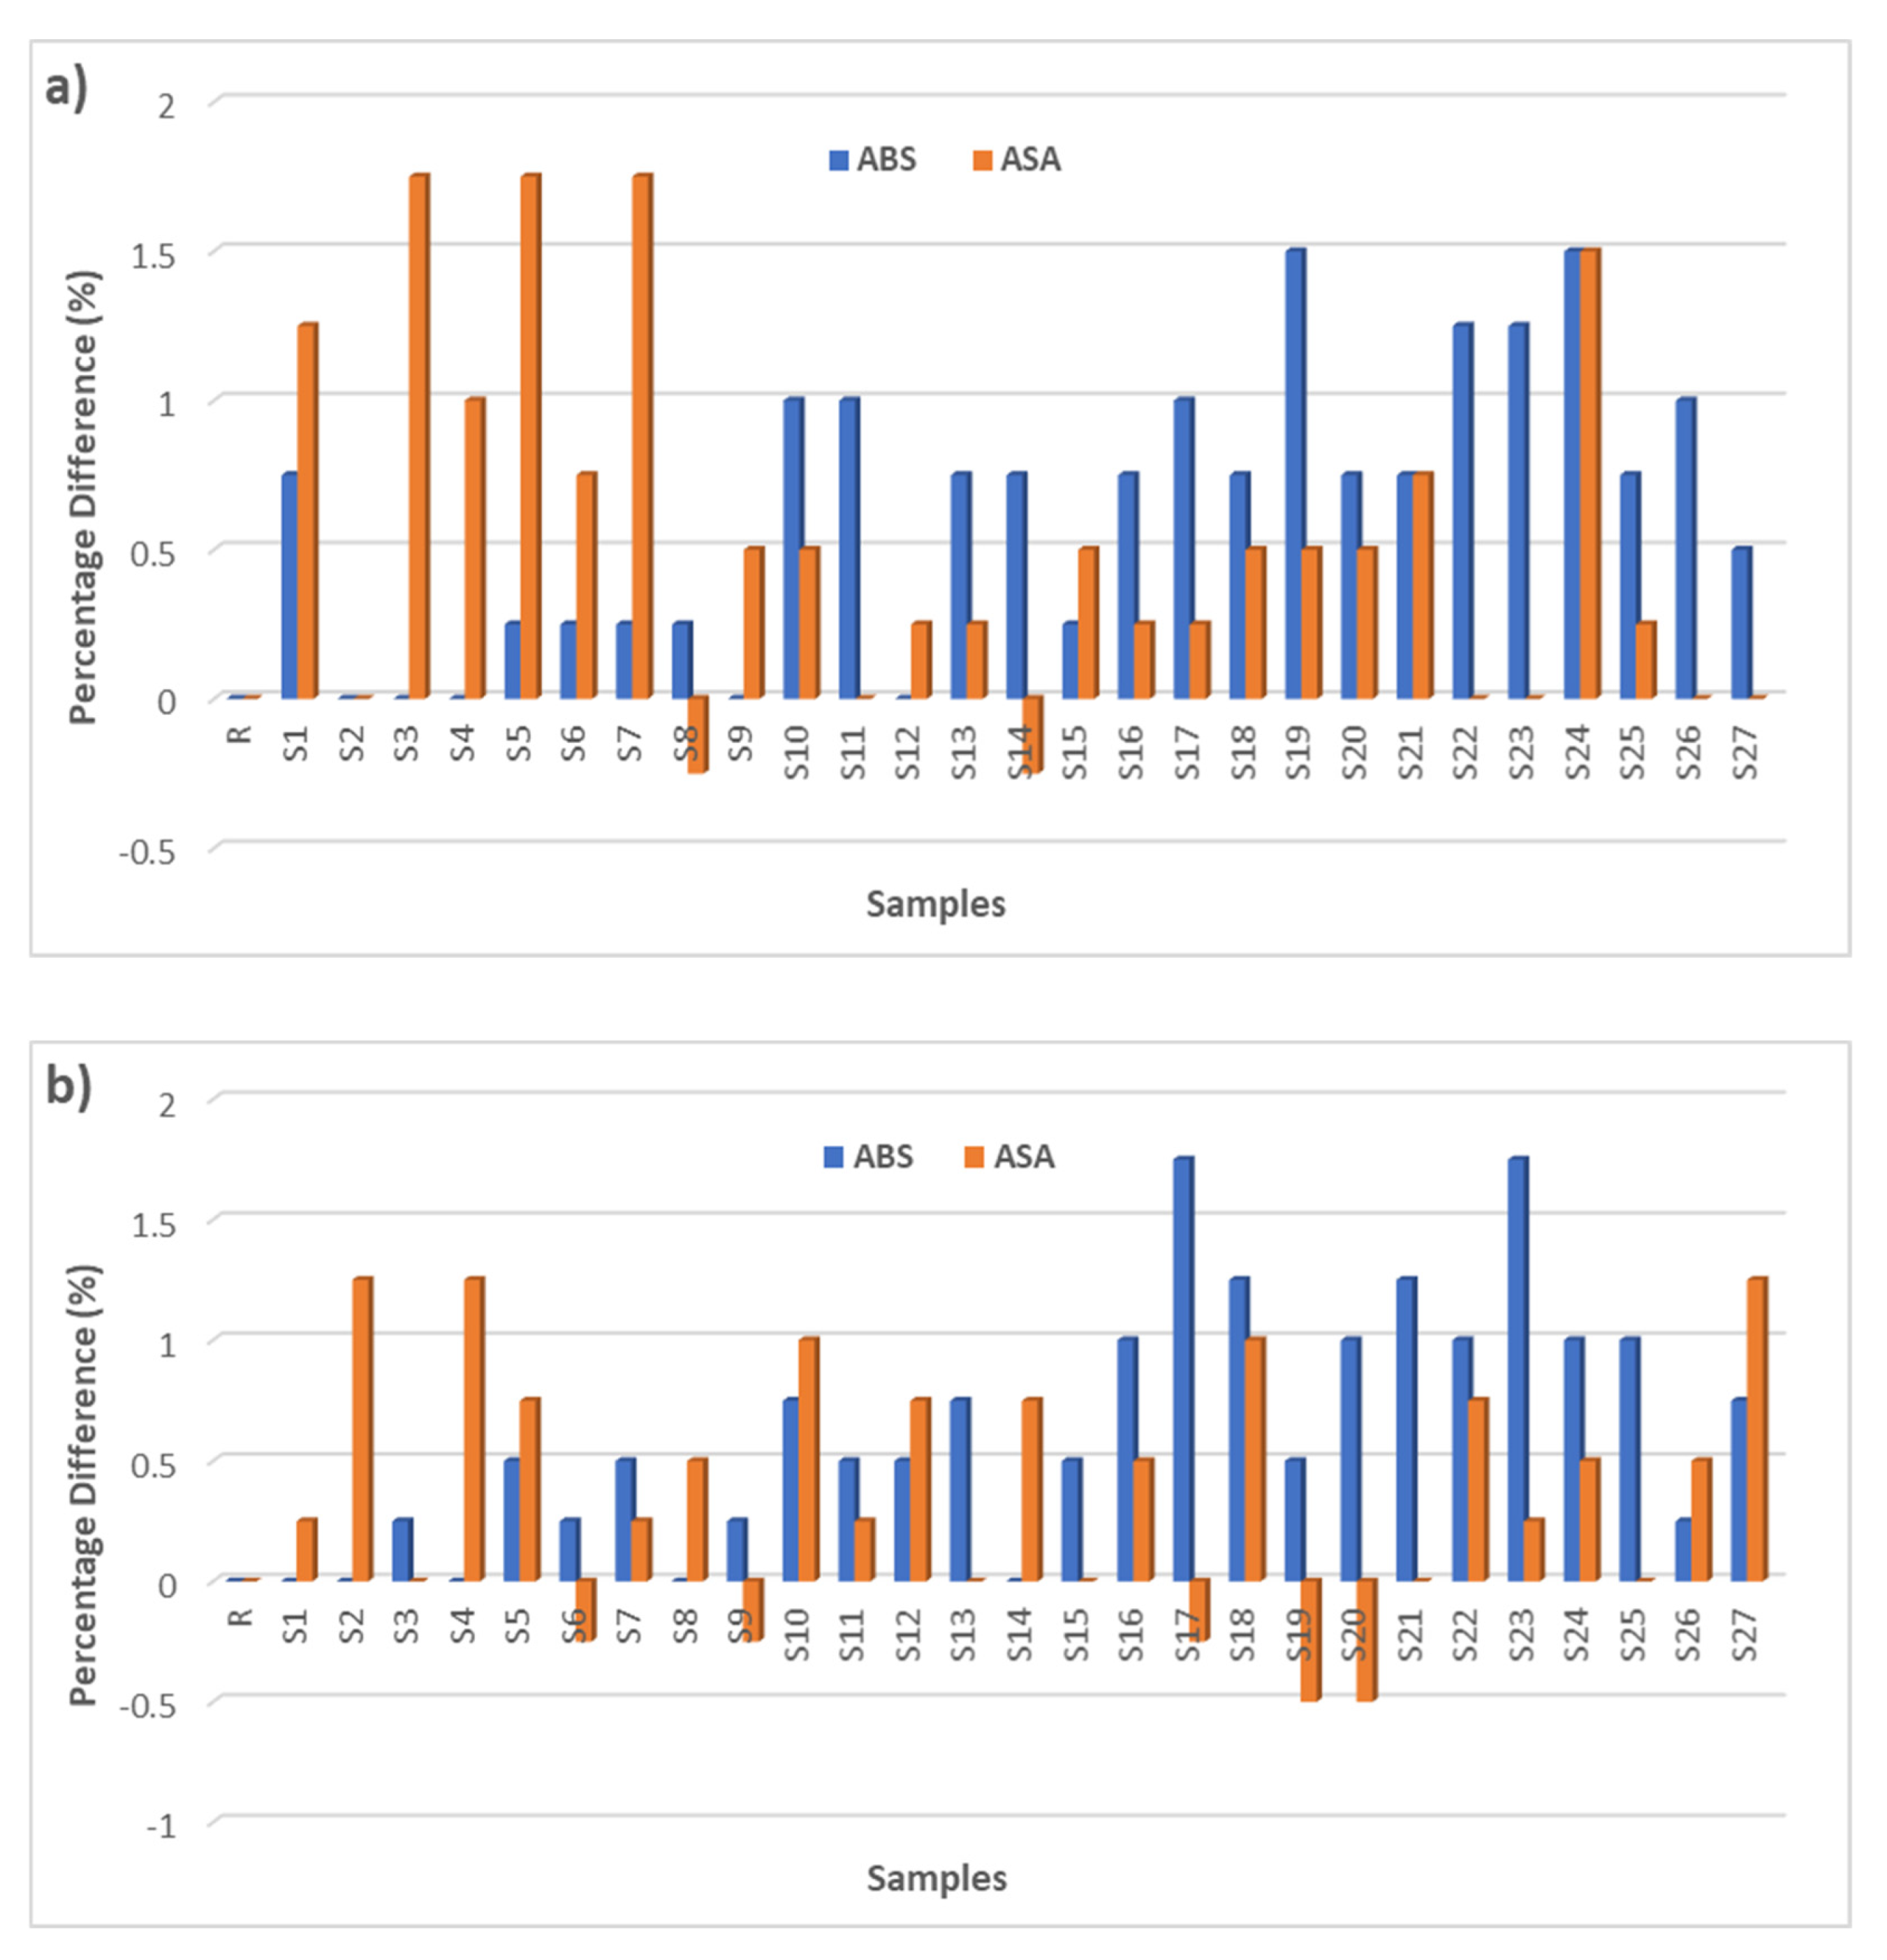
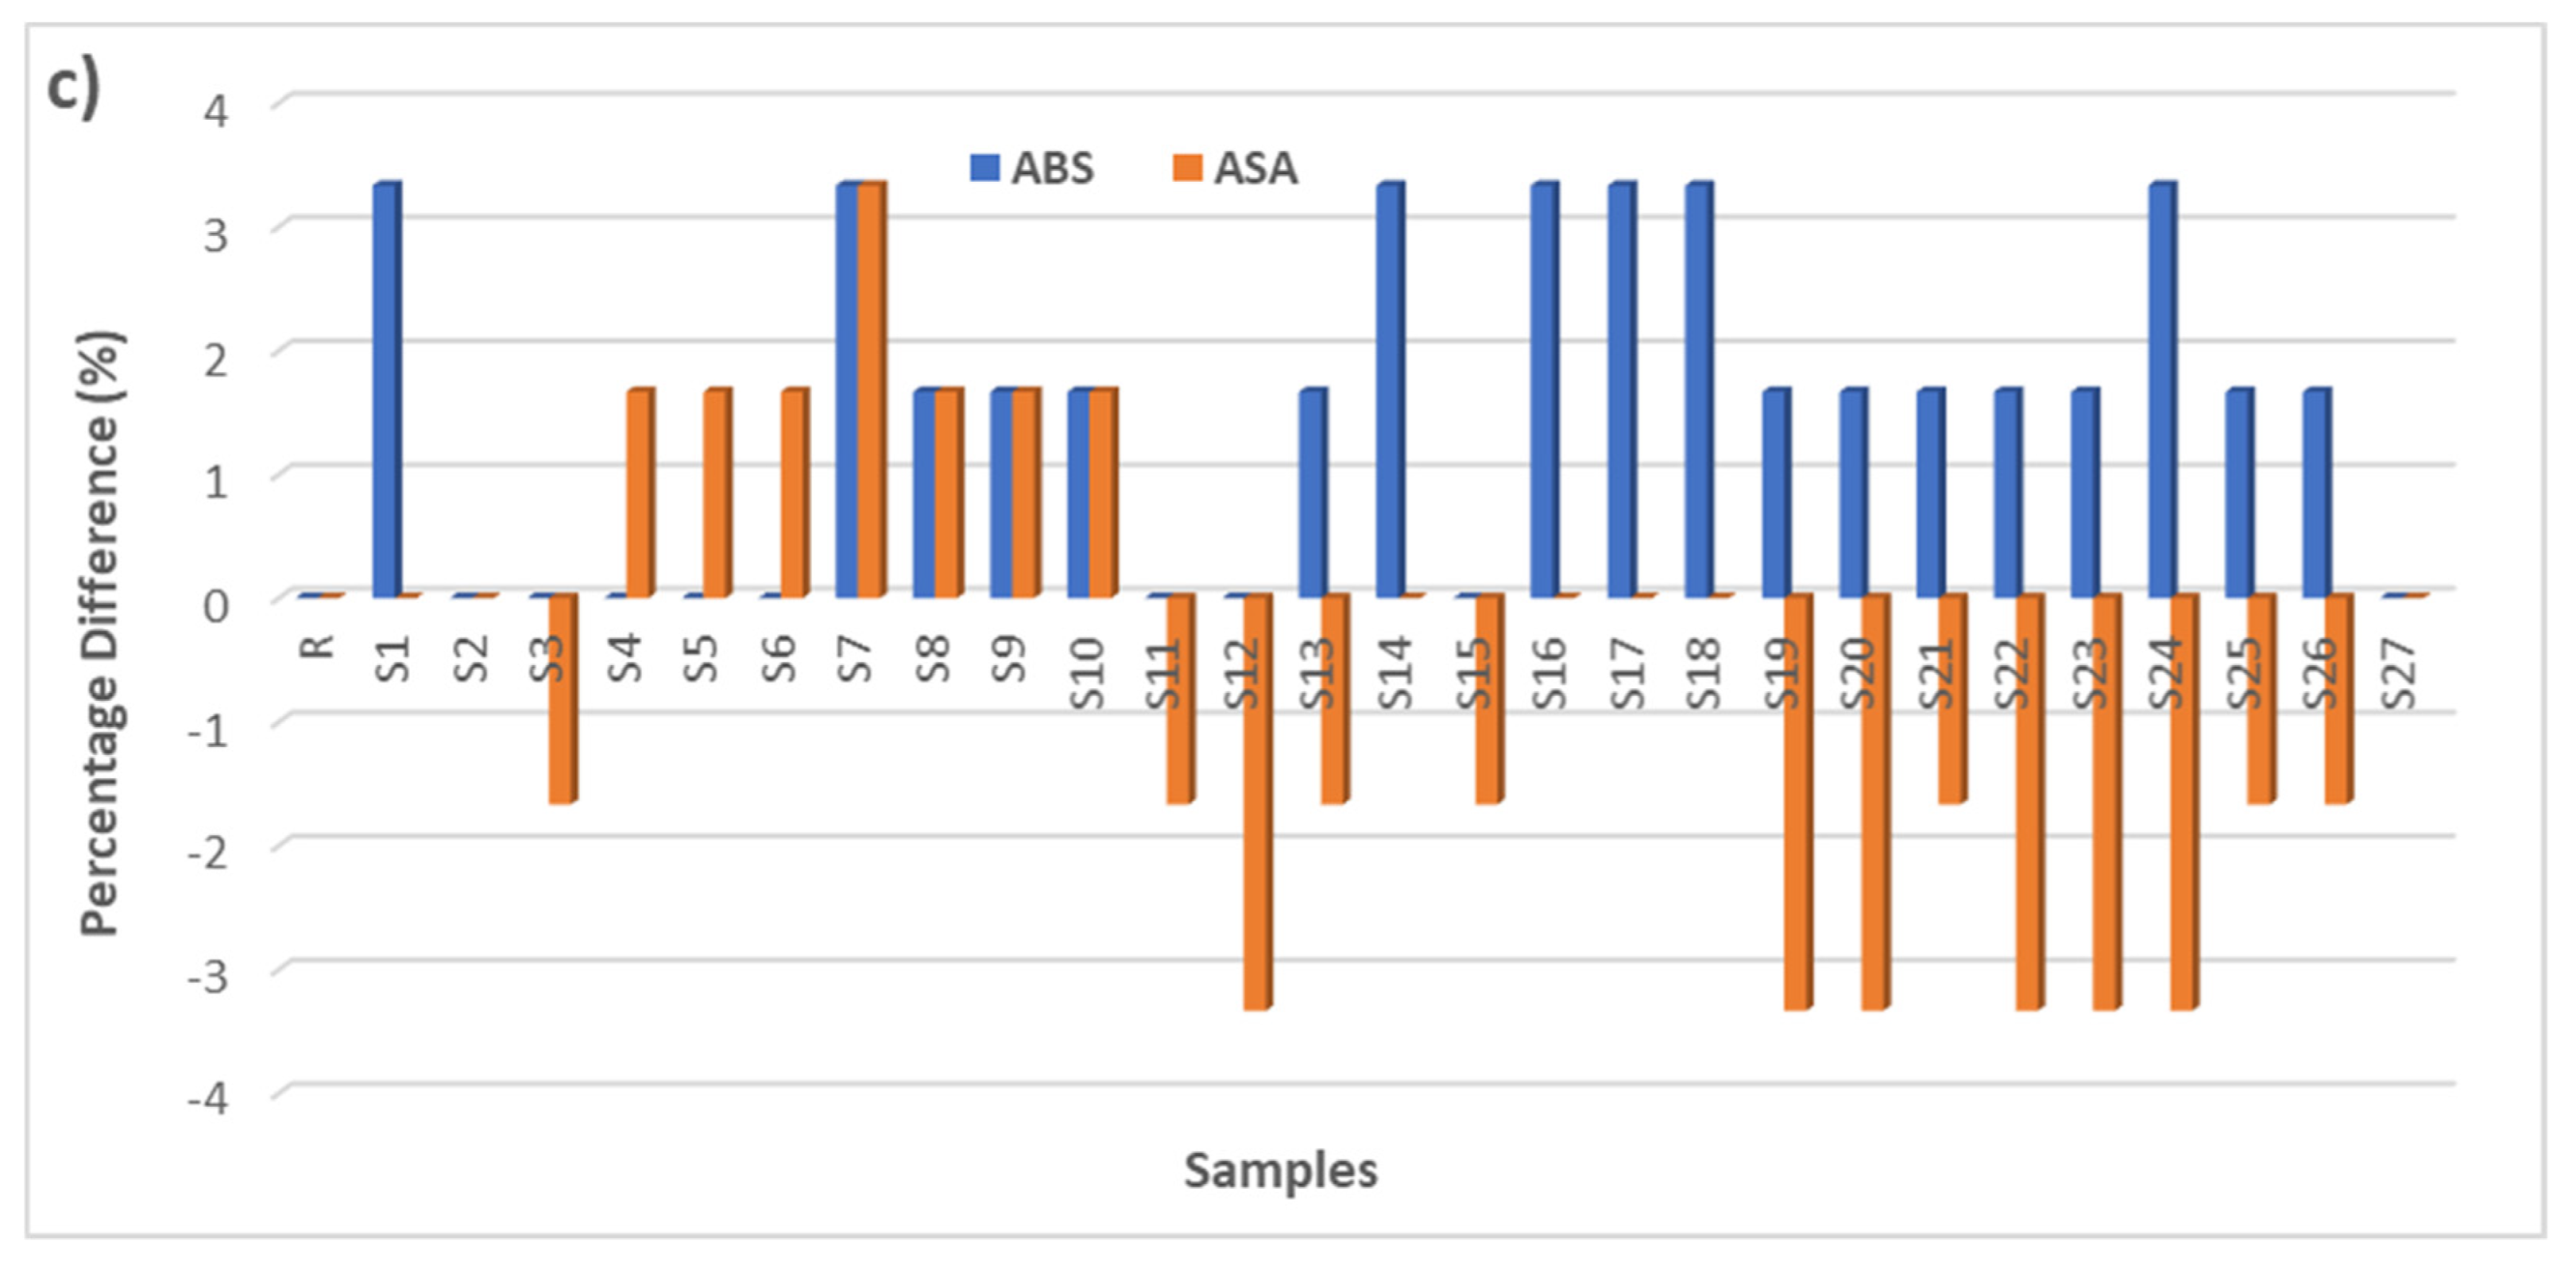
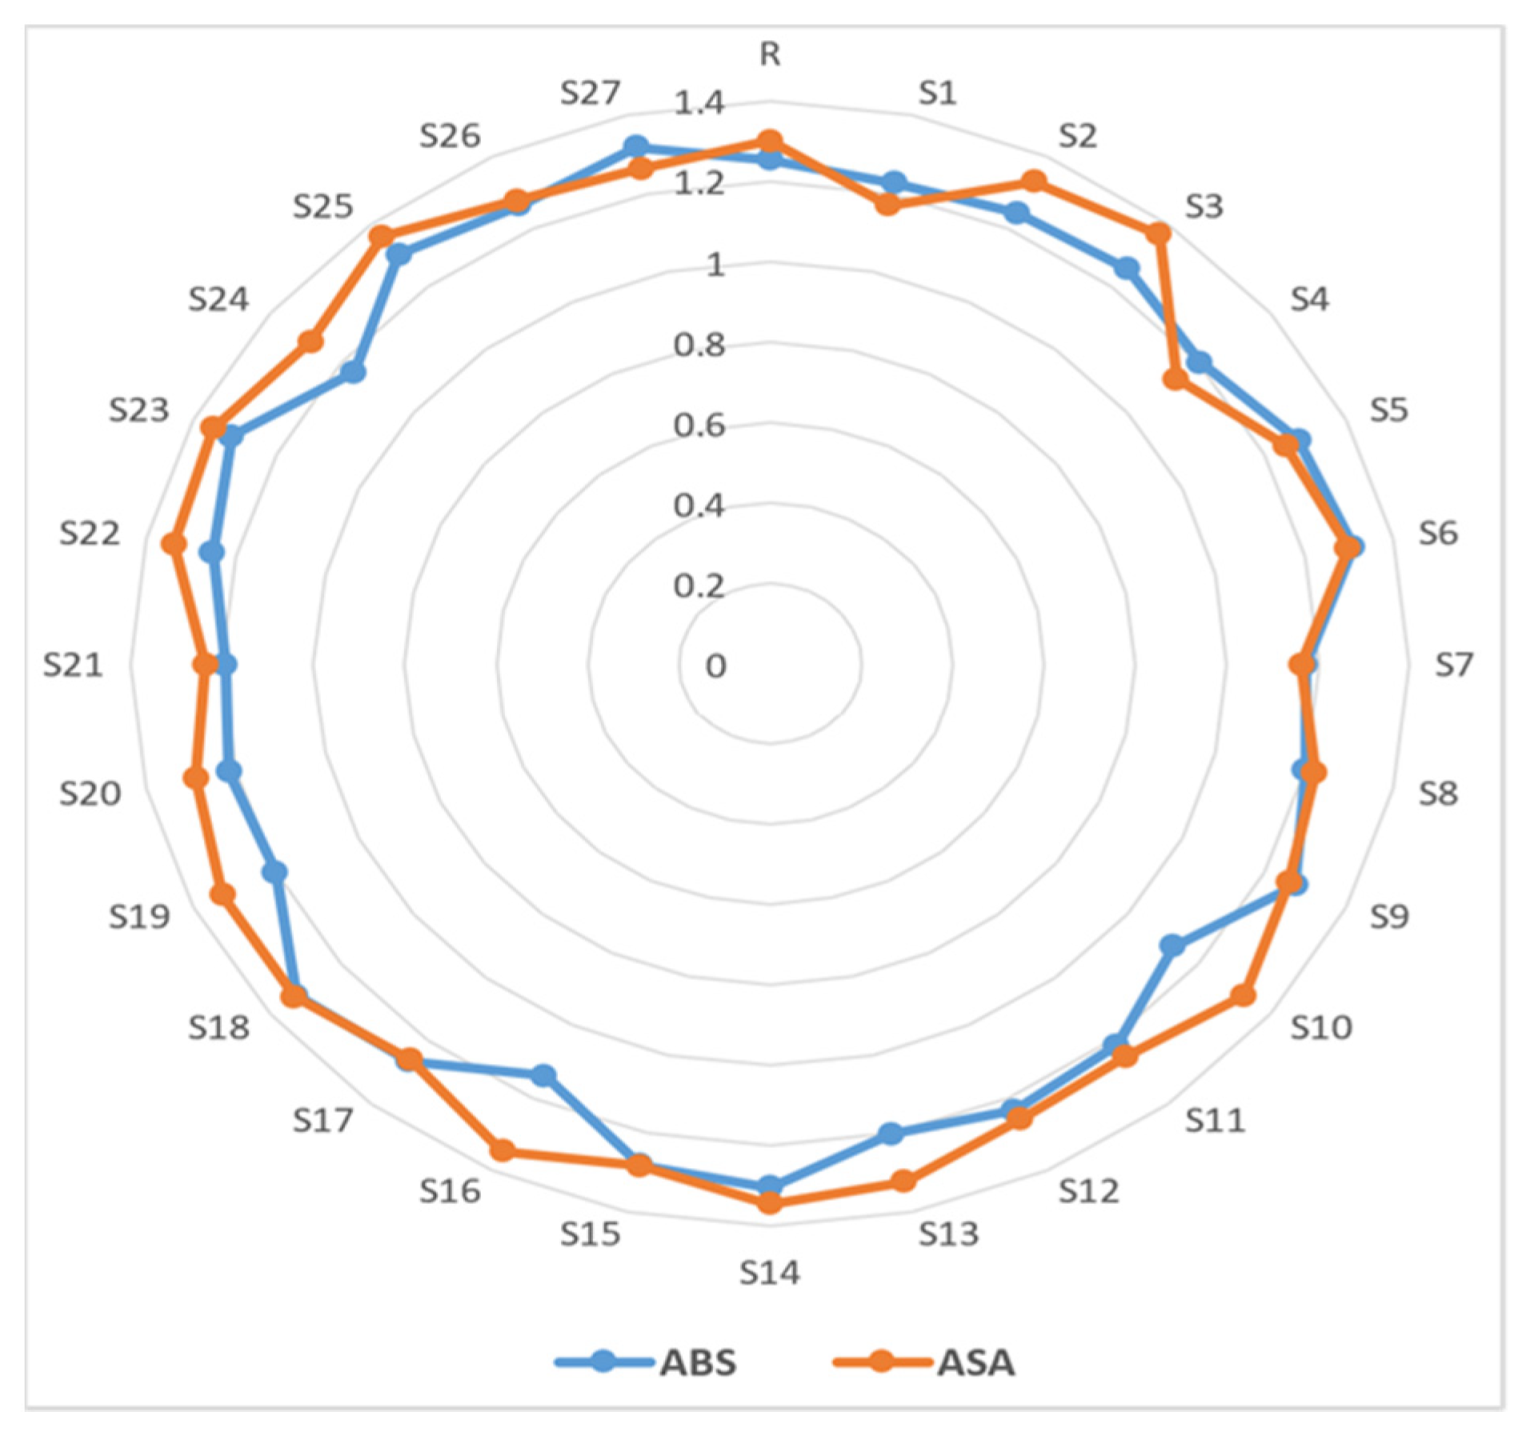
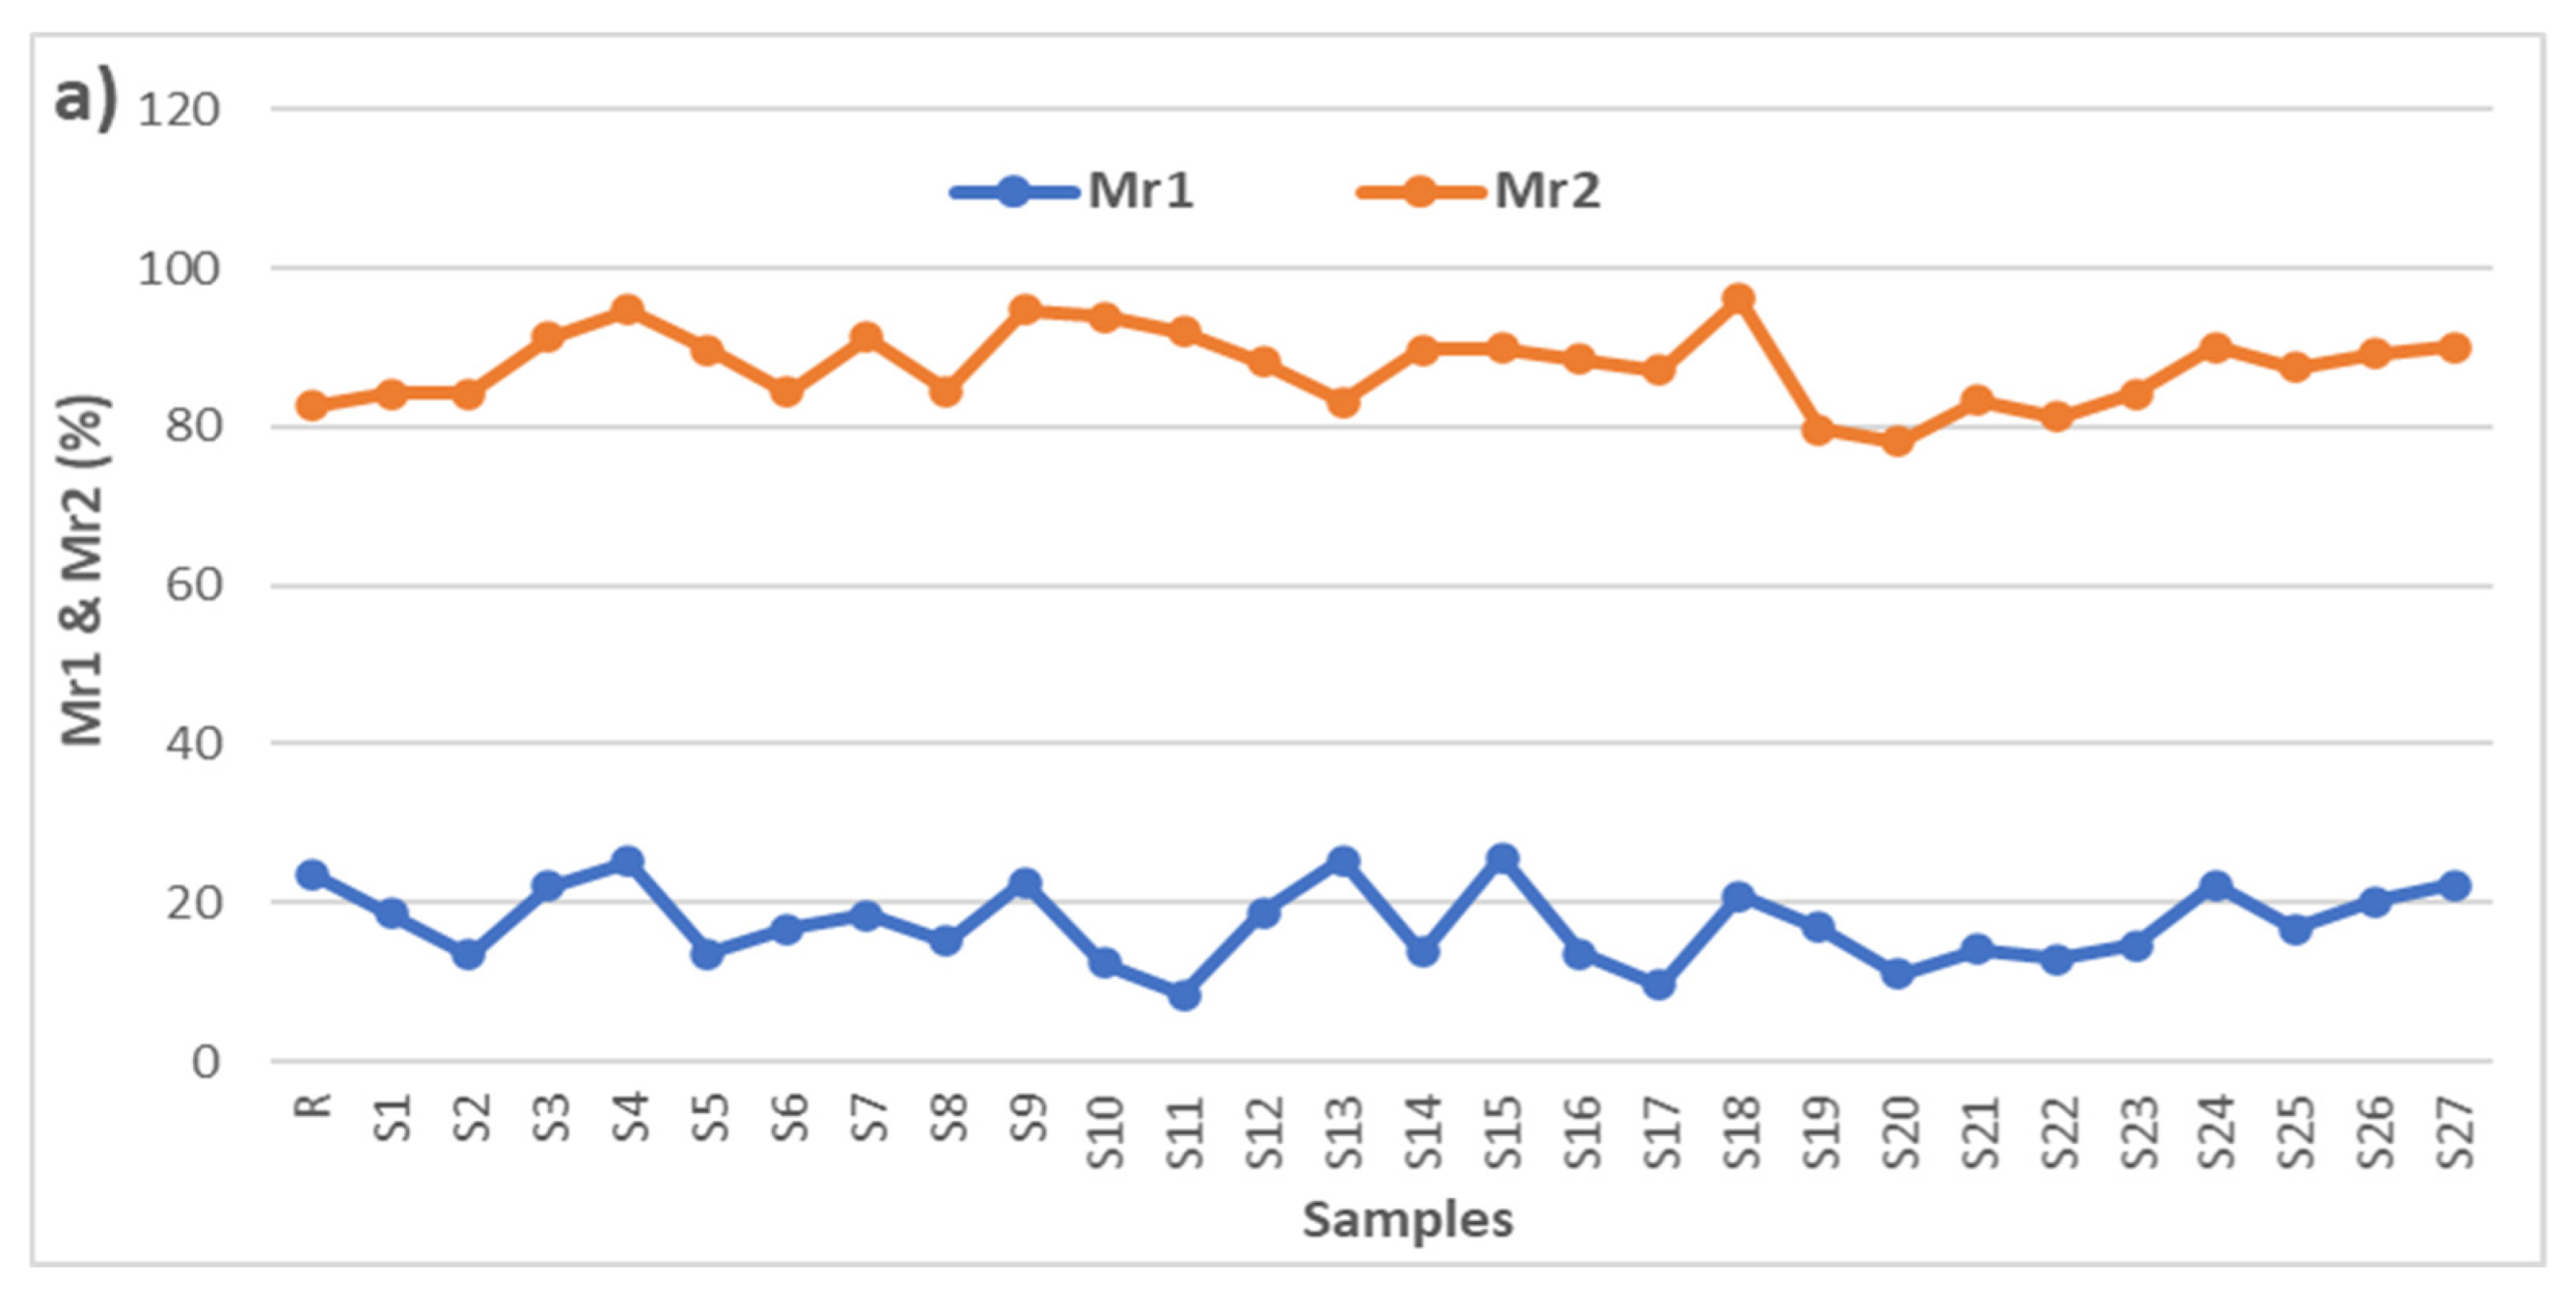
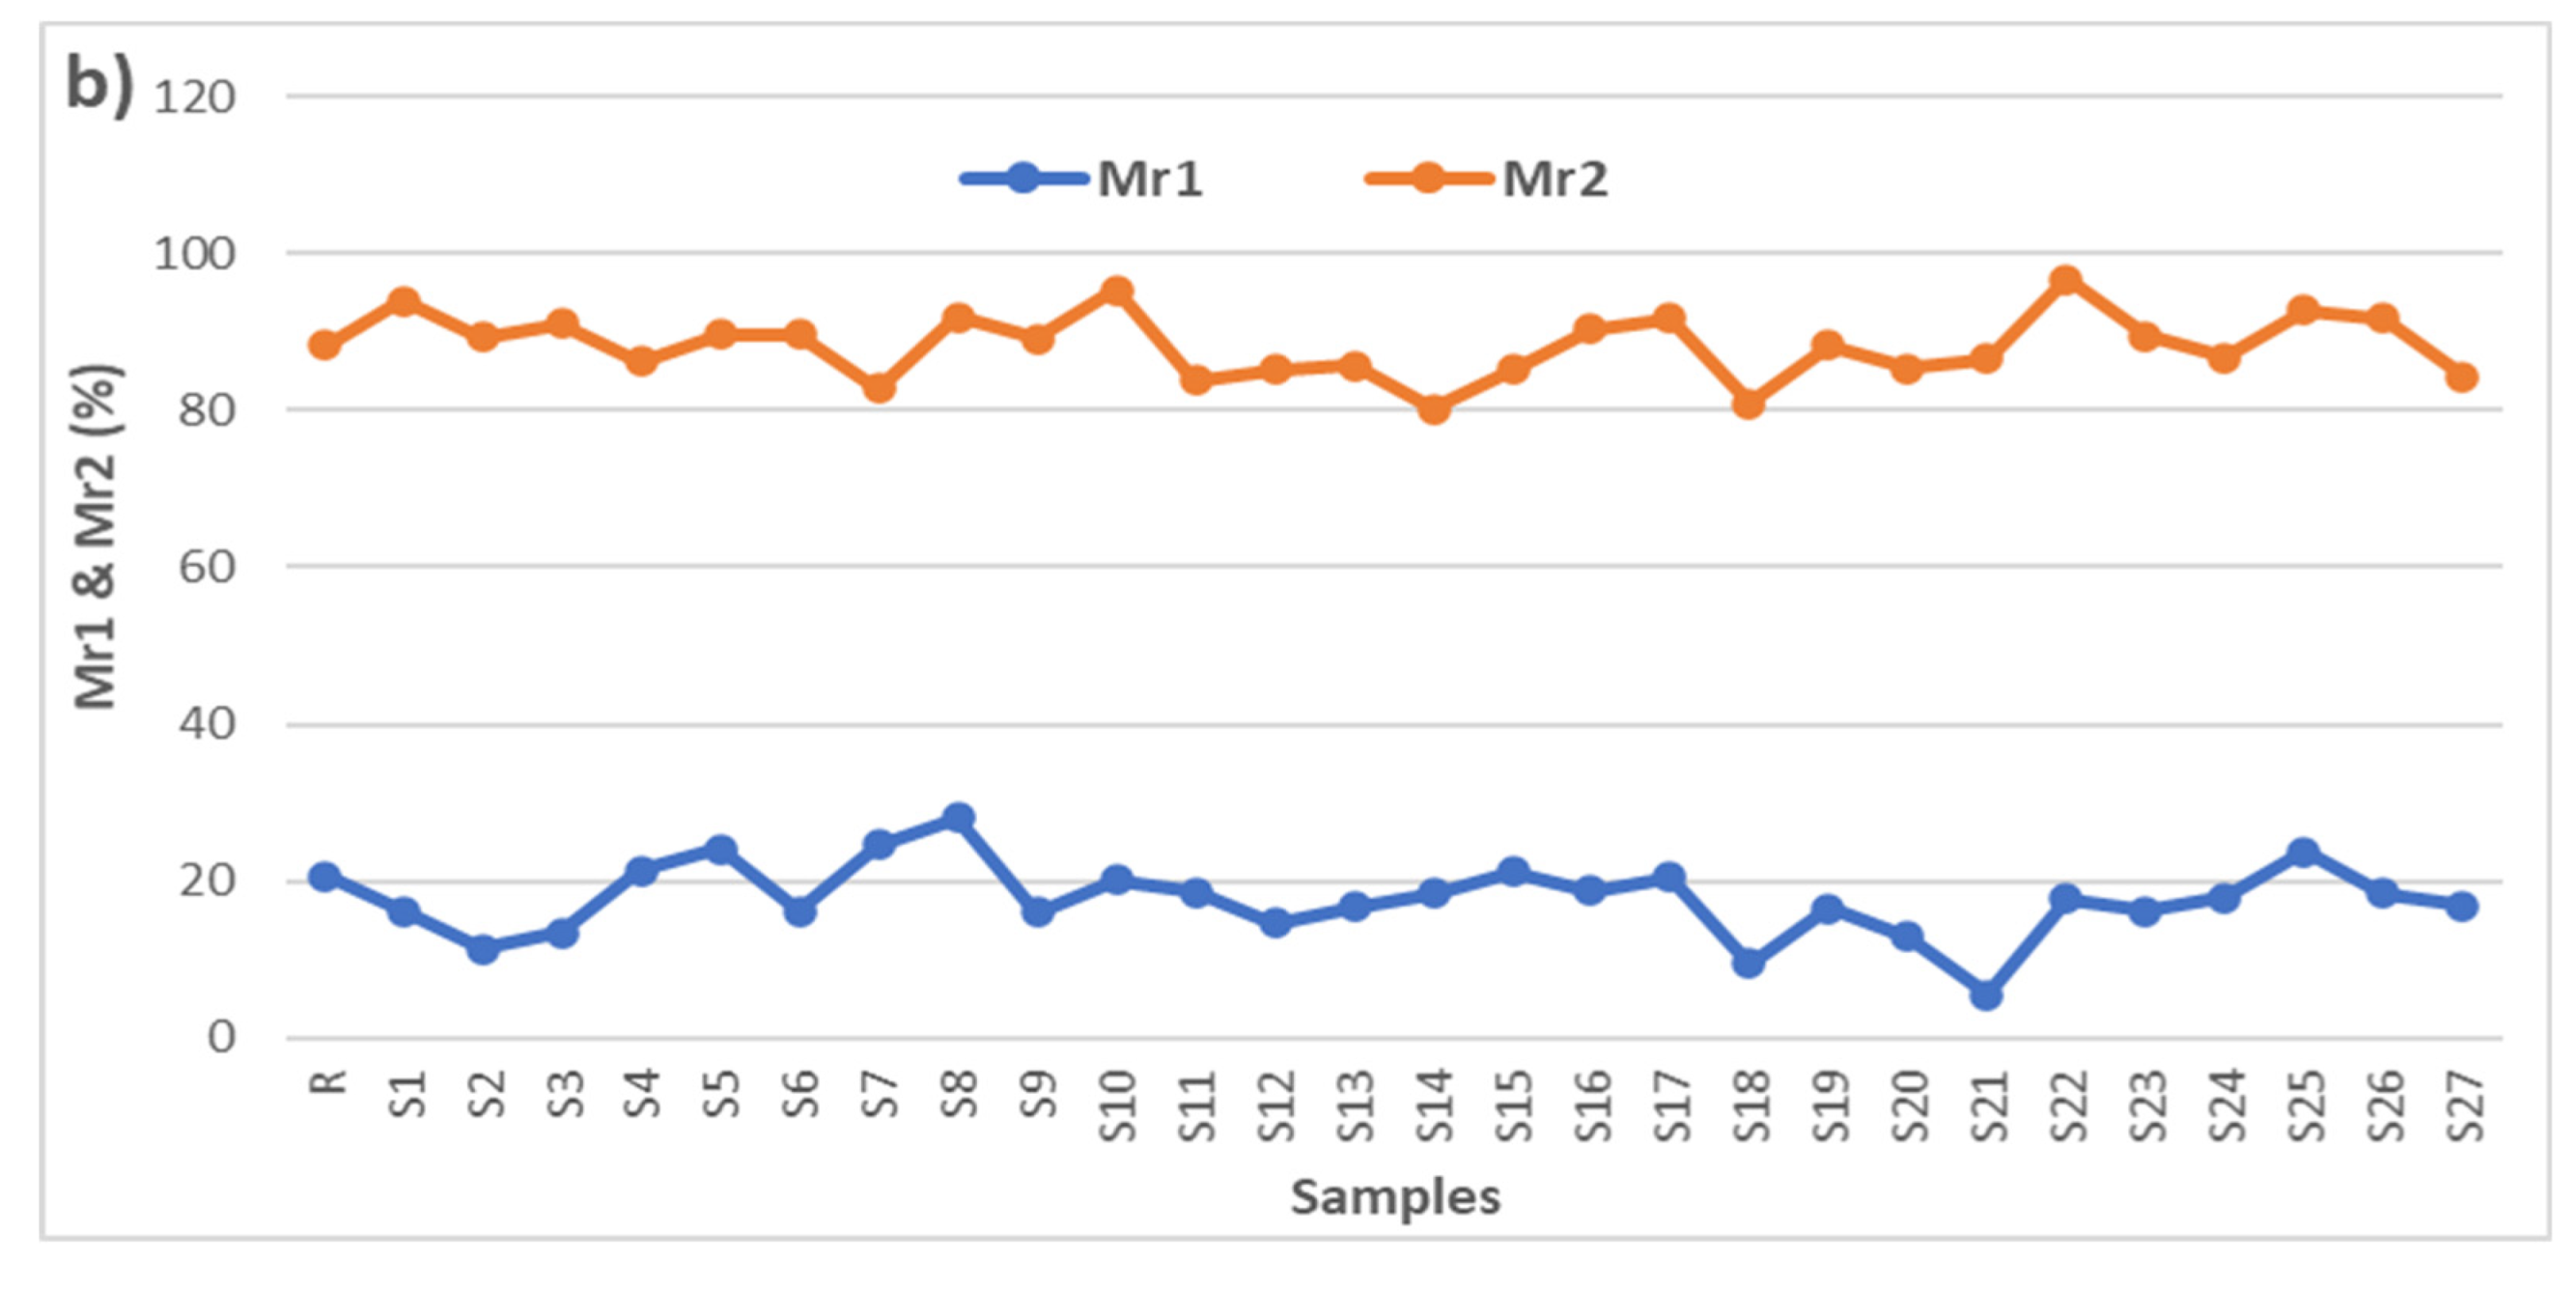
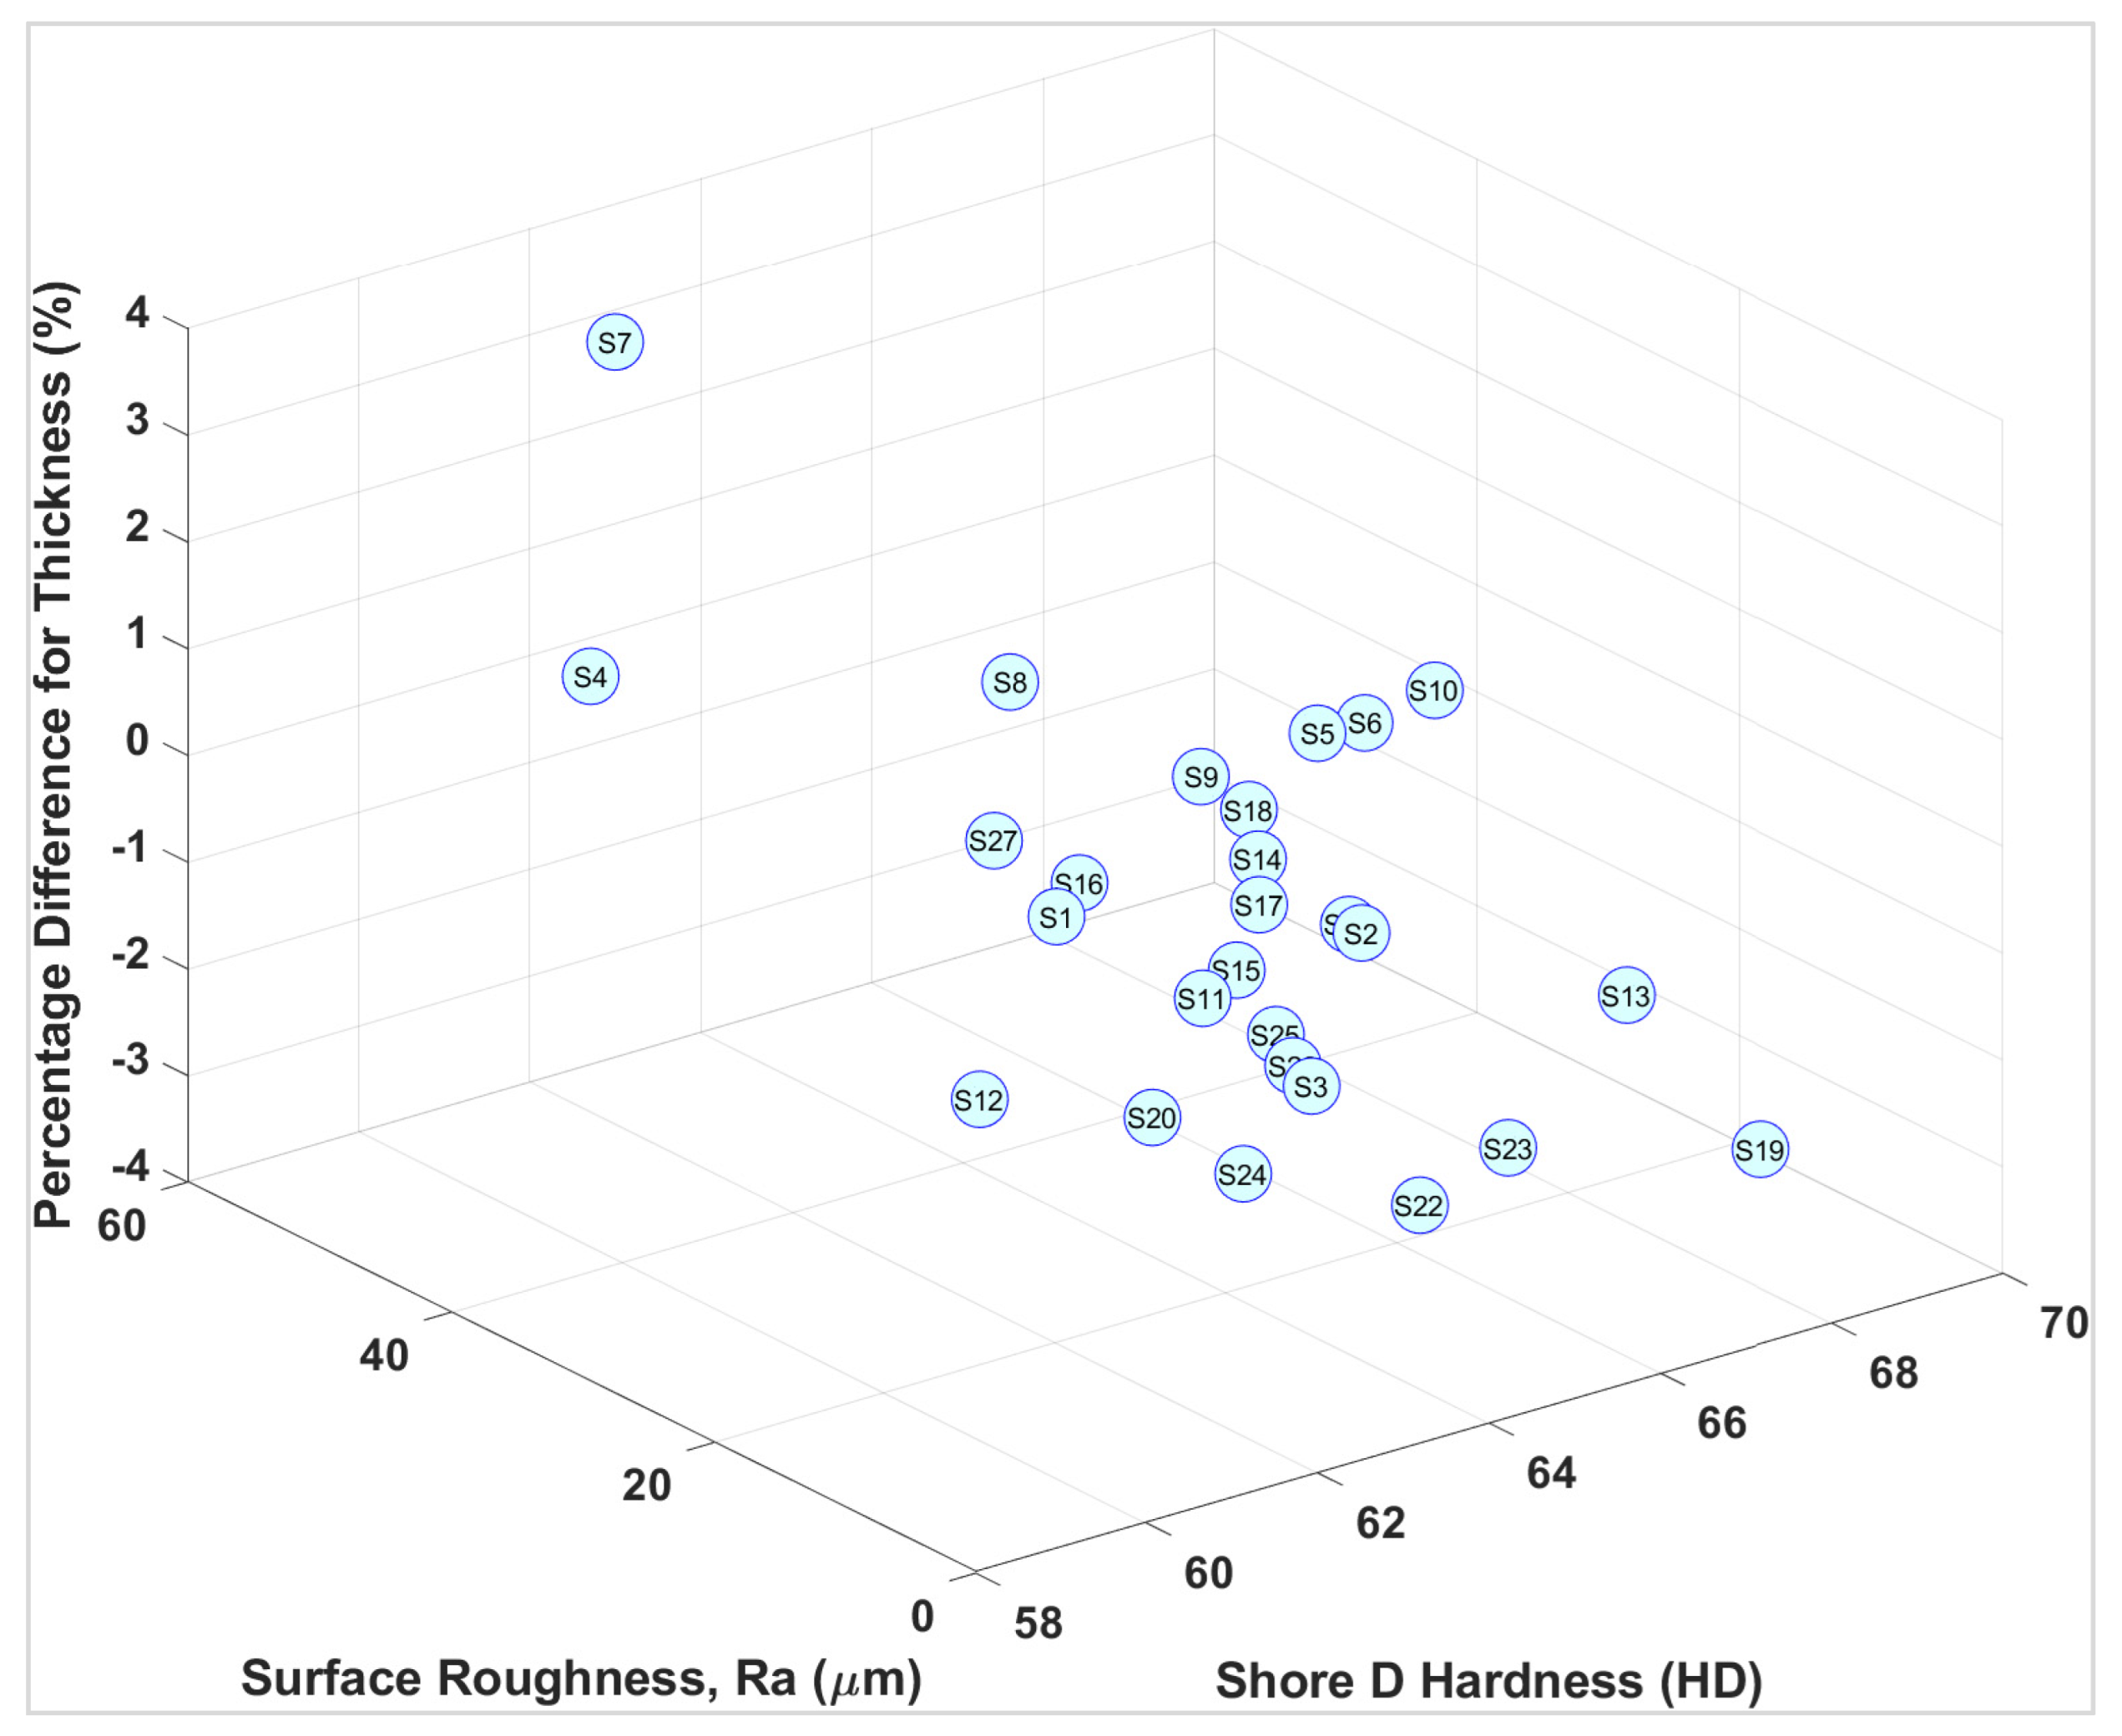
3.1. Dimensional Analysis

The Ultimaker Cura software package has introduced an ironing feature that aims to achieve smooth top layers to enhance the visual appeal of 3D prints. This is achieved by moving the nozzle back and forth over the top layer, which melts any material sticking up and forces it back into the top of the print by pushing the nozzle over it. In addition to brushing the heated nozzle over the layer, ironing also involves the extrusion of a small amount of material. This extra extrusion helps fill any gaps on the top layer, making the surface even smoother. To prevent blobs or other blemishes from over-extrusion, only a small fraction of the regular extrusion quantity is used during ironing. Considering that FFF parts are often criticised for not adhering to the dimensions of the CAD files [11,12,24], this addition of extra material can adversely affect the dimensional accuracy. To analyse this effect, a digital Vernier calliper was used to observe the deviations from the CAD file along the X- (length; 40 mm), Y- (width; 40 mm), and Z- (thickness; 15 mm) axes. As can be seen from Figure 1a,b, the deviations along the X- and Y-axes were very small. Furthermore, none of the ABS samples experienced a reduction from 40 mm, as opposed to ASA where some samples showed negative percentage differences. An important aspect to note is that the deviation along the Z-axis where ironing added a small amount of material to the top layer. It is evident from Figure 1c that ABS responded well to the ironing feature, as the excess material increased the thickness of most ABS samples in line with the increase in the ironing line spacing and flow. On the other hand, ASA experienced a similar pattern as with its X- and Y-axes where a reduction in thickness was observed along the Z-axis, even with the increase in the ironing line spacing. Overall, ASA was more adversely affected by the changes in ironing parameters compared to ABS.

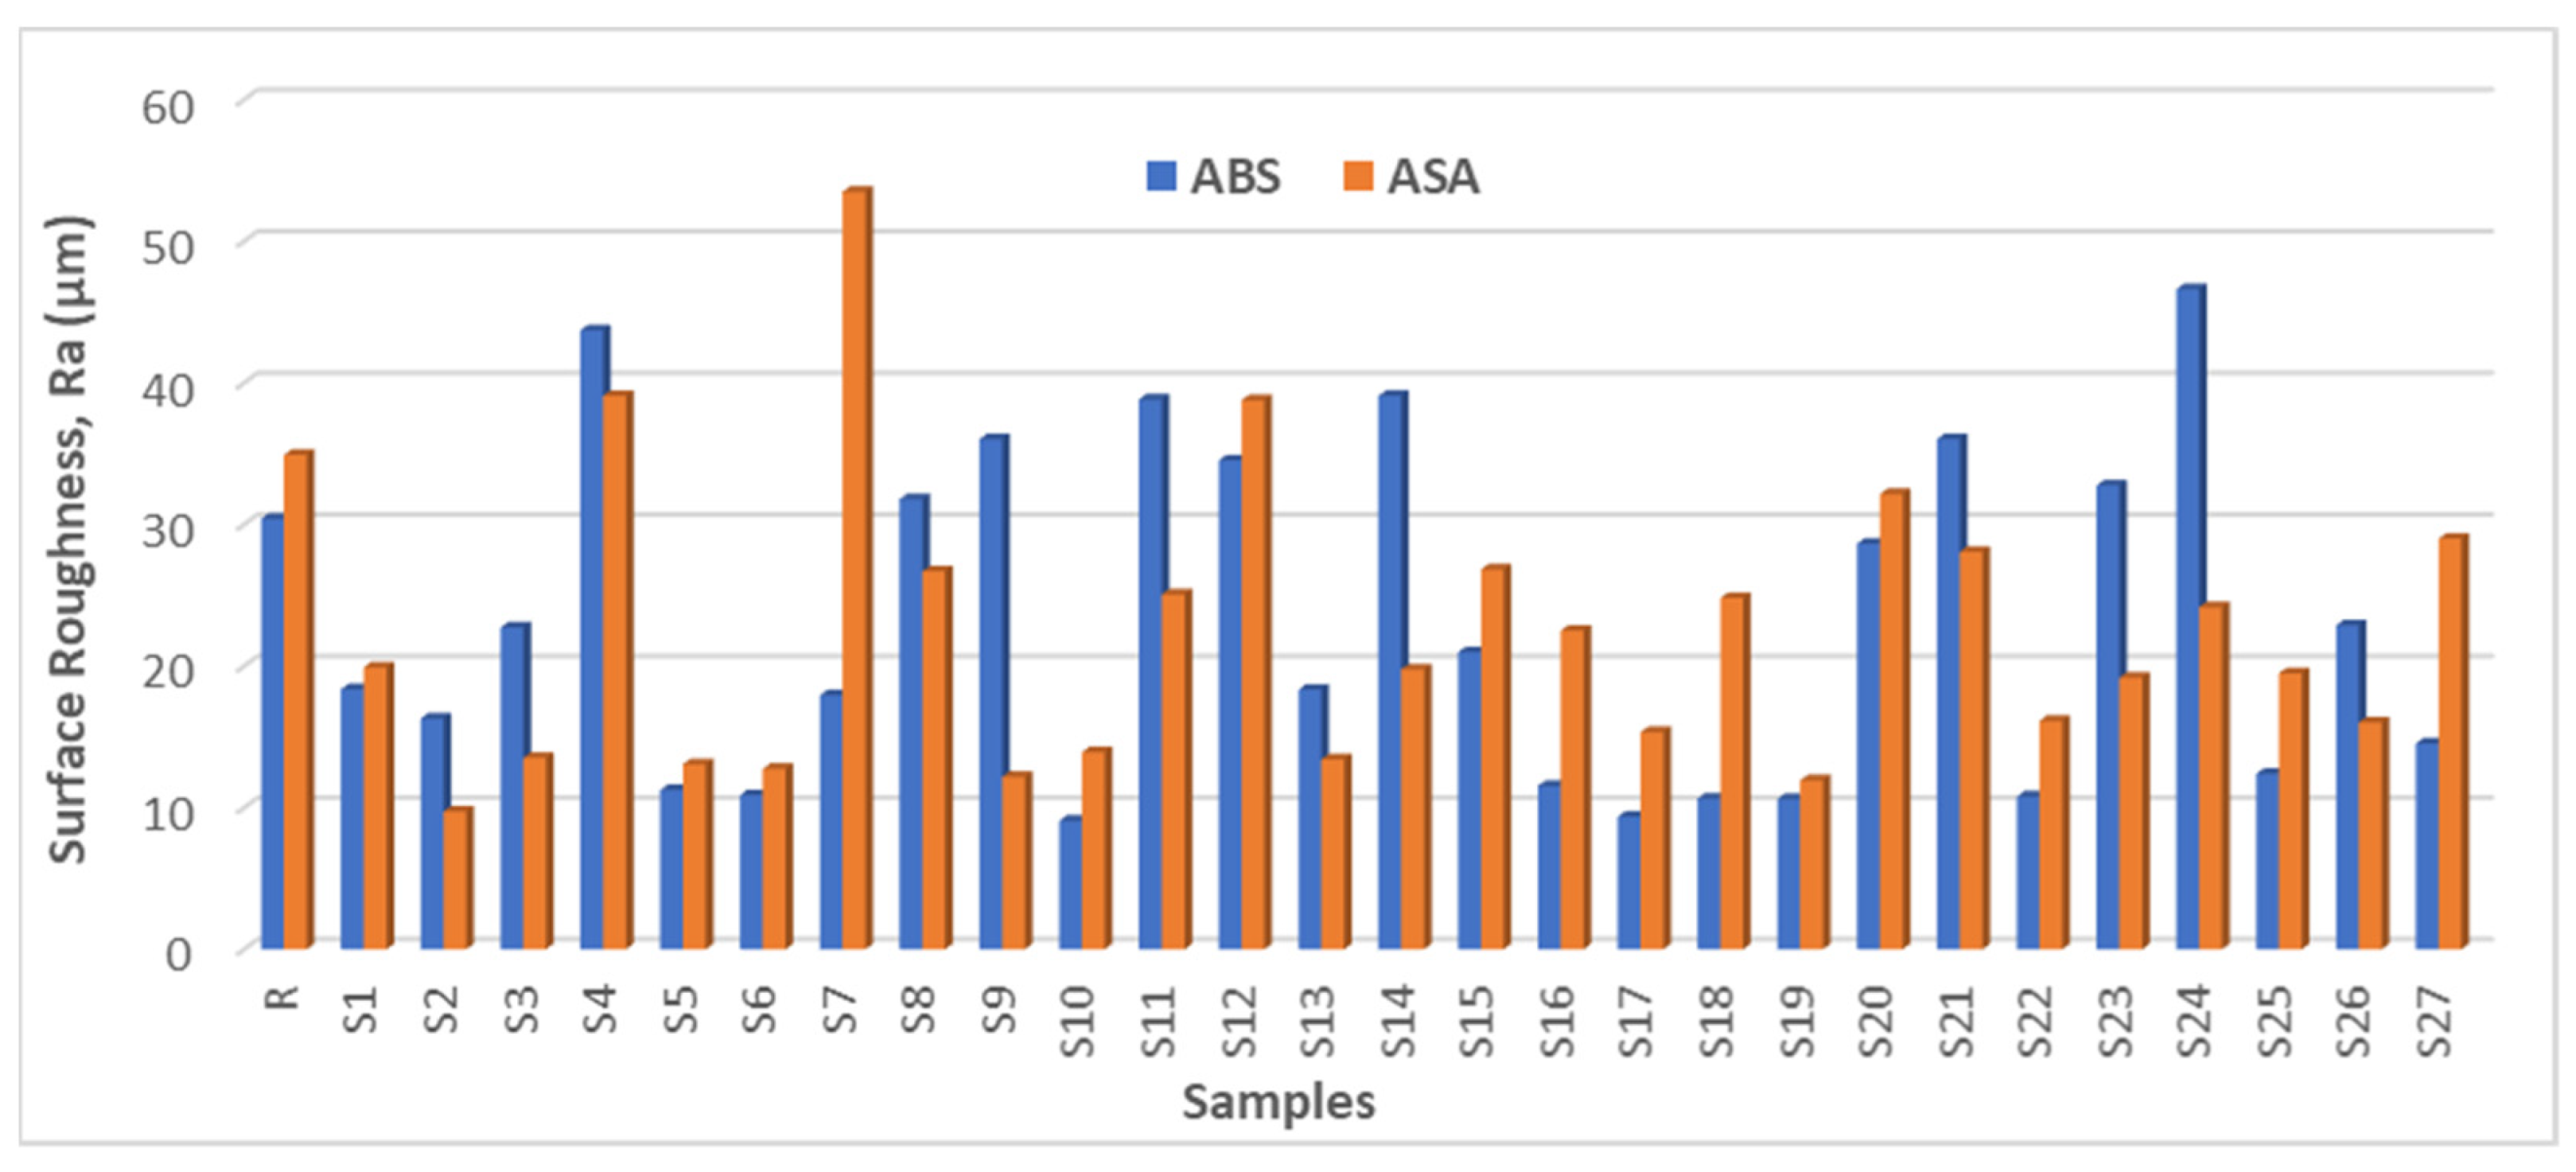
3.2. Surface Roughness Analysis

One of the major criticisms of the FFF process is poor surface finish, which is a product of the layer-by-layer construction as well as the processing parameters [8,13,14,15,18]. Therefore, optimisation of the parameters is critical and investigation is needed to observe the lowest surface roughness values possible with ironing involved. While ironing is a useful feature, it consumes slightly more time (Table 2) as the nozzle must make another pass over the top layer. Furthermore, ironing can only be performed on parts with flat top surfaces, as the nozzle can move back and forth easily on these types of models. This is the reason for printing square samples for this analysis. The average surface roughness values (Ra) for ABS and ASA are shown in Figure 2. It can be clearly observed that different ironing combinations yielded better surface roughness values compared to the sample (R = reference) with no ironing.
Figure 2 shows that the lowest surface roughness values for ABS were observed for S10 and S17. Both used a line spacing of 0.2 mm (equal to the layer height). Line spacing of 0.1 and 0.3 exhibited higher surface roughness values for ABS. Furthermore, higher ironing flow at lower speeds proved to be more effective in ensuring a smoother surface finish for ABS. Similarly to the dimensional analysis, ASA was more adversely affected compared to ABS and exhibited higher surface roughness values for the different combinations of ironing parameters. In the case of ASA, the lowest value was obtained at 0.1 mm line spacing with S2, and the combination of higher ironing flow with a lower speed showed higher surface roughness values.
The two-dimensional (2D) surface profile ratios of Rq/Ra for ABS and ASA are shown in Figure 3. Ideally, Rq/Ra equal to 1.22 (for 2D) with minimum deviation is an excellent surface profile ratio, as the Rq is more sensitive to peaks and valleys than Ra because the amplitudes are squared [9,24]. For ABS, the ratio of the average root means square (Rq) to average surface roughness (Ra) was found to randomly vary with a deviation of around 1.24 ± 0.044 for 0.1 mm ironing line spacing, 1.23 ± 0.069 for 0.2 mm ironing line spacing, and 1.24 ± 0.056 for 0.3 mm ironing line spacing. These deviations were very small and were tolerable for all the combinations of ironing parameters. The Rq/Ra for ASA randomly varied with a deviation of around 1.24 ± 0.078 for 0.1 mm ironing line spacing, 1.30 ± 0.039 for 0.2 mm ironing line spacing, and 1.30 ± 0.043 for 0.3 mm ironing line spacing. Both ABS and ASA showed alignment with their Ra results, and the lowest deviation was observed at 0.2 mm ironing line spacing for ABS and at 0.1 mm ironing line spacing for ASA.

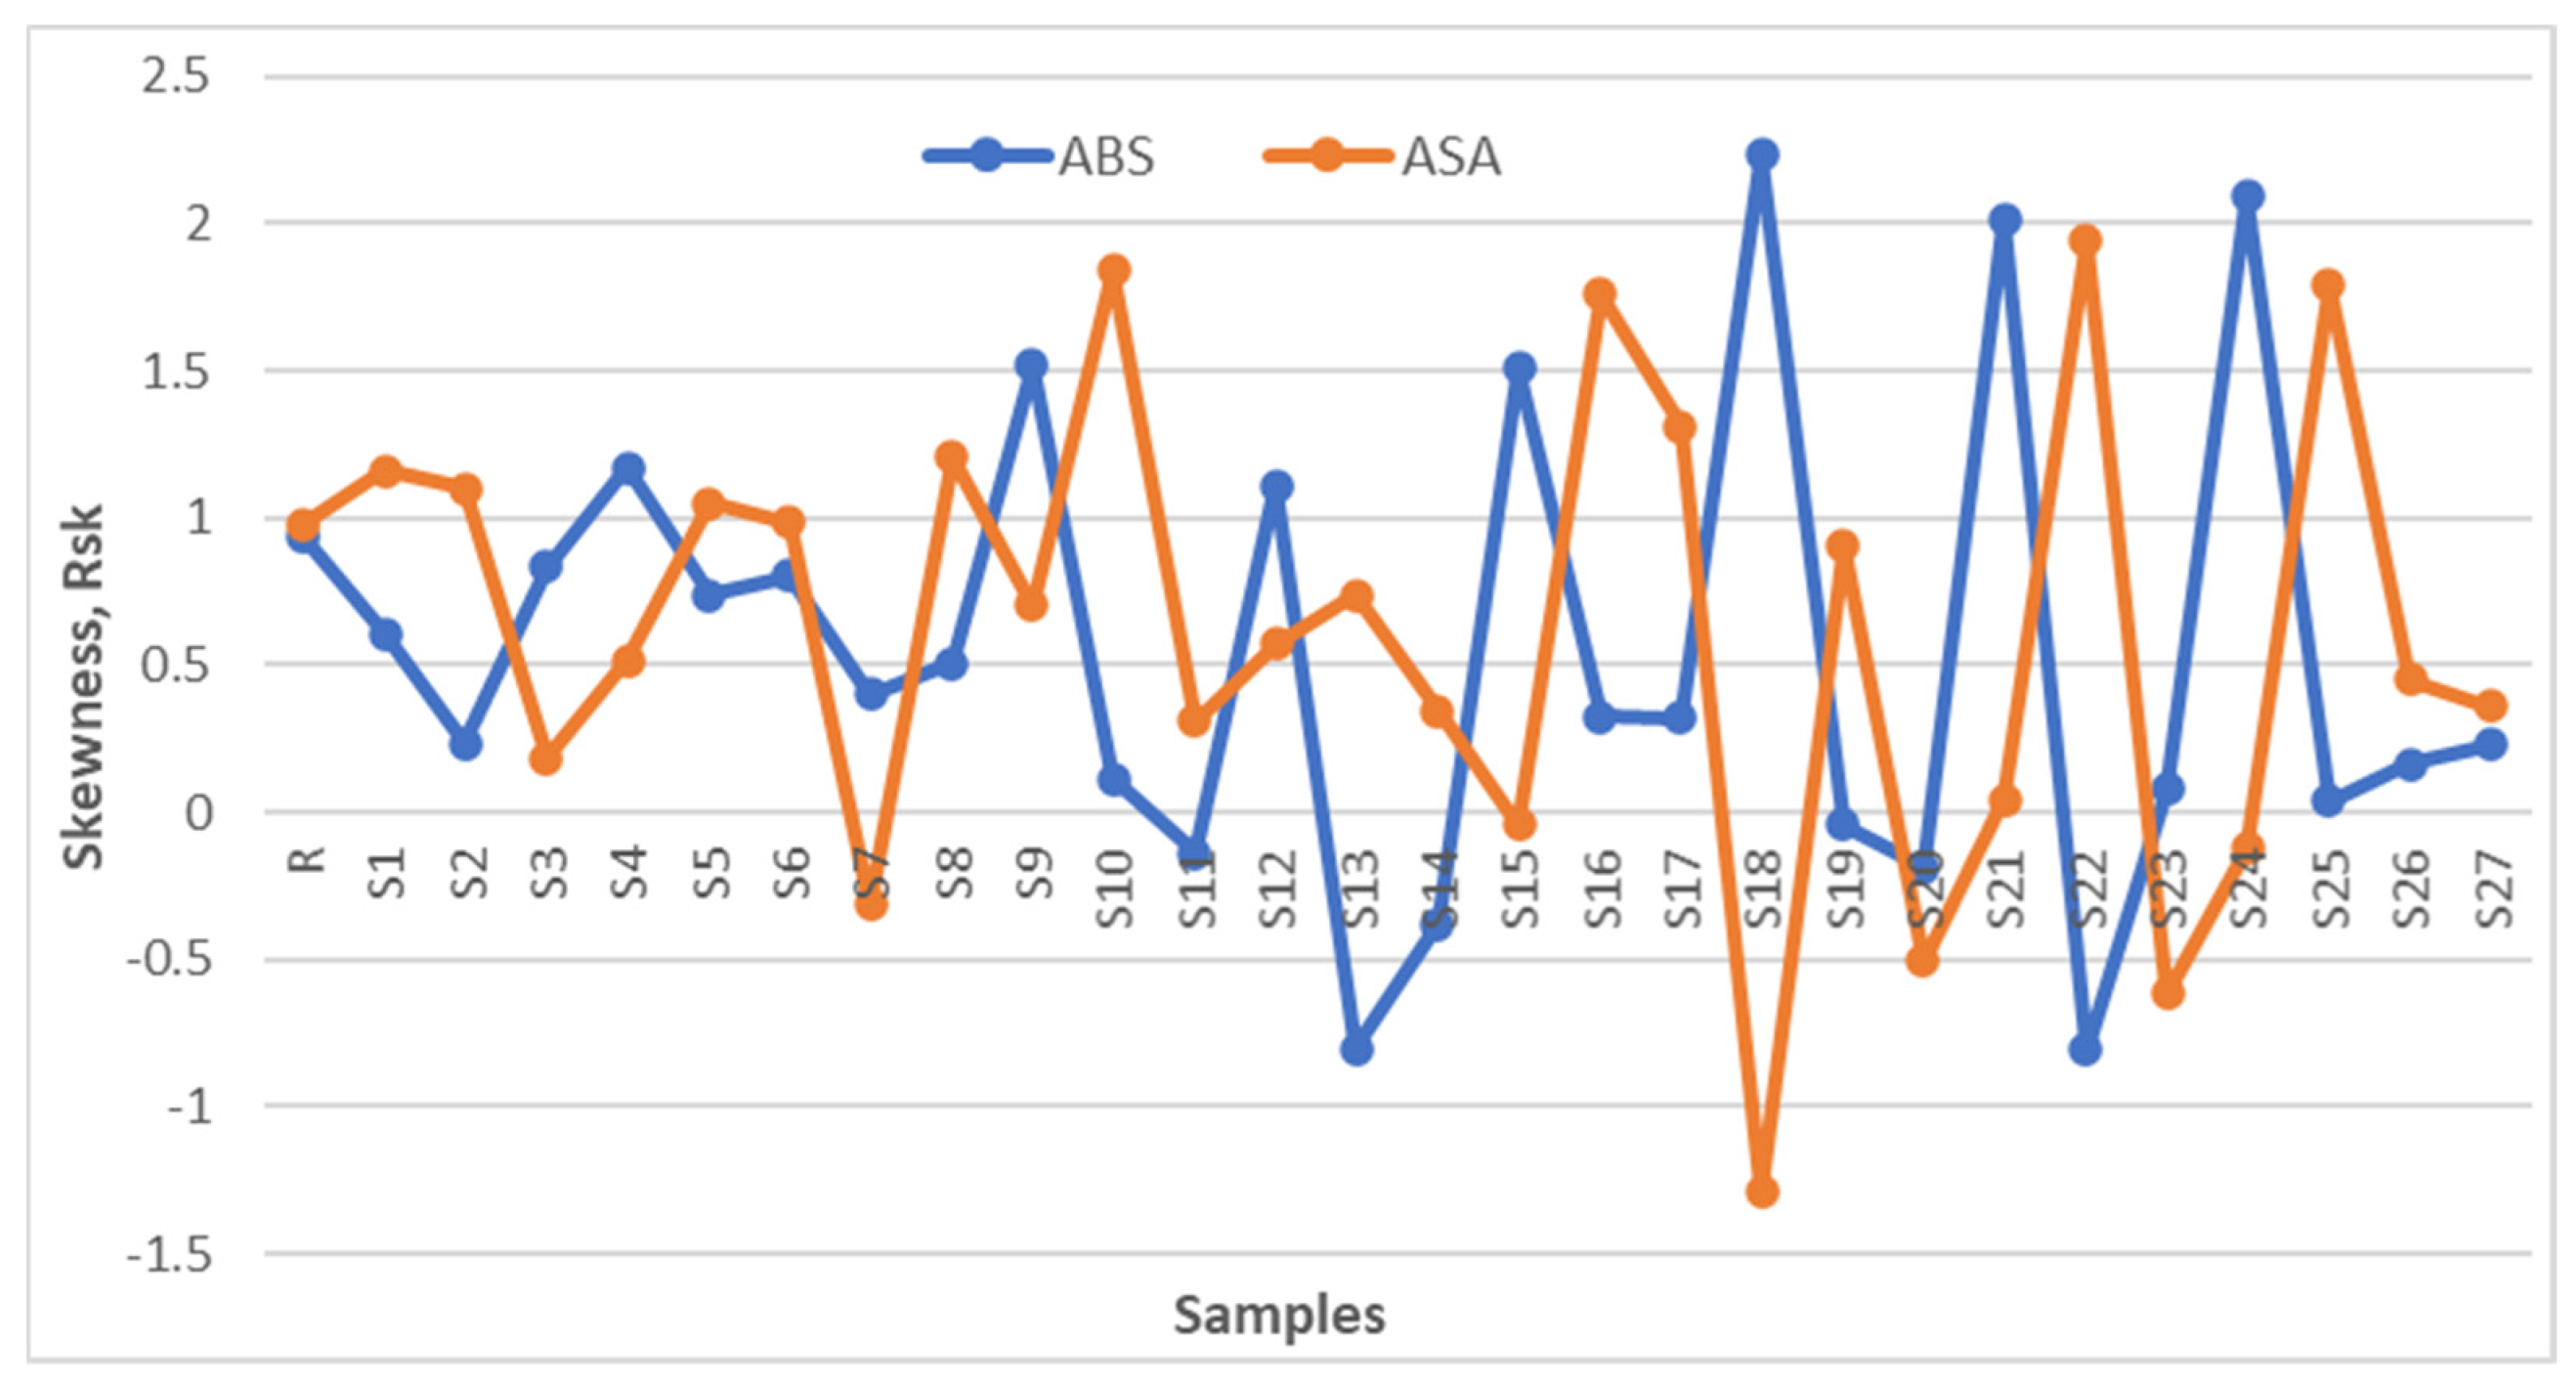
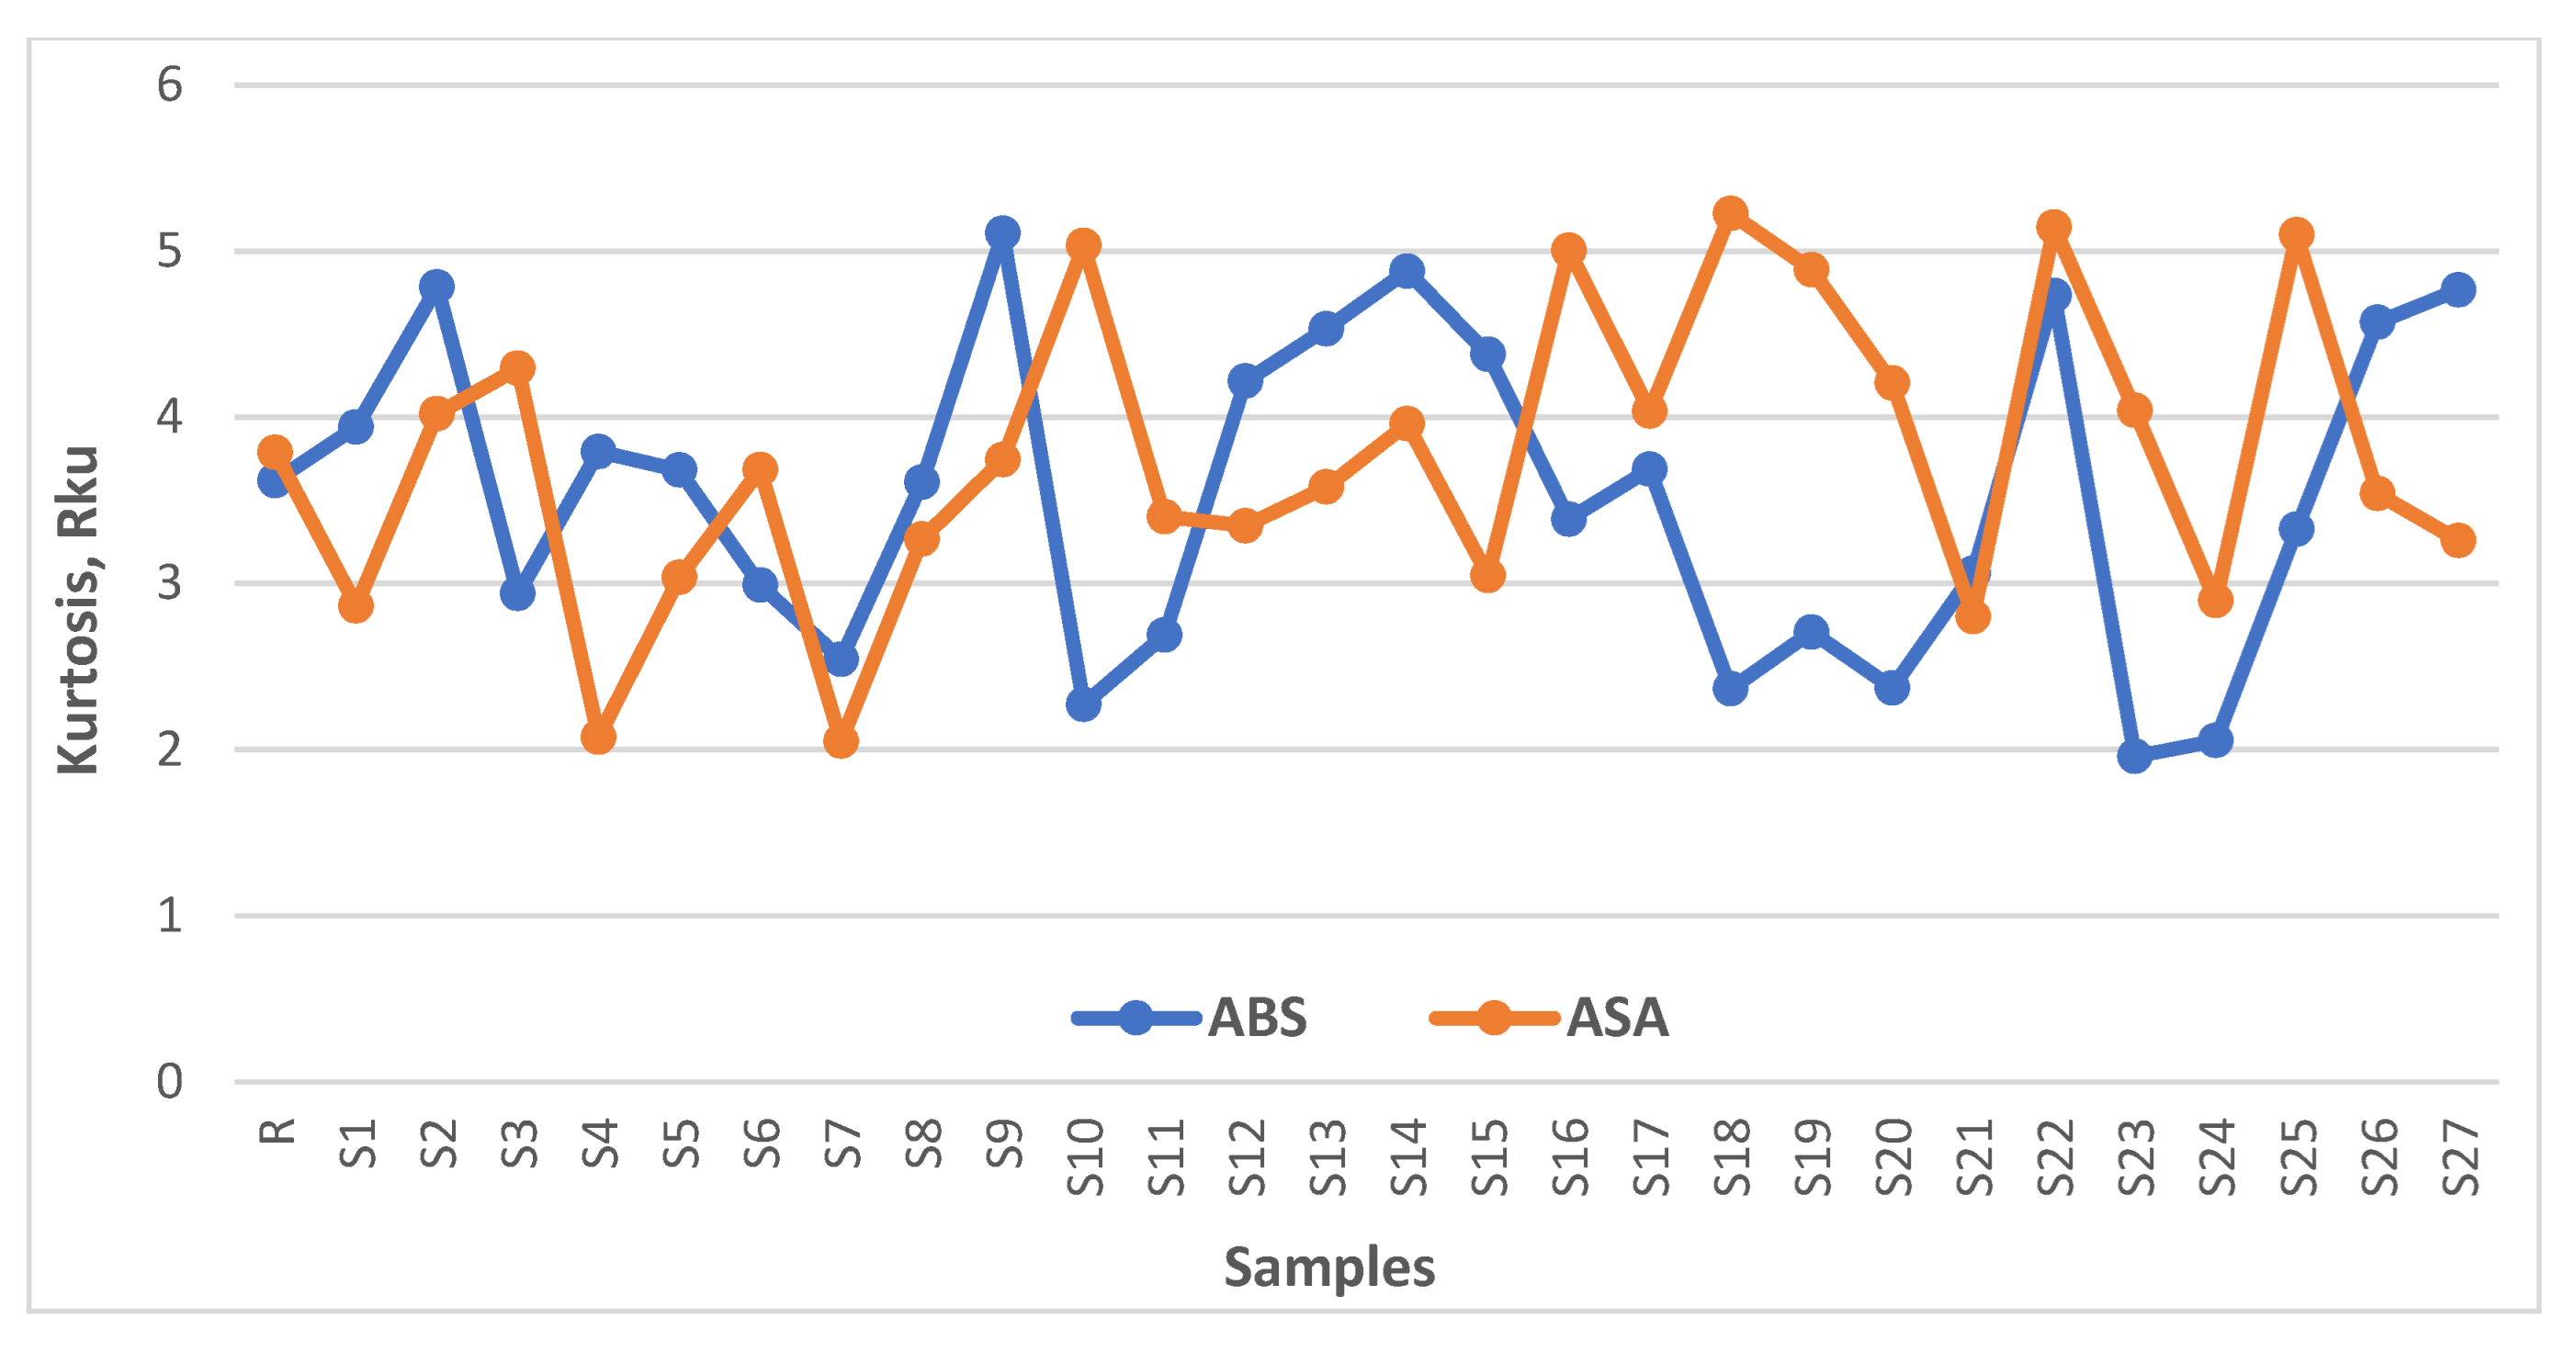
3.2.1. Skewness and Kurtosis

The third central moment skewness (Rsk) and the fourth central moment kurtosis (Rku) for ABS and ASA are shown in Figure 4 and Figure 5, respectively. Ideally, a value of zero for skewness and three for kurtosis is typical for a random Gaussian profile, and is weakly isotropic [9,24,36]. It is clear from Figure 4 that ABS showed an overall high positive skew (positive for steep peaks and flat valleys representing a surface with a flat bulk and high peaks, as if particles were deposited on a plane). Ironing line spacing of 0.1 mm showed a positive skew, whereas the remaining two line spacings showed some combinations with negative skews at lower ironing flows and speeds. The maximum and minimum trends of skewness were in the range of 0.23 ≤ Rsk ≤ 1.51 for 0.1 mm ironing line spacing, −0.80 ≤ Rsk ≤ 2.23 for 0.2 mm ironing line spacing, and −0.80 ≤ Rsk ≤ 2.09 for 0.3 mm ironing line spacing. ASA also showed a similar pattern with a high positive skew. Only one moderately negative skew was observed with the ironing line spacing of 0.1 mm, whereas three were observed with the remaining two line spacings. The un-ironed sample of ABS showed a high positive skew as well. For ASA, the maximum and minimum trend of skewness was in the range of −0.31 ≤ Rsk ≤ 1.20 for 0.1 mm ironing line spacing, −1.29 ≤ Rsk ≤ 1.83 for 0.2 mm ironing line spacing, and −0.61 ≤ Rsk ≤ 1.94 for 0.3 mm ironing line spacing. Similarly to ABS, the un-ironed sample of ASA also showed a high positive skew.
In Figure 5, the maximum and minimum trend of kurtosis for ABS was in the range of 2.93 ≤ Rku ≤ 5.10 for 0.1 mm ironing line spacing, 2.27 ≤ Rku ≤ 4.88 for 0.2 mm ironing line spacing, and 1.95 ≤ Rku ≤ 4.76 for 0.3 mm ironing line spacing. Based on the kurtosis results, the ironing line spacings of 0.1 mm and 0.3 mm showed leptokurtic (longer and fatter tails with a high and sharp central peak), platykurtic (narrow distribution with a few extreme points above and below while most points are concentrated around the mean value), and mesokurtic (normal) distribution. The ironing line spacing of 0.2 mm started and ended with leptokurtic distribution, with most of its combinations showing platykurtic distribution. Furthermore, as the ironing speed and flow increased for the line spacing of 0.1 mm, the distribution switched from leptokurtic to either platykurtic or mesokurtic. The opposite was observed for the ironing line spacing of 0.3 mm, with a switch from platykurtic to either platykurtic or mesokurtic distribution occurring with increases in ironing speed and flow. The un-ironed sample of ABS showed a leptokurtic distribution, meaning high peaks. On the other hand, the maximum and minimum trend of kurtosis for ASA was in the range of 2.05 ≤ Rku ≤ 4.29 for 0.1 mm ironing line spacing, 3.04 ≤ Rku ≤ 5.22 for 0.2 mm ironing line spacing, and 2.89 ≤ Rku ≤ 5.14 for 0.3 mm ironing line spacing. Ironing line spacing of 0.1 mm and 0.2 mm showed a mix of all three distributions. However, 0.1 mm line spacing switched randomly with an increase in ironing flow and speed. The line spacing of 0.2 mm showed a clear switch from leptokurtic to mesokurtic distribution (S15) at the maximum ironing speed, before switching back to leptokurtic distribution. Moreover, 0.3 mm ironing line spacing switched from leptokurtic to platykurtic distribution at the maximum ironing speed, before switching back to leptokurtic for all the combinations (except for the 30% ironing flow combination with 150 mm/s speed). Similarly to ABS, the un-ironed sample of ASA showed a leptokurtic distribution.

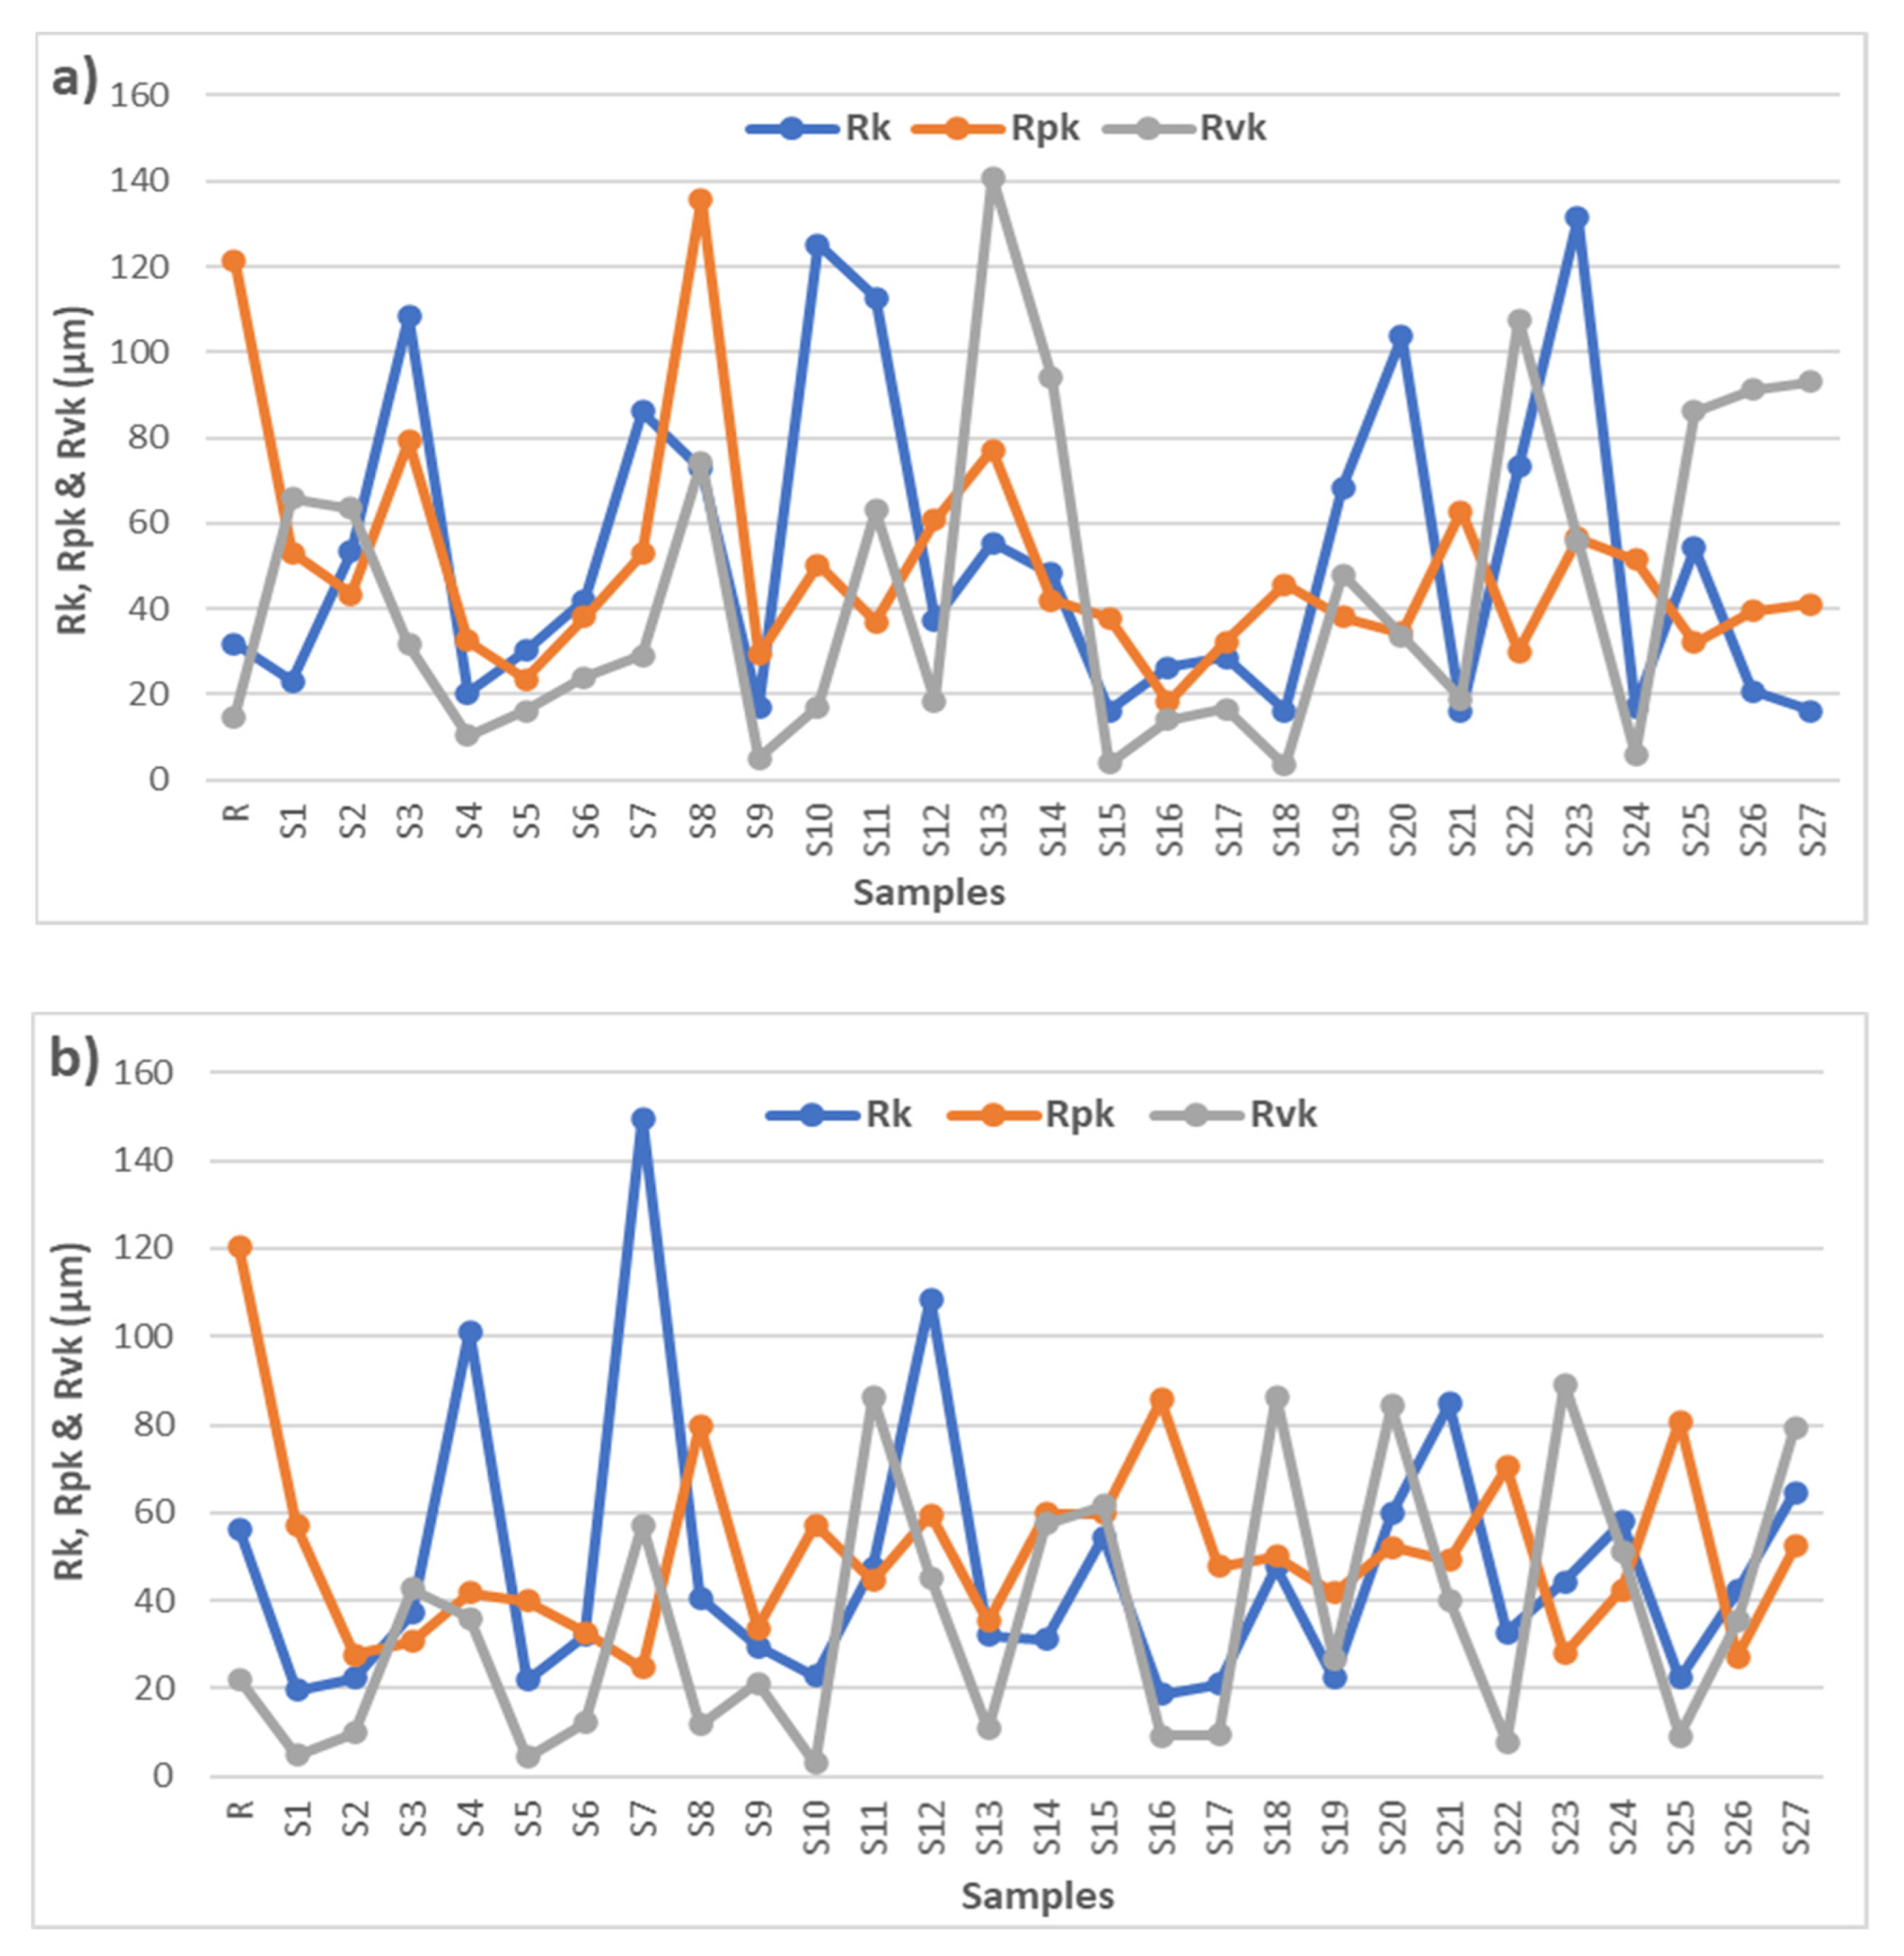
3.2.2. Height Characterization

The Rk group parameters (Rk, Rpk, Rvk, Mr1, and Mr2) were derived from the bearing ratio curve based on the ISO 13565-2:1996 standard [29]. The mean values of the Rk group for ABS and ASA are shown in Figure 6. It is evident from Figure 6a that these values were lowest with the ironing line spacing of 0.2 mm, and the lowest surface roughness values were also observed at this spacing (Section 3.2). Moreover, 0.1 mm line spacing also showed low values for these parameters with increase in ironing flow and speed. However, the ironing line spacing of 0.3 mm at high ironing flow and speed should be avoided for ABS. High ironing speeds also result in higher valley measurements due to the material being deposited too quickly. On the other hand, ASA also showed higher valley measurements at high speeds for all ironing line spacings. It also showed lower values for all three parameters in line with the lowest surface roughness values that were obtained at the ironing line spacing of 0.1 mm (Section 3.2). The un-ironed samples of ABS and ASA showed higher peak and core values as well.
The material ratio assessment (Mr1 and Mr2) for ABS and ASA is shown in Figure 7. It corresponds to the upper and lower limit position of the roughness core. It is clear from Figure 7a that Mr1 showed comparatively smaller material portion with less than 20% for all the ironing parameter combinations (except for a few over 20% with high ironing speeds) of ABS, whereas Mr2 showed large material portions of more than 80% (except for S19 and S20). These results indicate that ABS exhibited approximately ~20% flat peaks over roughly ~80% steep valleys. The material ratio assessment for ASA (Figure 7b) showed several samples with over 20% Mr1 (at high ironing speeds). Mr2 was more consistent, with all the samples above 80%, implying that ASA samples were more adversely affected for their peak values as opposed to the valleys.

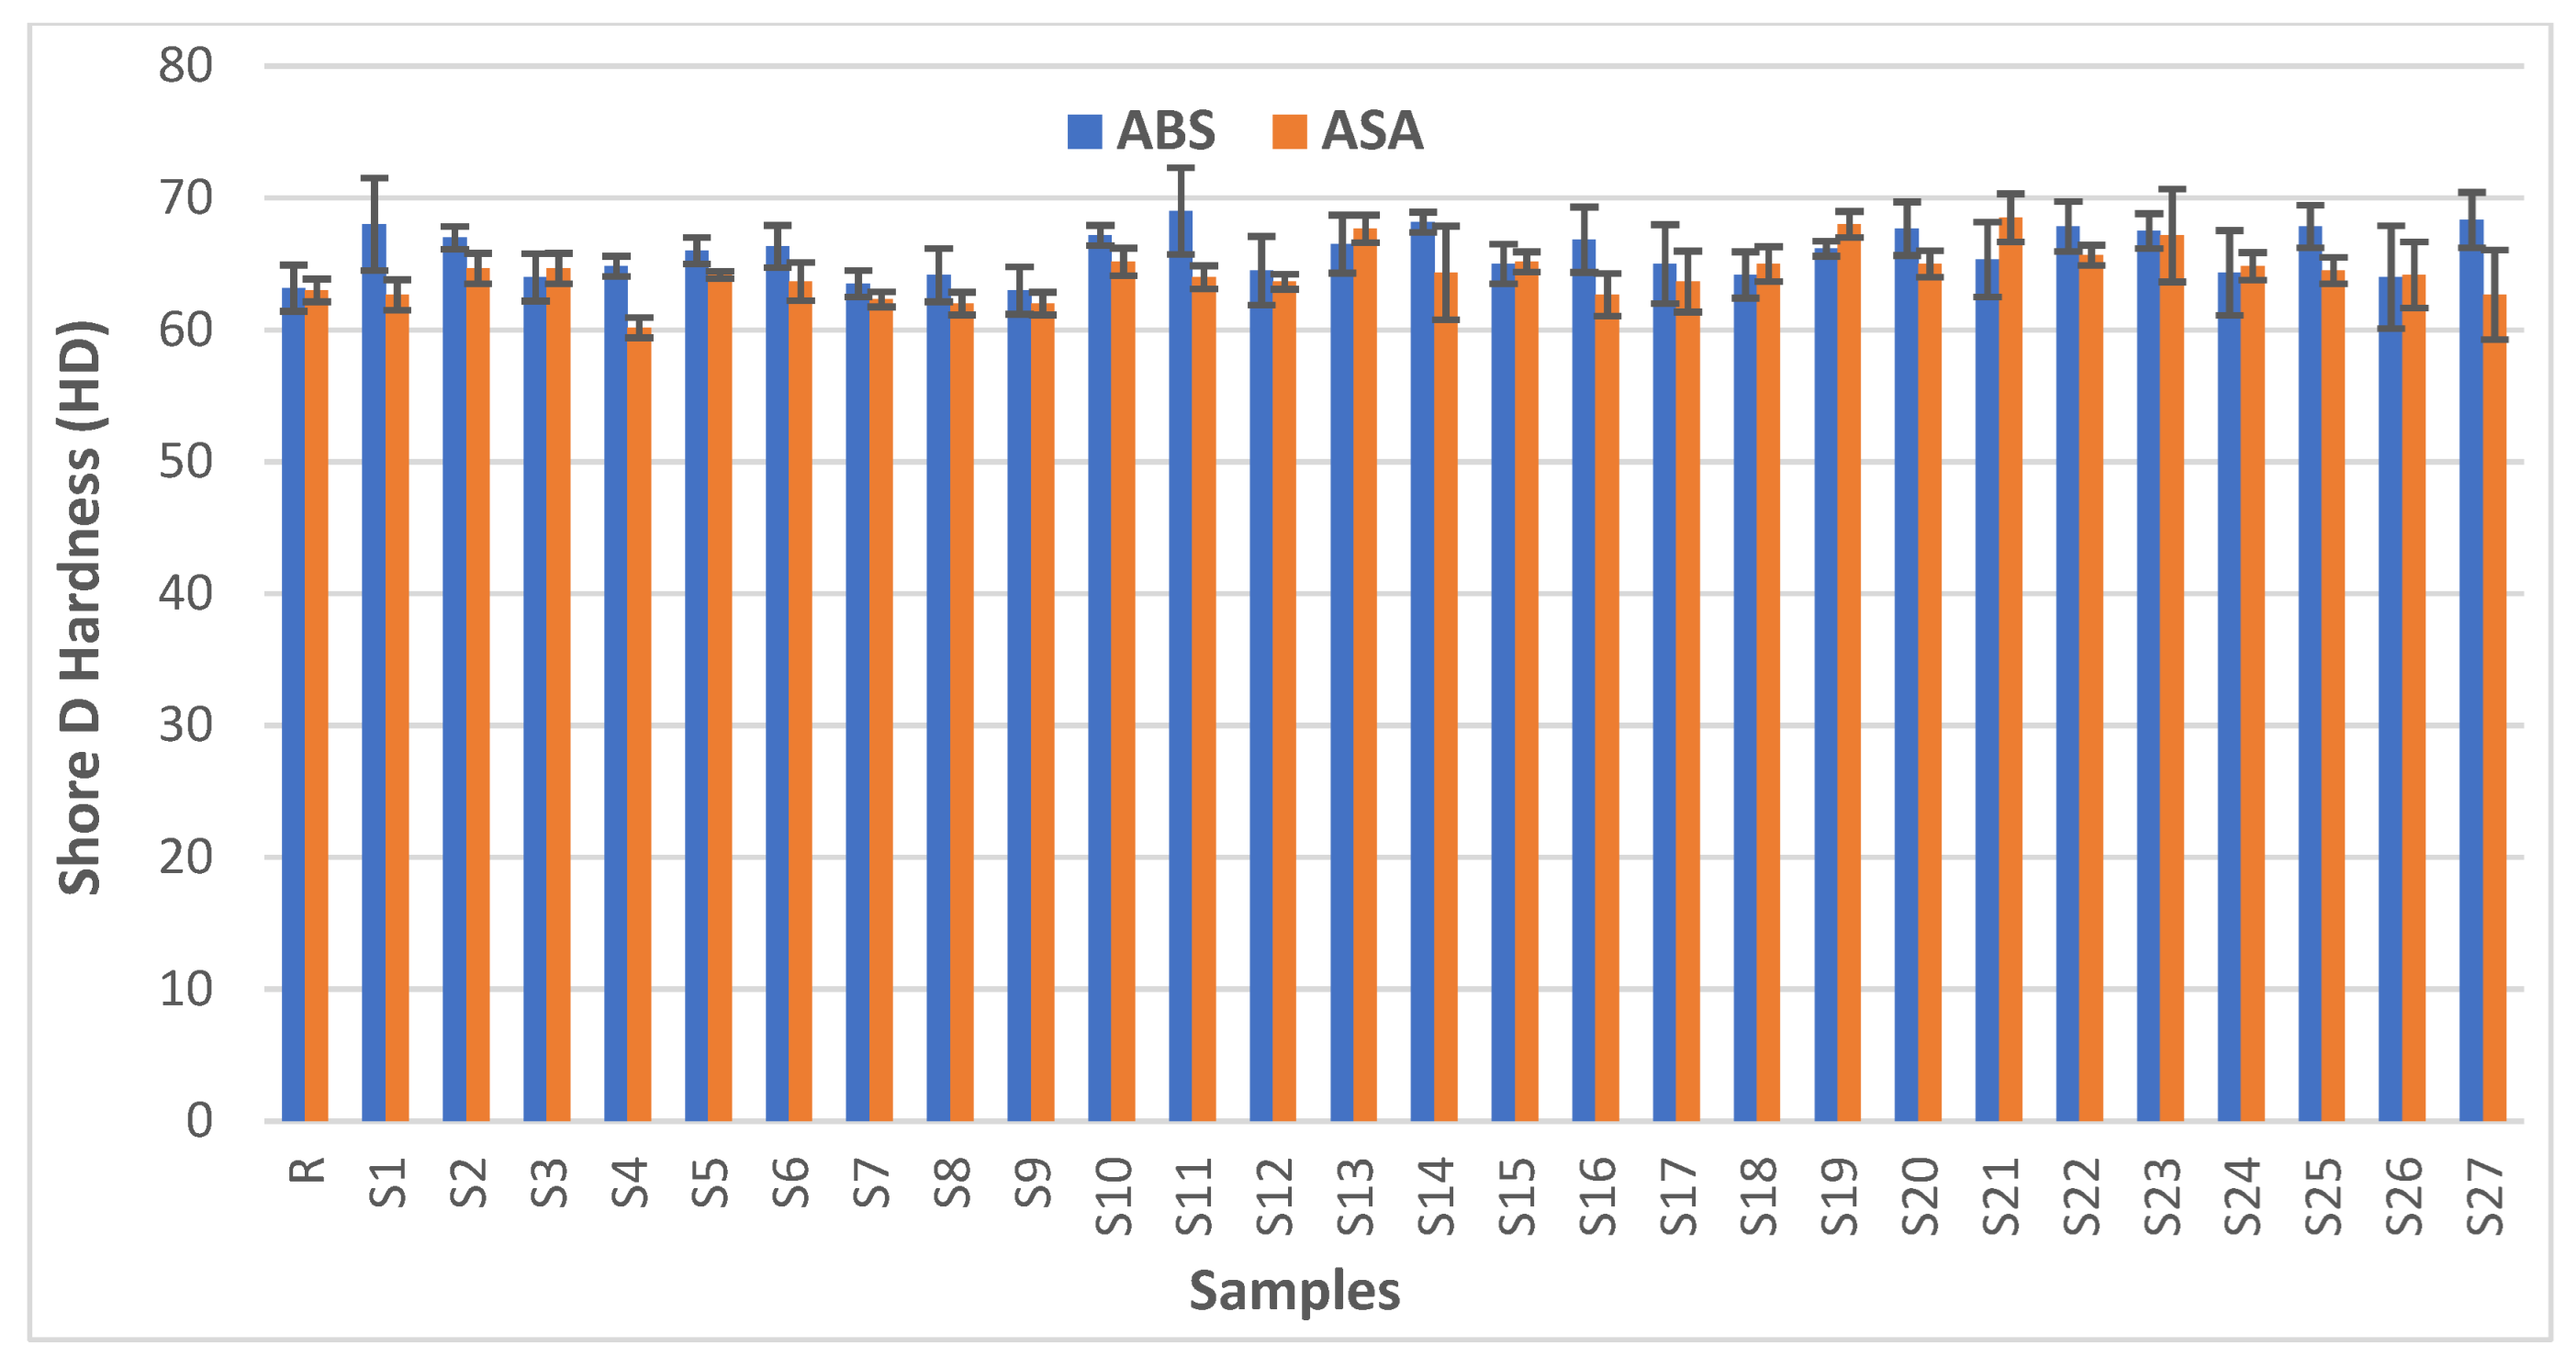
3.3. Hardness Testing

After surface analysis, the square samples were subjected to indentation Shore D hardness testing. The results are shown in Figure 8. It is clear that ABS had higher hardness values compared to ASA. However, the average results of the three different ironing line spacings indicate that the hardness values for both materials were similar. The lowest average hardness values were observed at the lower ironing line spacing of 0.1 mm, whereas the highest were obtained at 0.3 mm. This is to be expected, as more material packed will result in more resistance to the applied force. Furthermore, the higher hardness values were observed at higher ironing speeds, with ironing flow not significantly affecting the results. The highest hardness value for ABS was observed for S27, which had the highest ironing parameter values, whereas S21 provided the highest value for ASA with the highest line spacing and speed, but lower ironing flow. These results align with the surface roughness values as a better surface finish (low surface roughness values) lead to lower hardness values. This is because good surface finish (smooth surface with little excessive material) does not provide an appropriate reaction force and result in lower hardness values. It should also be noted that the difference in hardness values between the reference samples and the highest values of the ABS as well as ASA samples was small. This indicates that, even though slightly higher hardness values were observed for ironed ABS and ASA samples, the main impact of ironing is a significant improvement in surface roughness (as discussed in Section 3.2), and not the hardness of a sample.

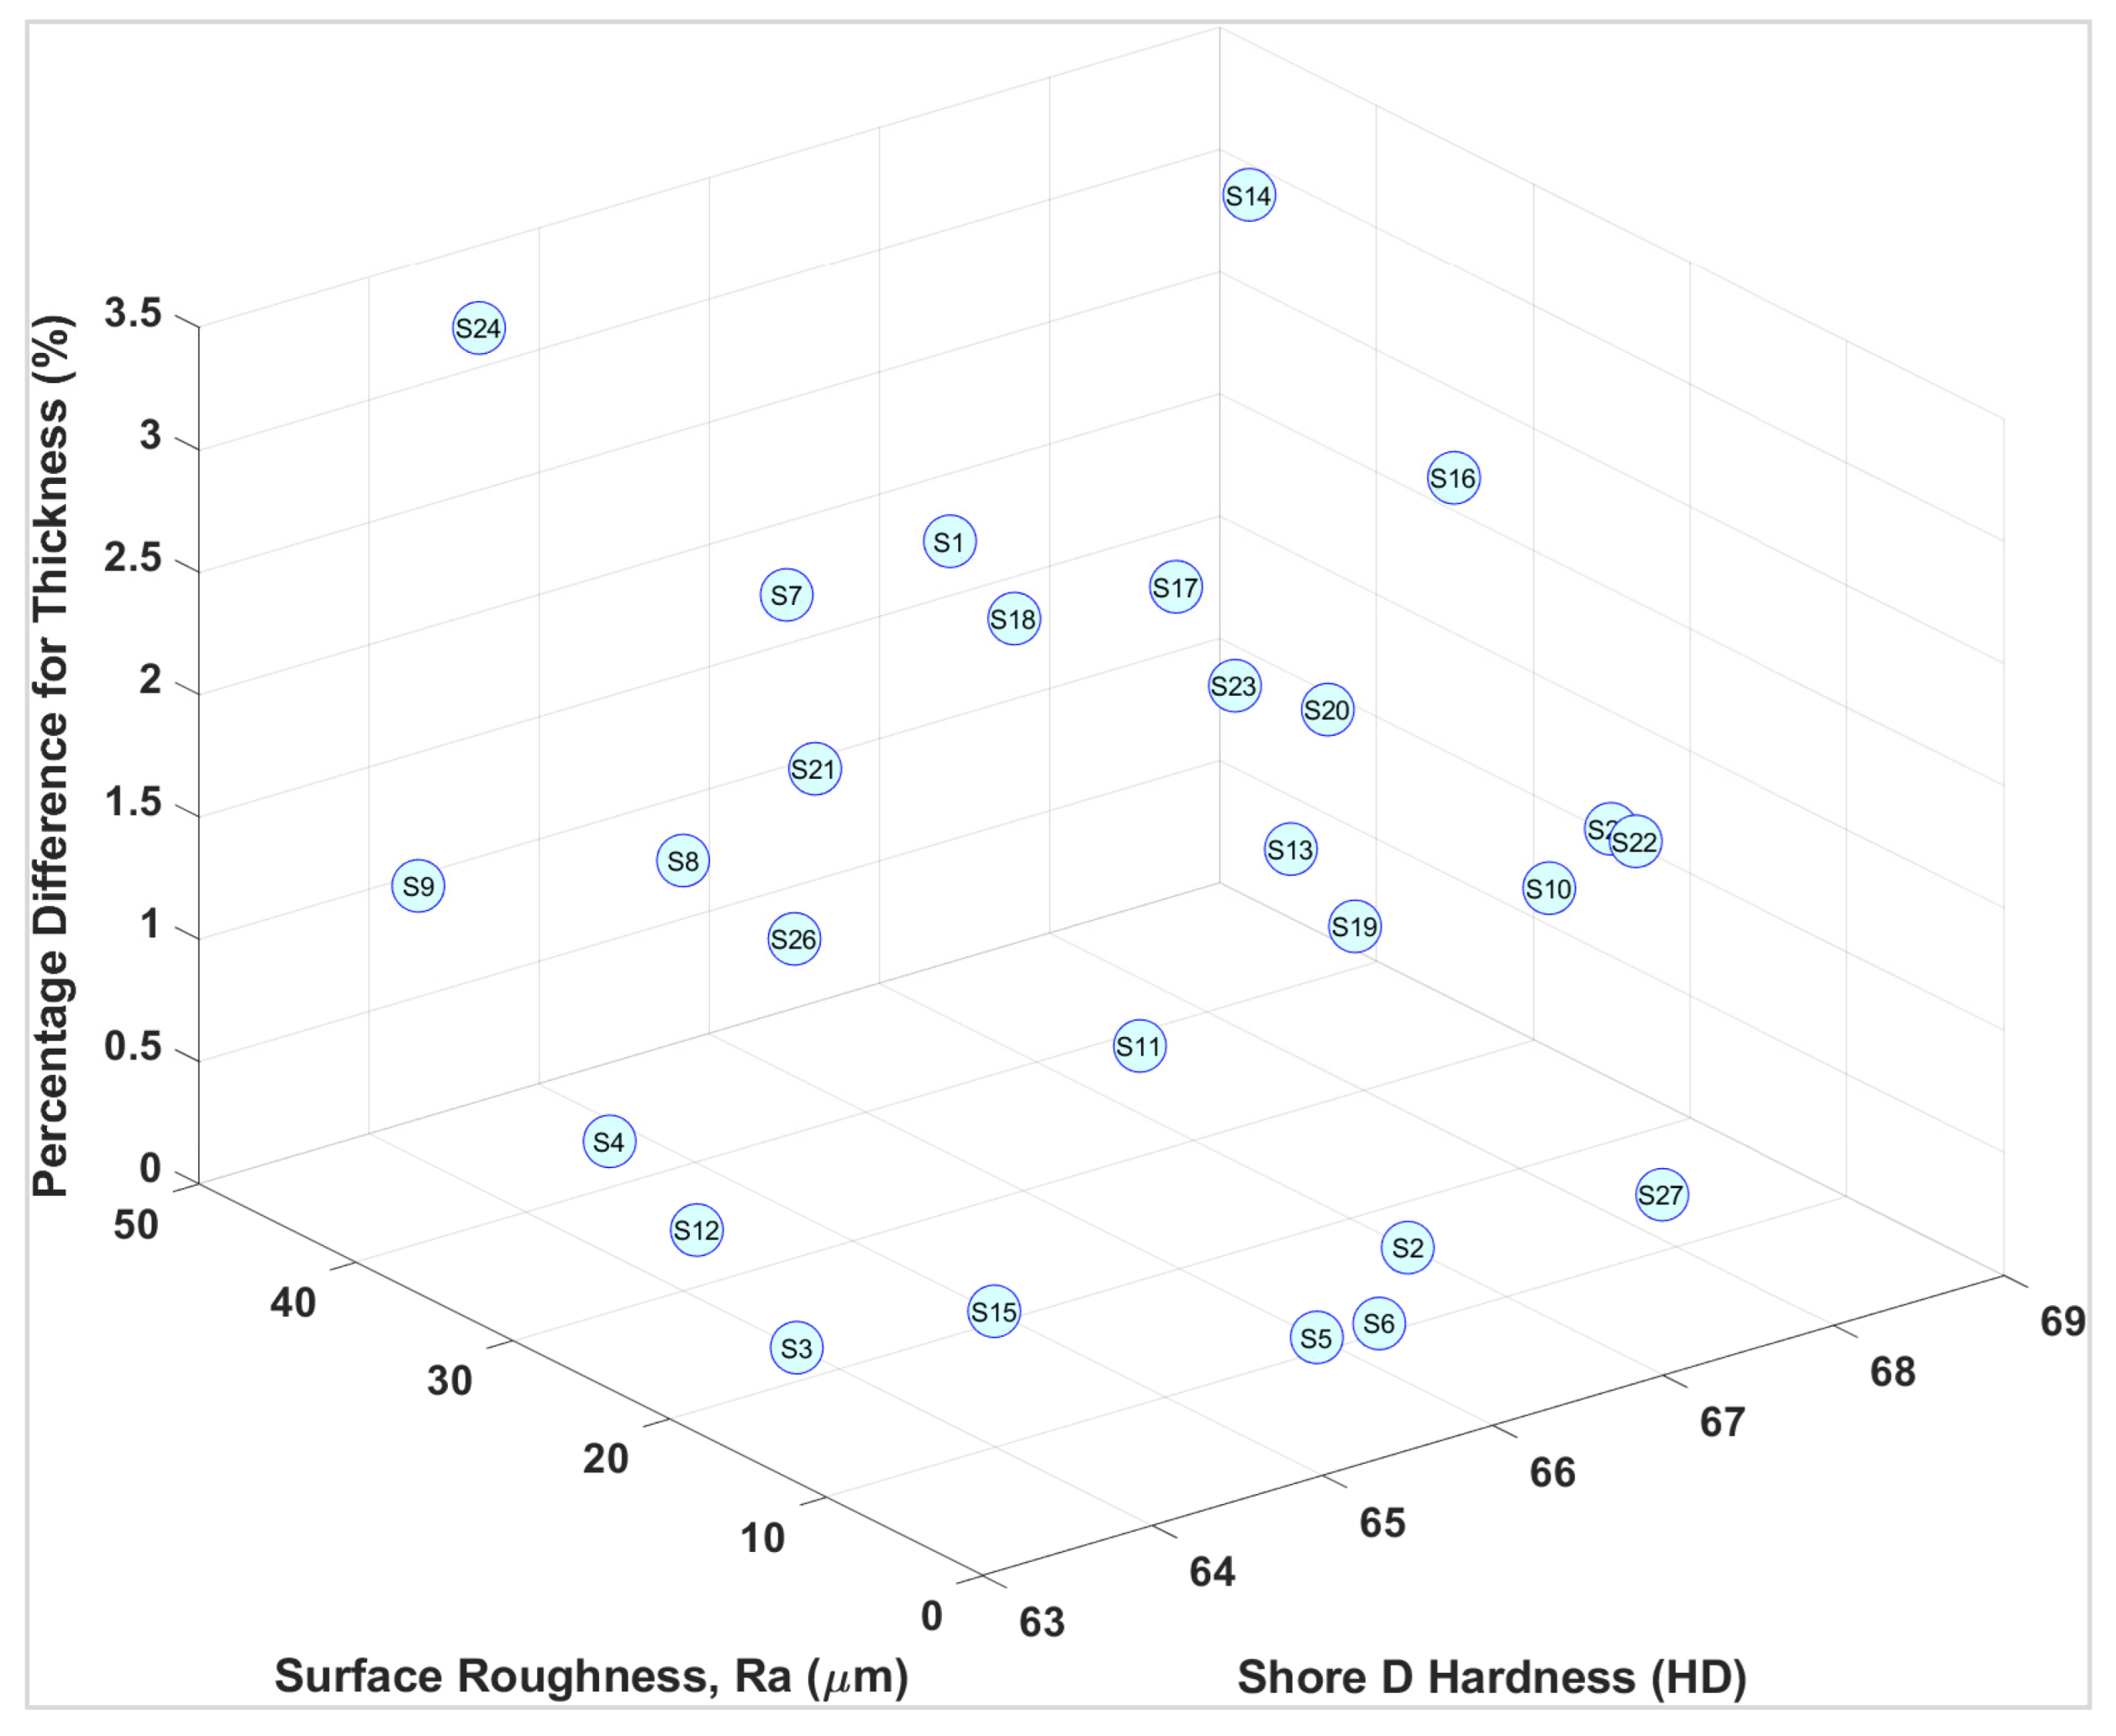
4. Material Quality Characterization

This work focuses on analysing the effects of different ironing parameters on two FFF-printed amorphous materials, i.e., ABS and ASA. While ironing improves the surface finish, there are trade-offs that should be made with printing time and product thickness due to the additional pass of the nozzle over the top layer and the addition of extra material. Section 3.2 demonstrated significant improvements in the surface finish for different ironed samples as opposed to un-ironed samples. Furthermore, hardness values also slightly increased as a result of manipulating the ironing parameters, as discussed in Section 3.3. This research has helped in gaining a better understanding of ironing parameters and their effect on dimensional accuracy, surface roughness, and the hardness of ABS and ASA materials. These results can be used to identify the optimal combination of ironing processing parameters based on a defined criteria. For example, if a product made out of ABS is needed with a surface roughness of less than 13 μm and a hardness value of over 66 HD, with minimal deviation along the Z-axis (thickness), then the three-axis plot in Figure 9 can help in identifying the optimal combination of ironing parameters. Several combinations can fulfil the criteria for surface roughness and hardness (S6, S10, S16, S19, S22, S25), but only one sample fulfils all the three criteria, i.e., S6 with a surface roughness value of 10.88 μm, hardness value of 66.33 HD, and no variations along the Z-axis (thickness). The same procedure can be used for ASA parts using the three-axis plot in Figure 10.

5. Conclusions

Ironing is a useful feature that can smooth out the top layer of FFF-printed parts. However, it is still considered to be new and experimental. This study shows how ironing parameters, i.e., line spacing, flow, and speed, can be manipulated to achieve better results. Three different values for the three ironing parameters were used to demonstrate their impact on the dimensional accuracy, surface texture, and hardness of FFF-printed ABS and ASA materials. Both ABS and ASA showed small changes along their length and width, as these dimensions are not affected by ironing. The addition of material to the top layer during ironing can increase the thickness of the samples; this was observed for ABS in line with the increase in the ironing line spacing and flow, but not for ASA, which showed lower thickness values (compared to the CAD file) upon the increase in ironing line spacing. This indicates that ASA was more adversely affected by the changes in ironing parameters than ABS.
Surface roughness analysis is critical, as the management of this parameter is the primary reason for using ironing. A significant improvement in the ABS and ASA samples was clearly shown, compared to the un-ironed samples. The un-ironed sample for ABS showed an average surface roughness (Ra) value of 30.405 μm, and the lowest value for an ironed sample was observed as 9.083 μm (S10), which is a reduction of 234%. The ironing line spacing of 0.2 mm and higher ironing flow at lower speeds were effective in ensuring a smoother surface finish for ABS. On the other hand, un-ironed ASA showed an average surface roughness value of 34.917 μm, and the lowest value for an ironed sample was observed as 9.721 μm (S2), which is a reduction of 259%. The ironing line spacing of 0.1 mm with a lower ironing flow with higher speeds showed good results for ASA. For the surface profile ratio (Rq/Ra), ABS showed consistent values for all ironing line spacings, whereas ASA showed higher values with an increase in line spacing.
In terms of skewness (Rsk), the ironing line spacing of 0.1 mm showed a positive skew for ABS, whereas the remaining two line spacings showed some combinations with negative skews at lower ironing flows and speeds. ASA also showed a high positive skew with only one moderately negative skew being observed with the ironing line spacing of 0.1 mm, and three being observed with the remaining two line spacings. For the kurtosis (Rku) of ABS, as the ironing speed and flow increased for the line spacing of 0.1 mm, the distribution switched from leptokurtic to either platykurtic or mesokurtic. The line spacing of 0.2 mm started and ended with leptokurtic distribution, with most of the combinations showing platykurtic distribution. On the other hand, the line spacing of 0.3 mm switched from platykurtic to either platykurtic or mesokurtic distribution upon an increase in ironing speed and flow. For the kurtosis (Rku) of ASA, the ironing line spacing of 0.1 mm and 0.2 mm showed a mix of all three distributions, whereas the 0.3 mm line spacing switched from leptokurtic to platykurtic distribution at the maximum ironing speed before switching back to leptokurtic for all the combinations (except for S27). With regard to Rk, Rpk and Rvk characterization for both materials, an agreement was observed with the Ra values. The ironing line spacing of 0.2 mm for ABS and 0.1 mm for ASA showed the lowest Ra values as well as Rk, Rpk and Rvk values. Mr1 showed tiny material portions of less than 20% flat peaks for the majority of the ironing parameter combinations (with a few exceptions at high ironing speeds), whereas Mr2 showed considerable material portions of more than 80% steep valleys for both ABS (except for S19 and S20) and ASA.
The hardness value for the un-ironed ABS sample was 63.16 HD, and the highest value for the ironed sample was 68.33 HD for S27. For the un-ironed ASA, a hardness value of 62.51 HD was observed, and the highest ironed sample showed 67.66 HD for S21. In both cases, an increase of approximately 8.2% was observed, but with different ironing parameters. These results show a clear focus on enhancing the aesthetics and surface finish as opposed to the hardness of the two materials used. It has been demonstrated that manipulating the ironing parameters can lead to better surface finish and slightly higher hardness numbers. The only two drawbacks of ironing are slightly higher processing times and the fact that the process is only suitable for flat surfaces. However, the results presented in this work can help designers and manufacturers in leveraging the ironing parameters for amorphous materials to achieve desirable results.

Author Contributions

Conceptualization, J.B.; methodology, J.B.; validation J.B.; formal analysis J.B. and R.B.; investigation, J.B. and R.B.; resources, J.B, R.B. and V.M.; data curation, J.B., R.B. and V.M.; writing—original draft preparation, J.B.; writing—review and editing, J.B.; visualization, J.B. and R.B.; project administration, J.B., R.B. and V.M. All authors have read and agreed to the published version of the manuscript.

Funding

This research did not receive any external funding.

Data Availability Statement

The data used in this research work can be made available upon request.

Conflicts of Interest

The authors declare no conflict of interest.

References

  1. Gomes, T.E.; Cadete, M.S.; Dias-de-Oliveira, J.; Neto, V. Controlling the properties of parts 3D printed from recycled thermoplastics: A review of current practices. Polym. Degrad. Stab. 2022, 196, 109850. [Google Scholar] [CrossRef]
  2. Butt, J.; Shirvani, H. Additive, subtractive, and hybrid manufacturing processes. In Advances in Manufacturing and Processing of Materials and Structures; CRC Press: Boca Raton, FL, USA, 2018; pp. 187–218. [Google Scholar]
  3. Gardner, J.M.; Stelter, C.J.; Sauti, G.; Kim, J.W.; Yashin, E.A.; Wincheski, R.A.; Schniepp, H.C.; Siochi, E.J. Environment control in additive manufacturing of high-performance thermoplastics. Int. J. Adv. Manuf. Technol. 2022, 119, 6423–6433. [Google Scholar] [CrossRef]
  4. Gao, J. Production of multiple material parts using a desktop 3D printer. In Advances in Manufacturing Technology XXXI. In Proceedings of the 15th International Conference on Manufacturing Research, Incorporating the 32nd National Conference on Manufacturing Research, University of Greenwich, London, UK, 5–7 September 2017; IOS Press: Amsterdam, The Netherlands, 2017; Volume 6, p. 148. [Google Scholar]
  5. Butt, J.; Oxford, P.; Sadeghi-Esfahlani, S.; Ghorabian, M.; Shirvani, H. Hybrid Manufacturing and Mechanical Characterization of Cu/PLA Composites. Arab. J. Sci. Eng. 2020, 45, 9339–9356. [Google Scholar] [CrossRef]
  6. Syrlybayev, D.; Zharylkassyn, B.; Seisekulova, A.; Akhmetov, M.; Perveen, A.; Talamona, D. Optimisation of strength properties of FDM printed parts—A critical review. Polymers 2021, 13, 1587. [Google Scholar] [CrossRef]
  7. Vanaei, H.; Shirinbayan, M.; Deligant, M.; Raissi, K.; Fitoussi, J.; Khelladi, S.; Tcharkhtchi, A. Influence of process parameters on thermal and mechanical properties of polylactic acid fabricated by fused filament fabrication. Polym. Eng. Sci. 2020, 60, 1822–1831. [Google Scholar] [CrossRef]
  8. Buj-Corral, I.; Domínguez-Fernández, A.; Durán-Llucià, R. Influence of print orientation on surface roughness in fused deposition modeling (FDM) processes. Materials 2019, 12, 3834. [Google Scholar] [CrossRef] [Green Version]
  9. Butt, J.; Bhaskar, R.; Mohaghegh, V. Investigating the effects of extrusion temperatures and material extrusion rates on FFF-printed thermoplastics. Int. J. Adv. Manuf. Technol. 2021, 117, 2679–2699. [Google Scholar] [CrossRef]
  10. Nguyen, V.H.; Huynh, T.N.; Nguyen, T.P.; Tran, T.T. Single and multi-objective optimization of processing parameters for fused deposition modeling in 3D printing technology. Int. J. Automot. Mech. Eng. 2020, 17, 7542–7551. [Google Scholar] [CrossRef] [Green Version]
  11. Nuñez, P.J.; Rivas, A.; García-Plaza, E.; Beamud, E.; Sanz-Lobera, A. Dimensional and surface texture characterization in fused deposition modelling (FDM) with ABS plus. Procedia Eng. 2015, 132, 856–863. [Google Scholar] [CrossRef]
  12. Vyavahare, S.; Kumar, S.; Panghal, D. Experimental study of surface roughness, dimensional accuracy and time of fabrication of parts produced by fused deposition modelling. Rapid Prototyp. J. 2020, 26, 1535–1554. [Google Scholar] [CrossRef]
  13. Pramanik, D.; Mandal, A.; Kuar, A.S. An experimental investigation on improvement of surface roughness of ABS on fused deposition modelling process. Mater. Today Proc. 2020, 26, 860–863. [Google Scholar] [CrossRef]
  14. Khan, M.S.; Mishra, S.B. Minimizing surface roughness of ABS-FDM build parts: An experimental approach. Mater. Today Proc. 2020, 26, 1557–1566. [Google Scholar] [CrossRef]
  15. Chohan, J.S.; Singh, R.; Boparai, K.S. Mathematical modelling of surface roughness for vapour processing of ABS parts fabricated with fused deposition modelling. J. Manuf. Processes 2016, 24, 161–169. [Google Scholar] [CrossRef]
  16. Camposeco-Negrete, C. Optimization of printing parameters in fused deposition modeling for improving part quality and process sustainability. Int. J. Adv. Manuf. Technol. 2020, 108, 2131–2147. [Google Scholar] [CrossRef]
  17. Kumar, S.R.; Sridhar, S.; Venkatraman, R.; Venkatesan, M. Polymer additive manufacturing of ASA structure: Influence of printing parameters on mechanical properties. Mater. Today Proc. 2021, 39, 1316–1319. [Google Scholar] [CrossRef]
  18. Barreno-Avila, A.F.; Monar-Naranjo, M.; Barreno-Avila, E.M. Fusion deposition modeling (FDM) 3D printing parameters correlation: An analysis of different polymers surface roughness. In IOP Conference Series: Materials Science and Engineering; IOP Publishing: Bandar Lampung, Indonesia, 2021; Volume 1173, p. 012071. [Google Scholar]
  19. El Magri, A.; Ouassil, S.E.; Vaudreuil, S. Effects of printing parameters on the tensile behavior of 3D-printed acrylonitrile styrene acrylate (ASA) material in Z direction. Polym. Eng. Sci. 2022, 62, 848–860. [Google Scholar] [CrossRef]
  20. Martínez, J.M.V.; Vega, D.P.; Salguero, J.; Batista, M. Evaluation of the printing strategies design on the mechanical and tribological response of acrylonitrile styrene acrylate (ASA) additive manufacturing parts. Rapid Prototyp. J. 2021, 28, 479–489. [Google Scholar] [CrossRef]
  21. Butt, J.; Bhaskar, R. Investigating the effects of annealing on the mechanical properties of FFF-printed thermoplastics. J. Manuf. Mater. Processing 2020, 4, 38. [Google Scholar] [CrossRef]
  22. 3D FilaPrint. Available online: https://shop.3dfilaprint.com/abs-extrafill-sky-blue-175mm-3d-printer-filament-8226-p.asp (accessed on 26 March 2022).
  23. 3D FilaPrint. Available online: https://shop.3dfilaprint.com/asa-extrafill-white-aluminium-175mm-3d-filaprint-filament-15408-p.asp (accessed on 26 March 2022).
  24. Alsoufi, M.S.; Elsayed, A.E. Surface roughness quality and dimensional accuracy—A comprehensive analysis of 100% infill printed parts fabricated by a personal/desktop cost-effective FDM 3D printer. Mater. Sci. Appl. 2018, 9, 11–40. [Google Scholar] [CrossRef] [Green Version]
  25. Ultimaker Cura: Advanced 3D Printing Software, Made Accessible. Available online: https://ultimaker.com/en/products/ultimaker-cura-software (accessed on 26 March 2022).
  26. Mitutoyo: Surftest SJ-210 [inch/mm]. Available online: https://www.mitutoyo.com/wp-content/uploads/2016/09/J-section-Surftest.pdf (accessed on 26 March 2022).
  27. ISO 291:2008; Plastics—Standard Atmospheres for Conditioning and Testing. British, European and International Standard: London, UK, 2015.
  28. ISO 4287:1997; Geometrical Product Specifications (GPS)—Surface Texture: Profile Method—Terms, Definitions and Surface Texture Parameters. British, European and International Standard: London, UK, 2015.
  29. ISO 13565-2:1996; Geometrical Product Specifications (GPS)—Surface Texture: Profile Method; Surfaces Having Stratified Functional Properties—Part 2: Height Characterization Using the Linear Material Ratio Curve. British, European and International Standard: London, UK, 2012.
  30. Dong, W.P.; Sullivan, P.J.; Stout, K.J. Comprehensive study of parameters for characterizing three-dimensional surface topography I: Some inherent properties of parameter variation. Wear 1992, 159, 161–171. [Google Scholar] [CrossRef]
  31. Dong, W.P.; Sullivan, P.J.; Stout, K.J. Comprehensive study of parameters for characterizing three-dimensional surface topography II: Statistical properties of parameter variation. Wear 1993, 167, 9–21. [Google Scholar] [CrossRef]
  32. Dong, W.P.; Sullivan, P.J.; Stout, K.J. Comprehensive study of parameters for characterising three-dimensional surface topography: III: Parameters for characterising amplitude and some functional properties. Wear 1994, 178, 29–43. [Google Scholar] [CrossRef]
  33. Dong, W.P.; Sullivan, P.J.; Stout, K.J. Comprehensive study of parameters for characterising three-dimensional surface topography: IV: Parameters for characterising spatial and hybrid properties. Wear 1994, 178, 45–60. [Google Scholar] [CrossRef]
  34. Thomas, T.R. Characterization of surface roughness. Precis. Eng. 1981, 3, 97–104. [Google Scholar] [CrossRef]
  35. BS EN ISO 868:2003; Plastics and Ebonite–Determination of Indentation Hardness by Means of a Durometer (Shore Hardness). British, European and International Standard: London, UK, 2018.
  36. Alsoufi, M.S.; Elsayed, A.E. Quantitative analysis of 0% infill density surface profile of printed part fabricated by personal FDM 3D printer. Int. J. Eng. Technol. 2018, 7, 44–52. [Google Scholar] [CrossRef] [Green Version]
Figure 1. Percentage change for the dimensional analysis of ABS and ASA: (a) along X-axis; (b) along Y-axis; (c) along Z-axis.
Jcs 06 00121 g001aJcs 06 00121 g001b
Figure 2. Surface roughness measurements.
Jcs 06 00121 g002
Figure 3. Two-dimensional surface profile ratio.
Jcs 06 00121 g003
Figure 4. Skewness plots.
Jcs 06 00121 g004
Figure 5. Kurtosis plots.
Jcs 06 00121 g005
Figure 6. Rk, Rpk and Rvk assessment: (a) ABS material; (b) ASA material.
Jcs 06 00121 g006
Figure 7. Material ratio assessment: (a) ABS material; (b) ASA material.
Jcs 06 00121 g007aJcs 06 00121 g007b
Figure 8. Hardness testing results.
Jcs 06 00121 g008
Figure 9. Three-axis plot for ABS material.
Jcs 06 00121 g009
Figure 10. Three-axis plot for ASA material.
Jcs 06 00121 g010
Table 1. Process parameters for ABS and ASA.
#ParametersDescription
1Infill density (%)100
2Infill patternLines
3Layer height (mm)0.2
4Nozzle size (mm)0.4
5Flow (%)100
6Extrusion temperature (°C)240 for ABS and 250 for ASA
7Print bed temperature (°C)95 for ABS and 100 for ASA
8Deposition speed (mm/s)50
9Fan speed (%)100
Table 2. Ironing parameters (R = reference; L = ironing line spacing; F = ironing flow; S = ironing speed).
SamplesParametersTimeSamplesParametersTime
RNo ironing1 h 24 minS140.2 L, 20 F, 100 S1 h 26 min
S10.1 L, 10 F, 50 S1 h 30 minS150.2 L, 20 F, 150 S1 h 26 min
S20.1 L, 10 F, 100 S1 h 28 minS160.2 L, 30 F, 50 S1 h 27 min
S30.1 L, 10 F, 150 S1 h 28 minS170.2 L, 30 F, 100 S1 h 26 min
S40.1 L, 20 F, 50 S1 h 30 minS180.2 L, 30 F, 150 S1 h 26 min
S50.1 L, 20 F, 100 S1 h 28 minS190.3 L, 10 F, 50 S1 h 26 min
S60.1 L, 20 F, 150 S1 h 28 minS200.3 L, 10 F, 100 S1 h 25 min
S70.1 L, 30 F, 50 S1 h 30 minS210.3 L, 10 F, 150 S1 h 25 min
S80.1 L, 30 F, 100 S1 h 28 minS220.3 L, 20 F, 50 S1 h 26 min
S90.1 L, 30 F, 150 S1 h 28 minS230.3 L, 20 F, 100 S1 h 25 min
S100.2 L, 10 F, 50 S1 h 27 minS240.3 L, 20 F, 150 S1 h 25 min
S110.2 L, 10 F, 100 S1 h 26 minS250.3 L, 30 F, 50 S1 h 26 min
S120.2 L, 10 F, 150 S1 h 26 minS260.3 L, 30 F, 100 S1 h 25 min
Publisher’s Note: MDPI stays neutral with regard to jurisdictional claims in published maps and institutional affiliations.

