
Aluminum Nanocomposites Reinforced with Al2O3 Nanoparticles: Synthesis, Structure, and Properties

1
Department of Metallurgical and Materials Engineering, Faculty of Engineering, University of Porto, Rua Doutor Roberto Frias, 4200-465 Porto, Portugal
2
LAETA/INEGI-Institute of Science and Innovation in Mechanical and Industrial Engineering, Rua Doutor Roberto Frias, 4200-465 Porto, Portugal
*
Author to whom correspondence should be addressed.
J. Compos. Sci. 2024, 8(1), 33; https://0-doi-org.brum.beds.ac.uk/10.3390/jcs8010033
Submission received: 21 December 2023
/
Revised: 4 January 2024
/
Accepted: 15 January 2024
/
Published: 17 January 2024
(This article belongs to the Special Issue Particulate Aluminum Matrix Composites: From Fundamentals to Applications, Volume II)
Abstract
:This work comprehensively investigates the production and characterization of an innovative nanocomposite material and an aluminum matrix reinforced with Al2O3 nanoparticles. The powder metallurgy route was used to produce the nanocomposite, and subsequent microstructural and mechanical characterizations were conducted to evaluate its performance. The nanoparticles and metal powders were dispersed and mixed using ultrasonication, followed by cold pressing and sintering. The results indicated that dispersion using isopropanol made it possible to obtain nanocomposites efficiently through powder metallurgy with a high density and an 88% increase in hardness compared to the Al matrix. The process led to the production of nanocomposites with high densification if the volume fraction of the reinforcement did not exceed 1.0 wt.% of Al2O3. The volume fraction of the reinforcement plays an essential role in the microstructure and mechanical properties of the composite because as it increases to values above 1.0 wt.%, it becomes more difficult to disperse through ultrasonication, which results in less promising results. The addition of Al2O3 significantly affects the Al matrix’s microstructure, which influences the mechanical properties. However, this new approach is proving effective in producing Al matrix nanocomposites with high mechanical properties.
1. Introduction
In recent decades, the research for advanced materials with customized properties has led to the emergence of nanocomposites as a revolutionary class of materials. Among these, nanoparticle-reinforced aluminum matrix nanocomposites have attracted significant attention due to their potential to revolutionize various industries, particularly aerospace, automotive, and structural applications. Integrating nanoscale reinforcements, such as ceramic nanoparticles, into an aluminum matrix offers a unique synergy, combining aluminum’s inherent characteristics of a light weight and resistance to corrosion with the improved mechanical and thermal properties conferred by nanoparticles [1,2].
Aluminum matrix nanocomposites are attractive due to the ongoing demand for materials with higher strength-to-weight ratios, better mechanical performance, and greater functionality [3,4,5,6]. Traditional aluminum alloys have reached their inherent limits, and as industries strive for more efficient and lighter structures, nanocomposites present a promising solution to overcome these limitations.
The use of nanoparticles as a reinforcing material is crucial to the success of these nanocomposites. The nanometric scale of these reinforcements makes it possible to obtain advanced materials with unique properties. Commonly used materials include oxides such as alumina (Al2O3), carbides, nitrides, and other ceramics due to their exceptional hardness, high thermal stability, and resistance to wear [4,6,7]. Integrating these nanoparticles at the nanoscale gives unique properties to the aluminum matrix, creating a material that has improved strength, hardness, and thermal resistance compared to conventional aluminum alloys. Incorporating nanoparticles into the aluminum matrix allows tailoring specific properties to meet application-specific requirements. Enhanced mechanical strength, improved wear resistance, and superior thermal conductivity are among the notable benefits that make these nanocomposites attractive for a wide range of engineering applications.
One of the most promising areas for applying nanocomposites is in the aerospace industry. The demand for lightweight yet robust materials in aircraft and spacecraft components has spurred research into nanocomposites to achieve a balance between structural integrity and weight reduction [2,8,9,10].
Various processing techniques were explored to obtain a homogeneous dispersion of the nanoparticles in the aluminum matrix [3,4,6,11,12,13,14,15]. Stir casting is one of the most popular methods to produce metal matrix composites [13], as the apex has been used to create a good distribution of the reinforcing material in the matrix and has been known as an up-and-coming method for manufacturing the desired shape at minimal cost, with a more incredible bond between the matrix and the particles that are being added. However, when the reinforcement is on the nanometric scale, this process presents challenges in dispersing the reinforcing nanoparticles. Producing metal matrix nanocomposites reinforced with nanometric ceramic particles through powder metallurgy could effectively overcome dispersion problems [6,8,9,10,16]. Through techniques such as ball milling or ultrasonic dispersion followed by powder pressing, it is possible to obtain a uniform distribution of the nanoparticles, optimizing the synergistic effects between the aluminum matrix and the reinforcing material.
In addition to dispersion, other challenges must be overcome in producing metal matrix nanocomposites reinforced with ceramic nanoparticles to obtain the required mechanical properties. When the size of the reinforcement is reduced to the nanometric scale, there are problems with compaction or during sintering that lead to the formation of a nanocomposite with lower-than-expected properties. Razavi-Tousi et al. [6] investigated the effect of the alumina reinforcement volume fraction and particle size on the compaction and densification behavior of Al-Al2O3 nanocomposites. The dispersion and mixture were performed using high-energy milling, followed by cold pressing and sintering. The higher volume fraction of the alumina phase results in a smaller particle size of composite powders and a smaller inter-particle spacing that damages the sintering. When the aim is to produce Al nanocomposites reinforced with Al2O3, the most widely reported processes are powder metallurgy with high-energy milling or the friction stir process [4,5,6,17]. Still, during dispersion, there is a significant change in the powder particles, and the process time and reinforcement fraction significantly influence the compaction and sintering of the composite.
This work presents an approach for producing Al nanocomposites reinforced with Al2O3 nanoparticles to overcome the compaction and dispersion challenges usually presented in the literature. The nanocomposites are produced using powder metallurgy since it is a technique that allows a good relationship between properties and a good dispersion of nanometric reinforcements to be obtained. The effectiveness of the process was evaluated through the microstructural and mechanical characterization of the composites.
2. Materials and Methods
Aluminum powder (purity ≥ 99.5%, particle size ≤ 60 µm) was obtained from Goodfellow Cambridge Ltd. (Huntingdon, UK) for use as the matrix material. High-purity aluminum oxide (Al2O3) nanoparticles (average particle size ≤ 50 nm) were selected as the reinforcing phase. The as-received materials were characterized using scanning electron microscopy (SEM) with energy dispersive X-ray spectroscopy (EDS) and electron backscatter diffraction (EBSD) using FEI QUANTA 400 FEG equipment (Hillsboro, OR, USA) with an EDS from Oxford Instrument (Abingdon, Oxfordshire, UK) and an EBSD detector, the TSL-EDAX EBSD Unit (EDAX Inc. (Ametek), Mahwah, NJ, USA). Aluminum particles have already been intensively characterized in other works [18,19], where it has been observed that each particle has more than one grain and is characterized by surface deformation due to the manufacturing process they were subjected to.
The first step in the production of nanocomposites consists of dispersing the nanoparticles. This work selected a one-step dispersion and mixing process using ultrasonication. Various dispersion/mixing media (ethanol, isopropanol, and water) and various ultrasonication frequencies (12.0, 15.0, and 20.4 kHz) are based on previous work using other nanoparticles [11,18,19]. Table 1 shows the conditions tested in this work. The mixtures were filtered and dried. Cold compaction was carried out at 300 MPa and sintering at 640 °C for 90 min. These processing conditions were selected based on the best conditions obtained for Al/SiC and Al/CNT nanocomposites [11,18].
Archimedes’ principle was employed to measure the density of the sintered specimens, providing insights into the compaction and porosity levels. This method was performed in nanocomposites and Al powders under the same conditions for comparison.
A general characterization of the nanocomposites was performed using optical microscopy (OM) and digital microscopy (DM), where the percentage of pores and reinforcement agglomerates was evaluated. For this, an optical microscope with LAS X software was used. The equipment used for this characterization was an optical microscope, M 4000 M, with Leica Application Suite software (version 4.13.0, Leica Microsystems, Wetzlar, Germany). The microstructural characterization of the nanocomposites was also evaluated using SEM and analyzed with EDS and EBSD. Different EBSD maps were made to assess the effect of the reinforcement on the microstructure of the Al matrix.
Mechanical characterization was carried out using hardness. The hardness tests were carried out with a load of 98 N and with matrices with four columns and eight rows to evaluate the evolution of hardness with the addition of reinforcement. Hardness was also measured, considering 32 hardness values in each sample. The equipment used was a FALCON 400 micro/macro-Vickers hardness tester (INNOVATEST Europe BV, Maastricht, the Netherlands). The surface preparation for this test is essential; as it was a micrometer-scale test, the state of the surface can affect the measured values. The samples were polished to ensure the surface was clean and oxide-free.
3. Results
3.1. Al2O3 Nanoparticle Characterization
The characterization of Al2O3 particles is essential for the successful production of nanocomposites. Figure 1 displays images of received and dispersed Al2O3 particles.
Figure 1a shows that as-received particles are characterized by agglomeration. This agglomeration prevents the production of composites with excellent mechanical properties. For this reason, different dispersion conditions were investigated to reduce the aggregation of the nanoparticles. Various solutions of dispersion through ultrasonication and different frequencies were used. The best dispersion was obtained with isopropanol at 20.4 kHz for 15 min. Ethanol and water did not allow for good dispersion of the particles, and it was observed that they remained agglomerated initially. Isopropanol provided the best dispersion.
Regarding the frequency of the dispersion treatment, a better deagglomeration of the Al2O3 nanoparticles was observed as the frequency increased. Figure 1b shows in detail the significant effect of the dispersion treatment on these nanoparticles. Through scanning electron microscopy (SEM), microstructural characterization revealed a well-dispersed distribution of Al2O3 nanoparticles within the aluminum matrix. The images demonstrated a uniform distribution of the reinforcing phase, indicating successful incorporation during the powder metallurgy process. Figure 1c,d present magnified images demonstrating these nanoparticles’ nanometric size. The EDS spectrum presented in Figure 1e showed the chemical composition of these nanoparticles comprising Al2O3.
3.2. Nanocomposite Characterization
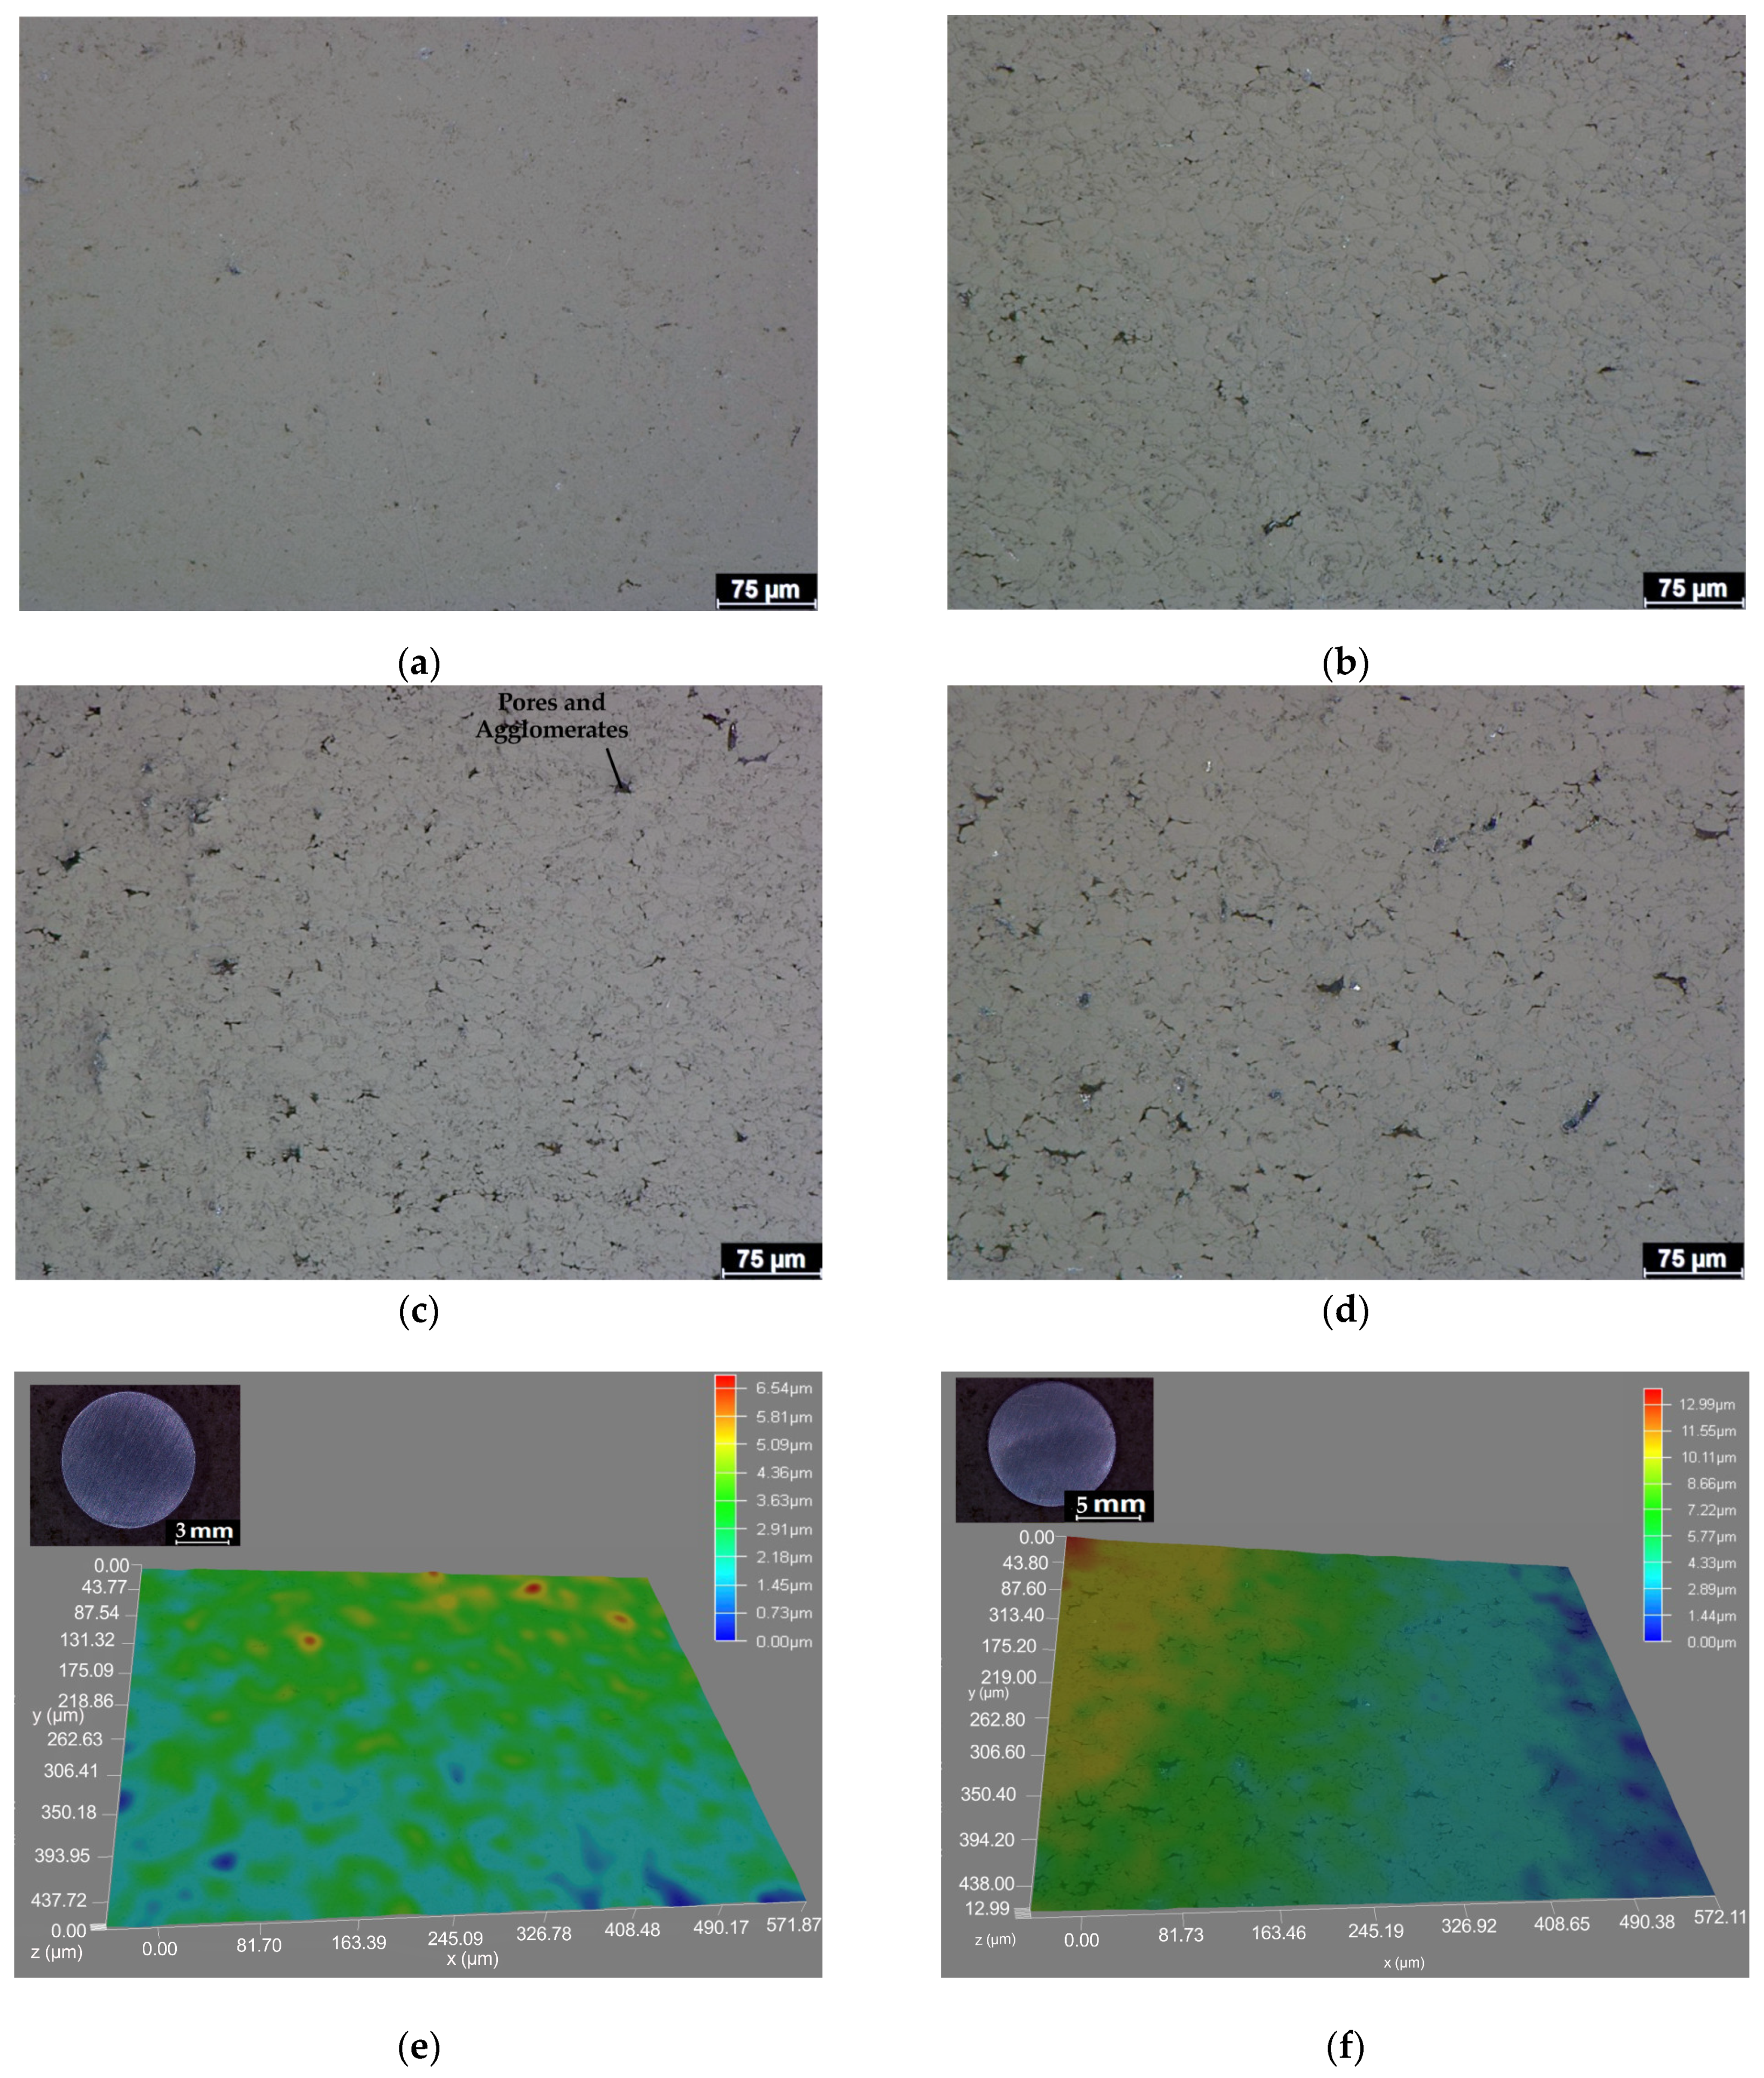
The production of nanocomposites proved to be effective through the powder metallurgy technique. In Figure 2, the optical and digital microscopy images are present and in Figure 3, the evolution of density and pores and agglomerates with a volume fraction of the reinforcement are present, where it is possible to see the differences between the Al matrix and the nanocomposites produced under the same conditions with different reinforcement volume fractions.
Based on these results, the Al matrix has some porosity, which is typical of the conventional production process, and represents 0.45%. When 0.5 wt.% of reinforcement is added, the microstructure consists of a dark phase in a light matrix. The dark phase can be associated with the addition of Al2O3. The percentage of pores does not increase significantly for this addition of reinforcement (from 0.45 for the matrix to 0.54% for the nanocomposite). When more than 0.5 wt.% of Al2O3 is added, more pores and agglomerates are observed in the nanocomposites. Through this analysis, it is impossible to separate the percentage of agglomerates of Al2O3 nanoparticles and pores; for this reason, this value is presented together for the nanocomposites. The value increases significantly when 1.5 wt.% of Al2O3 is added, which may be associated with an increase in reinforcement agglomerates. This increase is associated with worse dispersion and/or consolidation during sintering.
Regarding relative density, the values for all samples are high, with a slight decrease observed for nanocomposites with 1.5 wt.% reinforcement. The dispersion technique proved to be effective in producing these nanocomposites since it was possible to achieve uniform distribution of the nanoparticles, even though complete deagglomeration was not observed. It was also possible to see that the agglomerates that could not be destroyed were mainly located in pores. For additions of up to 1.0 wt.% of reinforcement, there are no significant differences in the densification of the composite, and the percentage of agglomerates is low, which may be a good indicator of the dispersion of the reinforcement. For nanocomposites with 1.5 wt.% reinforcement, the density is affected due to the high number of agglomerates, which affects consolidation during sintering.
Digital microscopy images of the samples and the surface can be seen in Figure 2e,f. Based on these images, it can be seen that the shape and geometry are not affected by the addition of the nanoparticles, nor is the quality of the surface. In the surface images, it can be seen that the main difference is the reinforcement agglomerates that are observed for the nanocomposites, where a slight roughness is kept for the nanocomposites.
Through microstructural characterization using SEM, it was possible to confirm that the dark phase observed in the optical microscopy images corresponded to the reinforcement agglomerates, as seen in Figure 4. This figure shows images of the nanocomposite reinforced with 1.0 wt% Al2O3 and more magnified regions where the dark phase comprises agglomerates of Al2O3 nanoparticles. The areas marked on the images in Figure 4b correspond to those analyzed using EDS and are shown in Table 2. Based on this EDS analysis, it can be concluded that the matrix shows agglomerates of Al2O3, mainly concentrated at the grain boundaries and triple points and by iron-rich precipitates that were observed in the initial Al powders.
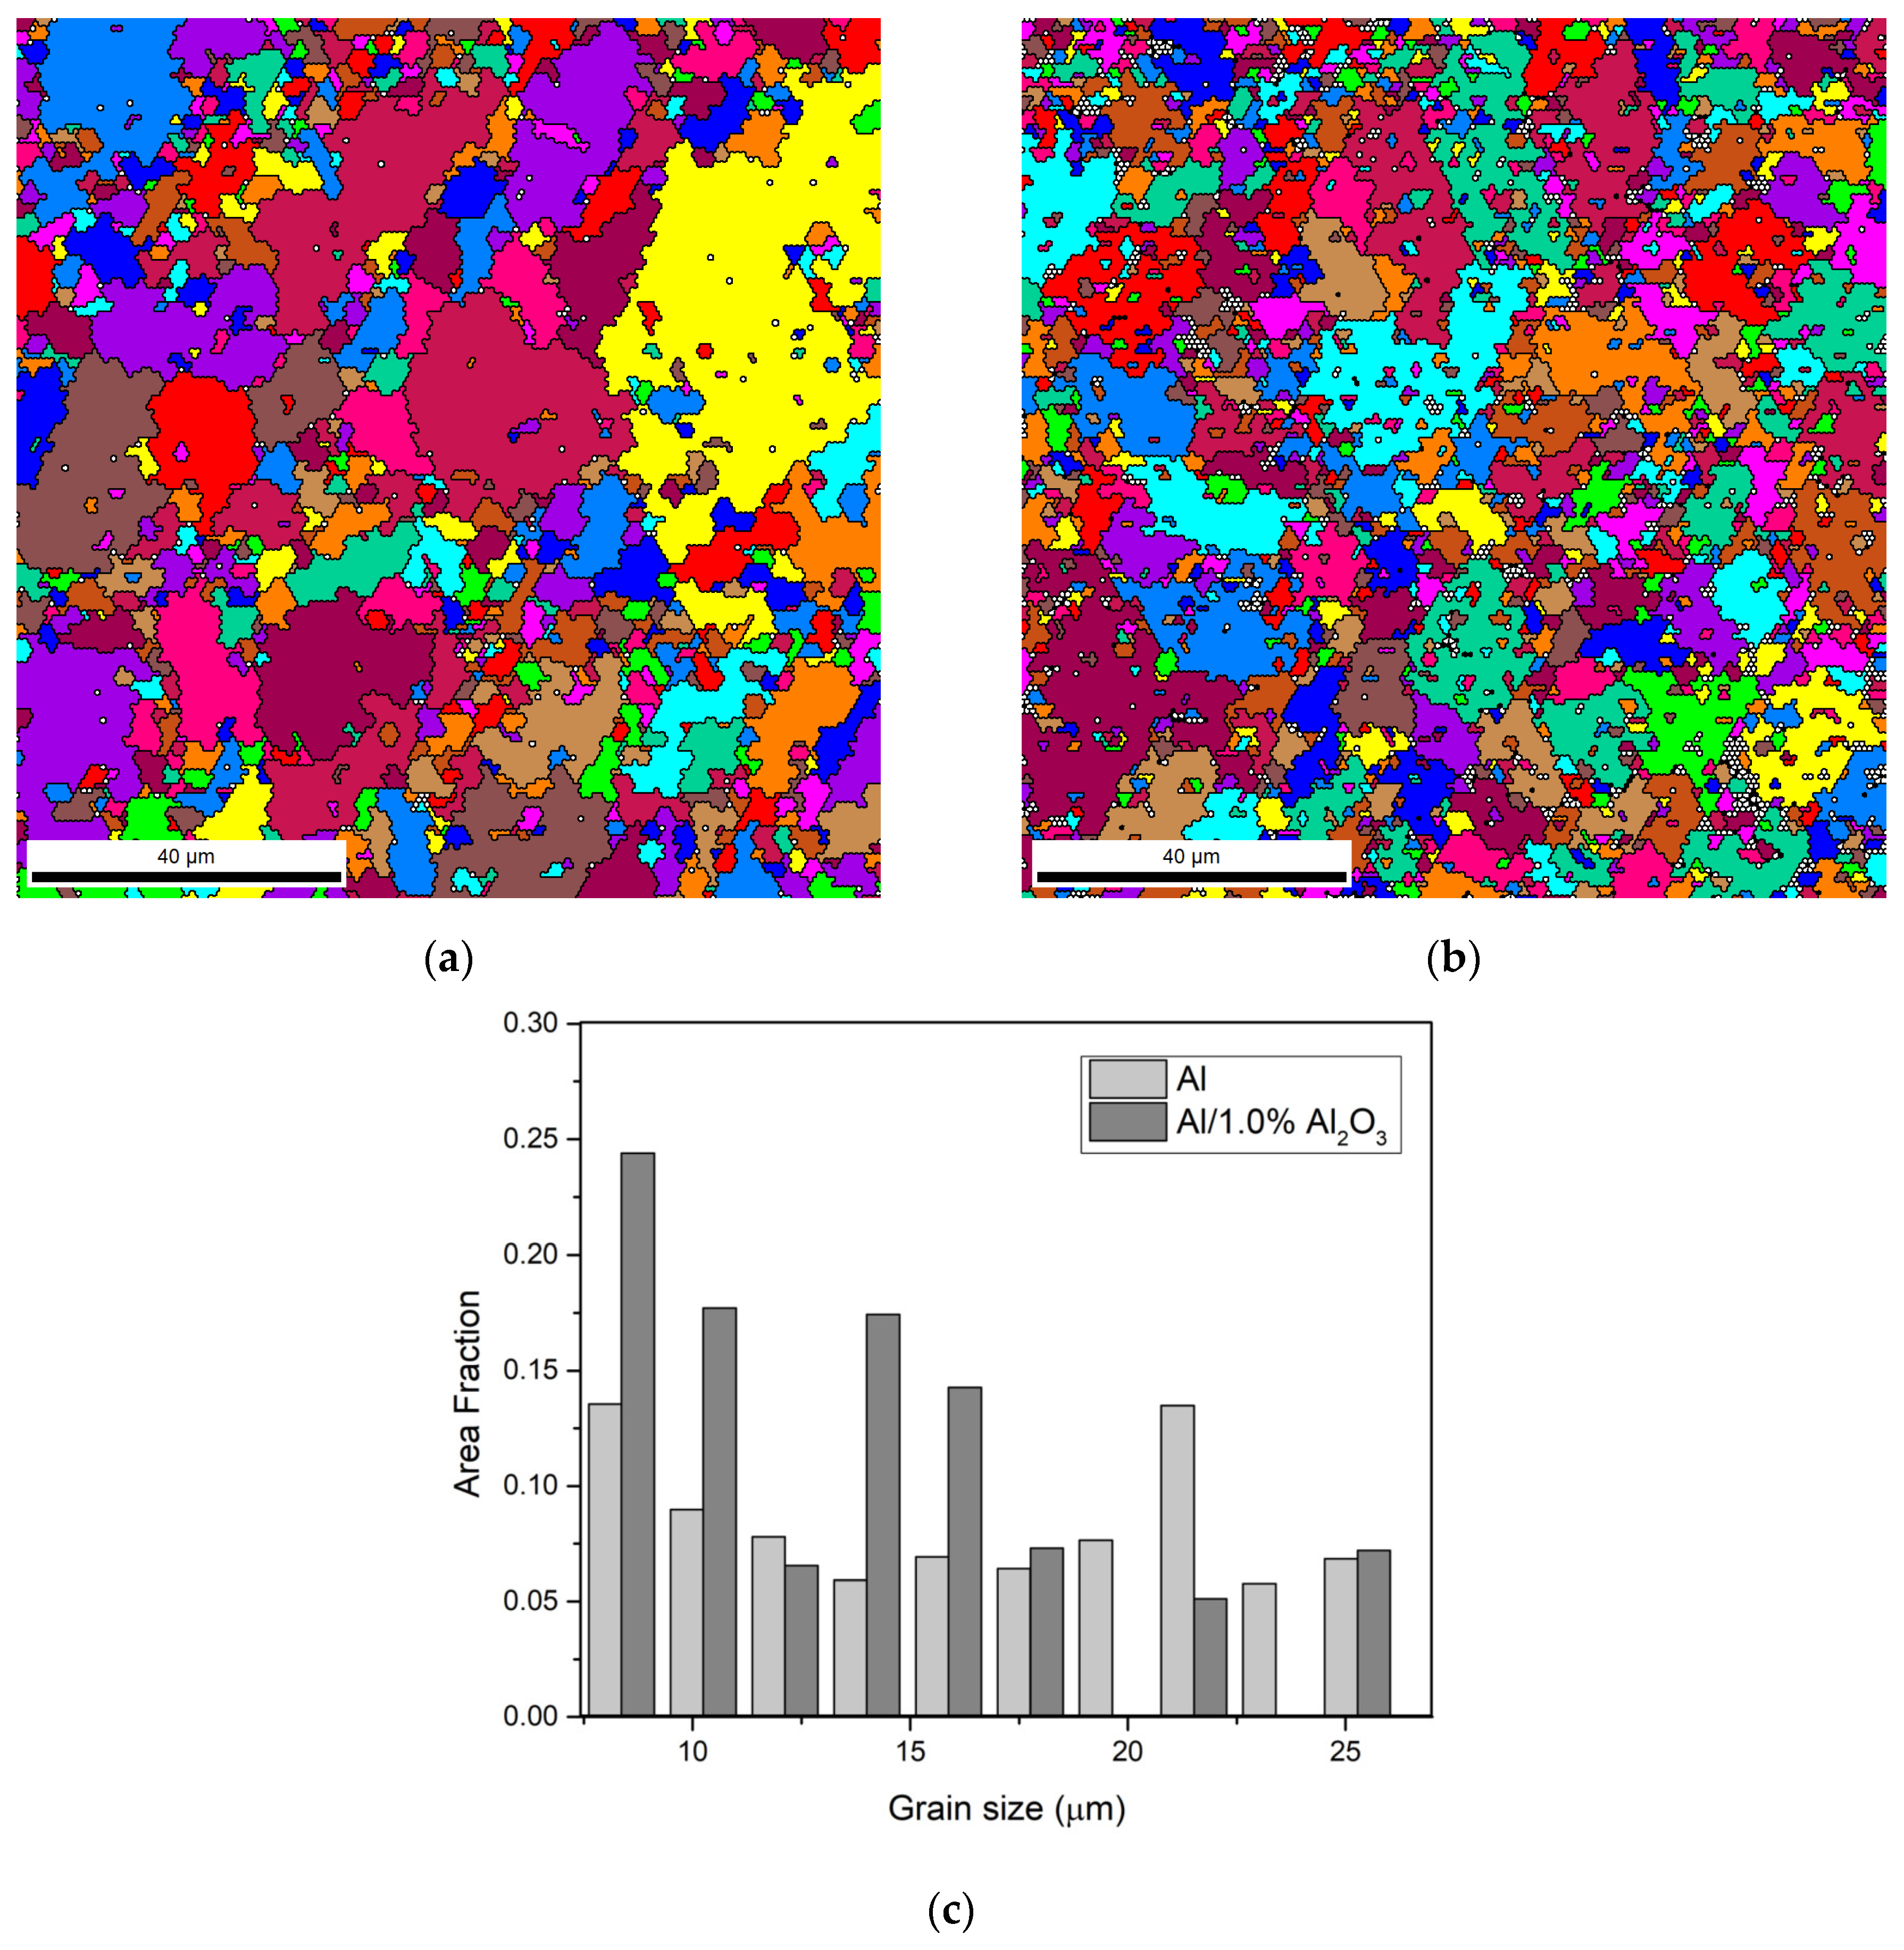
The grain size of the Al matrix and the nanocomposites was investigated using unique grain size maps through electron backscatter diffraction (EBSD). Figure 5 shows these maps for the Al matrix and Al-1.0 wt.% Al2O3 nanocomposites and the grain size distributions. Based on the maps and the distribution grain size, it is possible to conclude that the average grain size for the nanocomposites is smaller. The introduction of the Al2O3 nanoparticles affects the grain size of the matrix, resulting in a decrease in the average grain size. This effect is evident when considering the grain size distribution, where a higher fraction of small sizes is observed for the nanocomposites despite the average only decreasing from 13 to 10 μm from the matrix to the nanocomposite average grain size.
Another significant effect that reinforcement has on the microstructure of Al is the change in crystallographic orientation. Figure 6 shows the IPF maps and IPF figures for Al and the nanocomposites. It is clear from these results that the samples have different crystalline orientations, although none of them present texture. While the nanocomposites present a predominant orientation, [100] <111> and [010] <101>, the Al matrix shows the grains in the direction [100] <101> and [100] <111> with a stronger intensity. The Al2O3 affects the grain rotation during the sintering, resulting in this different crystallographic orientation of the Al matrix.
Different microstructural characteristics are evident between the matrix and the nanocomposites processed under the same conditions. Figure 7 shows the grain orientation spread (GOS) maps and distributions of the misorientation angle and Kernel average misorientation for the Al matrix and nanocomposite. Based on these maps, the matrix shows a more significant number of green or blue grains, which means grains with less misorientation and, therefore, a structure closer to the restored one than the nanocomposites. The distributions confirm these results, showing that for the nanocomposites, there is a higher fraction of low-angle boundaries and a higher Kernel average misorientation. These results indicate that introducing Al2O3 nanoparticles promotes a higher misorientation that can be explained by the higher density of dislocations for the nanocomposites than for the Al matrix produced under the same conditions. A higher density of dislocations during the production of the nanocomposites is observed due to the presence of the Al2O3 nanoparticles that will significantly affect the mobility of the dislocation. The same result was reported for nanocomposites reinforced with other nanoparticles [11,18].
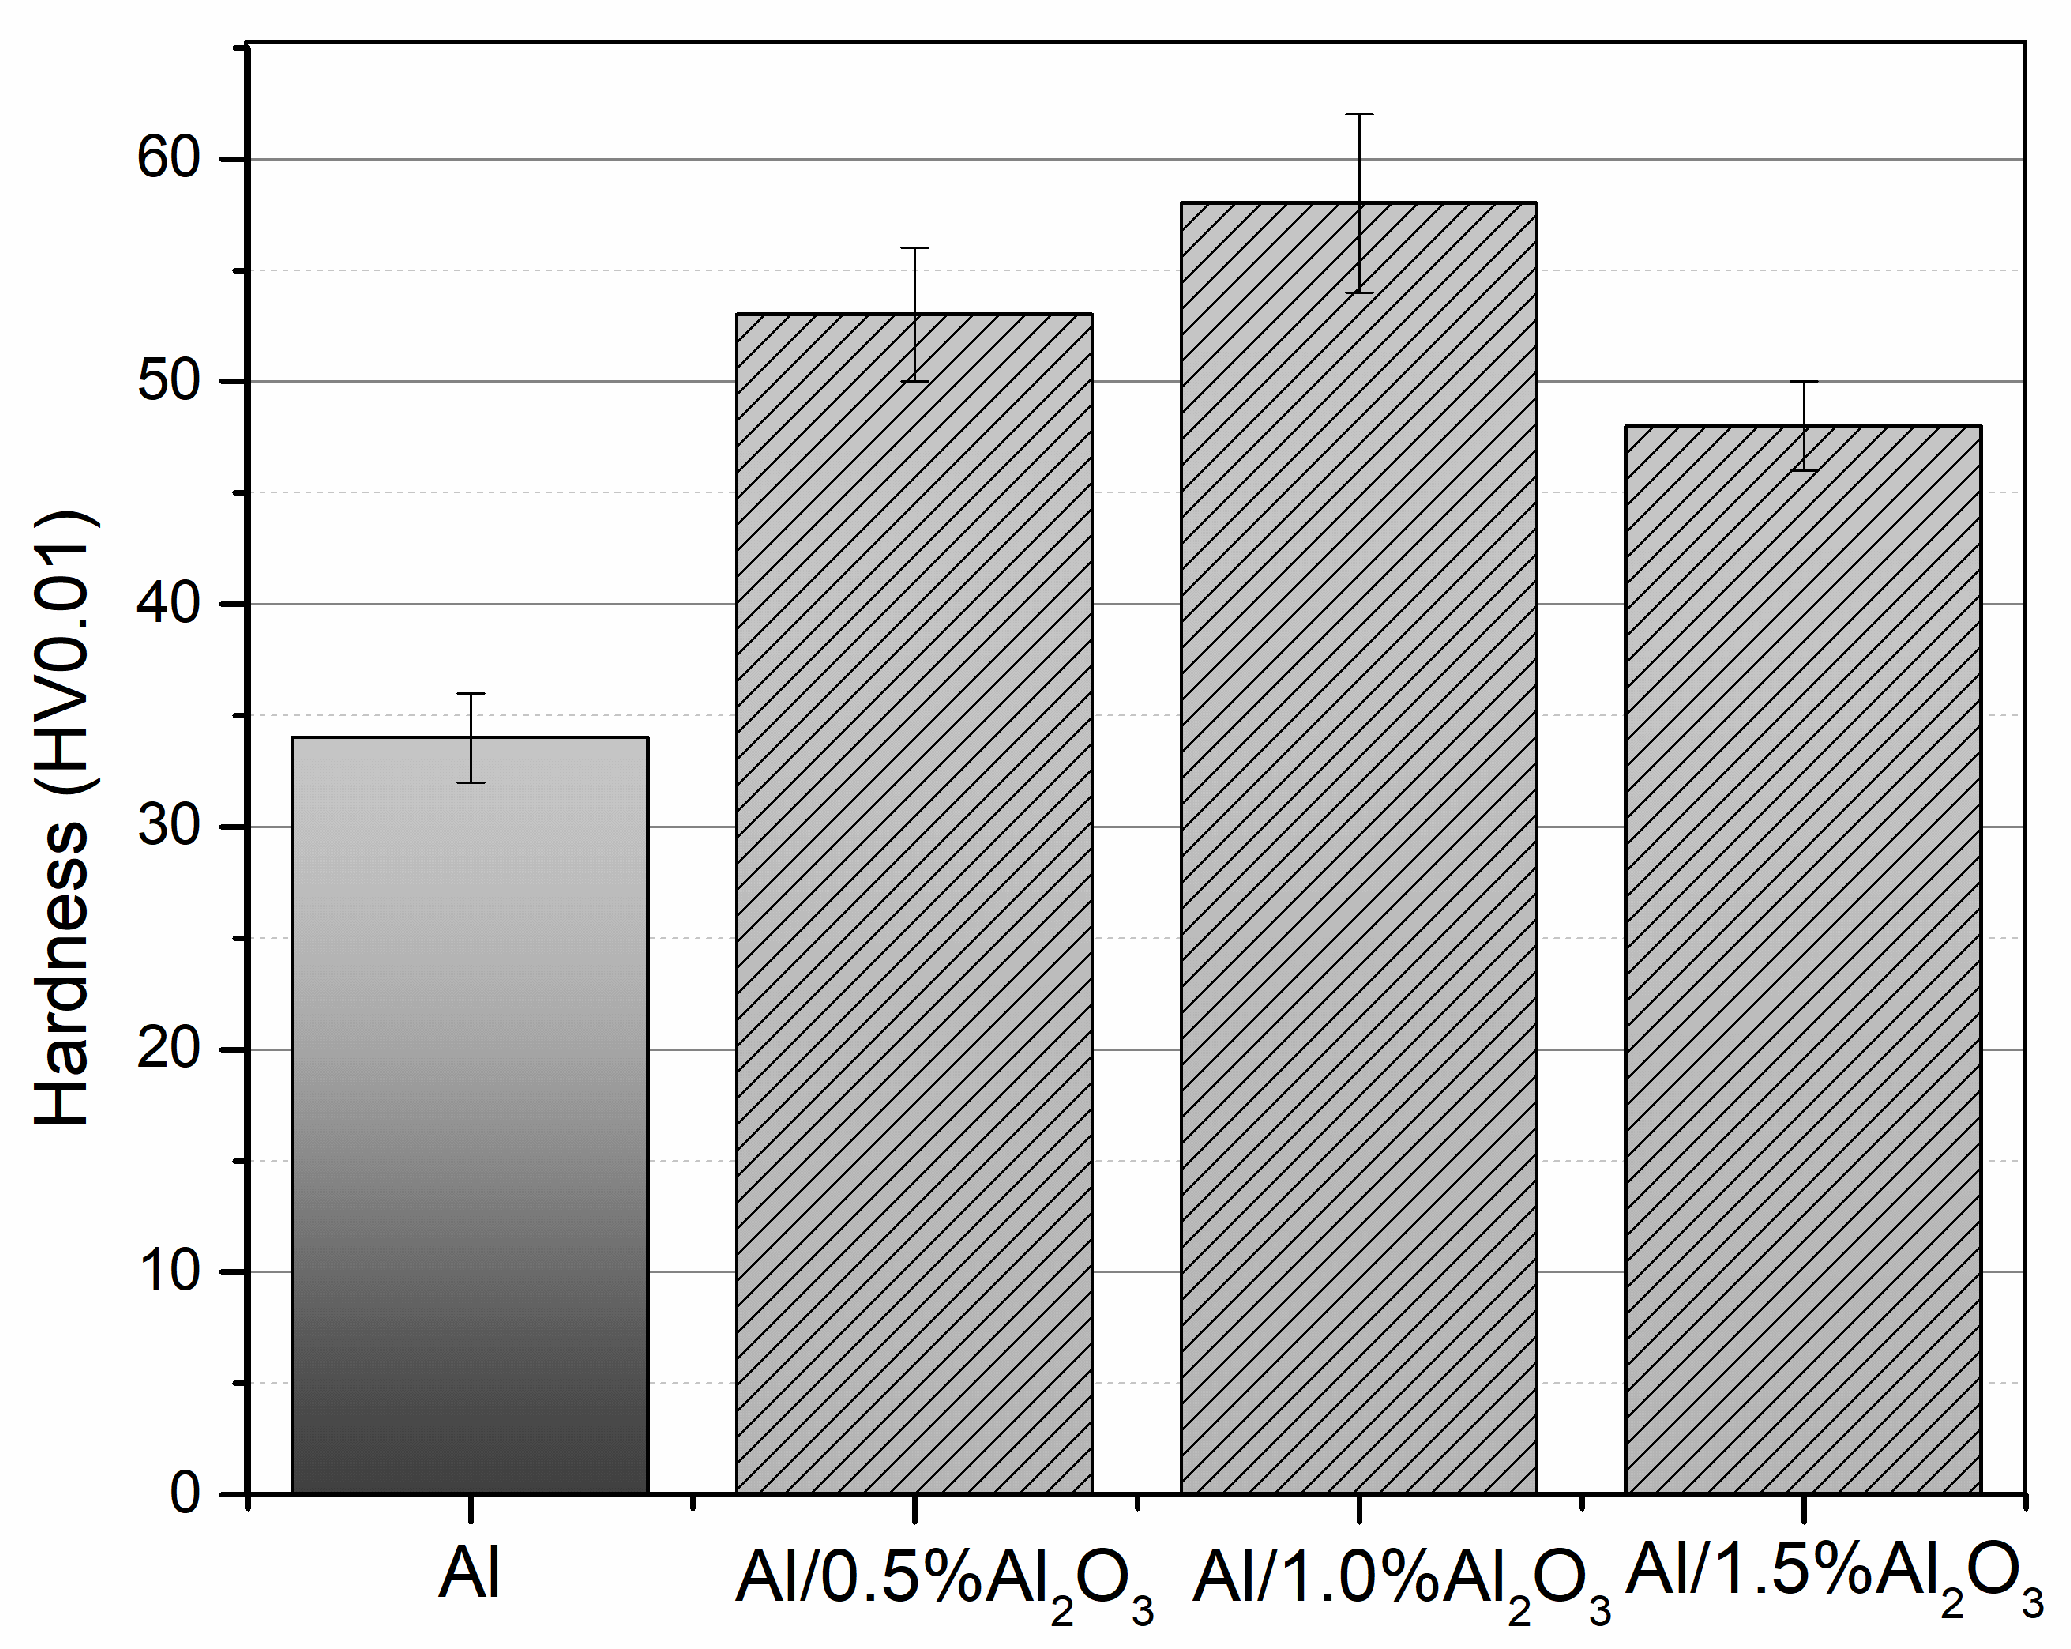
The evolution of the hardness with the volume fraction of the Al2O3 nanoparticles in the Al matrix can be observed in Figure 8. Based on this evolution, it is possible to follow an increase in hardness up to 1.0 wt.% Al2O3, and then a slight decrease is observed with the rise in the volume fraction increase. This increase corresponds to an 88% increase compared to the hardness of Al without any reinforcement and produced under the same conditions. This value can validate the reinforcement potential attributed to the nanometric Al2O3 particles added to the Al matrix, confirming their dispersion efficiency.
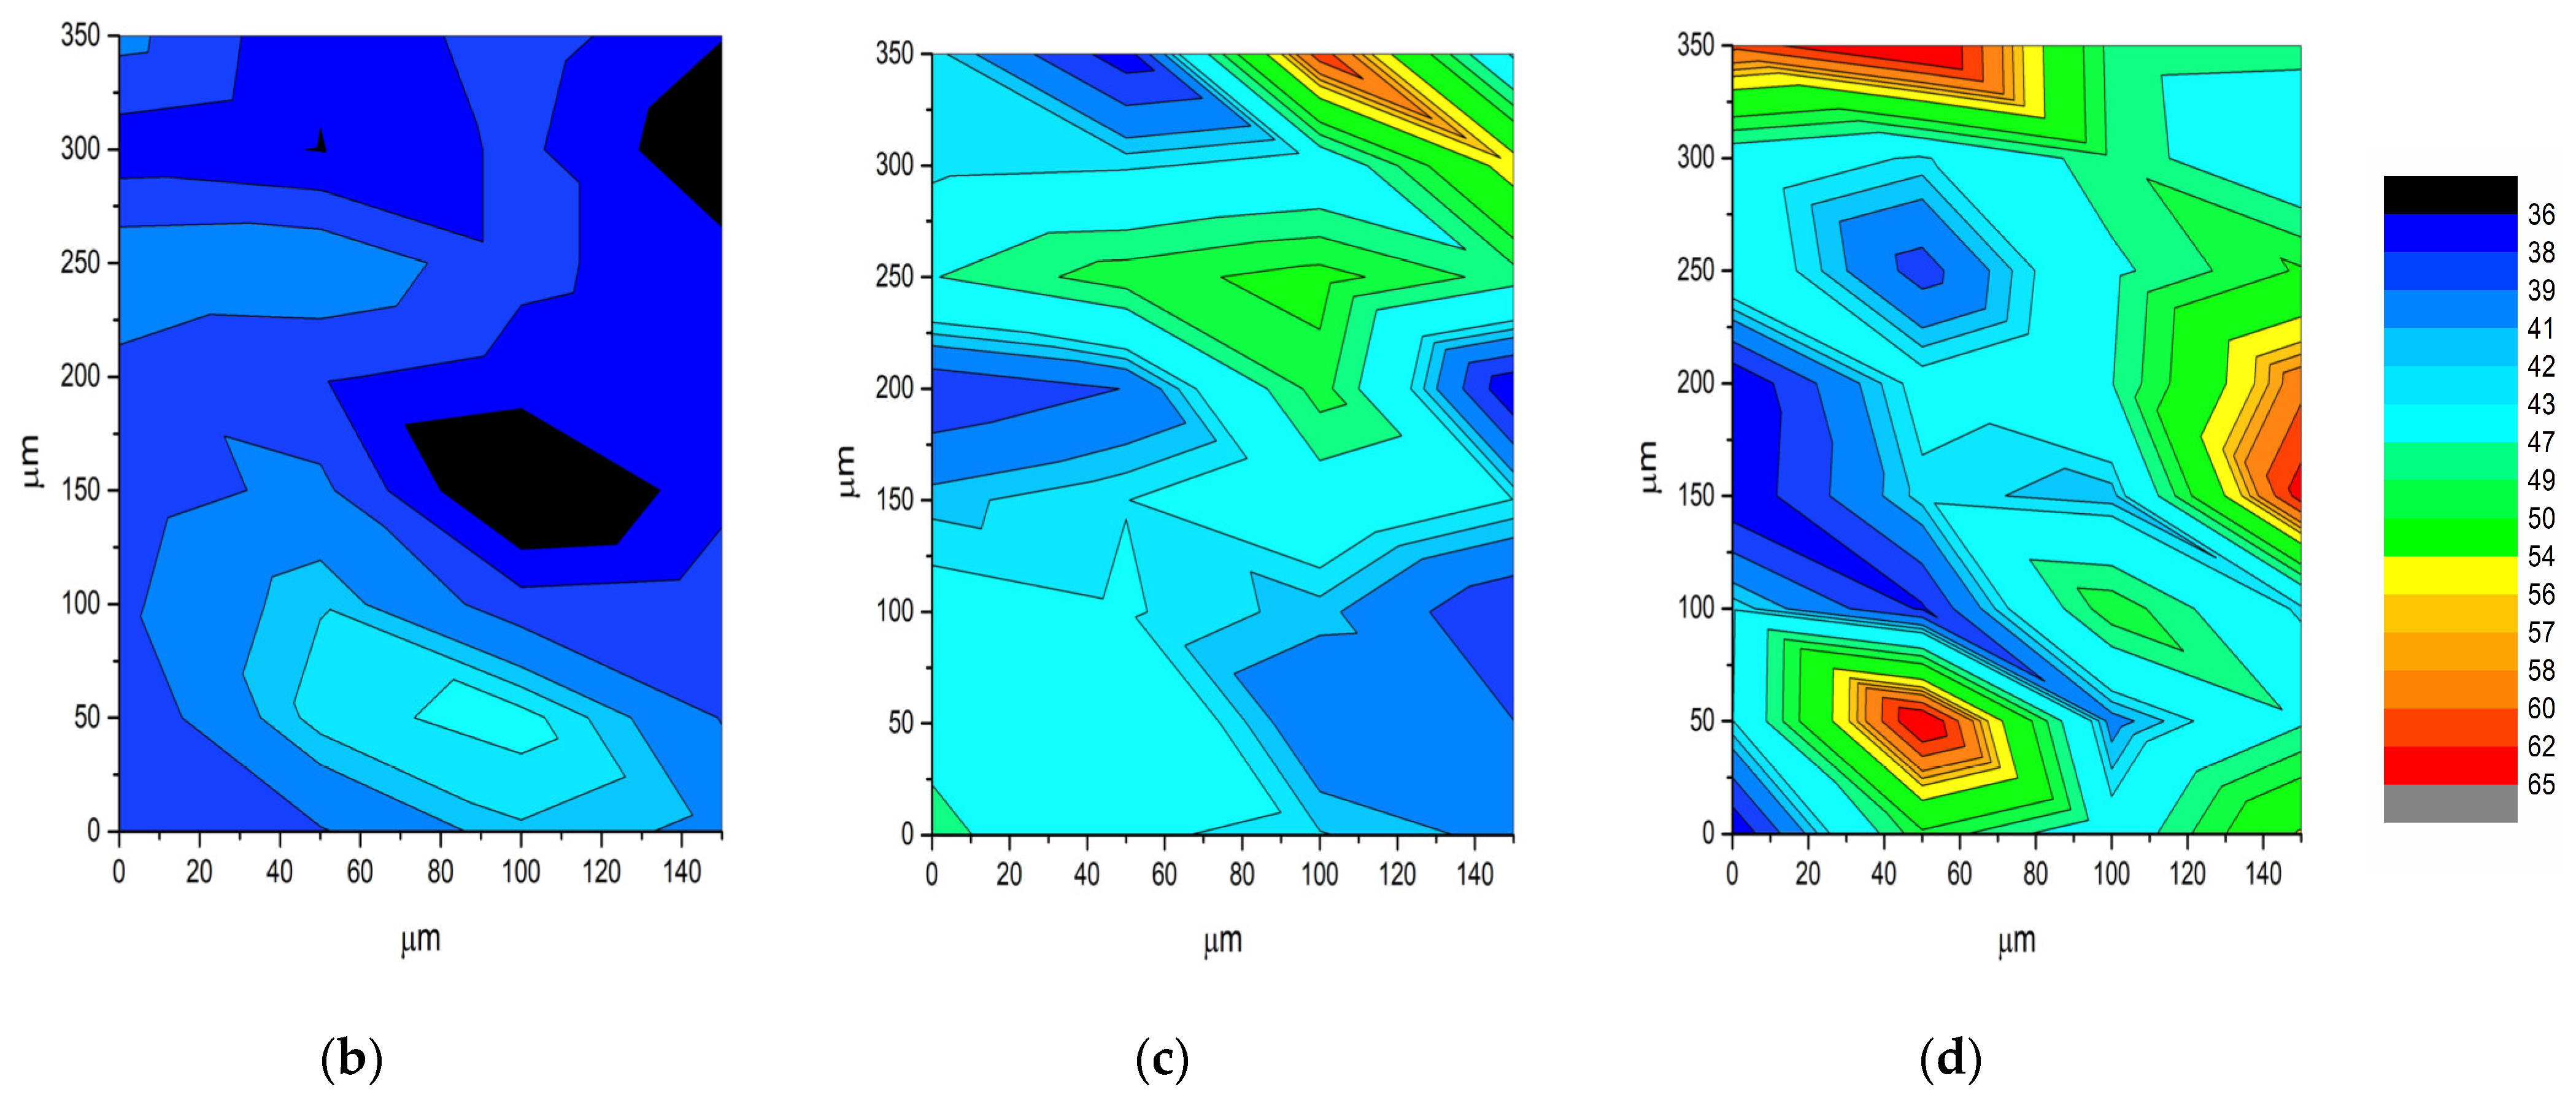
Indentation matrices also evaluated the distribution of hardness values to investigate nanoparticle agglomerates’ effect. Figure 9 shows the hardness distribution maps in the matrix and the nanocomposites produced with 0.5 and 1.0 wt.% of Al2O3 nanoparticles. This figure also shows a schematic and an optical microscopy image of a hardness matrix. Based on these results, the hardness matrix of the Al matrix has the lowest values. It is also characterized by areas of lower hardness, which may correspond to pores characteristic of the samples. The nanocomposites have higher hardness values, and the matrices have described points with higher values. These points correspond to agglomerates of Al2O3, which are responsible for increasing the hardness value of the matrix.
4. Discussion
4.1. Dispersion and Mixing Treatment
Dispersion and mixing were carried out using different conditions and agents through ultrasonication. Using isopropanol at a frequency of 20.4 kHz proved to be effective in dispersing this reinforcement. Isopropanol proved effective in reducing the aggregation of the nanoparticles and making the dispersion more uniform (Figure 1). However, this dispersion has a limitation because the higher the reinforcement volume fraction, the less effective this treatment is. The higher the volume fraction of the reinforcement, the lower the dispersion capacity since the distance between the particles will be smaller, making it more challenging to separate them. Ultrasonication also presented a significant advantage compared to one of the most reported processes in the literature regarding the modification of the morphology of the Al powders. This process does not alter the initial morphology of Al powders, which brings advantages in compaction. Al powders are almost spherical, facilitating pressing with nanoparticles. Due to effective dispersion, this compaction means obtaining highly densified nanocomposites up to a volume fraction of 1.0 wt.% Al2O3 during sintering, which is possible. Above this value, dispersion becomes more complex, and consequently, agglomerates impair compaction, damaging sintering.
The morphology of the Al powder is an essential aspect of nanocomposite production, mainly in the pressing step. The shape and size of the powders remain the same, especially when the reinforcement is ceramic particles, which is essential due to the weak ability of these nanoparticles to accumulate stress during cold pressing. Figure 10 presents a schematic illustration demonstrating possible problems that may occur during pressing and can affect the sintering, resulting in a nanocomposite with different characteristics. In scheme (1) of this figure, it is possible to observe Al particles with different shapes and sizes that, during pressing, will form high porosity that will not be filled with nanoparticles, producing a composite with low densification. Scheme (2) is the ideal situation where the Al particles are almost spherical, and the nanoparticles are well dispersed, filling the free spaces. In the last scheme, scheme (3), although the dispersion technique does not modify the Al powder, the nanoparticles are agglomerated, leading to problems consolidating the composite during sintering.
In ultrasonication, the solution used is one of the most critical parameters. Water is not the best solution for dispersing nanoparticles as it does not allow, with the ultrasound frequency, to separate nanoparticles effectively. When using an alcohol medium, it is possible to use its characteristics and the ultrasound frequency to promote the separation of nanoparticles. Due to the characteristics of isopropanol, this medium leads to the best results [20,21,22].
4.2. Effect of the Fraction of Al2O3 Nanoparticles in the Production of the Nanocomposites
Increasing the volume fraction of the reinforcement fraction promotes improved mechanical properties. This increase is related to the fact that the greater the addition of the volumetric fraction of the same, the greater the reinforcing effect will be if the dispersion is uniform. What was observed in this work is that with the applied dispersion technique, there is a limit on the volume fraction that allows a uniform dispersion to be followed. The same was observed for other metallic matrix nanocomposites reinforced with other nanoparticles [11,18]. This is because the more significant the fraction volume, the closer the nanoparticles will be, making their dispersion difficult (Figure 2 and Figure 3).
In addition to the dispersion being more difficult for volume fractions of up to 1.0% by weight of Al2O3, the cold pressing and sintering were more challenging for nanocomposites using these reinforcement values. This is because cold pressing will be less effective due to more agglomeration of the particles, promoting the formation of a green compact with larger pores. Sintering these composites does not occur to eliminate this porosity, which forms a nanocomposite with greater pores than the ones produced with a fraction of less than 1.0 wt.%.
4.3. Strengthening Mechanism of Nanocomposites
The addition of nanoparticles in the Al matrix promotes increased mechanical properties. This increase can be attributed to the contribution of the different reinforcement mechanisms. The strengthening mechanisms that can be used in these nanocomposites are (1) load transfer (ΔσLT), (2) grain size refinement due to the inhibiting effect of the nanoparticles in the mobility of the grain boundaries, (3) dislocation strengthening due to the coefficient of thermal expansion (CTE) mismatch and elastic modulus mismatch, and (5) Orowan strengthening. The contribution of the different mechanisms was estimated using the theories in the literature [23,24,25,26].
The load transfer mechanism is one of the most reported mechanisms associated with improving the strength of nanocomposites. The contribution of this mechanism can be calculated using Equation (1) [24]:
where the σm is the yield strength of the matrix and the Vp is the volume fraction of the reinforcement.
ΔσLT = 0.5σmVp
The microstructural characterization indicated an effect on the average grain size of the nanocomposites. The addition of Al2O3 promotes the decrease in the average grain size of the matrix due to the reduction in the grain boundary mobility via the presence of nanoparticles. This microstructural characteristic can indicate that grain size strengthening is one of the action mechanisms contributing to increasing nanocomposites’ mechanical properties. The Hall–Petch equation, Equation (2), can be used to estimate the contribution of this strengthening mechanism [23].
where ky is the Hall–Petch coefficient for pure Al and for this work it was used at 0.06 MPa m1/2, and d is the grain size.
The increase in the dislocation density is usually observed for the nanocomposites. Based on the microstructural characterization, it is evident that the addition of Al2O3 promotes an increase in the density of dislocation, confirmed in the results shown in Figure 7, that can be associated with the CTE mismatch and the Orowan mechanisms. Regarding the difference between the CTE of the Al and Al2O3 nanoparticles, geometrically necessary dislocations (GNDs) near the interface matrix/particle will be formed. The increase in the density of dislocation has a significant effect on the strength of the nanocomposites. This effect can be estimated following the theory of Arsenault et al. [26] and Equation (3):
where the is a geometric constant (0.5) and is the shear modulus of Al that was considered as 26 GPa. The density of GND dislocations can be estimated using Equation (4).
where is the CTE mismatch between the Al and Al2O3 that is 16.7 × 10⁻⁶ K−1, is the particle size, b is the Burgers vector of the Al (0.286 nm), is the difference between the processing temperature and the room temperature, and the Vp is the volume fraction. The Orowan strengthening can also contribute to the increase in the mechanical properties of the nanocomposites. The presence of the nanoparticles in the Al matrix affects the dislocation mobility, which will increase the dislocation density. The contribution of this mechanism can be estimated using Equation (5).
where the M is 3.06, ν is the Poisson’s ratio of the Al (0.345), the λ is the interparticle distance, and the is the diameter of the particles.
The strength improvement in the nanocomposites was estimated in the function of the volume fraction of the nanoparticles of Al2O3 based on the theories in the literature. Table 3 shows the contribution of the different strengthening mechanisms.
Based on these results, the increase in the dislocation density plays an essential role in these nanocomposites. This can be attributed to the differences in the CET and elastic modulus between the Al and Al2O3 that will promote the formation of stress that, during the production, results in an increase in dislocation. In addition, the presence of well-dispersed nanoparticles will affect dislocation mobility, promoting the increase in the density via the Orowan mechanism. The volume fraction of the reinforcement significantly affects the strengthening of the nanocomposites. Based on the results, the increase in the fraction of the Al2O3 nanoparticles induces the improvement in the strength of the nanocomposites. However, the dispersion of the nanoparticles is a crucial aspect of the strengthening efficiency of the nanocomposites.
5. Conclusions
This research shows a practical approach for producing Al matrix nanocomposites reinforced with Al2O3 nanoparticles with excellent and uniform dispersion. Dispersion and mixing were carried out using different conditions and means through ultrasonication. Using isopropanol at a frequency of 20.4 kHz proved to be effective in dispersing the nanoparticles through the Al matrix. The dispersion solution was shown to influence dispersion through ultrasonication. The best increase in hardness was observed for the nanocomposite produced with 1.0 wt.% Al2O3. With an increase in the volume fraction of nanoparticles, a decrease in hardness is observed, which may be associated with worse dispersion of the reinforcement. Adding Al2O3 nanoparticles promotes a decrease in the grain size of the Al matrix and an increase in dislocation density, which can be associated with grain refinement and Orowan and an increase in dislocation density. Load transfer is also one mechanism that increases the composite’s mechanical properties.
Author Contributions
Conceptualization, S.S.; methodology, S.S.; validation, S.S.; formal analysis, F.R.; investigation, F.R.; writing—original draft preparation, F.R.; writing—review and editing, S.S.; visualization, F.R.; supervision, S.S. All authors have read and agreed to the published version of the manuscript.
Funding
This research received no external funding.
Data Availability Statement
Data are contained within the article.
Acknowledgments
The authors are grateful to CEMUP—Centro de Materiais da Universidade do Porto—for the expert assistance with SEM.
Conflicts of Interest
The authors declare no conflicts of interest.
References
- Choi, S.M.; Awaji, H. Nanocomposites—A New Material Design Concept. Sci. Technol. Adv. Mater. 2005, 6, 2–10. [Google Scholar] [CrossRef]
- Divagar, S.; Vigneshwar, M.; Selvamani, S.T. Impacts of Nano Particles on Fatigue Strength of Aluminum Based Metal Matrix Composites for Aerospace. Mater. Today Proc. 2016, 3, 3734–3739. [Google Scholar] [CrossRef]
- Lu, H.X.; Hu, J.; Chen, C.P.; Sun, H.W.; Hu, X.; Yang, D.L. Characterization of Al2O3-Al Nanocomposite Powder Prepared by a Wet Chemical Method. Ceram. Int. 2005, 31, 481–485. [Google Scholar] [CrossRef]
- Shafiei-Zarghani, A.; Kashani-Bozorg, S.F.; Hanzaki, A.Z. Wear Assessment of Al/Al2O3 Nanocomposite Surface Layer Produced Using Friction Stir Processing. Wear 2011, 270, 403–412. [Google Scholar] [CrossRef]
- Razavi Tousi, S.S.; Yazdani Rad, R.; Salahi, E.; Mobasherpour, I.; Razavi, M. Production of Al-20 Wt.% Al2O3 Composite Powder Using High Energy Milling. Powder Technol. 2009, 192, 346–351. [Google Scholar] [CrossRef]
- Razavi-Tousi, S.S.; Yazdani-Rad, R.; Manafi, S.A. Effect of Volume Fraction and Particle Size of Alumina Reinforcement on Compaction and Densification Behavior of Al-Al2O3 Nanocomposites. Mater. Sci. Eng. A 2011, 528, 1105–1110. [Google Scholar] [CrossRef]
- Tavoosi, M.; Karimzadeh, F.; Enayati, M.H.; Heidarpour, A. Bulk Al-Zn/Al2O3 Nanocomposite Prepared by Reactive Milling and Hot Pressing Methods. J. Alloys Compd. 2009, 475, 198–201. [Google Scholar] [CrossRef]
- Malaki, M.; Xu, W.; Kasar, A.K.; Menezes, P.L.; Dieringa, H.; Varma, R.S.; Gupta, M. Advanced Metal Matrix Nanocomposites. Metals 2019, 9, 330. [Google Scholar] [CrossRef]
- Casati, R.; Vedani, M. Metal Matrix Composites Reinforced by Nanoparticles—A Review. Metals 2014, 4, 65–83. [Google Scholar] [CrossRef]
- Qadir, J.; Savio Lewise, A.; Jims John Wessley, G.; Diju Samuel, G. Influence of Nanoparticles in Reinforced Aluminium Metal Matrix Composites in Aerospace Applications—A Review. Mater. Today Proc. 2023, in press. [Google Scholar] [CrossRef]
- Rocha, F.; Simões, S. Production and Characterization of Aluminum Reinforced with SiC Nanoparticles. Metals 2023, 13, 1626. [Google Scholar] [CrossRef]
- Timms, L.A.; Ponton, C.B.; Strangwood, M. Processing of Al2O3/SiC Nanocomposites—Part 2: Green Body Formation and Sintering. J. Eur. Ceram. Soc. 2002, 22, 1569–1586. [Google Scholar] [CrossRef]
- Mula, S.; Padhi, P.; Panigrahi, S.C.; Pabi, S.K.; Ghosh, S. On Structure and Mechanical Properties of Ultrasonically Cast Al-2% Al2O3 Nanocomposite. Mater. Res. Bull. 2009, 44, 1154–1160. [Google Scholar] [CrossRef]
- Prasad Reddy, A.; Vamsi Krishna, P.; Narasimha Rao, R.; Murthy, N.V. Silicon Carbide Reinforced Aluminium Metal Matrix Nano Composites-A Review. Mater. Today Proc. 2017, 4, 3959–3971. [Google Scholar] [CrossRef]
- Yehia, H.M.; Nyanor, P.; Daoush, W.M. Characterization of Al-5Ni-0.5Mg/x (Al2O3-GNs) Nanocomposites Manufactured via Hot Pressing Technique. Mater. Charact. 2022, 191, 112139. [Google Scholar] [CrossRef]
- Moya, J.S.; Lopez-Esteban, S.; Pecharromán, C. The Challenge of Ceramic/Metal Microcomposites and Nanocomposites. Prog. Mater. Sci. 2007, 52, 1017–1090. [Google Scholar] [CrossRef]
- Orłowska, M.; Pixner, F.; Hütter, A.; Enzinger, N.; Olejnik, L.; Lewandowska, M. Manufacturing of Coarse and Ultrafine-Grained Aluminum Matrix Composites Reinforced with Al2O3 Nanoparticles via Friction Stir Processing. J. Manuf. Process 2022, 80, 359–373. [Google Scholar] [CrossRef]
- Carneiro, Í.; Simões, S. Investigation of Mechanical Properties of Al/CNT Nanocomposites Produced by Powder Metallurgy. Appl. Sci. 2023, 13, 54. [Google Scholar] [CrossRef]
- Carneiro, Í.; Fernandes, J.V.; Simões, S. Microstructural Characterization of Al/CNTs Nanocomposites after Cold Rolling. Nanomaterials 2023, 13, 1362. [Google Scholar] [CrossRef]
- Zhelezny, V.; Motovoy, I.; Khliyeva, O.; Lukianov, N. An influence of Al2O3 nanoparticles on the caloric properties and parameters of the phase transition of isopropyl alcohol in solid phase. Thermochim. Acta 2019, 671, 170–180. [Google Scholar] [CrossRef]
- Zhelezny, V.; Lozovsky, T.; Gotsulskiy, V.; Lukianov, N.; Motovoy, I. Research into the Influence of Al2O3 Nanoparticle Admixtures on the Magnitude of Isopropanol Molar. East. Eur. J. Enterp. Technol. 2017, 2, 33–39. [Google Scholar] [CrossRef]
- Altun, A.; Doruk, S.; Şara, O.N. Effect of Al2O3 Nanoparticle Dispersion on the Thermophysical Properties of [EMIM][EtSO4] Ionic Liquid. Int. J. Thermophys. 2023, 44, 106. [Google Scholar] [CrossRef]
- Sanaty-Zadeh, A. Comparison between Current Models for the Strength of Particulate-Reinforced Metal Matrix Nanocomposites with Emphasis on Consideration of Hall–Petch Effect. Mater. Sci. Eng. A 2012, 531, 112–118. [Google Scholar] [CrossRef]
- Zhao, K.; Duan, Z.; Liu, J.; Kang, G.; An, L. Strengthening Mechanisms of 15 Vol.% Al2O3 Nanoparticles Reinforced Aluminum Matrix Nanocomposite Fabricated by High Energy Ball Milling and Vacuum Hot Pressing. Acta Metall. Sin. 2022, 35, 915–921. [Google Scholar] [CrossRef]
- Nardone, V.C.; Prewo, K.M. On the strength of discontinuous silicon carbide reinforced aluminum composites. Scr. Metall. 1986, 20, 43–48. [Google Scholar] [CrossRef]
- Arsenault, R.J.; Shi, N. Dislocation generation due to differences between the coefficients of thermal expansion. Mater. Sci. Eng. 1986, 81, 175–187. [Google Scholar] [CrossRef]
Figure 1.
(a–d) Scanning electron microscopy (SEM) images of as-received Al2O3 nanoparticles (a–d) dispersion in isopropanol and (e) EDS spectrum of an agglomerate of nanoparticles.
Figure 1.
(a–d) Scanning electron microscopy (SEM) images of as-received Al2O3 nanoparticles (a–d) dispersion in isopropanol and (e) EDS spectrum of an agglomerate of nanoparticles.

Figure 2.
OM images of the (a) Al matrix and (b–d) Al–Al2O3 nanocomposites with 0.5, 1.0, and 1.5 wt.% of Al2O3; surface image and digital image of the (e) Al and (f) nanocomposite.
Figure 2.
OM images of the (a) Al matrix and (b–d) Al–Al2O3 nanocomposites with 0.5, 1.0, and 1.5 wt.% of Al2O3; surface image and digital image of the (e) Al and (f) nanocomposite.

Figure 3.
Evolution of density and pores and agglomerates with a volume fraction of the reinforcement.
Figure 3.
Evolution of density and pores and agglomerates with a volume fraction of the reinforcement.

Figure 4.
(a) SEM images of the Al–Al2O3 nanocomposites and (b) a detailed of magnified SEM images identity as Al2O3 in the agglomerate and with the regions analyzed by EDS.
Figure 4.
(a) SEM images of the Al–Al2O3 nanocomposites and (b) a detailed of magnified SEM images identity as Al2O3 in the agglomerate and with the regions analyzed by EDS.

Figure 5.
Unique color grain size maps of (a) Al matrix and (b) Al-1.0 wt.% Al2O3 nanocomposite obtained with EBSD and (c) grain size distributions.
Figure 5.
Unique color grain size maps of (a) Al matrix and (b) Al-1.0 wt.% Al2O3 nanocomposite obtained with EBSD and (c) grain size distributions.

Figure 6.
Inverse pole figure (IPF) maps and inverse pole figures of (a,c) Al matrix and (b,d) Al-1.0 wt.% Al2O3 nanocomposite obtained with EBSD.
Figure 6.
Inverse pole figure (IPF) maps and inverse pole figures of (a,c) Al matrix and (b,d) Al-1.0 wt.% Al2O3 nanocomposite obtained with EBSD.

Figure 7.
Grain orientation spread (GOS) maps, distribution of misorientation angle, and Kernel average misorientation of (a,c,e) Al matrix and (b,d,f) Al/1.0 wt.% Al2O3 nanocomposite obtained with EBSD.
Figure 7.
Grain orientation spread (GOS) maps, distribution of misorientation angle, and Kernel average misorientation of (a,c,e) Al matrix and (b,d,f) Al/1.0 wt.% Al2O3 nanocomposite obtained with EBSD.

Figure 8.
Evolution of the hardness with the fraction of the Al2O3 nanoparticles in the Al matrix.

Figure 9.
Hardness maps of Al and nanocomposites; (a) image and schematic drawing of the hardness matrix, and maps of (b) Al matrix and (c) nanocomposites with 0.5 wt.% Al2O3 and (d) nanocomposites with 1.0 wt.% Al2O3.
Figure 9.
Hardness maps of Al and nanocomposites; (a) image and schematic drawing of the hardness matrix, and maps of (b) Al matrix and (c) nanocomposites with 0.5 wt.% Al2O3 and (d) nanocomposites with 1.0 wt.% Al2O3.


Figure 10.
Scheme of the effect of the morphology of the Al powder and the agglomeration of nanoparticles on the pressing of the powders: (1) modification in the morphology of the Al powders to cause high porosity during pressing, (2) powders without changes in the almost-spherical morphology and nanoparticles well dispersed, and (3) powders with no change in almost-spherical morphology but agglomerated nanoparticles.


Table 1.
Conditions of the dispersion and mixing.
| Ultrasonication Frequencies (kHz) | Time (min) | Solution |
|---|---|---|
| 12.0 | 5 | ethanol– |
| 10 | water | |
| 15 | isopropanol | |
| 20 | ||
| 15.0 | 5 | ethanol– |
| 10 | water | |
| 15 | isopropanol | |
| 20 | ||
| 20.4 | 5 | ethanol– |
| 10 | water | |
| 15 | isopropanol | |
| 20 |
Table 2.
EDS chemical composition (in at. %) of the regions identified in Figure 4b.
Table 2.
EDS chemical composition (in at. %) of the regions identified in Figure 4b.
| Zone | Al | O | Fe | Ni |
|---|---|---|---|---|
| Z1 | 100 | - | - | - |
| Z2 | 78.6 | 7.9 | 12.5 | 1.1 |
| Z3 | 54.4 | 45.6 | - | - |
Table 3.
Strengthening mechanism estimation contribution for the strength improvement in the Al-Al2O3 nanocomposites.
Table 3.
Strengthening mechanism estimation contribution for the strength improvement in the Al-Al2O3 nanocomposites.
| Strengthening Mechanism | Al-0.5 wt.% Al2O3 | Al-1.0 wt.% Al2O3 | Al-1.5 wt.%Al2O3 |
|---|---|---|---|
| Load transfer (MPa) | 16.5 | 33 | 49.5 |
| Grain refinement (MPa) | 3.6 | 5.8 | 8.4 |
| GNDs induced via CTE mismatch (m−2) | 1.16 × 10⁻⁷ | 2.34 × 10⁻⁷ | 3.53 × 10⁻⁷ |
| GNDs induced via CTE mismatch (MPa) | 2.2 | 3.1 | 3.9 |
| Orowan (MPa) | 16.5 | 22.5 | 26.2 |
Disclaimer/Publisher’s Note: The statements, opinions and data contained in all publications are solely those of the individual author(s) and contributor(s) and not of MDPI and/or the editor(s). MDPI and/or the editor(s) disclaim responsibility for any injury to people or property resulting from any ideas, methods, instructions or products referred to in the content. |
© 2024 by the authors. Licensee MDPI, Basel, Switzerland. This article is an open access article distributed under the terms and conditions of the Creative Commons Attribution (CC BY) license (https://creativecommons.org/licenses/by/4.0/).
Share and Cite
MDPI and ACS Style
Rocha, F.; Simões, S. Aluminum Nanocomposites Reinforced with Al2O3 Nanoparticles: Synthesis, Structure, and Properties. J. Compos. Sci. 2024, 8, 33. https://0-doi-org.brum.beds.ac.uk/10.3390/jcs8010033
AMA Style
Rocha F, Simões S. Aluminum Nanocomposites Reinforced with Al2O3 Nanoparticles: Synthesis, Structure, and Properties. Journal of Composites Science. 2024; 8(1):33. https://0-doi-org.brum.beds.ac.uk/10.3390/jcs8010033
Chicago/Turabian StyleRocha, Francisca, and Sónia Simões. 2024. "Aluminum Nanocomposites Reinforced with Al2O3 Nanoparticles: Synthesis, Structure, and Properties" Journal of Composites Science 8, no. 1: 33. https://0-doi-org.brum.beds.ac.uk/10.3390/jcs8010033