

Plasma-Enhanced Alginate Pre-Treatment of Short Flax Fibers for Improved Thermo-Mechanical Properties of PLA Composites
 , , , ,
Abstract
:1. Introduction
2. Experiment
2.1. Materials
2.2. Treatment of Flax Fibers
2.2.1. Preparation of Flax Fiber with Sodium Alginate
2.2.2. Plasma Pre-Treatment of Modified Flax Fiber
2.3. Composite Processing
2.4. Characterization Methods
2.4.1. OES
2.4.2. FTIR
2.4.3. XPS
2.4.4. SEM
2.4.5. DSC
2.4.6. DMA
3. Results and Discussion
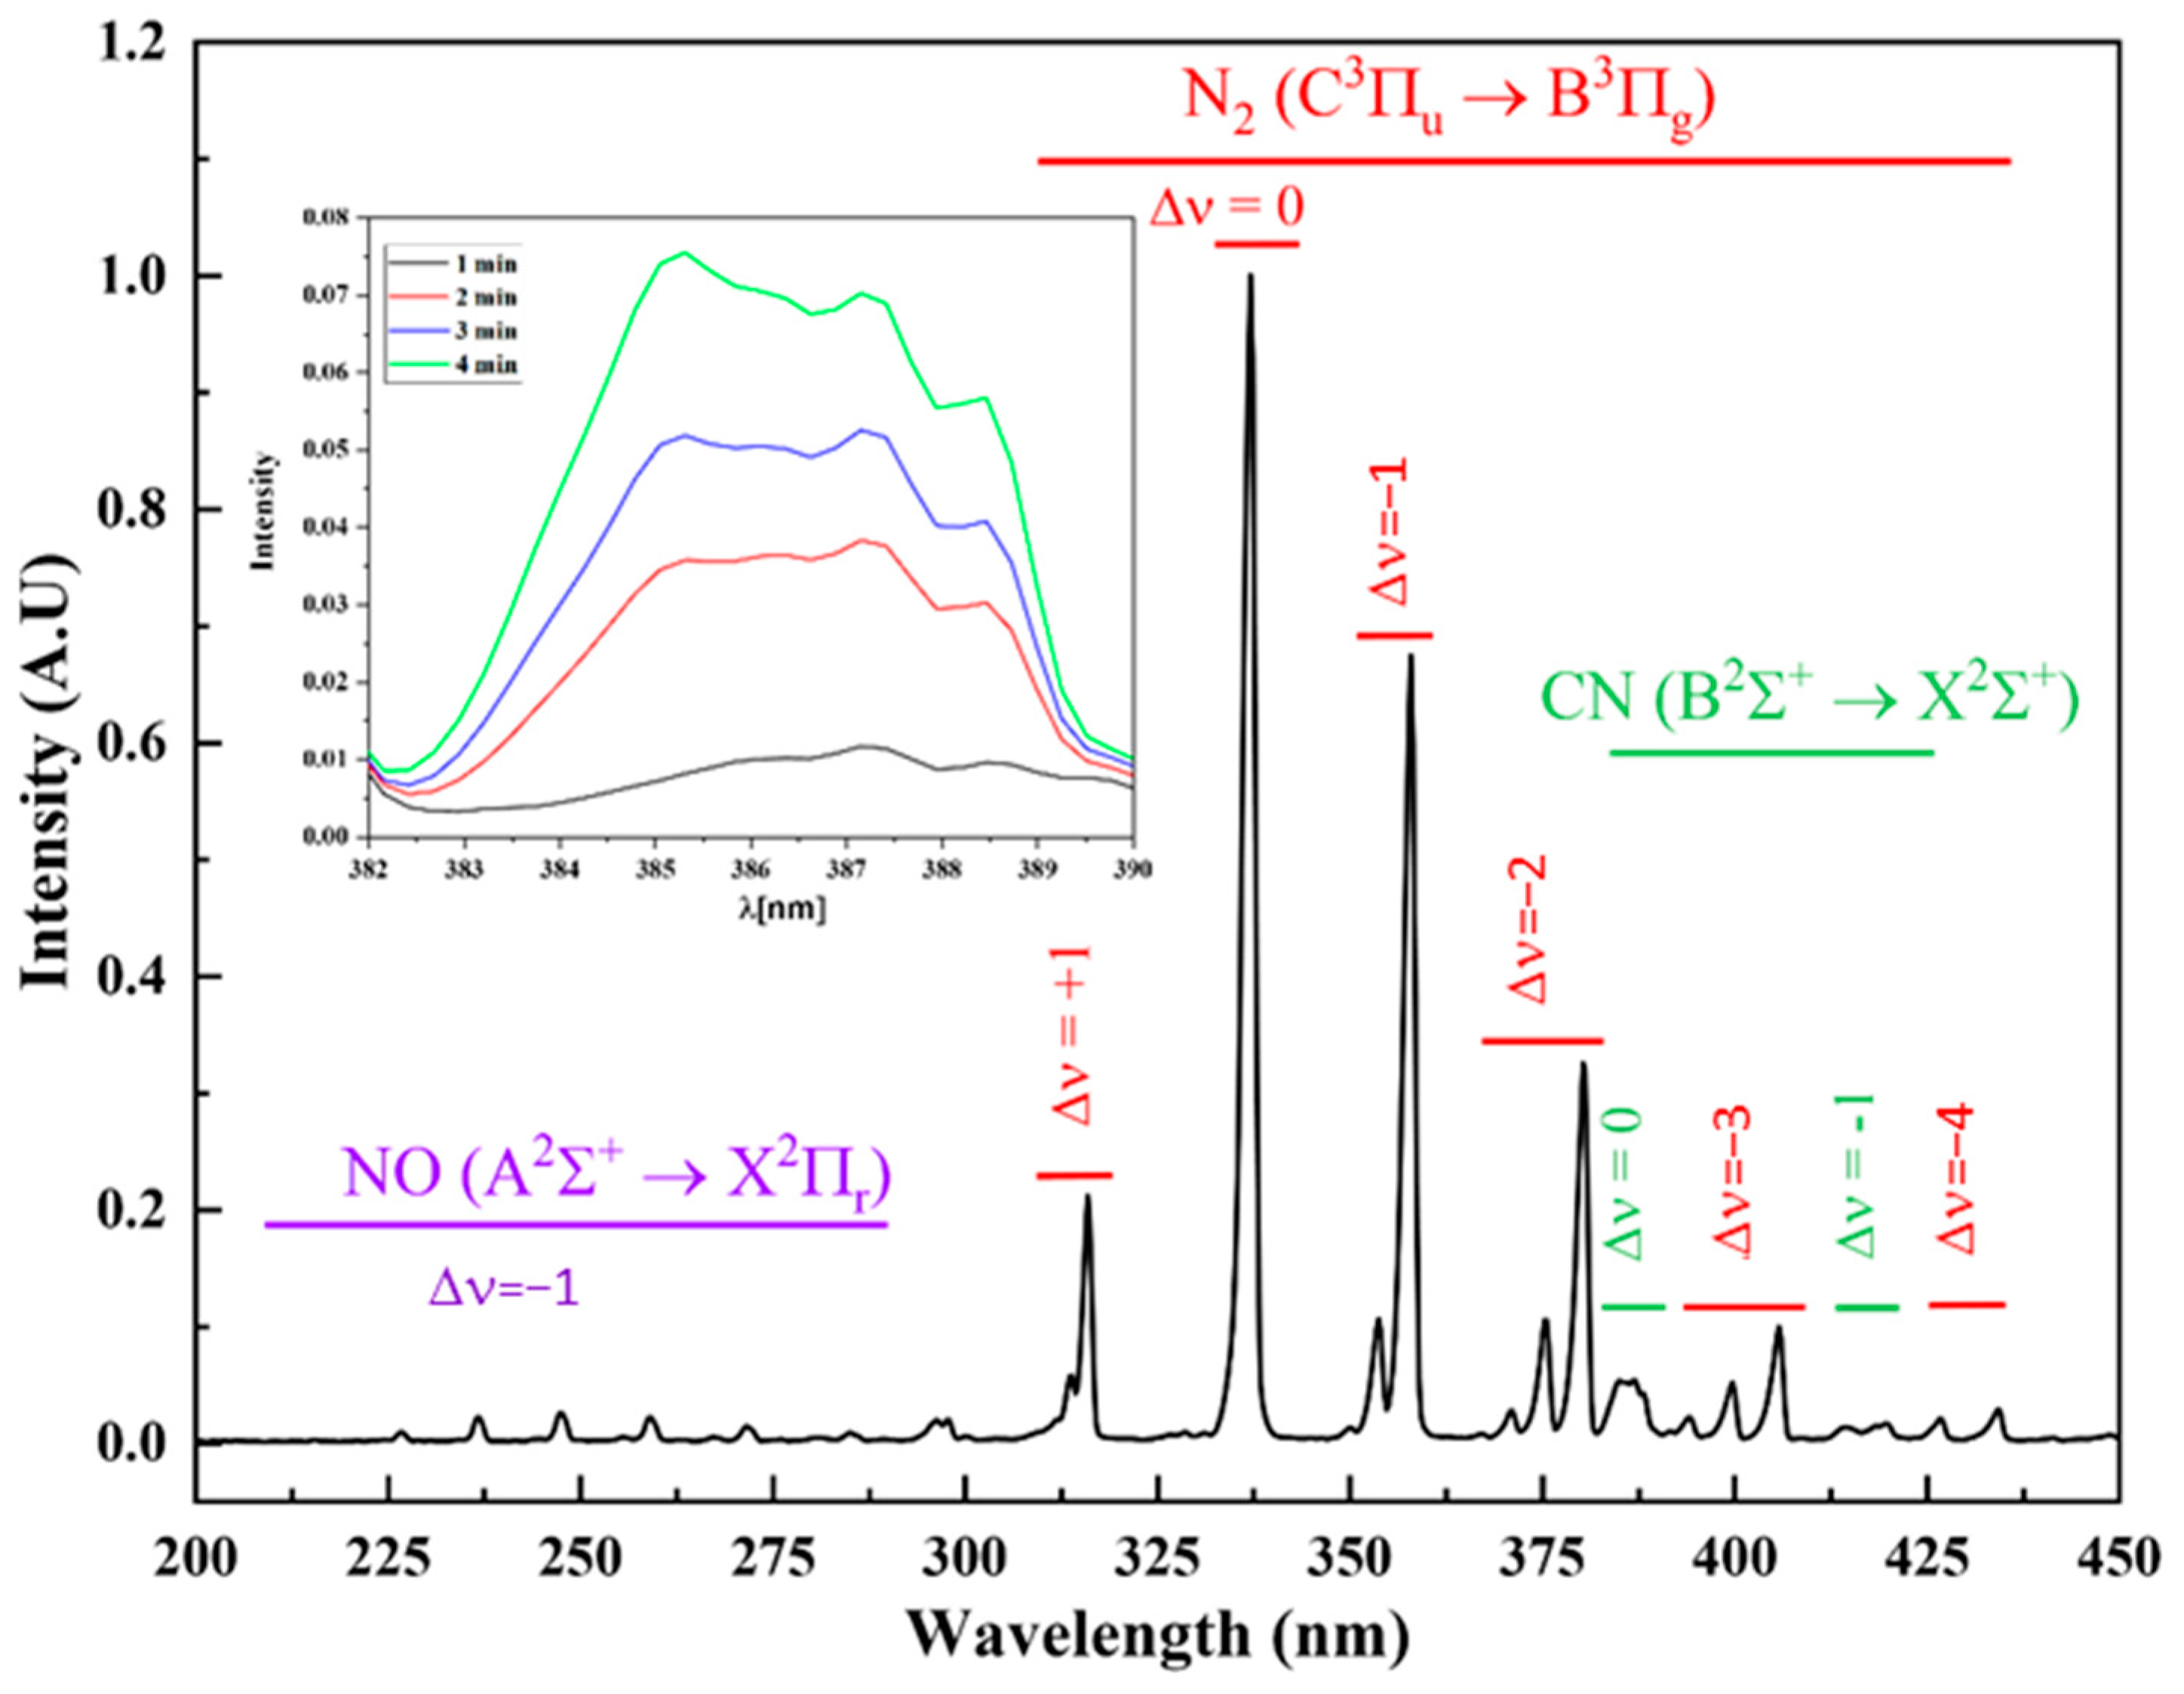
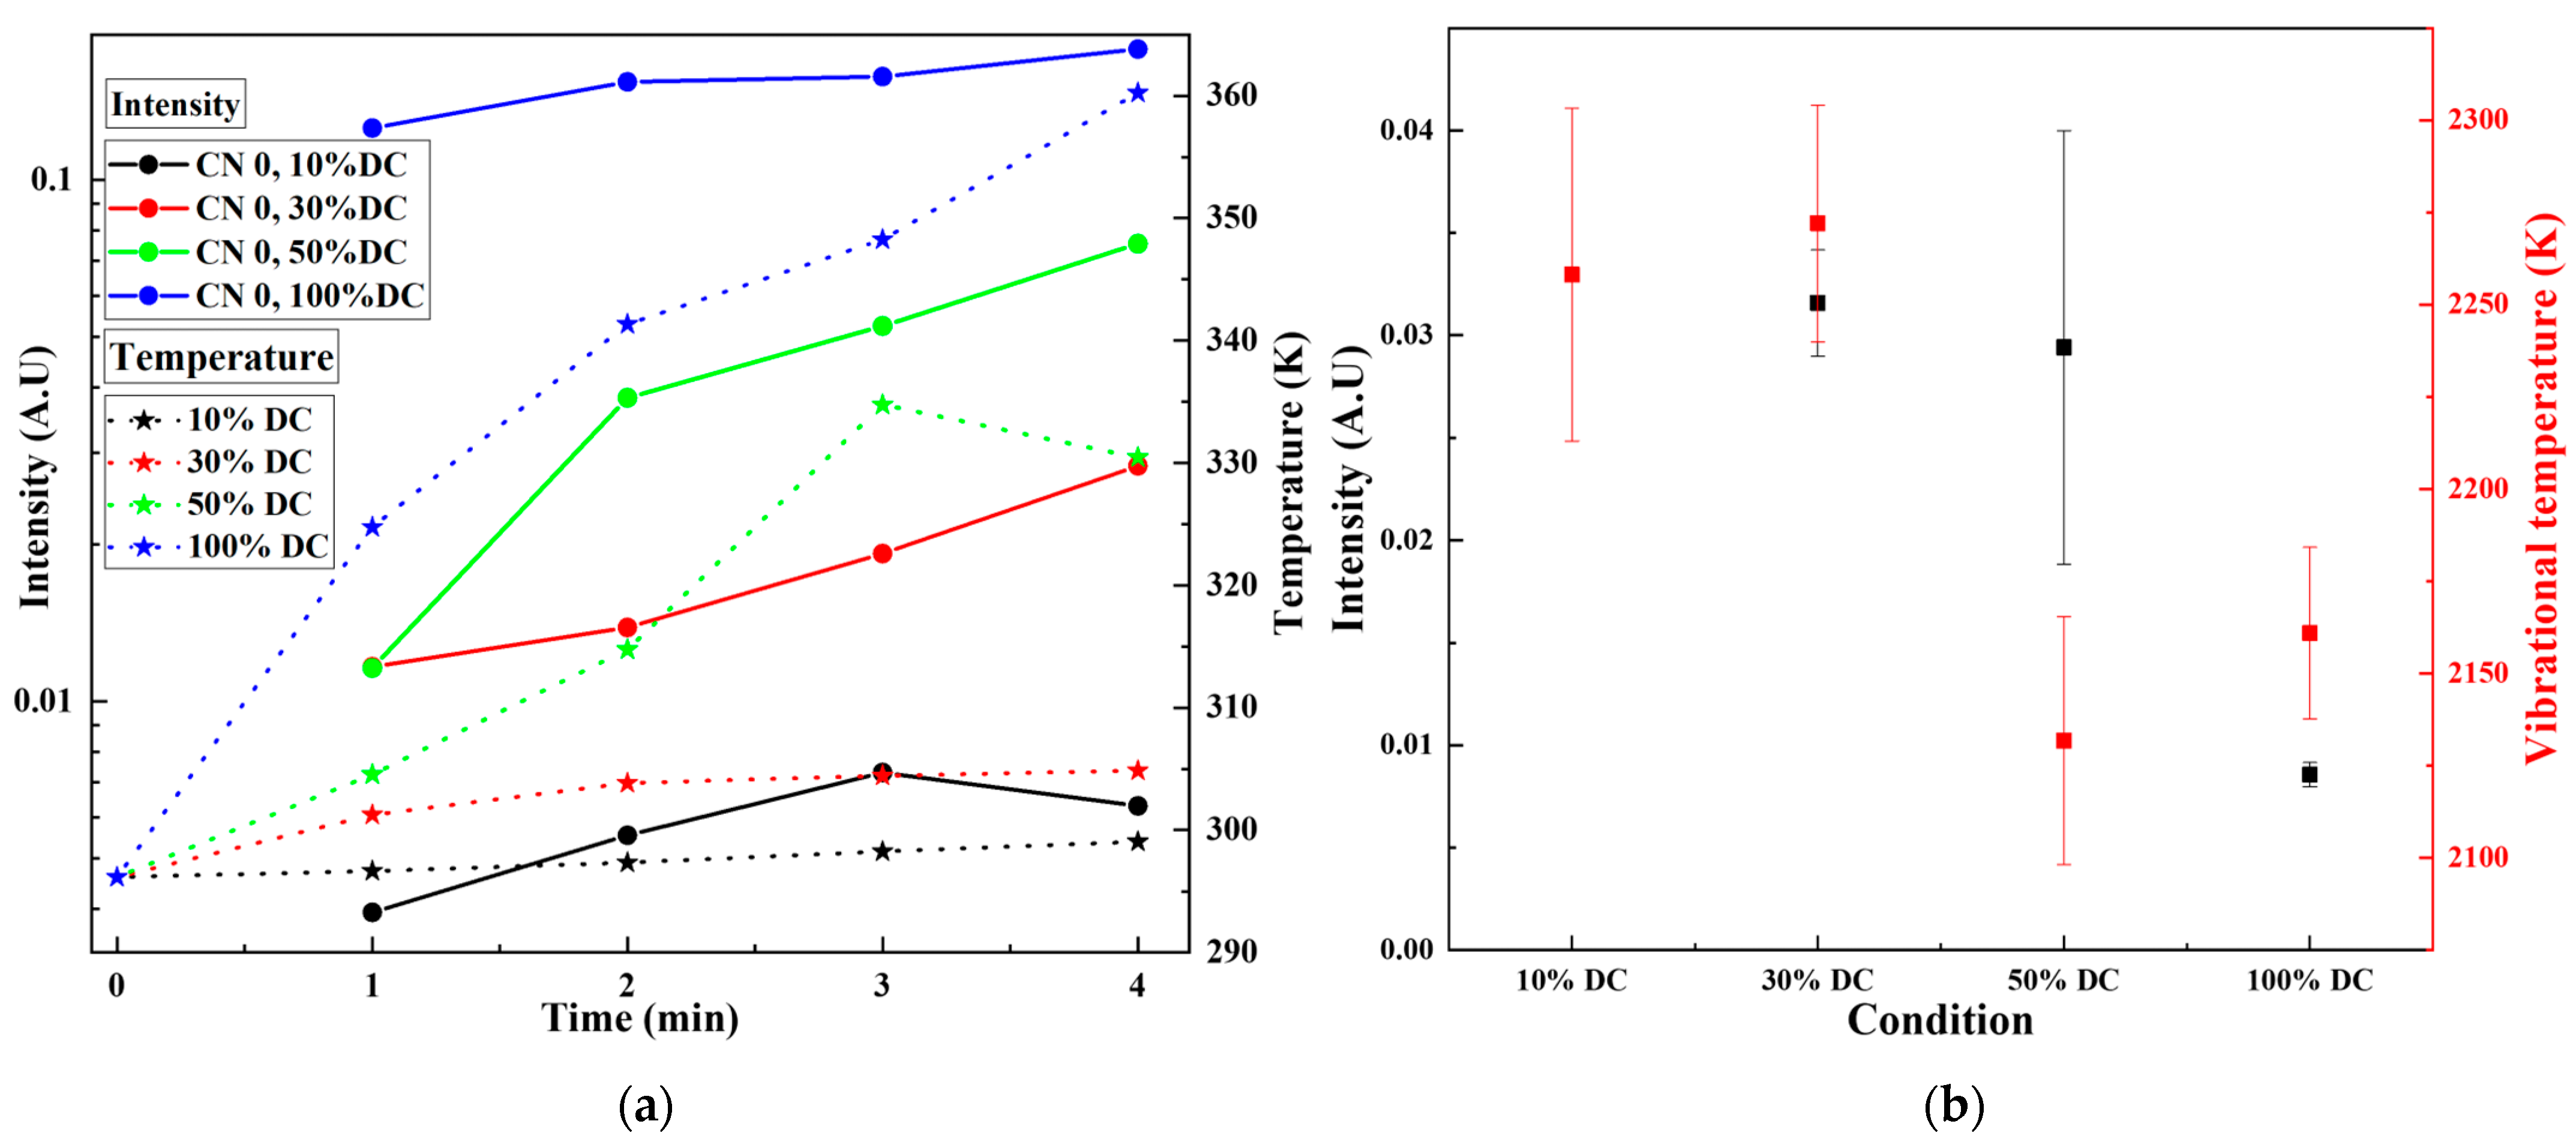
3.1. OES
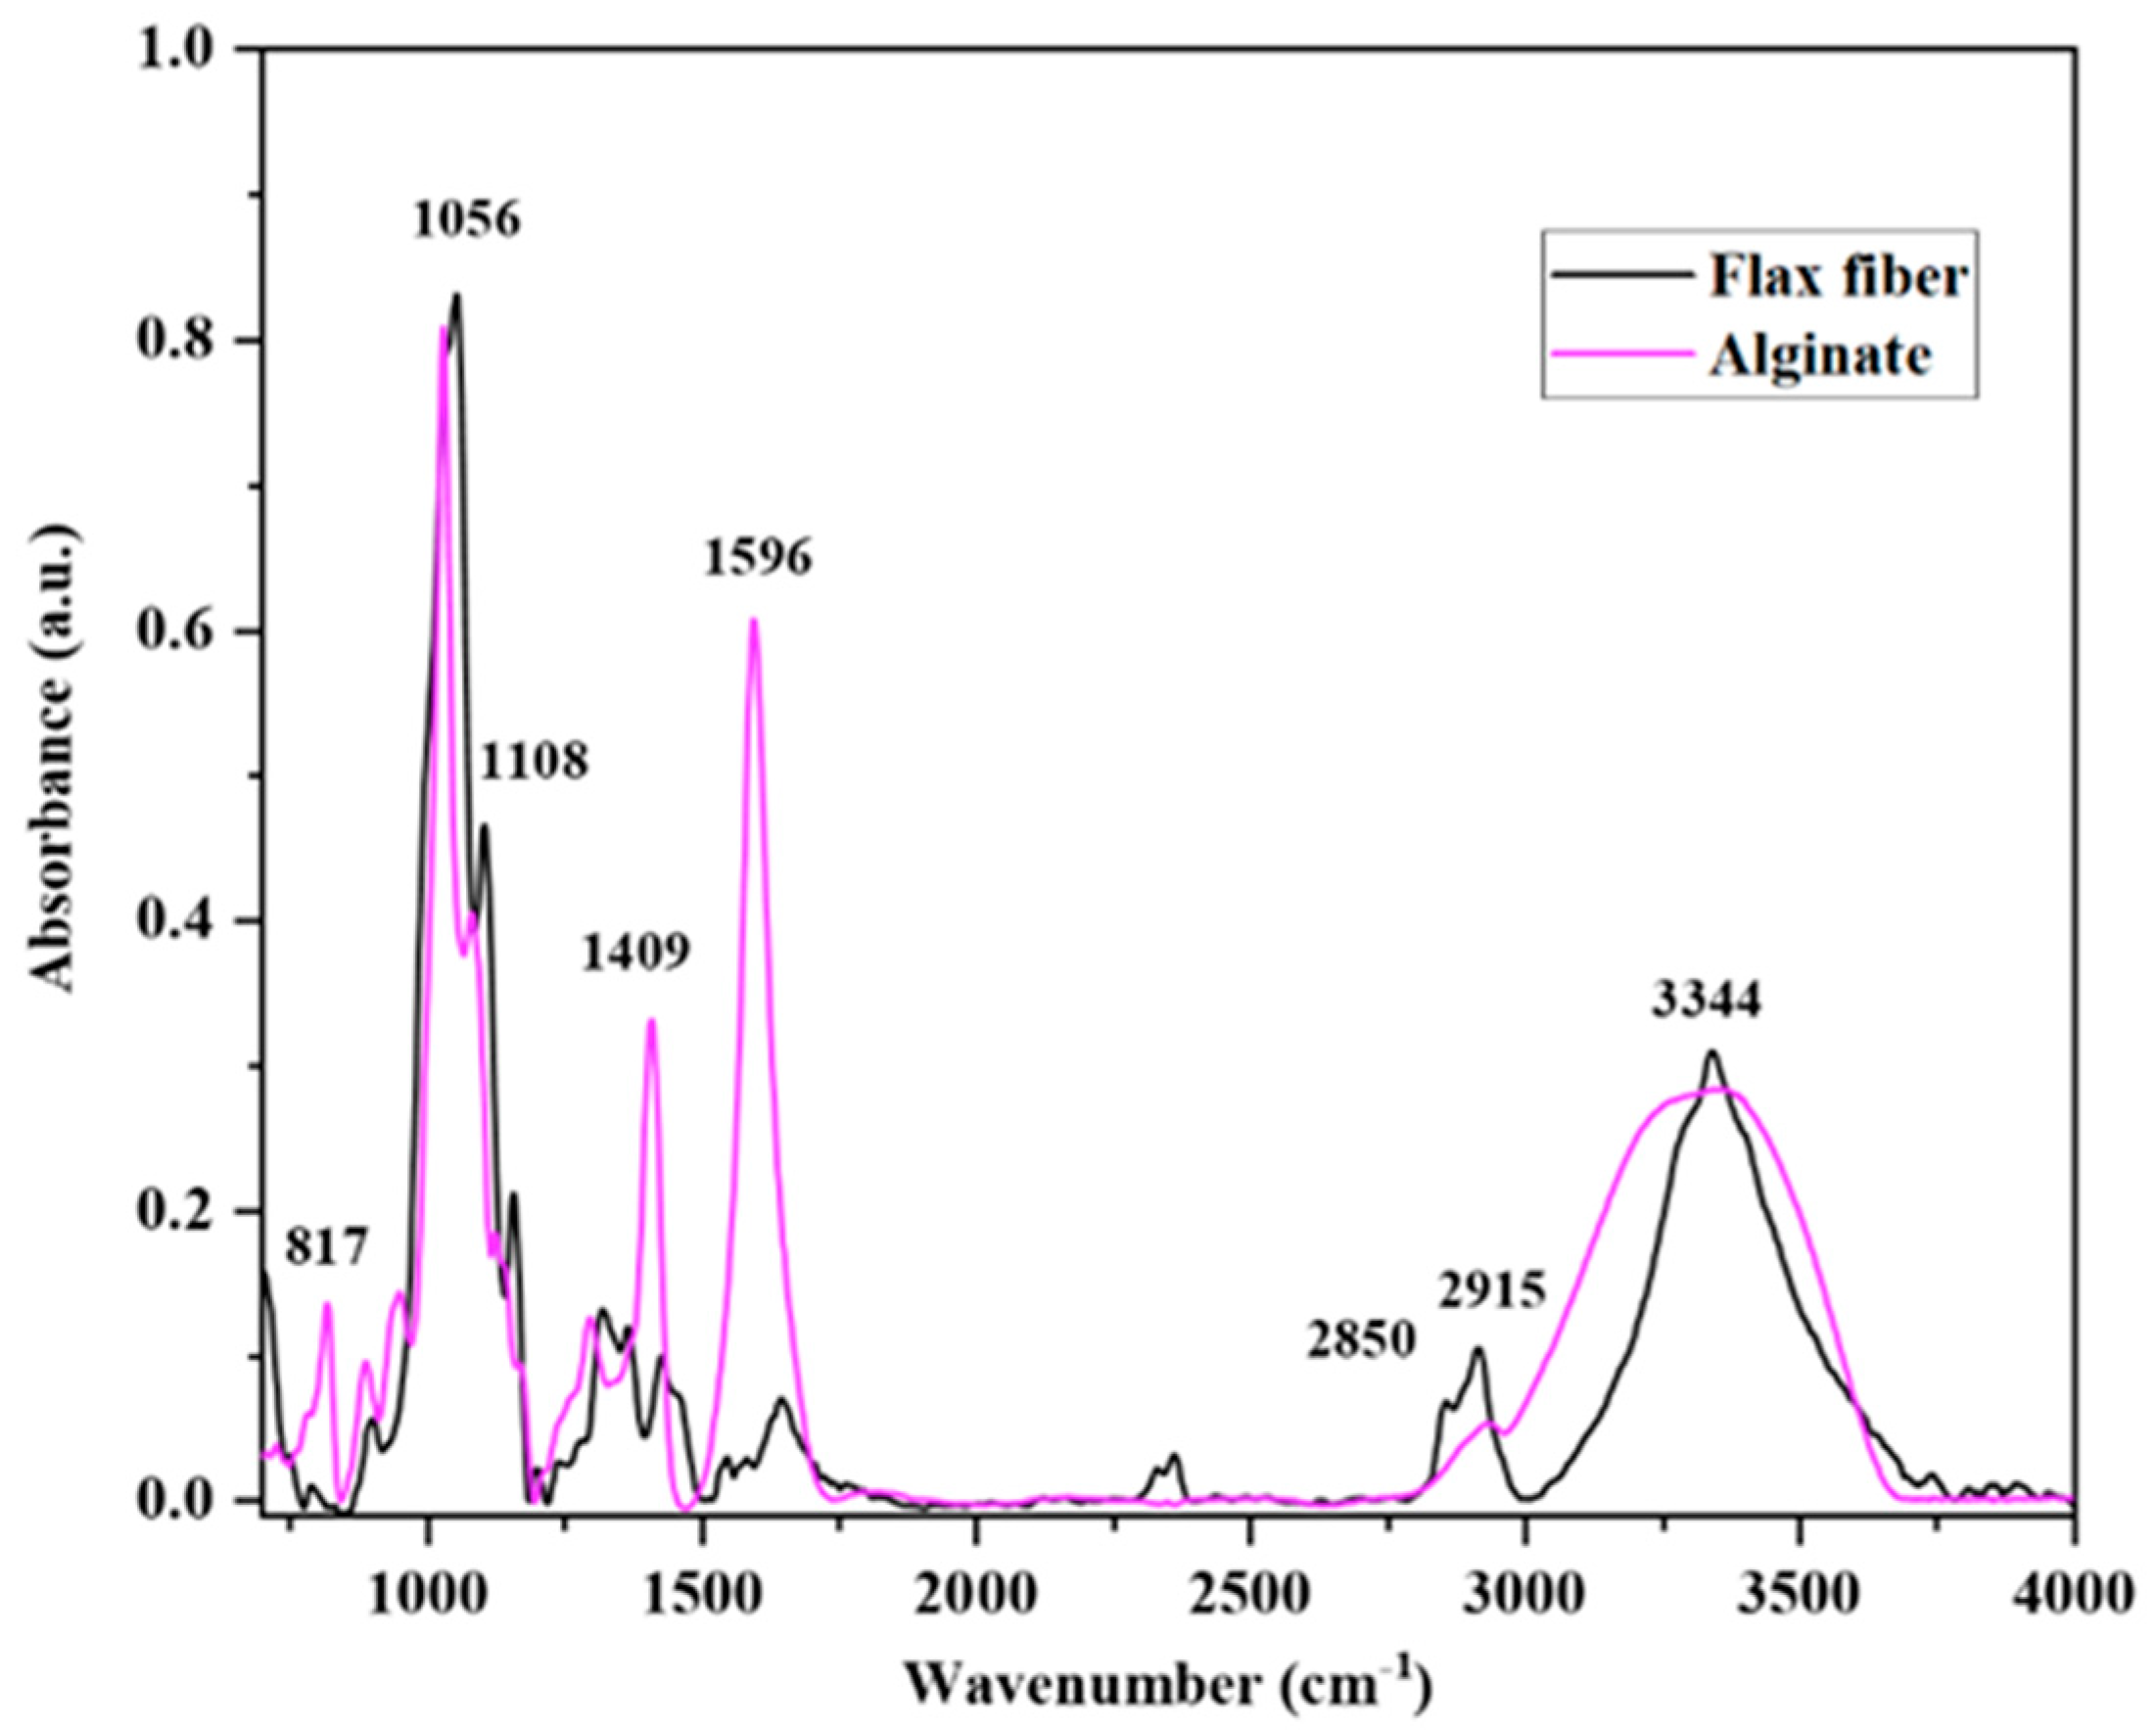
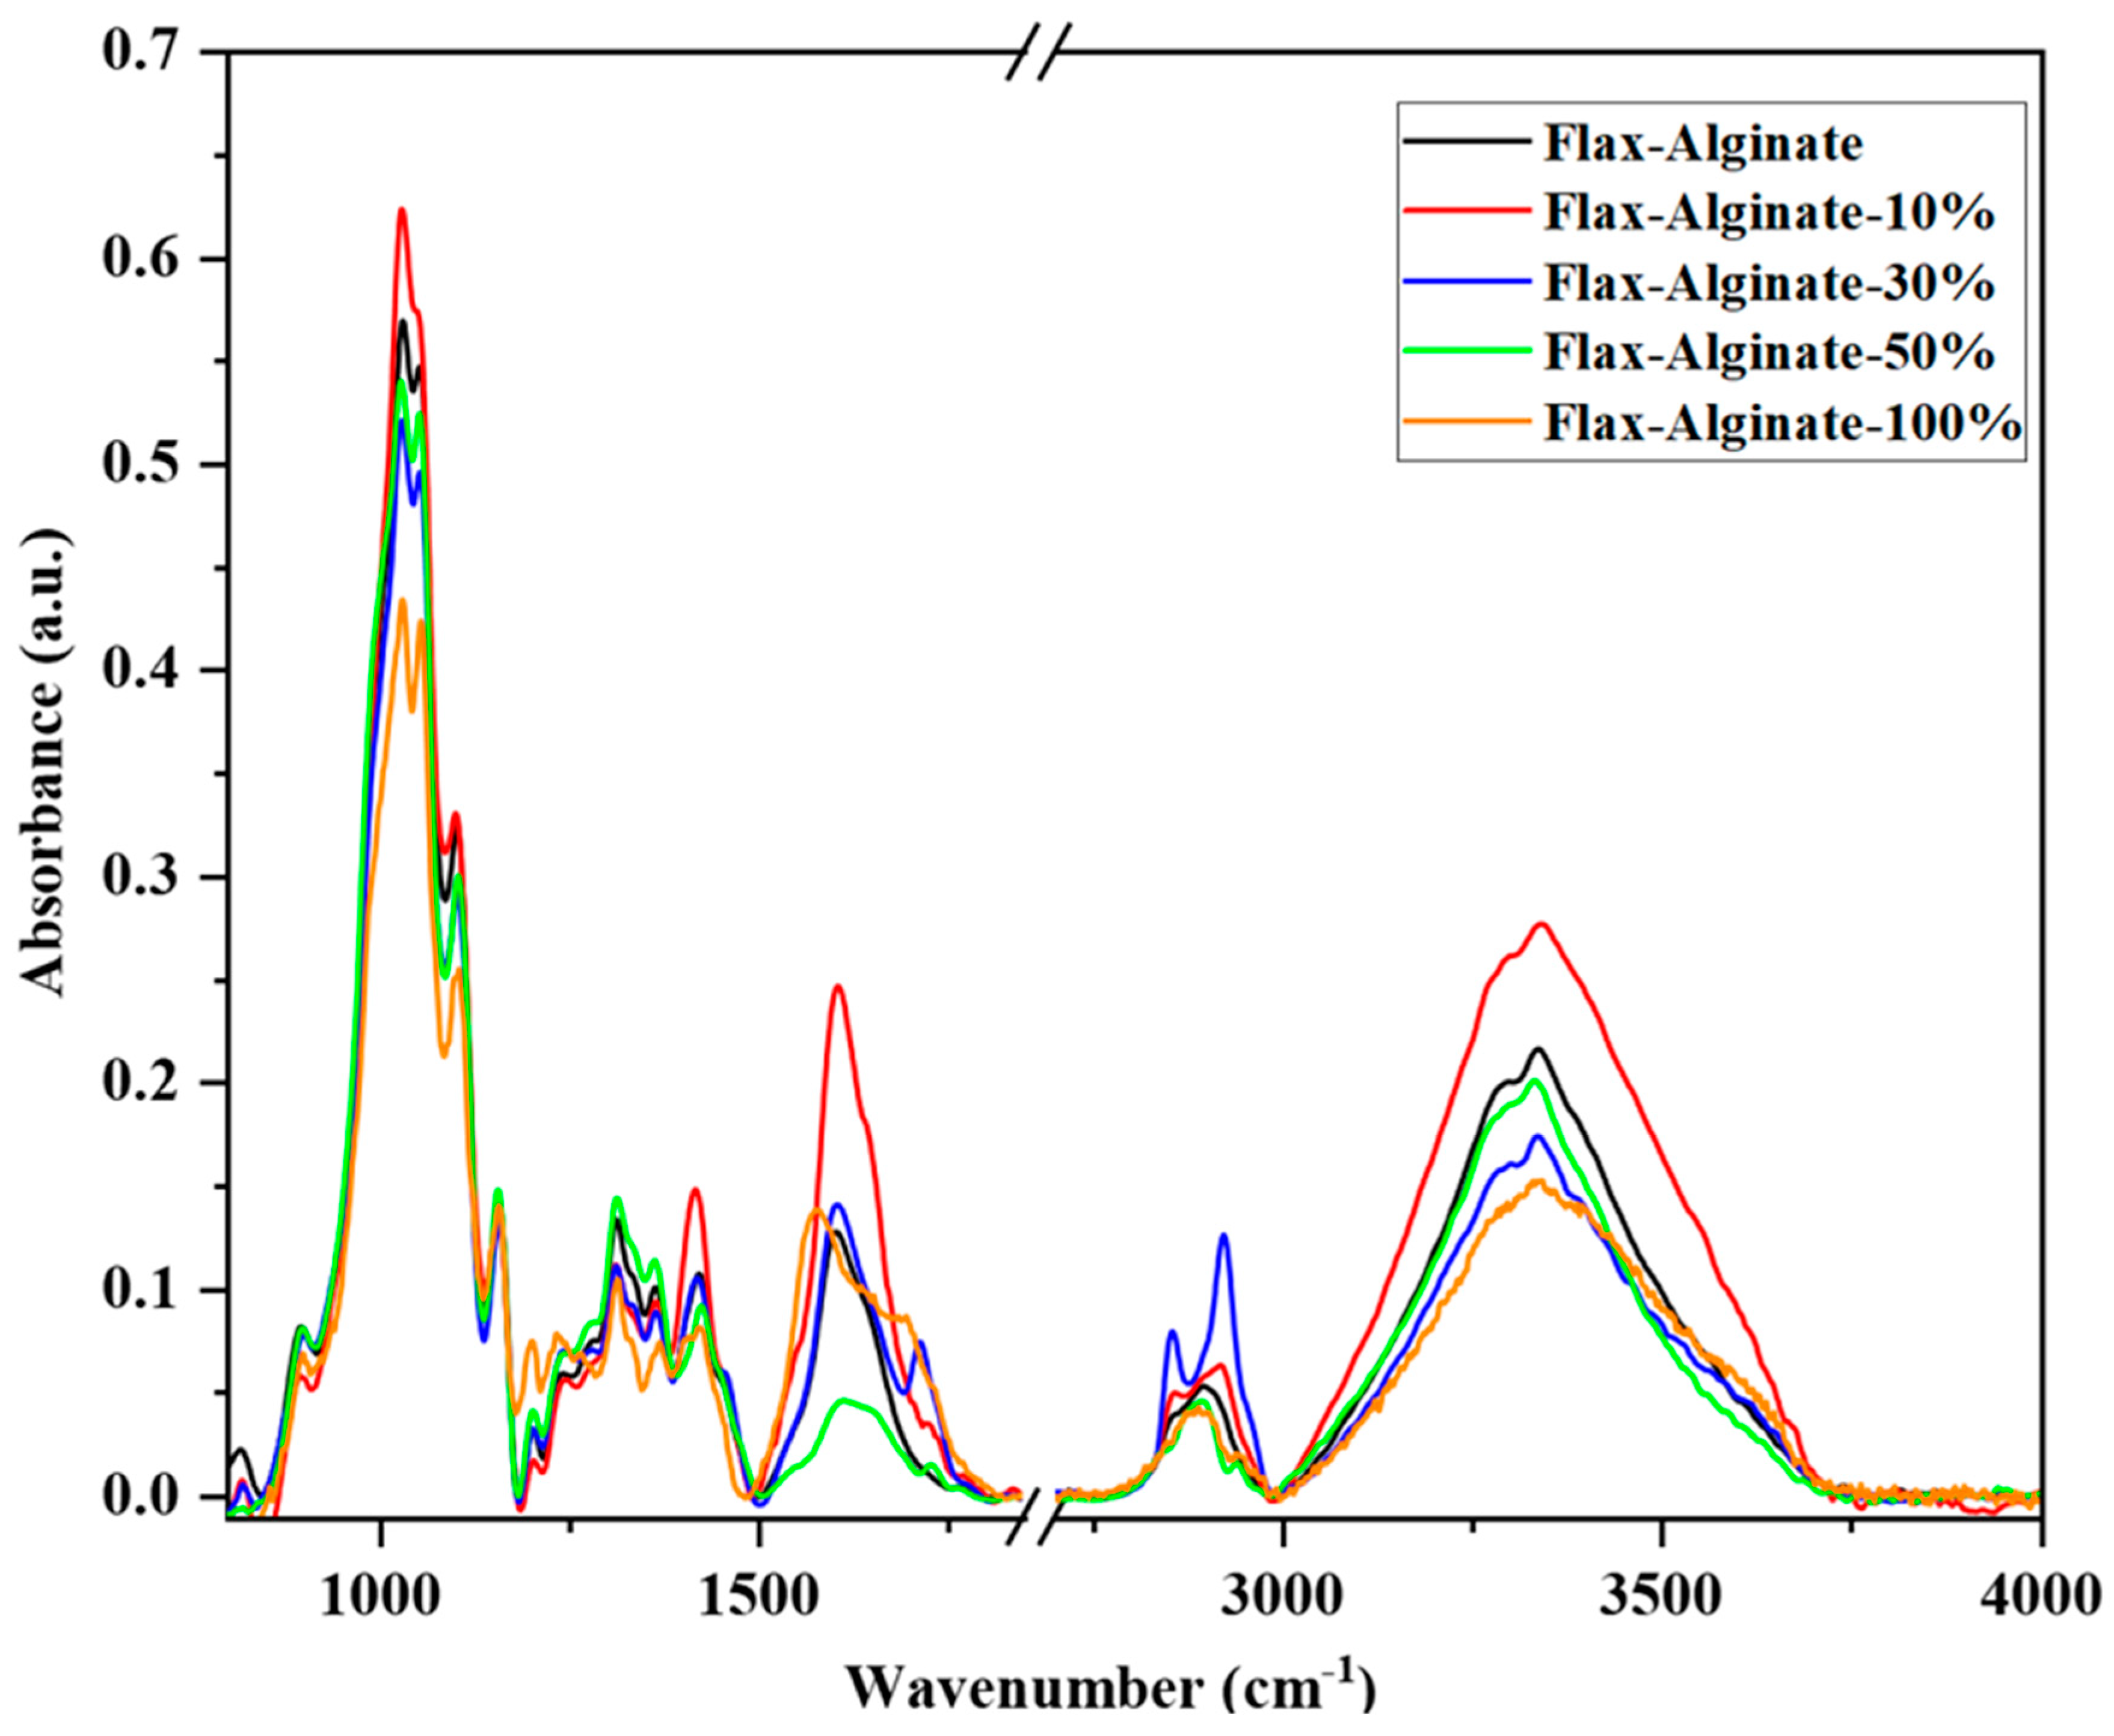
3.2. FTIR of Non-Treated and Treated Samples
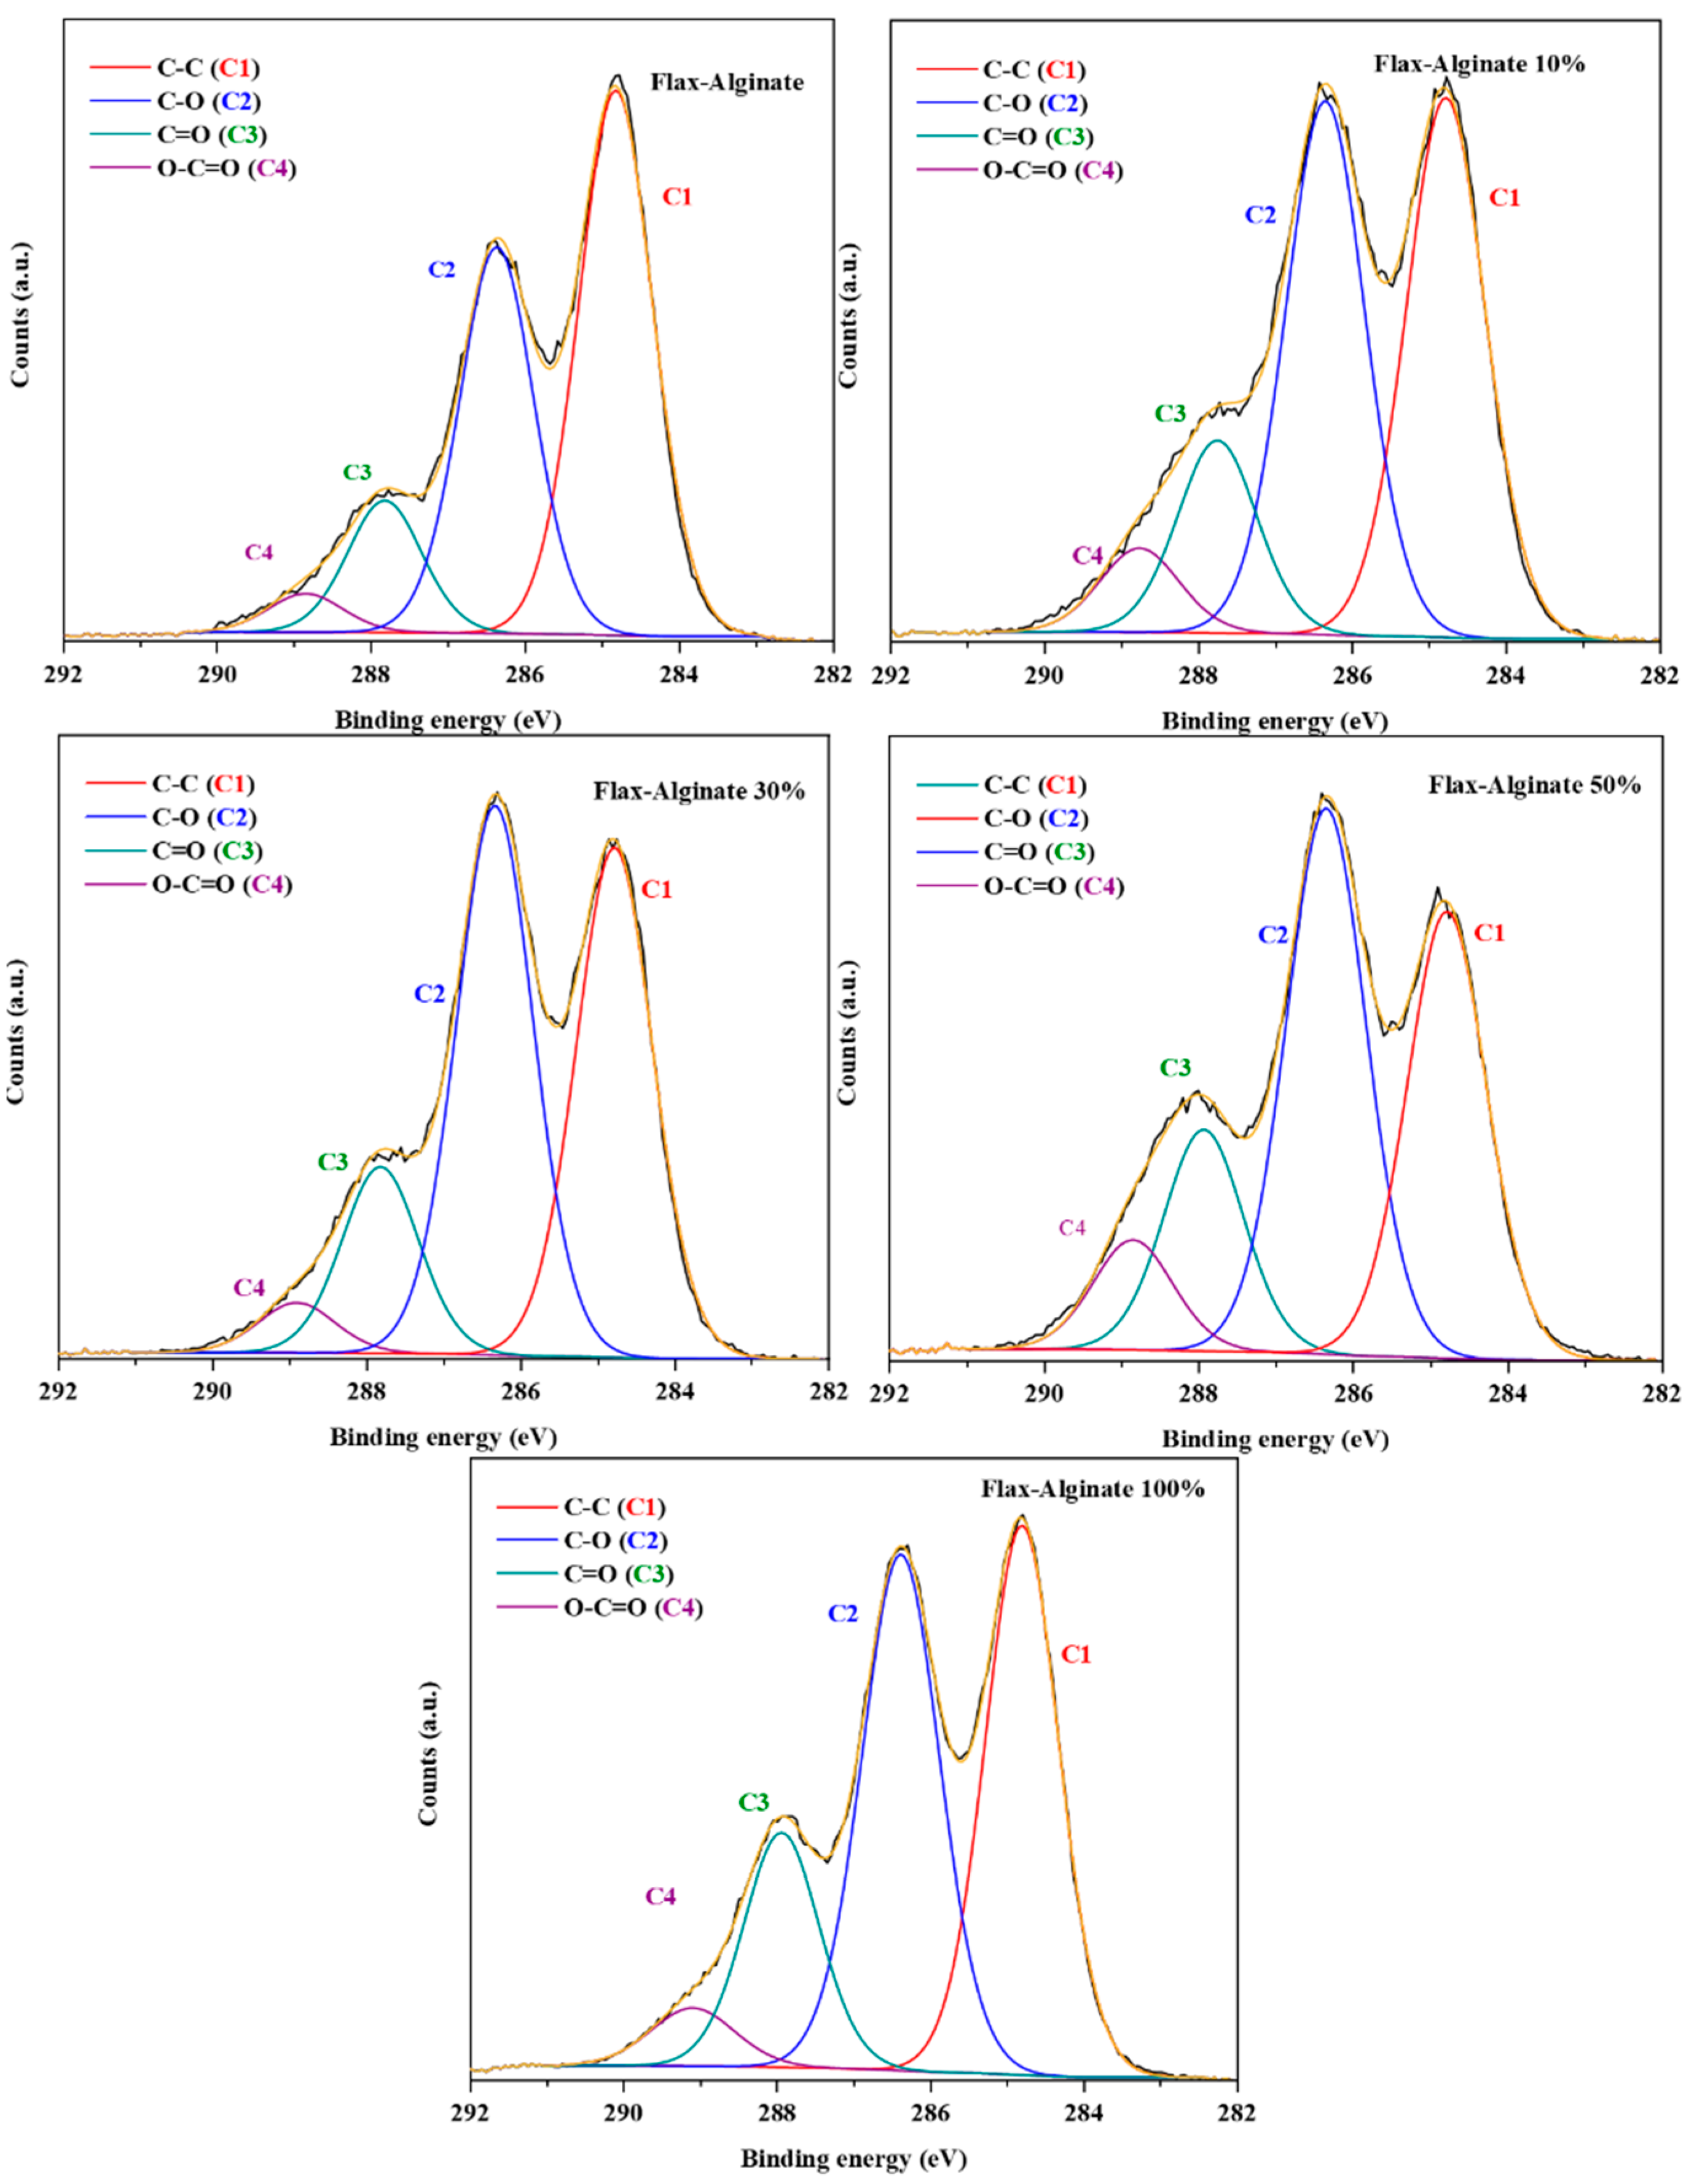
3.3. XPS
3.4. SEM
3.5. DSC
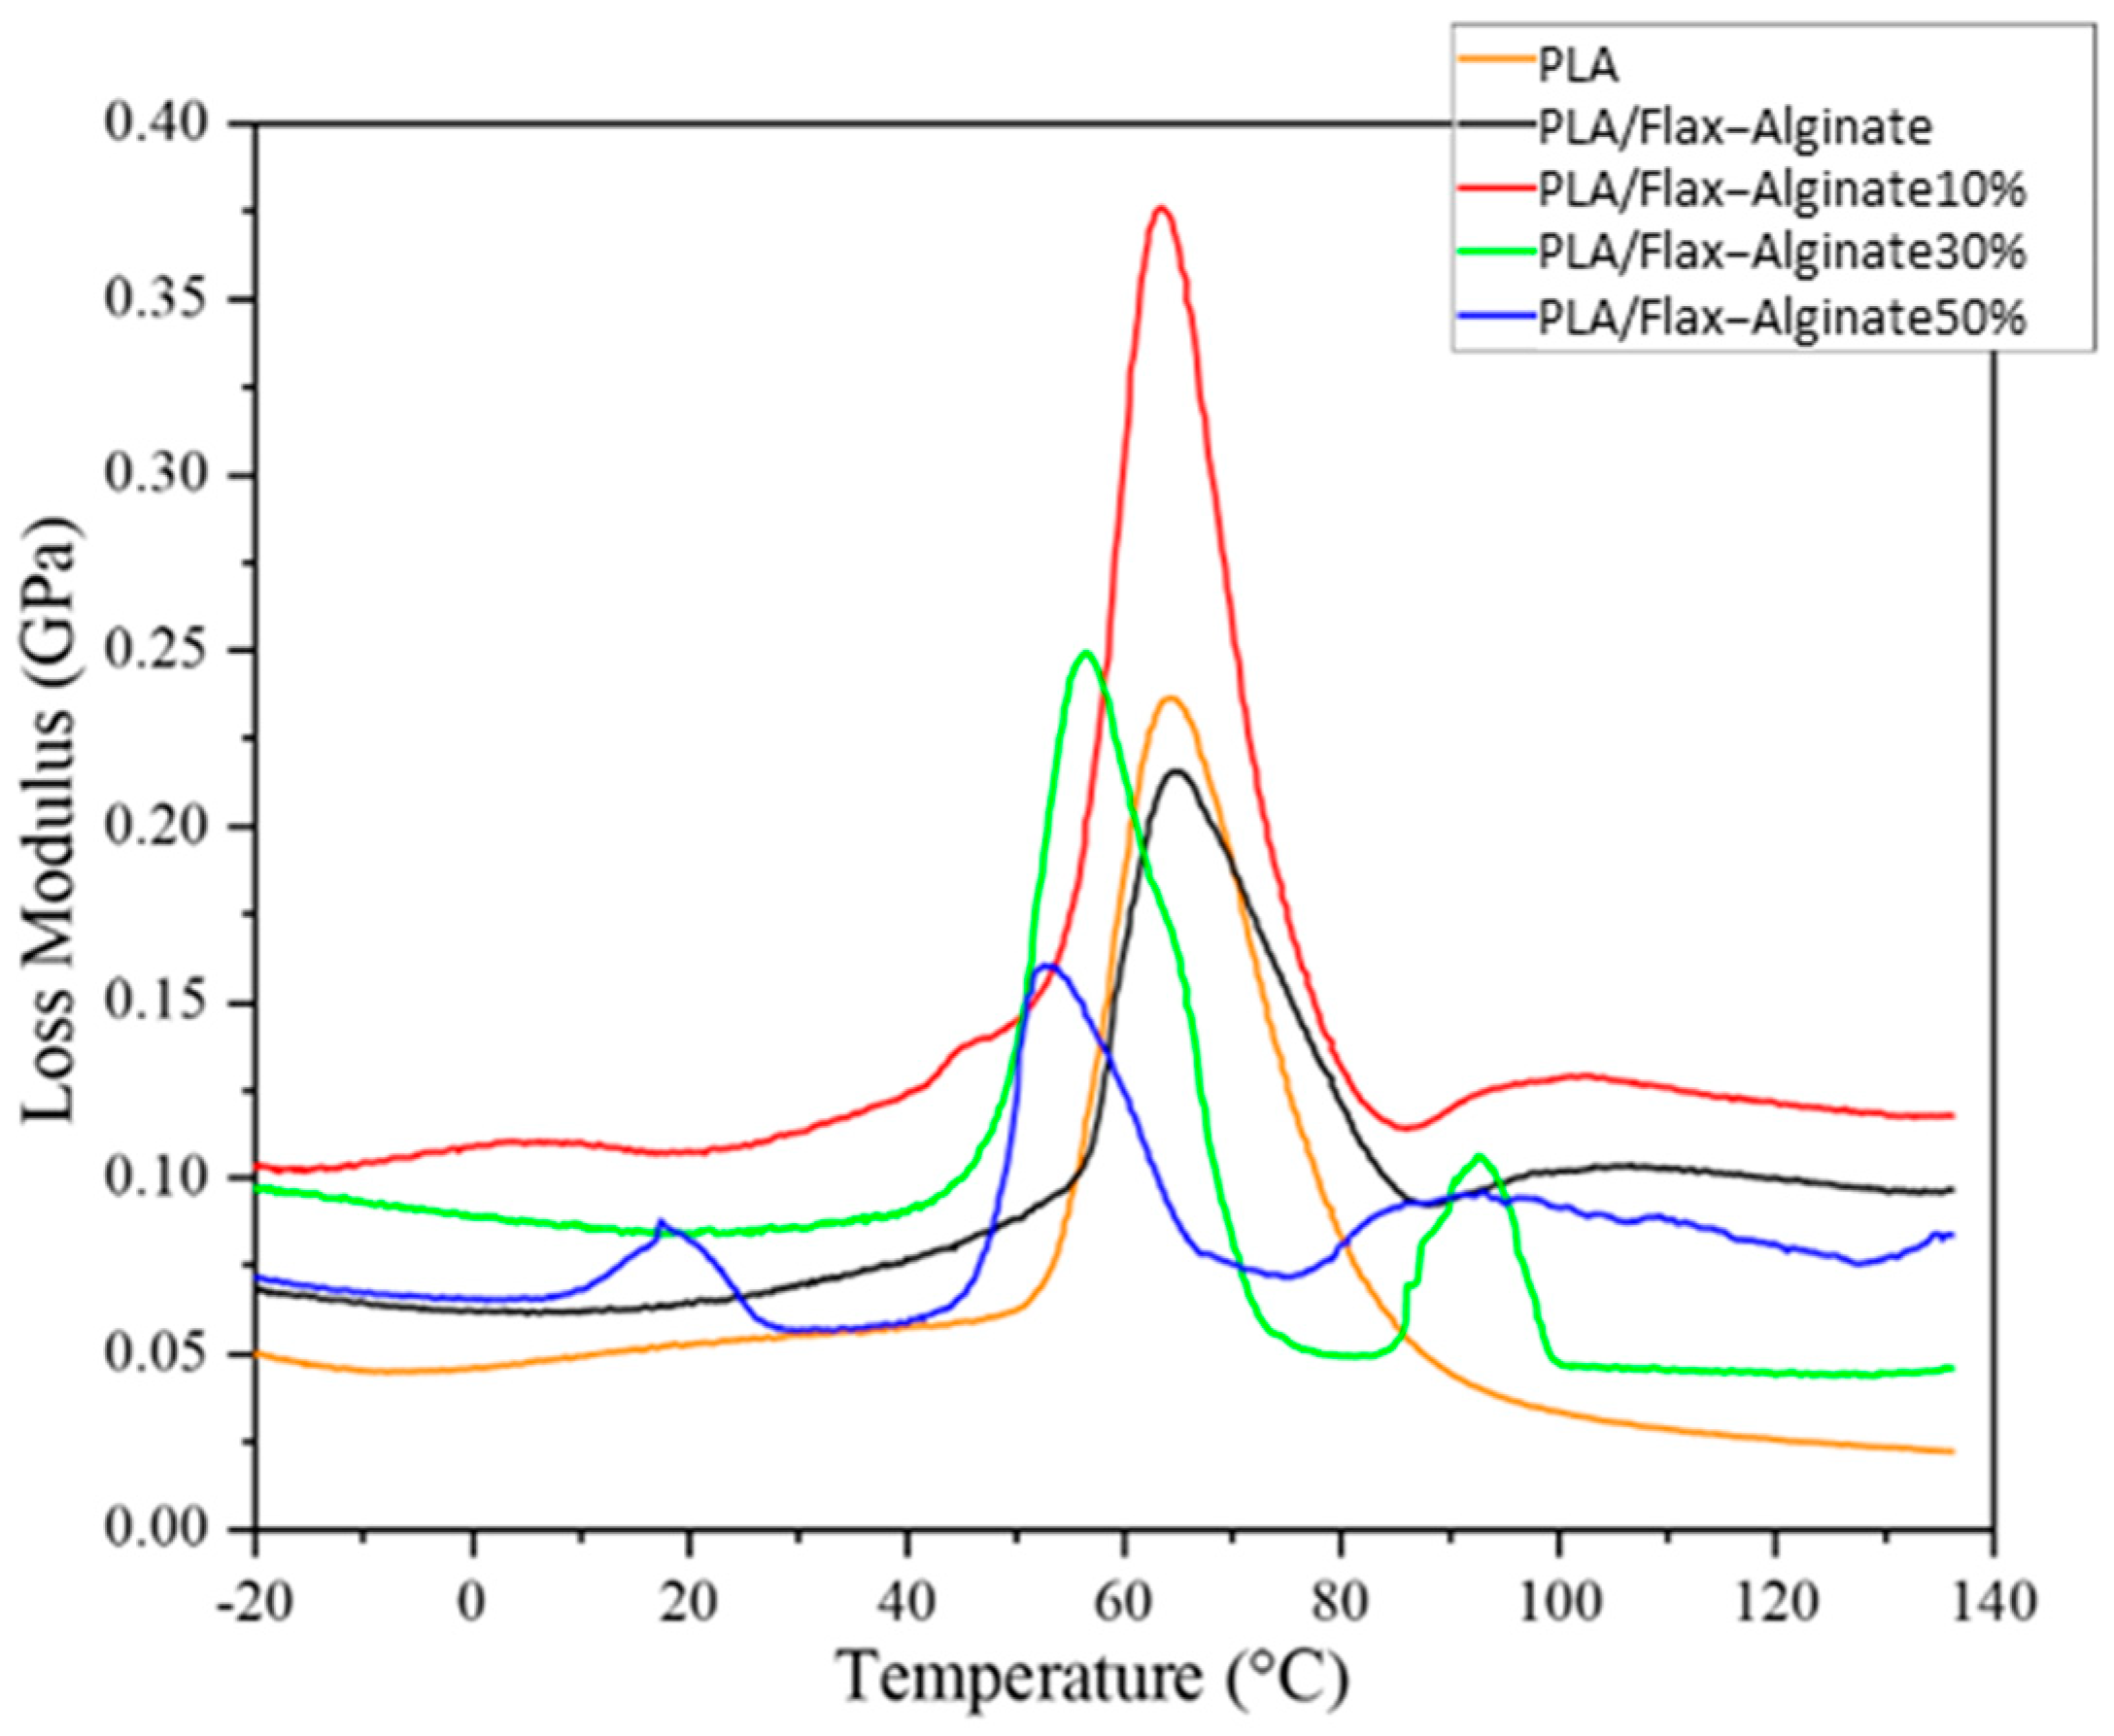
3.6. DMA
4. Conclusions
Author Contributions
Funding
Data Availability Statement
Acknowledgments
Conflicts of Interest
References
- Bernaoui, A.; Lebrun, G.; Ruiz, E. High performance natural fiber composites from mat and UD flax reinforcements backed with a mat Binder: A study of mat fiber surface fibrillation. Compos. Part A Appl. Sci. Manuf. 2022, 160, 107064. [Google Scholar] [CrossRef]
- Natural Fiber Composites Market by Type, Resin Type, Manufacturing Process, End-Use Industry, Region—Global Forecast to 2028. June 2023. Available online: https://www.marketsandmarkets.com/Market-Reports/natural-fiber-composites-market-90779629.html?gclid=CjwKCAjw38SoBhB6EiwA8EQVLonY01ntUZNzlcNJb3aEjuveyaz-wef5uYun9AWe9nNF-div8PEeTRoCmckQAvD_BwE (accessed on 31 June 2023).
- Plakantonaki, S.; Kiskira, K.; Zacharopoulos, N.; Chronis, I.; Coelho, F.; Togiani, A.; Kalkanis, K.; Priniotakis, G. A Review of Sustainability Standards and Ecolabeling in the Textile Industry. Sustainability 2023, 15, 11589. [Google Scholar] [CrossRef]
- Sigaard, A.S.; Laitala, K. Natural and sustainable? Consumers’ textile fiber preferences. Fibers 2023, 11, 12. [Google Scholar] [CrossRef]
- Nassiopoulos, E.; Njuguna, J. Thermo-mechanical performance of poly (lactic acid)/flax fibre-reinforced biocomposites. Mater. Des. 2015, 66, 473–485. [Google Scholar] [CrossRef]
- Sanivada, U.K.; Mármol, G.; Brito, F.; Fangueiro, R. PLA composites reinforced with flax and jute fibers—A review of recent trends, processing parameters and mechanical properties. Polymers 2020, 12, 2373. [Google Scholar] [CrossRef] [PubMed]
- Muñoz, E.; García-Manrique, J.A. Water absorption behaviour and its effect on the mechanical properties of flax fibre reinforced bioepoxy composites. Int. J. Polym. Sci. 2015, 2015, 390275. [Google Scholar] [CrossRef]
- Bayart, M.; Gauvin, F.; Foruzanmehr, M.R.; Elkoun, S.; Robert, M. Mechanical and moisture absorption characterization of PLA composites reinforced with nano-coated flax fibers. Fibers Polym. 2017, 18, 1288–1295. [Google Scholar] [CrossRef]
- Wang, W.; Lowe, A.; Kalyanasundaram, S. Effect of chemical treatments on flax fibre reinforced polypropylene composites on tensile and dome forming behaviour. Int. J. Mol. Sci. 2015, 16, 6202–6216. [Google Scholar] [CrossRef]
- Bozaci, E.; Sever, K.; Sarikanat, M.; Seki, Y.; Demir, A.; Ozdogan, E.; Tavman, I. Effects of the atmospheric plasma treatments on surface and mechanical properties of flax fiber and adhesion between fiber–matrix for composite materials. Compos. Part B Eng. 2013, 45, 565–572. [Google Scholar] [CrossRef]
- Lee, S.G.; Choi, S.S.; Park, W.H.; Cho, D. Characterization of surface modified flax fibers and their biocomposites with PHB. Macromol. Symp. 2003, 197, 089–100. [Google Scholar] [CrossRef]
- Ishak, A.; Sonnier, R.; Otazaghine, B.; Longuet, C. Silazanes, a novel flax fibers functionalization: Effect on silicone-based composites. Compos. Part A Appl. Sci. Manuf. 2023, 166, 107382. [Google Scholar] [CrossRef]
- Koohestani, B.; Darban, A.; Mokhtari, P.; Yilmaz, E.; Darezereshki, E. Comparison of different natural fiber treatments: A literature review. Int. J. Environ. Sci. Technol. 2019, 16, 629–642. [Google Scholar] [CrossRef]
- Babaei, S.; Profili, J.; Asadollahi, S.; Sarkassian, A.; Dorris, A.; Beck, S.; Stafford, L. Analysis of transport phenomena during plasma deposition of hydrophobic coatings on porous cellulosic substrates in plane-to-plane dielectric barrier discharges at atmospheric pressure. Plasma Process. Polym. 2020, 17, 2000091. [Google Scholar] [CrossRef]
- Levasseur, O.; Profili, J.; Gangwar, R.; Naudé, N.; Clergereaux, R.; Gherardi, N.; Stafford, L. Experimental and modelling study of organization phenomena in dielectric barrier discharges with structurally inhomogeneous wood substrates. Plasma Sources Sci. Technol. 2014, 23, 054006. [Google Scholar] [CrossRef]
- Meunier, L.F.; Profili, J.; Babaei, S.; Asadollahi, S.; Sarkissian, A.; Dorris, A.; Beck, S.; Naudé, N.; Stafford, L. Modification of microfibrillated cellulosic foams in a dielectric barrier discharge at atmospheric pressure. Plasma Process. Polym. 2021, 18, 2000158. [Google Scholar] [CrossRef]
- Gupta, R.K.; Guha, P.; Srivastav, P.P. Effect of high voltage dielectric barrier discharge (DBD) atmospheric cold plasma treatment on physicochemical and functional properties of taro (Colocasia esculenta) starch. Int. J. Biol. Macromol. 2023, 253, 126772. [Google Scholar] [CrossRef]
- Moradkhani, G.; Profili, J.; Robert, M.; Laroche, G.; Elkoun, S. Effects of Wet and Dry Treatments on Surface Functional Groups and Mechanical Properties of Flax Fiber Composites. Coatings 2023, 13, 1036. [Google Scholar] [CrossRef]
- Pizzi, A.; Scharfetter, H.; Kes, E.W. Adhesives and techniques open new possibilities for the wood processing industry. I. Experience with tannin based adhesives. Holz Als Roh- Und Werkst. 1981, 39, 85–89. [Google Scholar] [CrossRef]
- Ghaffar, S.H.; Fan, M. Lignin in straw and its applications as an adhesive. Int. J. Adhes. Adhes. 2014, 48, 92–101. [Google Scholar] [CrossRef]
- Nicollin, A.; Kueny, R.; Toniazzo, L.; Pizzi, A. High density biocomposite from natural fibers and tannin resin. J. Adhes. Sci. Technol. 2012, 26, 1537–1545. [Google Scholar] [CrossRef]
- Pizzi, A.; Kueny, R.; Lecoanet, F.; Massetau, B.; Carpentier, D.; Krebs, A.; Loiseau, F.; Molina, S.; Ragoubi, M. High resin content natural matrix–natural fibre biocomposites. Ind. Crops Prod. 2009, 30, 235–240. [Google Scholar] [CrossRef]
- Bayart, M.; Adjallé, K.; Diop, A.; Ovlaque, P.; Barnabé, S.; Robert, M.; Elkoun, S. PLA/flax fiber bio-composites: Effect of polyphenol-based surface treatment on interfacial adhesion and durability. Compos. Interfaces 2021, 28, 287–308. [Google Scholar] [CrossRef]
- El-Gaayda, J.; Titchou, F.E.; Oukhrib, R.; Yap, P.-S.; Liu, T.; Hamdani, M.; Akbour, R.A. Natural flocculants for the treatment of wastewaters containing dyes or heavy metals: A state-of-the-art review. J. Environ. Chem. Eng. 2021, 9, 106060. [Google Scholar] [CrossRef]
- Eslami, Z.; Elkoun, S.; Robert, M.; Adjallé, K. A Review of the Effect of Plasticizers on the Physical and Mechanical Properties of Alginate-Based Films. Molecules 2023, 28, 6637. [Google Scholar] [CrossRef] [PubMed]
- Lacoste, C.; El Hage, R.; Bergeret, A.; Corn, S.; Lacroix, P. Sodium alginate adhesives as binders in wood fibers/textile waste fibers biocomposites for building insulation. Carbohydr. Polym. 2018, 184, 1–8. [Google Scholar] [CrossRef]
- Raus, R.A.; Nawawi, W.M.F.W.; Nasaruddin, R.R. Alginate and alginate composites for biomedical applications. Asian J. Pharm. Sci. 2021, 16, 280–306. [Google Scholar] [CrossRef]
- John, M.J. Biobased alginate treatments on flax fibre reinforced PLA and PHBV composites. Curr. Res. Green Sustain. Chem. 2022, 5, 100319. [Google Scholar] [CrossRef]
- Machala, Z.; Janda, M.; Hensel, K.; Jedlovský, I.; Leštinská, L.; Foltin, V.; Martišovitš, V.; Morvova, M. Emission spectroscopy of atmospheric pressure plasmas for bio-medical and environmental applications. J. Mol. Spectrosc. 2007, 243, 194–201. [Google Scholar] [CrossRef]
- Tyl, C.; Lin, X.; Bouzidi, M.; Dap, S.; Caquineau, H.; Ségur, P.; Gherardi, N.; Naudé, N. Investigation of memory effect in atmospheric pressure dielectric barrier discharge in nitrogen with small oxygen or nitric oxide addition. J. Phys. D Appl. Phys. 2018, 51, 354001. [Google Scholar] [CrossRef]
- Gherardi, N.; Gouda, G.; Gat, E.; Ricard, A.; Massines, F. Transition from glow silent discharge to micro-discharges in nitrogen gas. Plasma Sources Sci. Technol. 2000, 9, 340. [Google Scholar] [CrossRef]
- Massines, F.; Segur, P.; Gherardi, N.; Khamphan, C.; Ricard, A. Physics and chemistry in a glow dielectric barrier discharge at atmospheric pressure: Diagnostics and modelling. Surf. Coat. Technol. 2003, 174, 8–14. [Google Scholar] [CrossRef]
- Masoud, N.; Martus, K.; Figus, M.; Becker, K. Rotational and vibrational temperature measurements in a high-pressure cylindrical dielectric barrier discharge (C-DBD). Contrib. Plasma Phys. 2005, 45, 32–39. [Google Scholar] [CrossRef]
- Lawrie, G.; Keen, I.; Drew, B.; Chandler-Temple, A.; Rintoul, L.; Fredericks, P.; Grøndahl, L. Interactions between alginate and chitosan biopolymers characterized using FTIR and XPS. Biomacromolecules 2007, 8, 2533–2541. [Google Scholar] [CrossRef] [PubMed]
- Aprilliza, M. Characterization and properties of sodium alginate from brown algae used as an ecofriendly superabsorbent. In Proceedings of the International Symposium on Current Progress in Functional Materials, Bali, Indonesia, 26–27 July 2016; IOP Conference Series: Materials Science and Engineering. IOP Publishing: Bristol, UK, 2016; p. 012019. [Google Scholar]
- Badita, C.; Aranghel, D.; Burducea, C.; Mereuta, P. Characterization of sodium alginate based films. Rom. J. Phys 2020, 65, 1–8. [Google Scholar]
- Ferreira, D.P.; Cruz, J.; Fangueiro, R. Surface modification of natural fibers in polymer composites. In Green Composites for Automotive Applications; Elsevier: Amsterdam, The Netherlands, 2019; pp. 3–41. [Google Scholar]
- Kramar, A.D.; Obradović, B.M.; Schiehser, S.; Potthast, A.; Kuraica, M.M.; Kostić, M.M. Enhanced antimicrobial activity of atmospheric pressure plasma treated and aged cotton fibers. J. Nat. Fibers 2022, 19, 7391–7405. [Google Scholar] [CrossRef]
- Akindoyo, J.O.; Beg, M.D.; Ghazali, S.; Heim, H.P.; Feldmann, M. Effects of surface modification on dispersion, mechanical, thermal and dynamic mechanical properties of injection molded PLA-hydroxyapatite composites. Compos. Part A Appl. Sci. Manuf. 2017, 103, 96–105. [Google Scholar] [CrossRef]
- Gholami, M.; Ahmadi, M.S.; Tavanaie, M.A.; Khajeh Mehrizi, M. Effect of oxygen plasma treatment on tensile strength of date palm fibers and their interfacial adhesion with epoxy matrix. Sci. Eng. Compos. Mater. 2018, 25, 993–1001. [Google Scholar] [CrossRef]
- Rasch, R.; Stricher, A.; Truss, R.W. Energy filtered low voltage “in lens detector” SEM and XPS of natural fiber surfaces. J. Appl. Polym. Sci. 2014, 131, 39572. [Google Scholar] [CrossRef]
- Mukherjee, A.; Okolie, J.A.; Niu, C.; Dalai, A.K. Experimental and modeling studies of torrefaction of spent coffee grounds and coffee husk: Effects on surface chemistry and carbon dioxide capture performance. ACS Omega 2021, 7, 638–653. [Google Scholar] [CrossRef]
- Awada, H.; Elchinger, P.-H.; Faugeras, P.-A.; Zerrouki, C.; Montplaisir, D.; Brouillette, F.; Zerrouki, R. Chemical modification of kraft cellulose fibres: Influence of pretreatment on paper properties. BioResources 2015, 10, 2044–2056. [Google Scholar] [CrossRef]
- Liu, M.; Meng, Q.; Niu, C.; Wang, Y.; Zhou, G.; Xu, C.; Liu, Y. Preparation and characterization of modified dual network dust suppression gel based on sodium alginate and soluble starch. Environ. Sci. Pollut. Res. 2022, 29, 69771–69784. [Google Scholar] [CrossRef]
- Tam, S.K.; Dusseault, J.; Polizu, S.; Ménard, M.; Hallé, J.-P. Physicochemical model of alginate–poly-l-lysine microcapsules defined at the micrometric/nanometric scale using ATR-FTIR, XPS, and ToF-SIMS. Biomaterials 2005, 26, 6950–6961. [Google Scholar] [CrossRef] [PubMed]
- Milaniak, N.; Laroche, G.; Massines, F. Fourier-transform infrared spectroscopy of ethyl lactate decomposition and thin-film coating in a filamentary and a glow dielectric barrier discharge. Plasma Process. Polym. 2021, 18, 2000248. [Google Scholar] [CrossRef]
- Zhuoda, J. Effects of plasma treatment of carbon fibers on interfacial properties of BMI resin composites. Surf. Interface Anal. 2019, 51, 458–464. [Google Scholar] [CrossRef]
- Borcia, G.; Anderson, C.; Brown, N. Surface treatment of natural and synthetic textiles using a dielectric barrier discharge. Surf. Coat. Technol. 2006, 201, 3074–3081. [Google Scholar] [CrossRef]
- El-Zeer, D.M.; Salem, A.A.; Rashed, U.M.; Abd Elbaset, T.A.; Ghalab, S. A comparative study between the filamentary and glow modes of DBD plasma in the treatment of wool fibers. Int. J. Eng. Res. Appl. 2014, 4, 1. [Google Scholar]
- Foruzanmehr, M.; Vuillaume, P.Y.; Elkoun, S.; Robert, M. Physical and mechanical properties of PLA composites reinforced by TiO2 grafted flax fibers. Mater. Des. 2016, 106, 295–304. [Google Scholar] [CrossRef]
- Gao, C.; Guo, J.; Xie, H. The effect of alginate on the mechanical, thermal, and rheological properties of nano calcium carbonate-filled polylactic acid composites. Polym. Eng. Sci. 2019, 59, 1882–1888. [Google Scholar] [CrossRef]
- McCrum, N.G.; Buckley, C.P.; Bucknall, C.B. Principles of Polymer Engineering; Oxford University Press: Oxford, UK, 1997. [Google Scholar]
- Hearle, J.W.; Morton, W.E. Physical Properties of Textile Fibres; Elsevier: Amsterdam, The Netherlands, 2008. [Google Scholar]


| Wavenumber (cm−1) | Flax Fiber Attribution | Sodium Alginate Attribution |
|---|---|---|
| 3344 | Hydroxyl (OH) stretching vibrations | Hydroxyl (OH) stretching vibrations |
| 2915 | CH2 asymmetrical stretching | CH2 asymmetrical stretching |
| 2850 | CH2 symmetrical stretching | CH2 symmetrical stretching |
| 1646 | Water molecule vibrational mode | Water molecule vibrational mode |
| 1596 | Asymmetric stretching of COO- groups | |
| 1432 | C–H3 asymmetric deformation in lignin | |
| 1409 | Symmetric stretching of COO- groups | |
| 1370 | Microcrystalline cellulose vibrations | |
| 1335 | Microcrystalline cellulose vibrations | |
| 1315 | Microcrystalline cellulose vibrations | |
| 1270 | C-O stretching in ester groups | |
| 1160 | Polysaccharides in cellulose (ring breathing) | |
| 1108 | Glycosidic ether band | Glycosidic ether band |
| 1056 | C-O-C pyranose ring skeletal vibrations | |
| 1033 | C-O-C pyranose ring skeletal vibrations | |
| 950 | Guluronic acids in sodium alginate | |
| 900 | β-glycosidic linkages in cellulose | |
| 888 | Mannuronic acids in sodium alginate | |
| 817 | Mannuronic acids in sodium alginate |
| Sample Name | C | O | N | Na | O/C |
|---|---|---|---|---|---|
| Flax fiber | 75.5 ± 0.84 | 24.5 ± 0.84 | - | - | 0.3245 |
| Sodium alginate | 65.9 ± 1.53 | 28.1 ± 1.70 | 2.26 ± 0.17 | 3.83 ± 0.45 | 0.4264 |
| Flax–Alginate | 71.5 ± 3.60 | 27.1 ± 3.23 | - | 1.42 ± 0.60 | 0.3790 |
| Flax–Alginate 10% | 64.1 ± 1.84 | 33.7 ± 1.67 | 0.95 ± 0.25 | 1.25 ± 0.47 | 0.5257 |
| Flax–Alginate 30% | 64.2 ± 0.23 | 33.6 ± 0.17 | 0.78 ± 0.18 | 1.43 ± 0.11 | 0.5234 |
| Flax–Alginate 50% | 59.2 ± 1.65 | 38.5 ± 1.53 | 0.88 ± 0.25 | 1.42 ± 0.15 | 0.6503 |
| Flax–Alginate 100% | 62.4 ± 0.25 | 34.0 ± 0.17 | 0.63 ± 0.04 | 2.98 ± 0.10 | 0.5449 |
| Sample | Heat of Fusion (J/g) | Crystallinity (%) |
|---|---|---|
| PLA–Flax–Alginate | 0.0523 | 0.0563 |
| PLA–Flax–Alginate 10% | 0.0360 | 0.0387 |
| PLA–Flax–Alginate 30% | 0.0519 | 0.0558 |
| PLA–Flax–Alginate 50% | 0.0590 | 0.0634 |
Disclaimer/Publisher’s Note: The statements, opinions and data contained in all publications are solely those of the individual author(s) and contributor(s) and not of MDPI and/or the editor(s). MDPI and/or the editor(s) disclaim responsibility for any injury to people or property resulting from any ideas, methods, instructions or products referred to in the content. |
© 2024 by the authors. Licensee MDPI, Basel, Switzerland. This article is an open access article distributed under the terms and conditions of the Creative Commons Attribution (CC BY) license (https://creativecommons.org/licenses/by/4.0/).
Share and Cite
Moradkhani, G.; Profili, J.; Destrieux, A.; Robert, M.; Laroche, G.; Elkoun, S.; Mighri, F.; Vuillaume, P.Y. Plasma-Enhanced Alginate Pre-Treatment of Short Flax Fibers for Improved Thermo-Mechanical Properties of PLA Composites. J. Compos. Sci. 2024, 8, 106. https://0-doi-org.brum.beds.ac.uk/10.3390/jcs8030106
Moradkhani G, Profili J, Destrieux A, Robert M, Laroche G, Elkoun S, Mighri F, Vuillaume PY. Plasma-Enhanced Alginate Pre-Treatment of Short Flax Fibers for Improved Thermo-Mechanical Properties of PLA Composites. Journal of Composites Science. 2024; 8(3):106. https://0-doi-org.brum.beds.ac.uk/10.3390/jcs8030106
Chicago/Turabian StyleMoradkhani, Ghane, Jacopo Profili, Alex Destrieux, Mathieu Robert, Gaétan Laroche, Saïd Elkoun, Frej Mighri, and Pascal Y. Vuillaume. 2024. "Plasma-Enhanced Alginate Pre-Treatment of Short Flax Fibers for Improved Thermo-Mechanical Properties of PLA Composites" Journal of Composites Science 8, no. 3: 106. https://0-doi-org.brum.beds.ac.uk/10.3390/jcs8030106