Focal Liver Lesion Detection in Ultrasound Image Using Deep Feature Fusions and Super Resolution


Abstract
:1. Introduction
- (i)
- A Computer-aided technique obtaining amended performance in liver lesion detection through the deep CNN with local textural features of LBP and GWT.
- (ii)
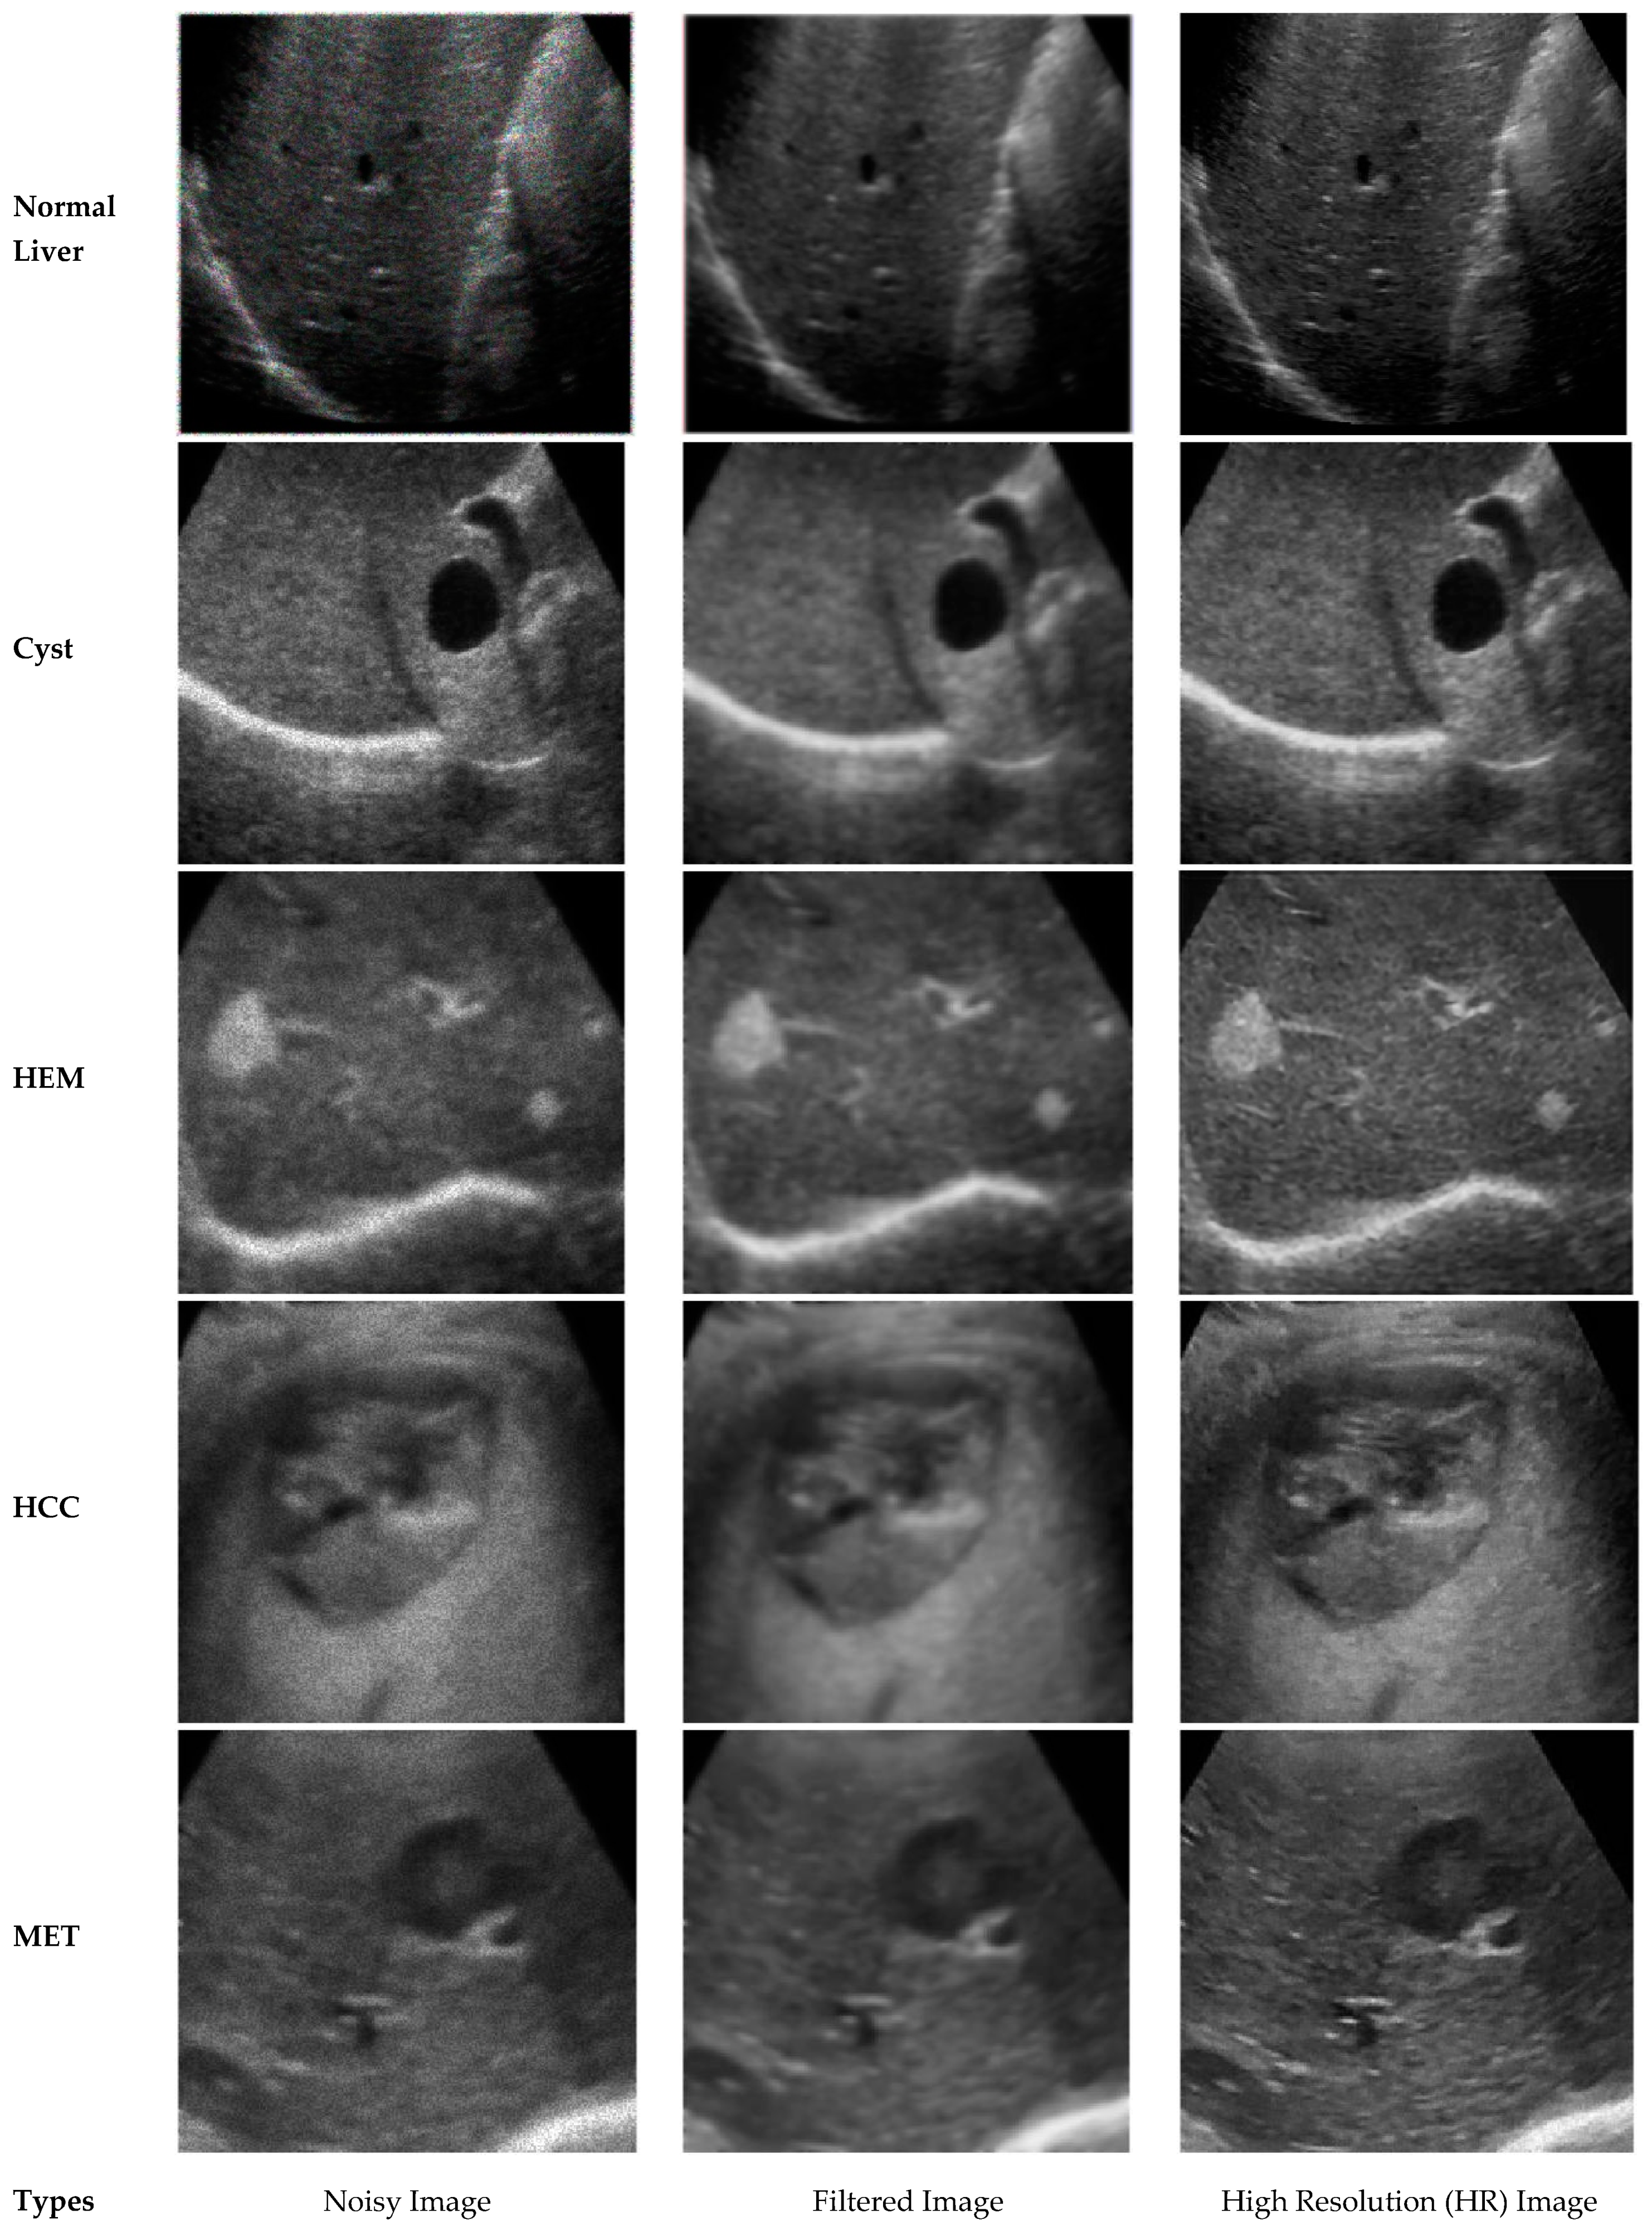
- The main drawbacks of ultrasound images are resolved using edge-preserving anisotropic diffusion and enhance the significant information by learnable super resolution (SR) techniques.
- (iii)
- A proposed lesion detection technique outperforms state-of-the-art methods.
- (iv)
- An informative patch selection technique reduces the computation time.
- (v)
- A designed algorithm marks lesions’ region from identified ultrasound image patches.
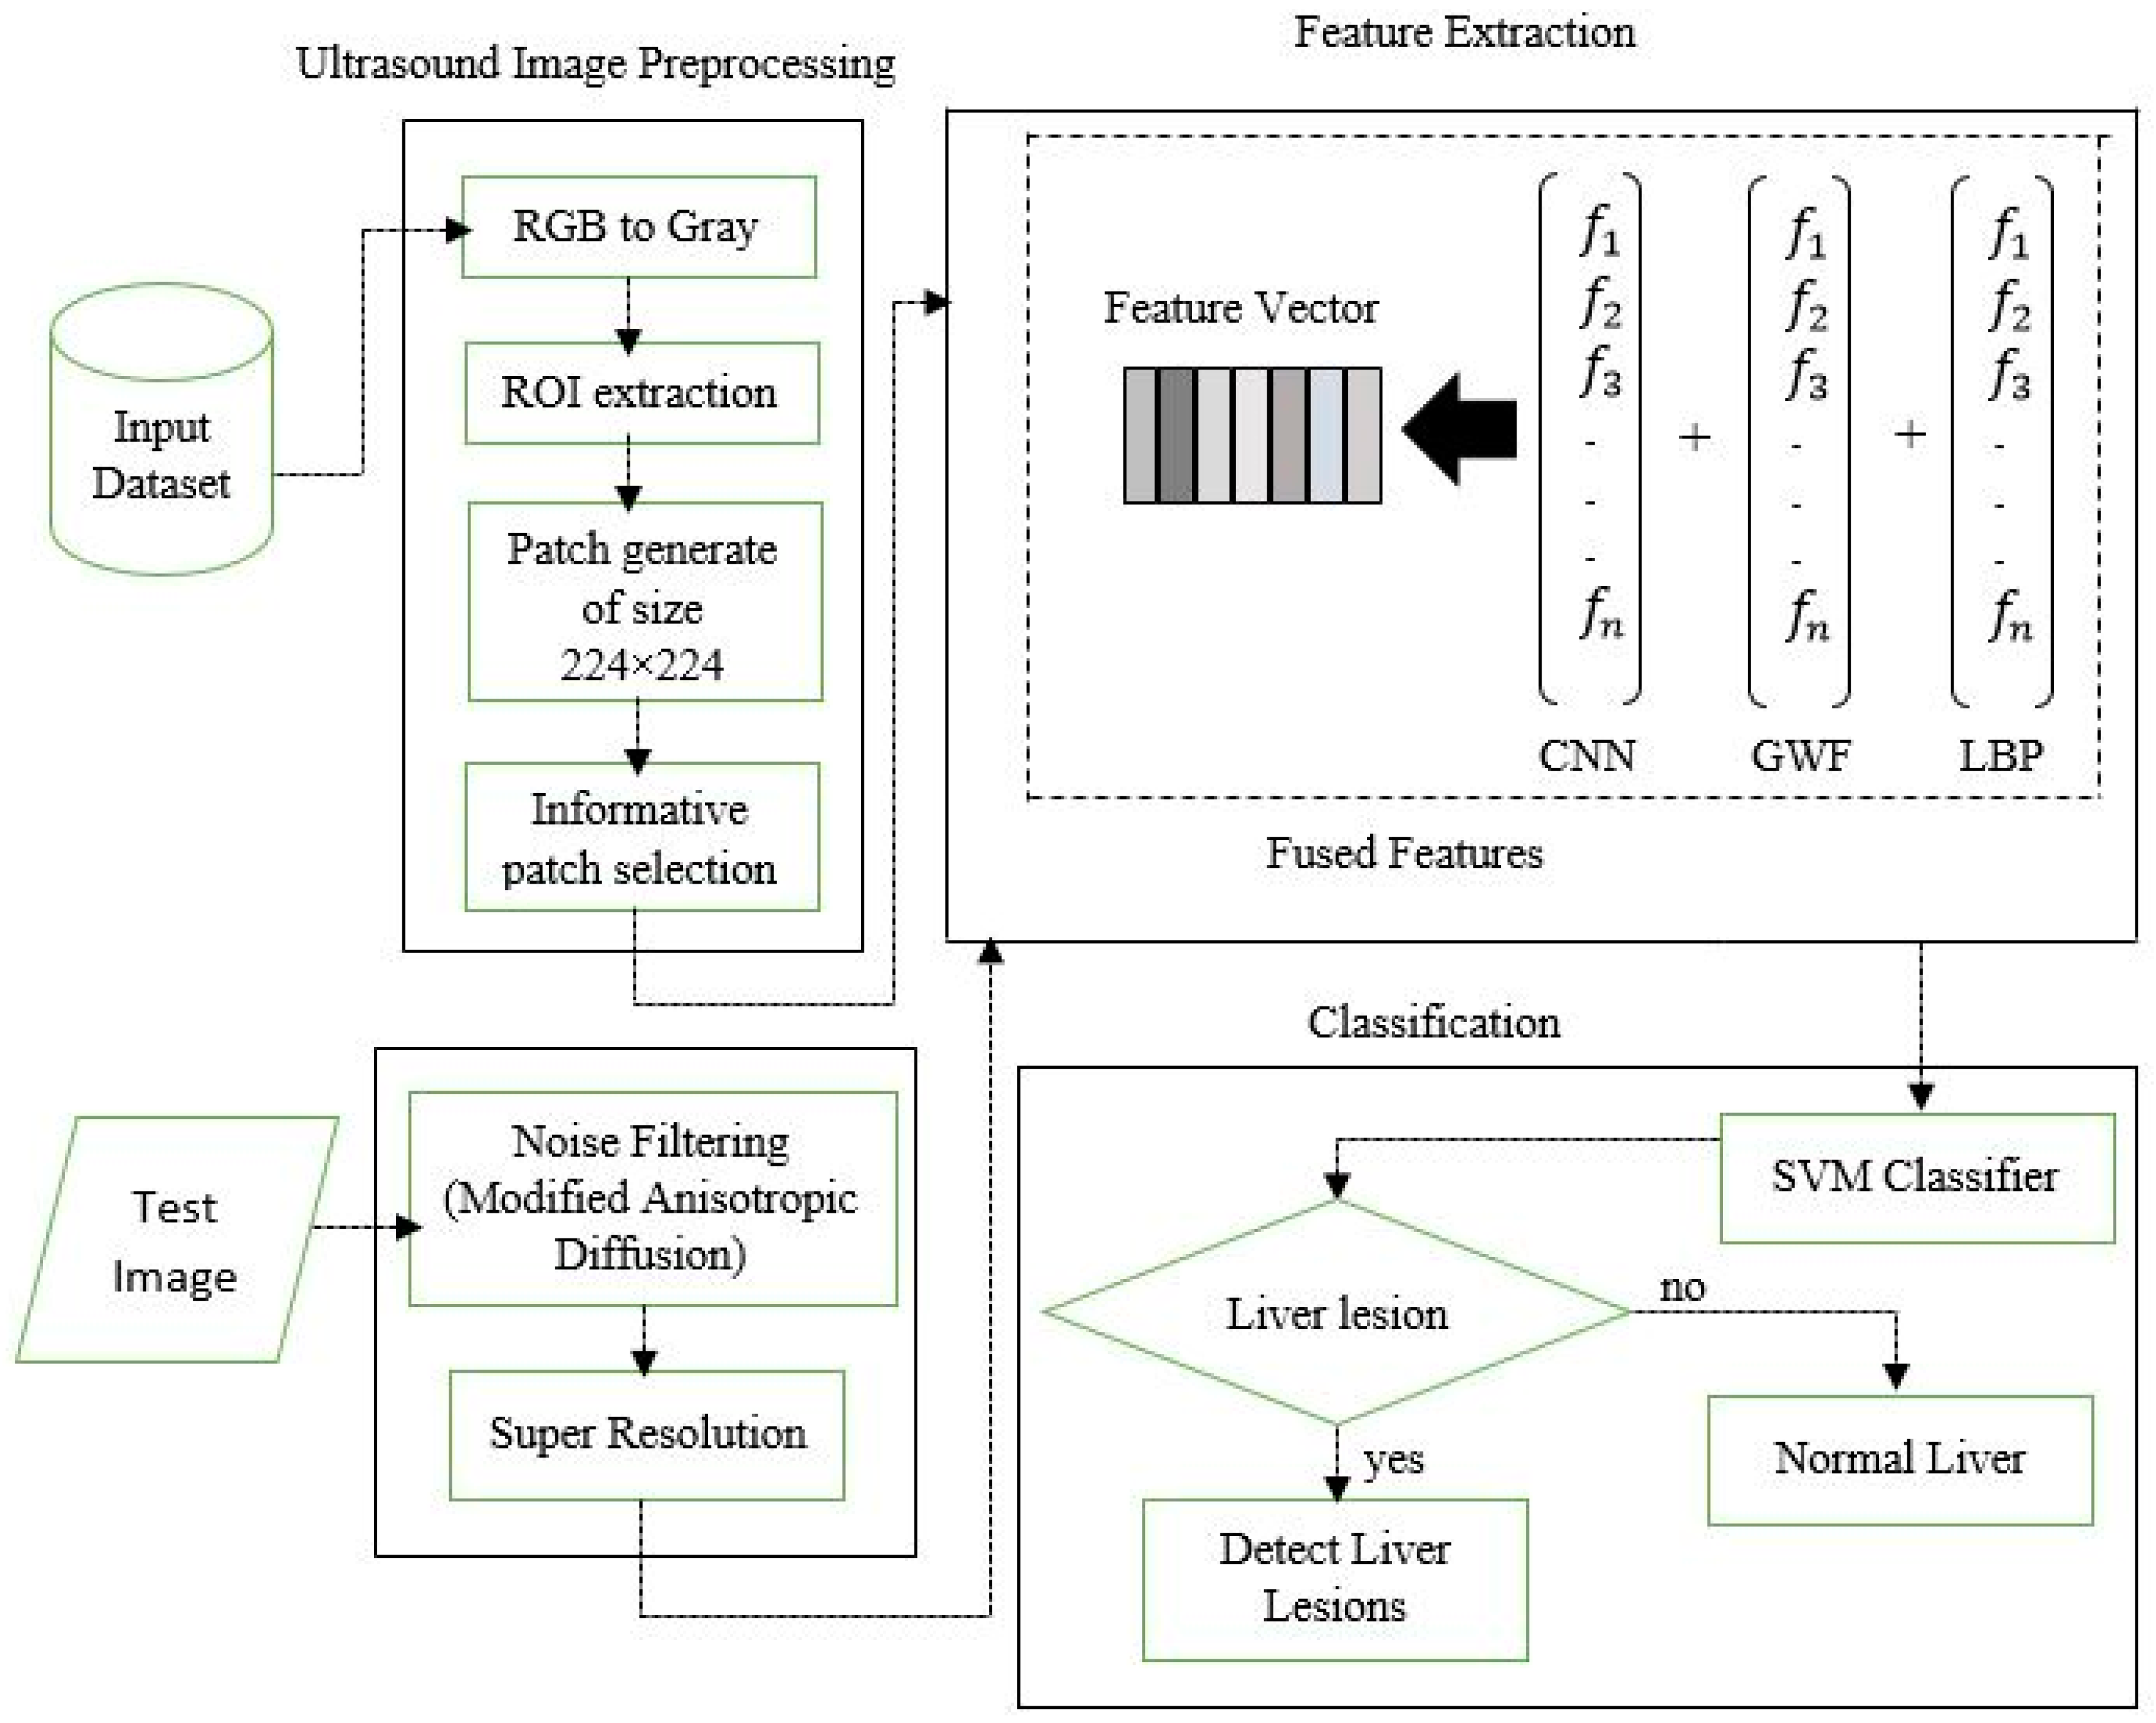
2. Research Methods
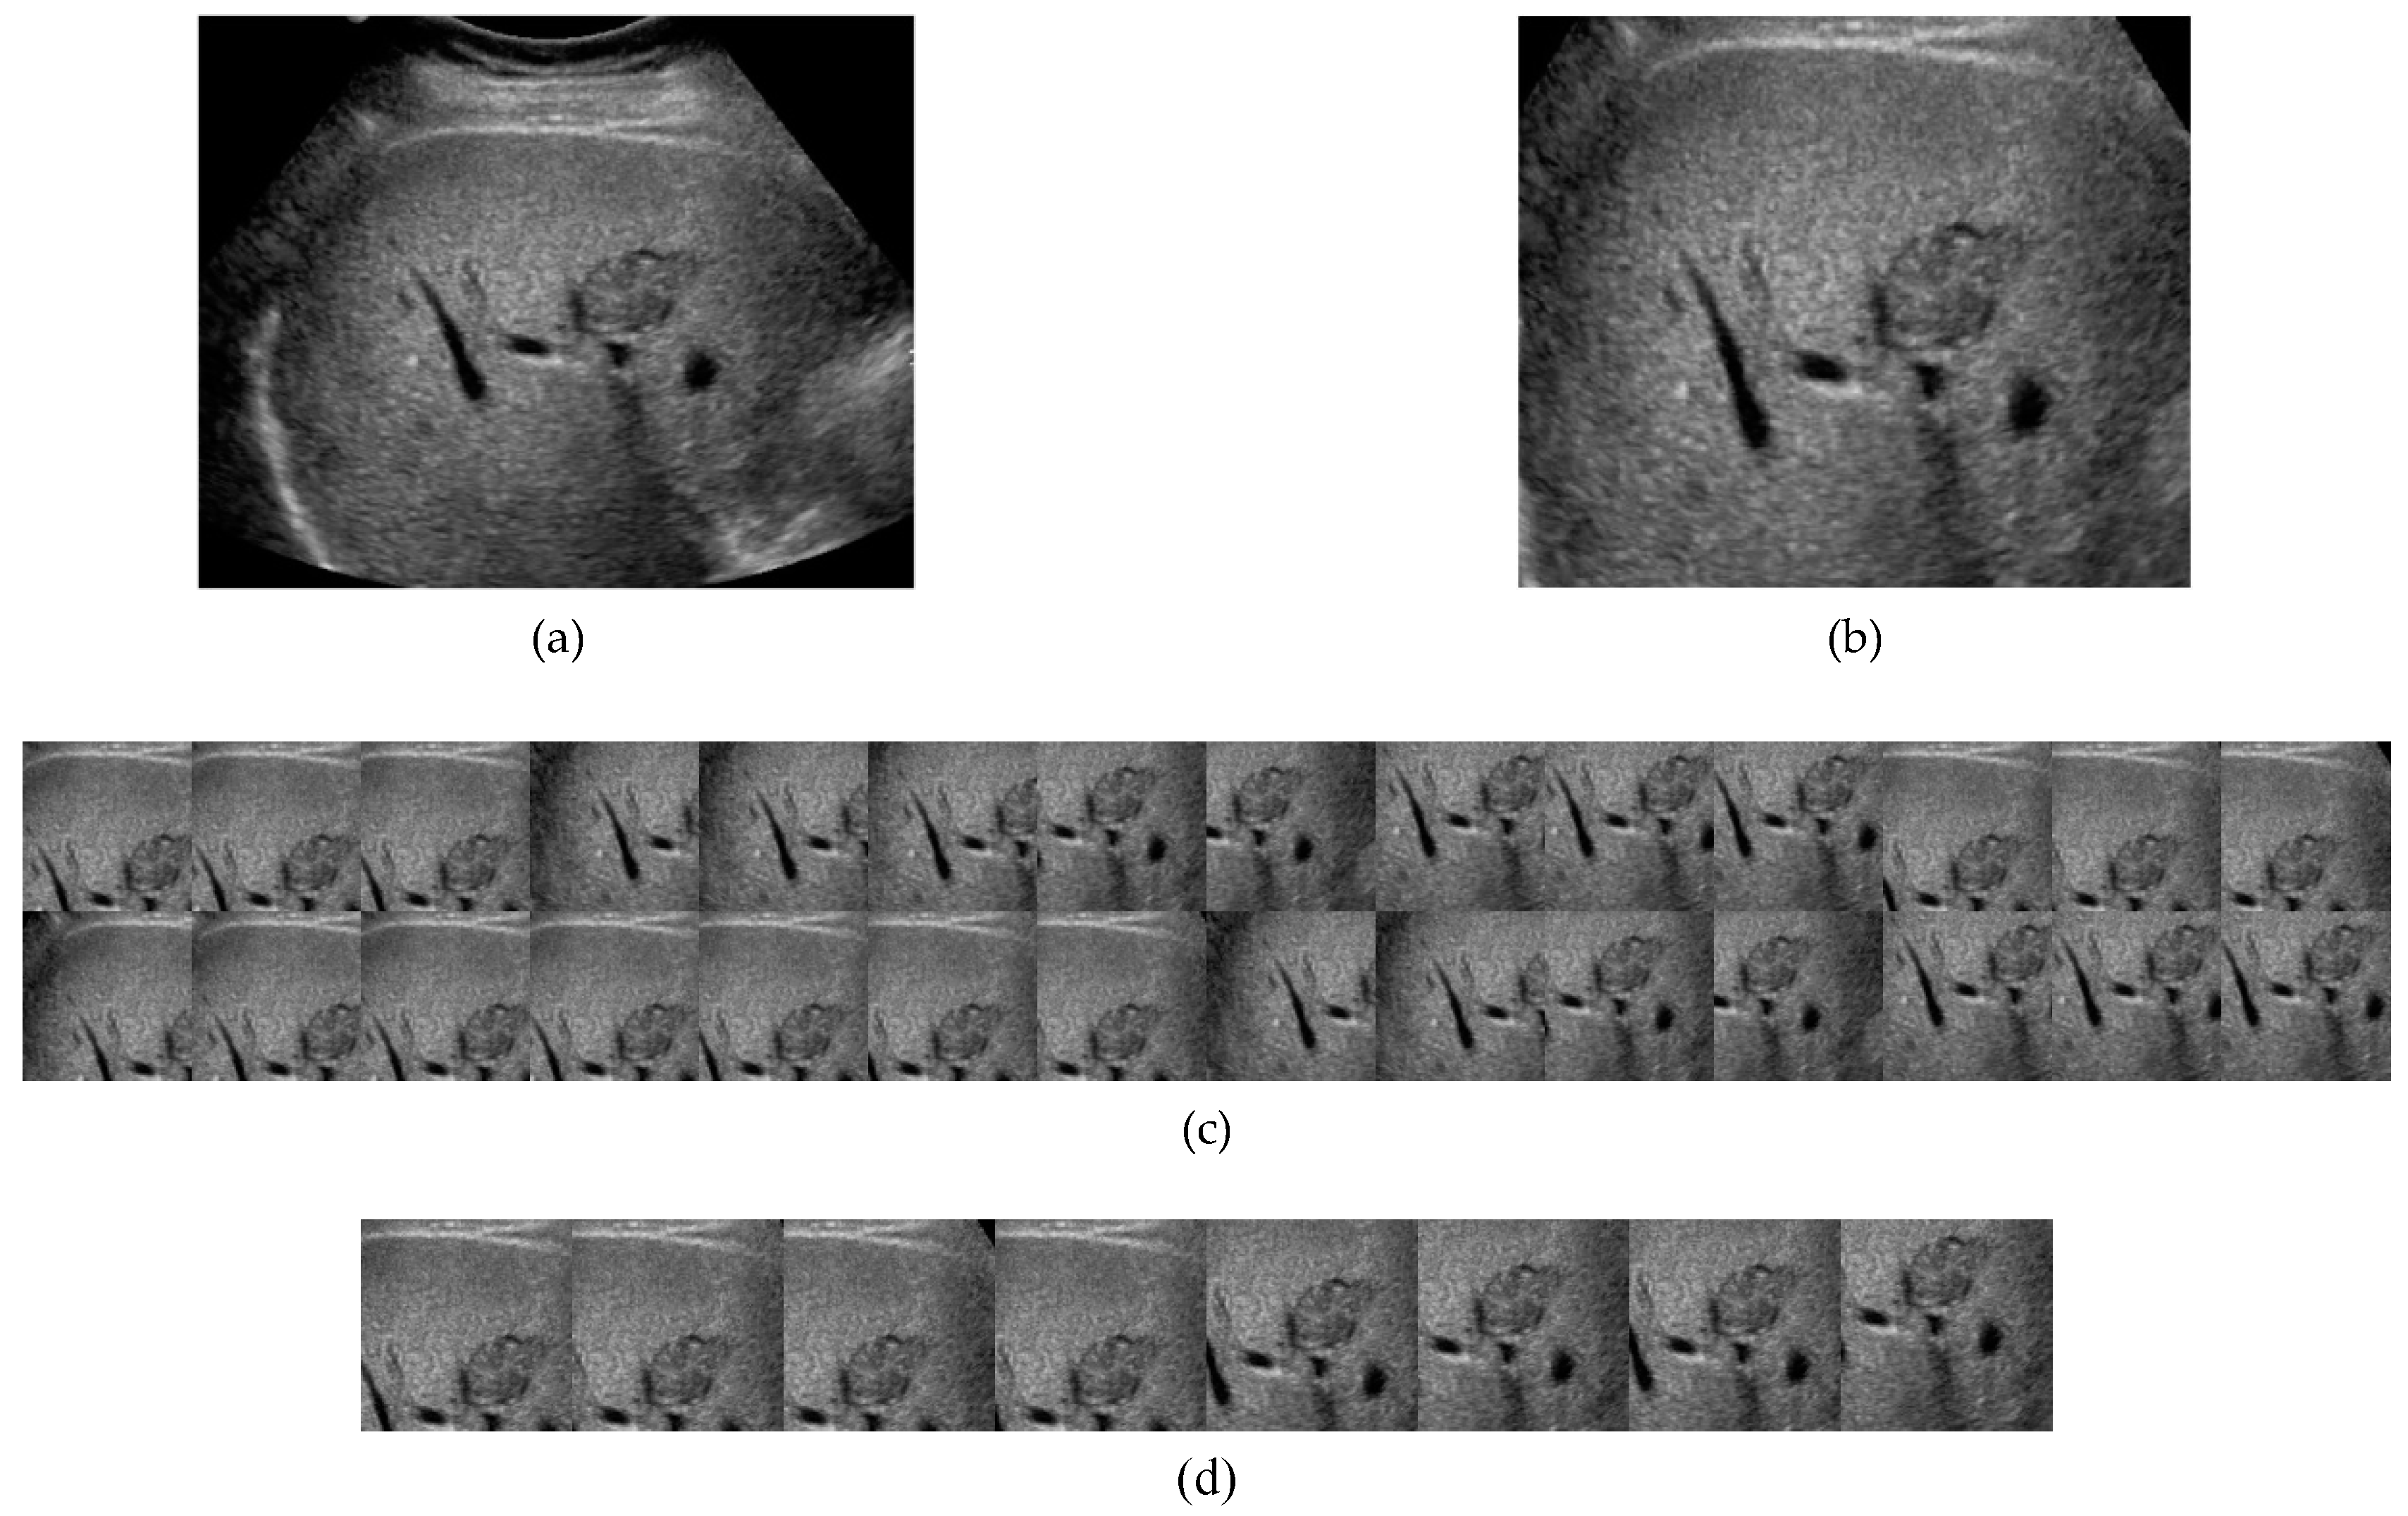
2.1. Data Processing
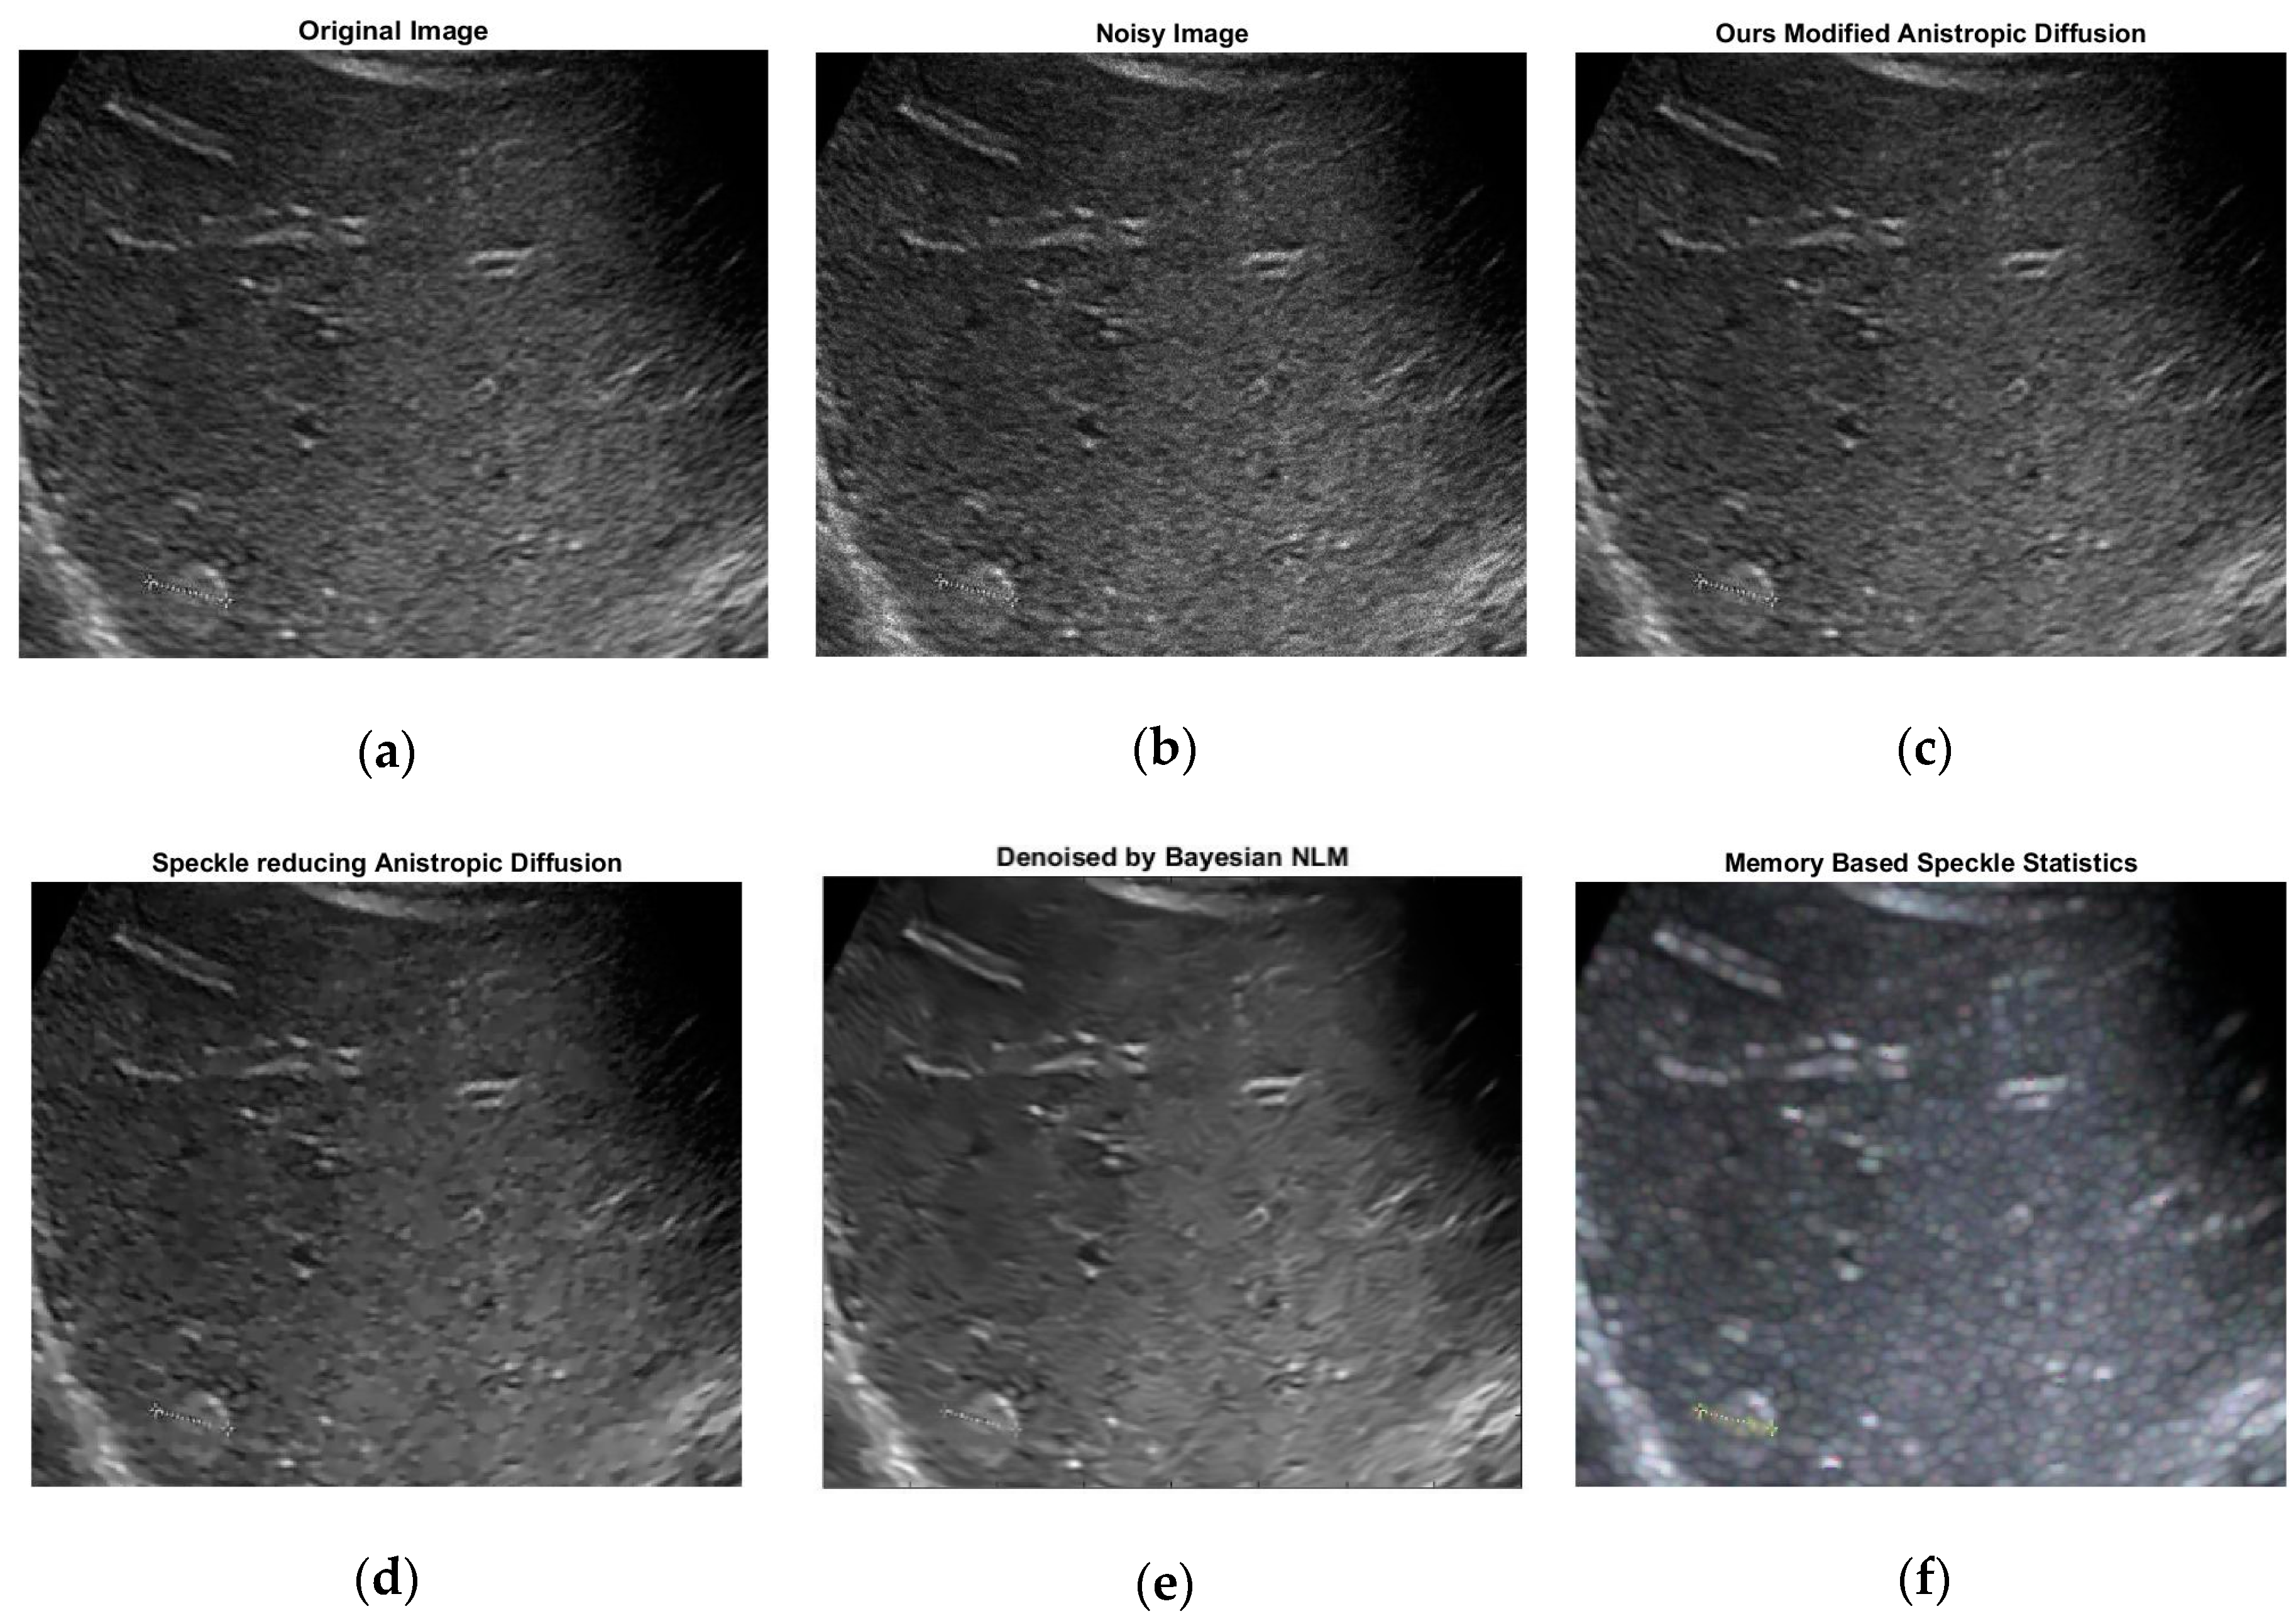
2.2. Modified Anisotropic Diffusion Filtering
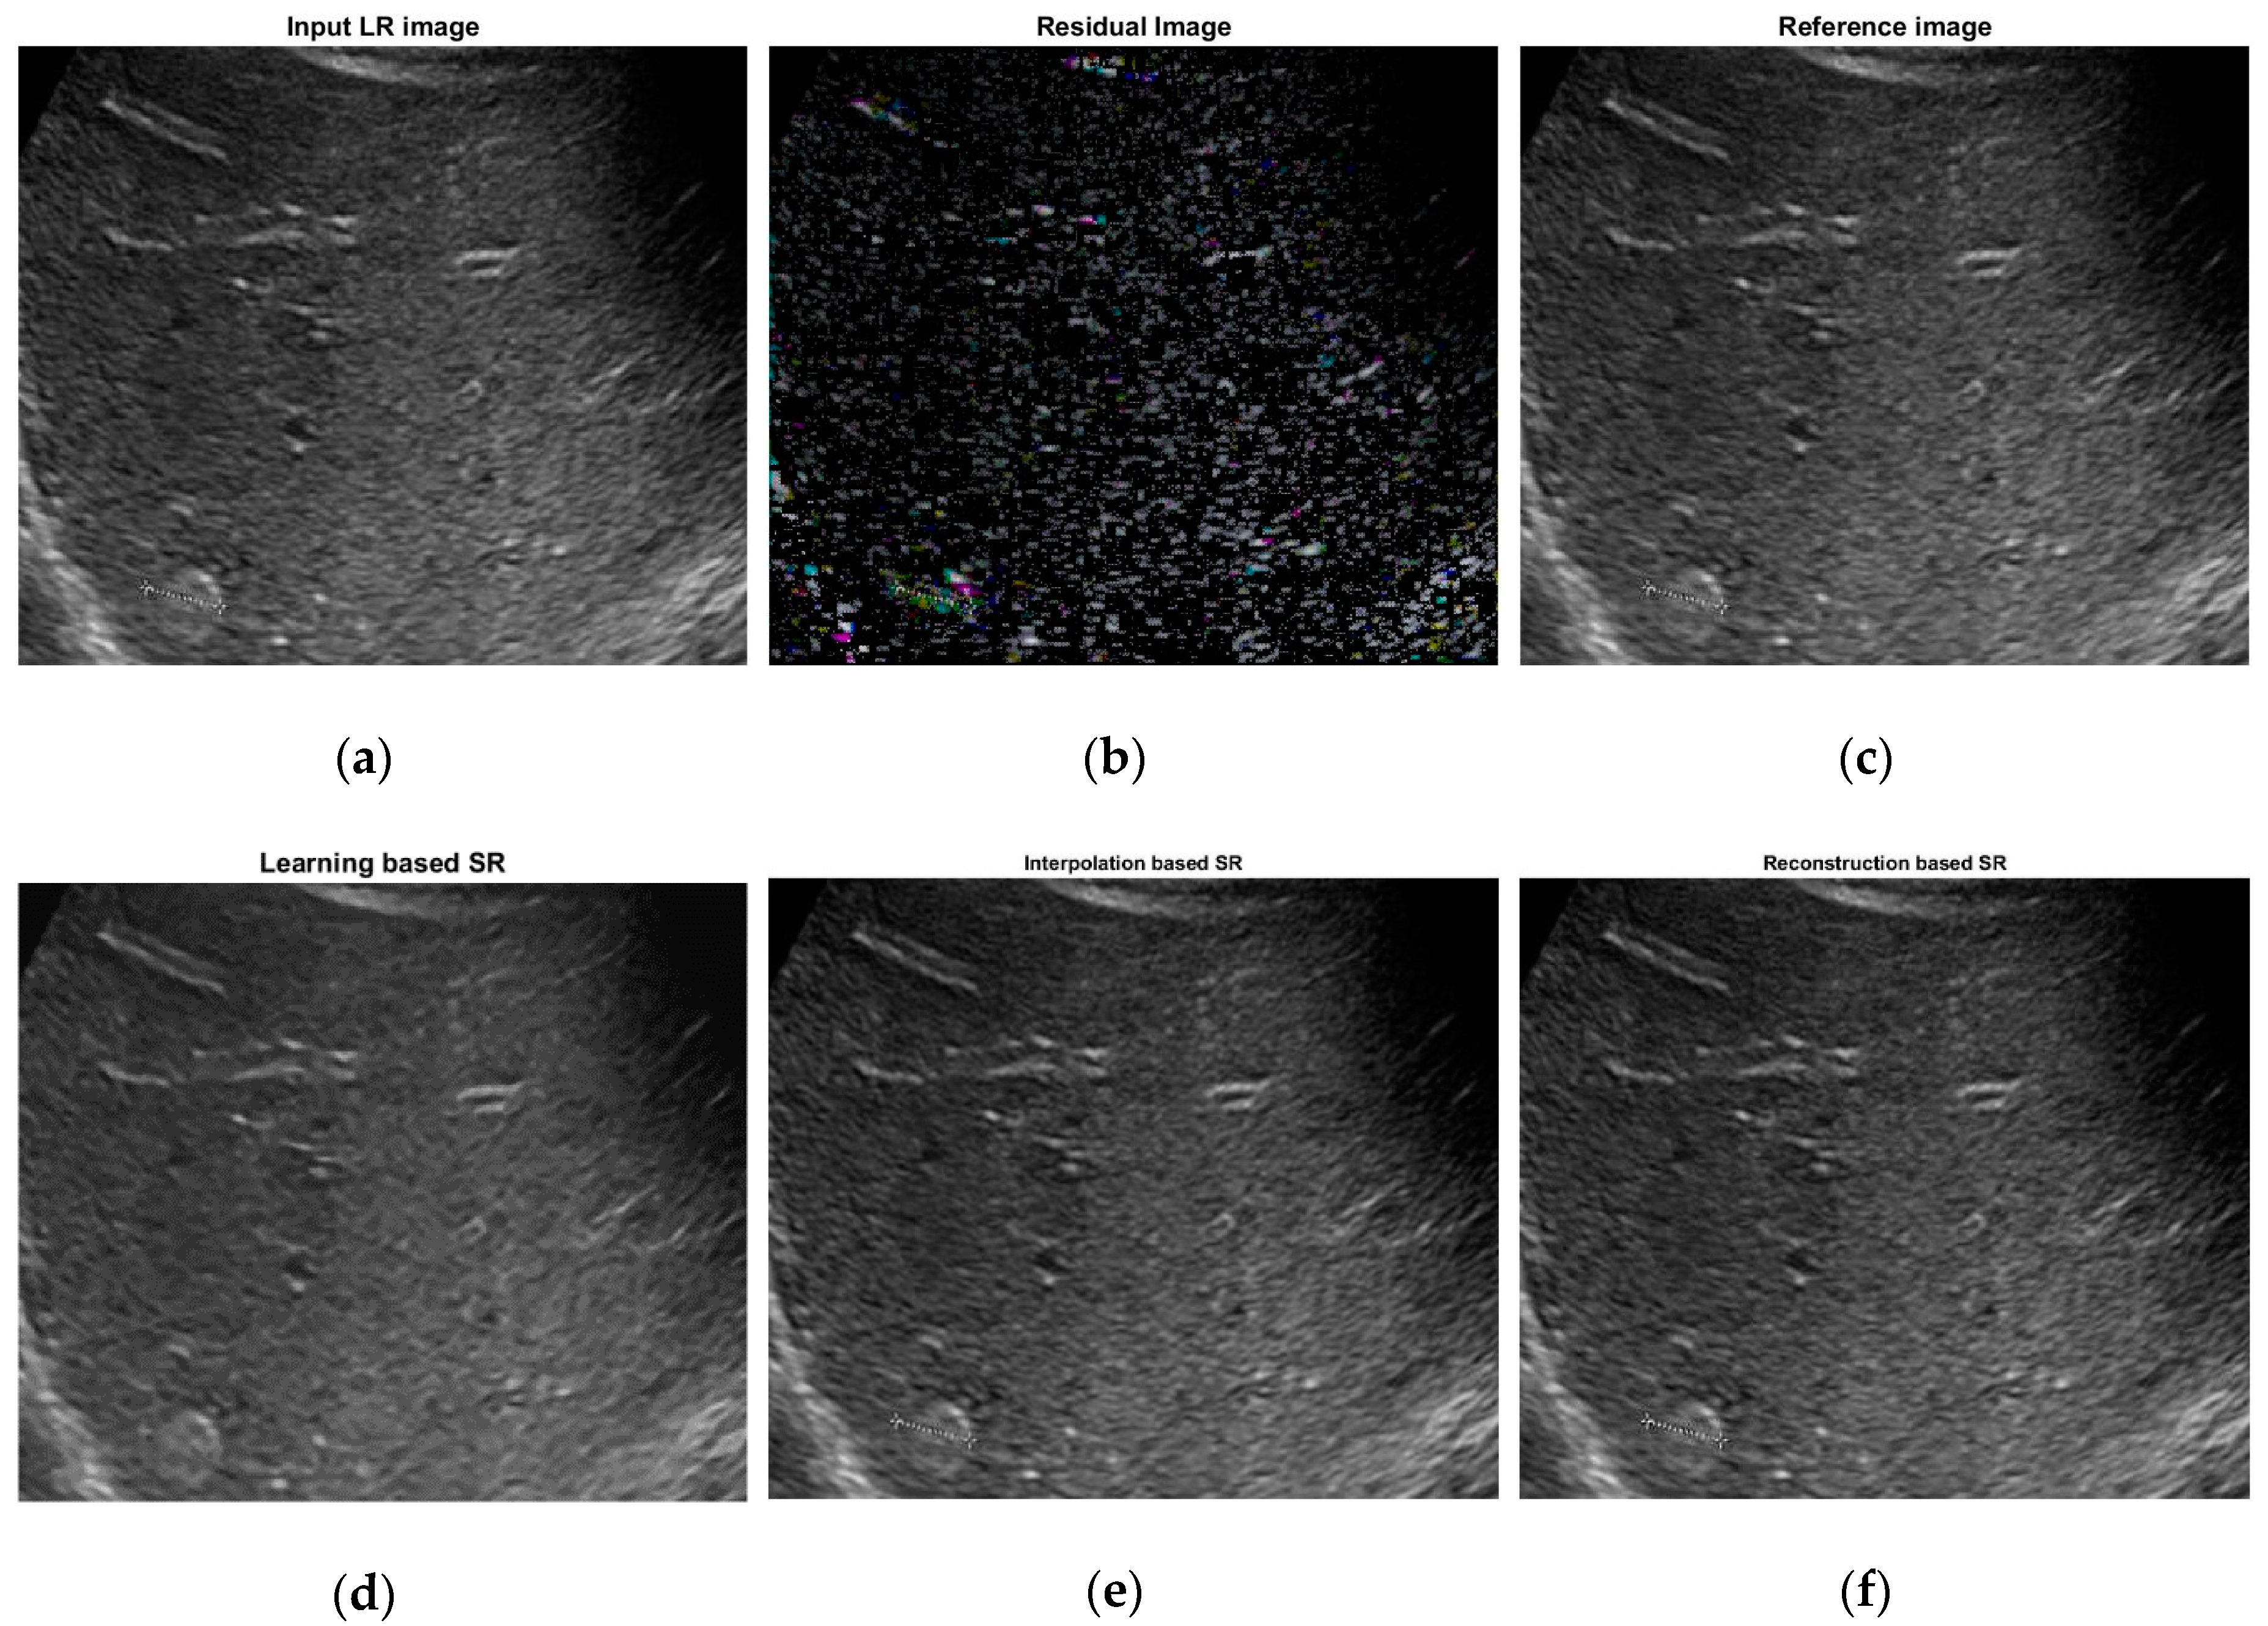
2.3. Learning Based Super Resolution
2.4. Feature Extraction
2.4.1. Gabor Wavelet Transform (GWT) Features
2.4.2. Local Binary Pattern (LBP) Features
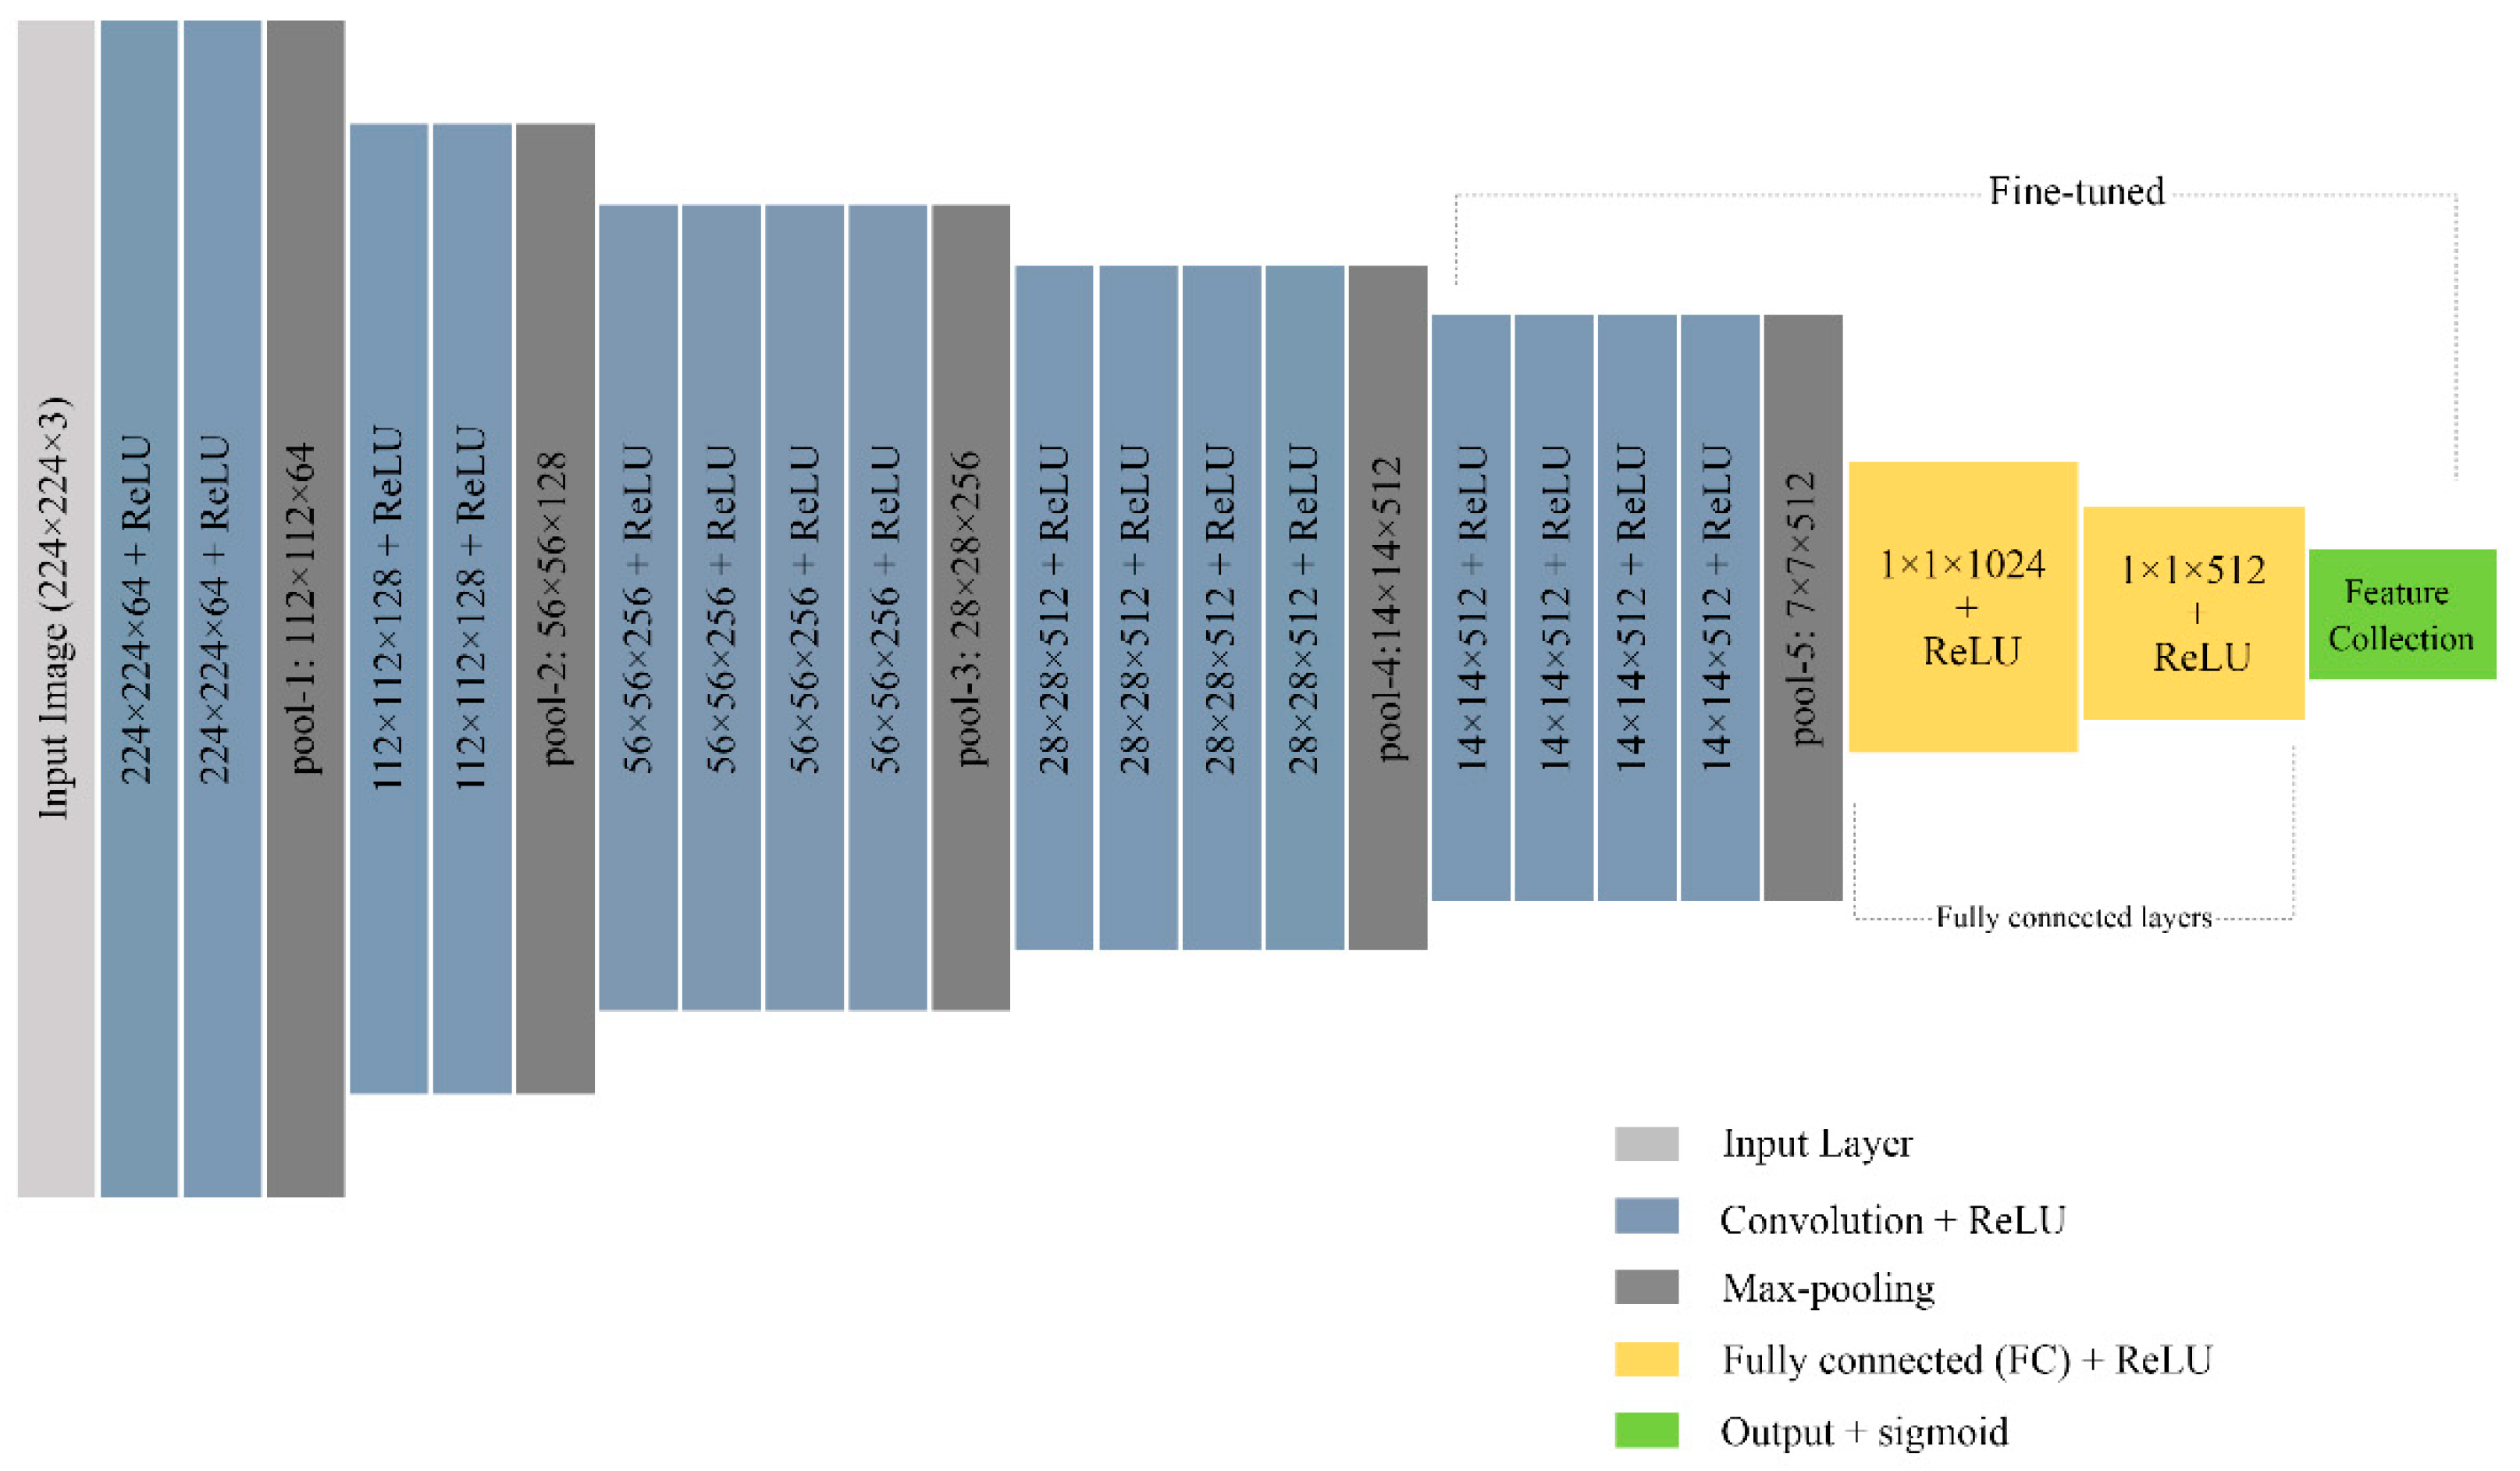
2.4.3. CNN Features
2.5. SVM Classifier
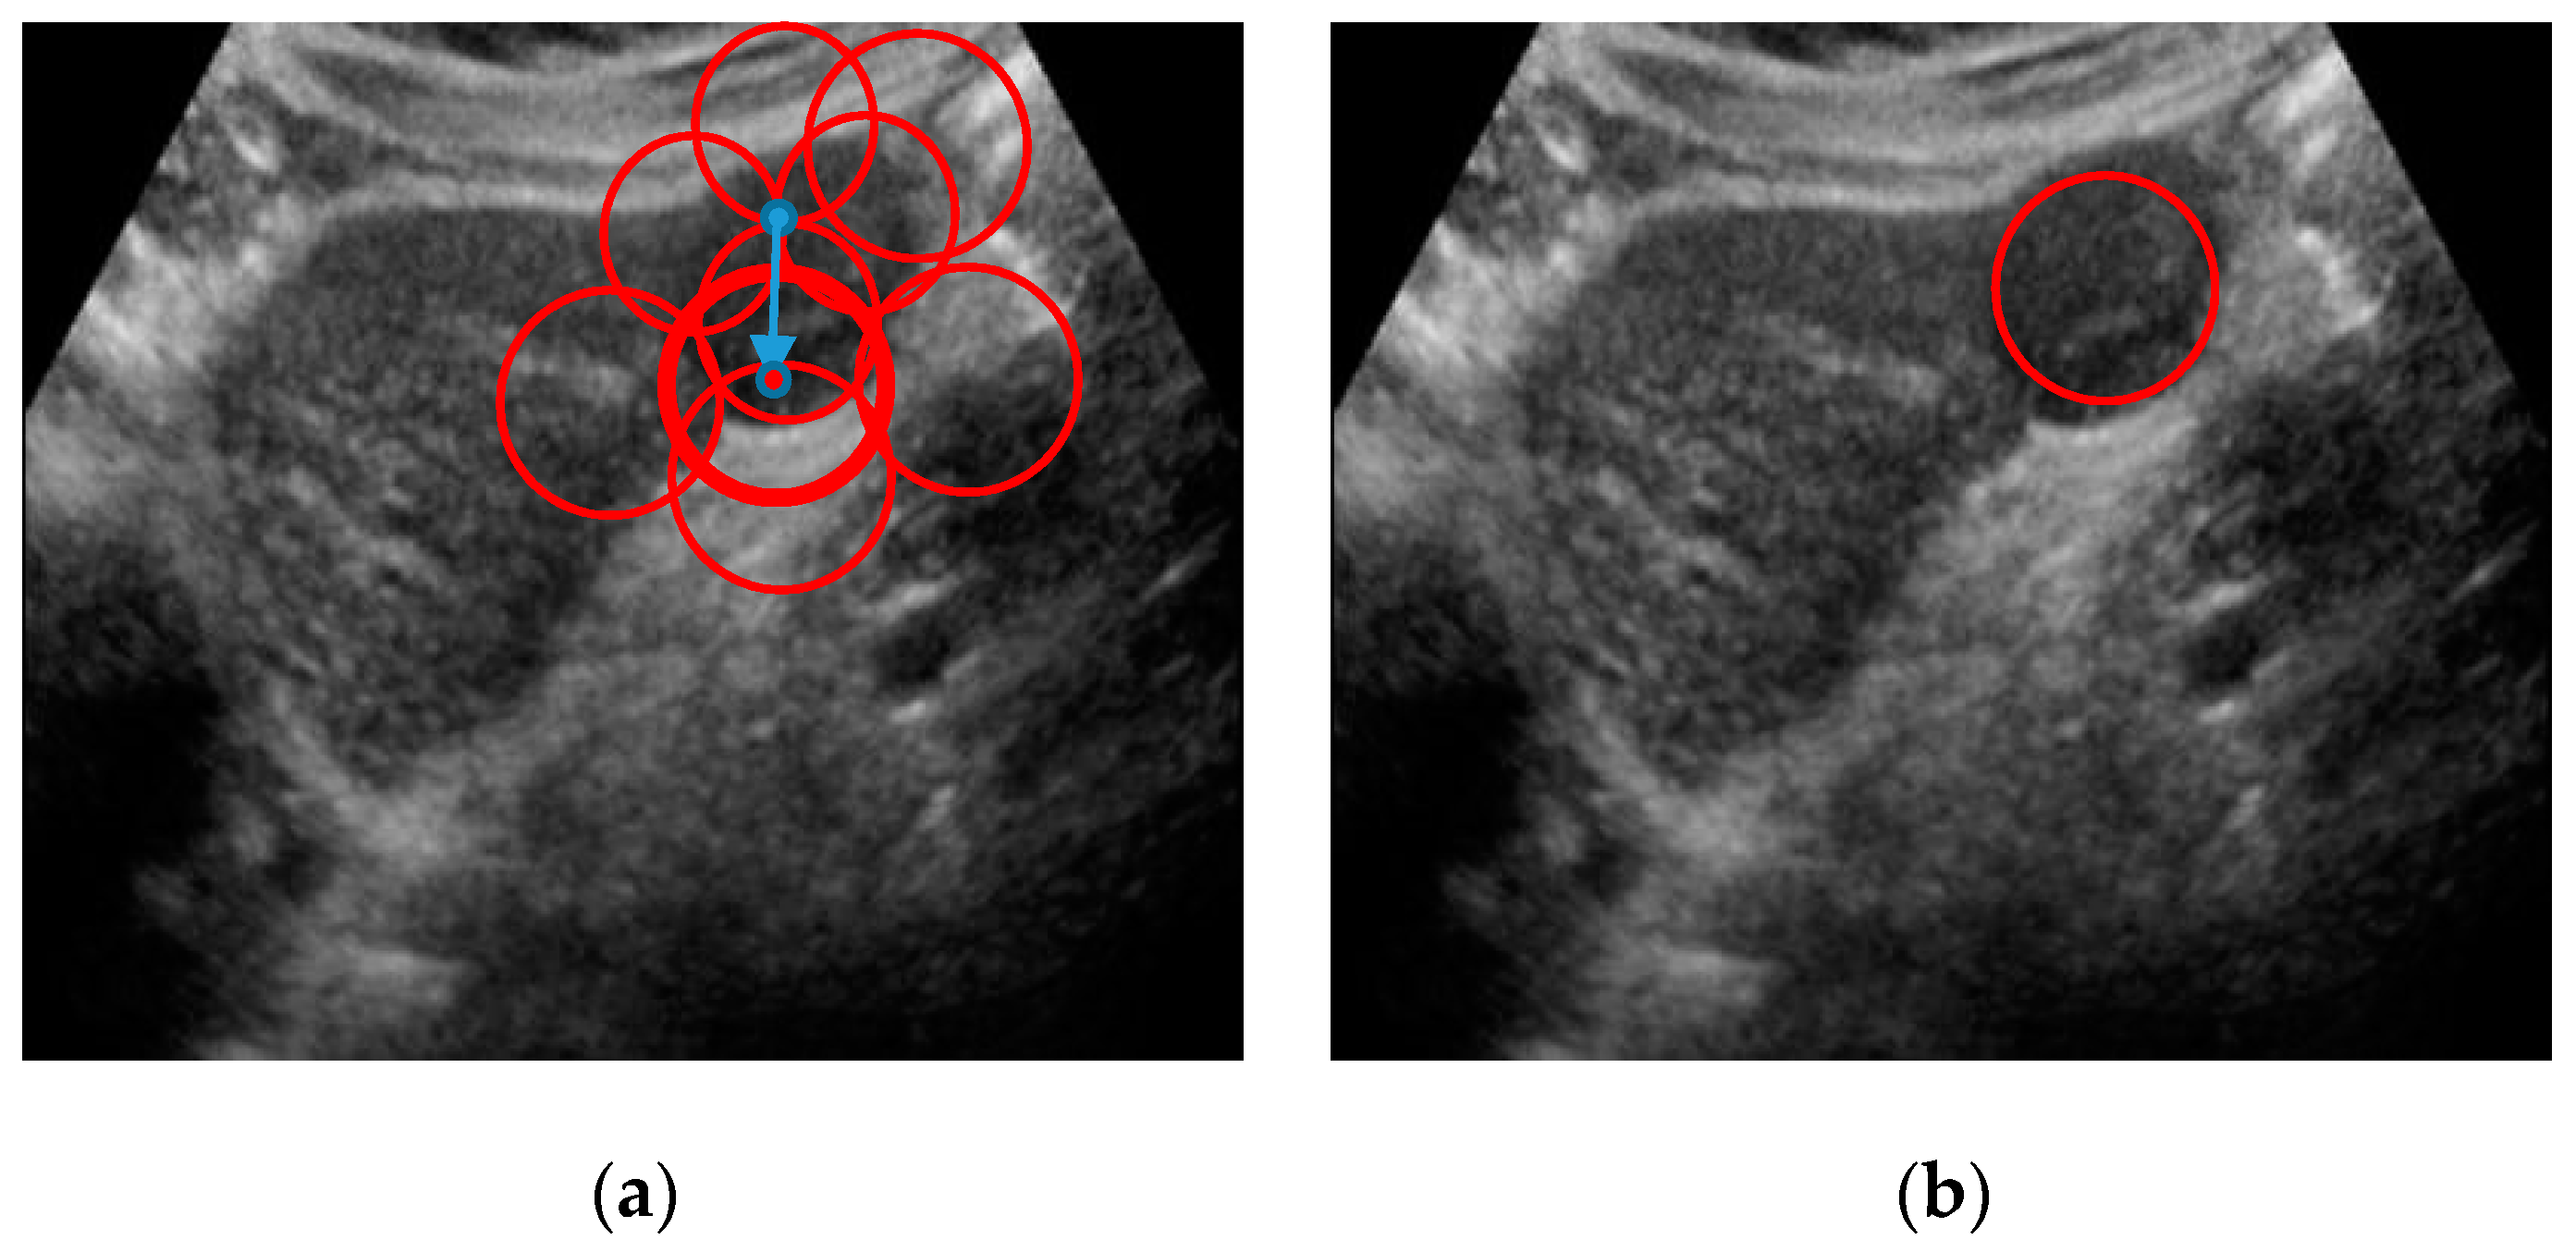
2.6. Lesion Region Finding
| Algorithm 1: Detecting lesion regions. |
| start for i: 1→n if if ()≡1 end if if (>1)≡1 // pop the left if it is overlapping value is greater than 1. end if end if end for do d= end until End |
3. Experiment Results
4. Discussion
5. Conclusions
Author Contributions
Funding
Conflicts of Interest
References
- Key Statistics about Liver Cancer. Available online: https://www.cancer.org/cancer/liver-cancer/about/what-is-key-statistics.html (accessed on 16 April 2020).
- Shajahan, B.; Sudha, S. Hepatic Tumor Detection in Ultrasound Images. In Proceedings of the 2nd International Conference on Devices, Circuits and Systems (ICDCS), Coimbatore, India, 6–8 March 2014; pp. 1–5. [Google Scholar]
- Xu, S.S.-D.; Chang, C.-C.; Su, C.-T.; Phu, P.Q. Classification of Liver Diseases Based on Ultrasound Image Texture Features. Appl. Sci. 2019, 9, 342. [Google Scholar] [CrossRef] [Green Version]
- Brattain, L.J.; Telfer, B.A.; Dhyani, M.; Grajo, J.R.; Samir, A.E. Machine learning for medical ultrasound: Status, methods, and future opportunities. Abdom. Radiol. 2018, 43, 786–799. [Google Scholar] [CrossRef]
- Jabarulla, M.Y.; Lee, H.-N. Computer Aided Diagnostic System for Ultrasound Liver Images: A Systematic Review. Optik 2017, 140, 1114–1126. [Google Scholar] [CrossRef]
- Mittal, D.; Kumar, V.; Saxena, S.C.; Khandelwal, N.; Kalra, N. Neural Network Based Focal Liver Lesion Diagnosis Using Ultrasound Images. Comput. Med. Imaging Graph. 2011, 35, 315–323. [Google Scholar] [CrossRef] [PubMed]
- Virmani, J.; Kumar, V.; Kalra, N.; Khandelwa, N. PCA-SVM Based CAD System for Focal Liver Lesions Using B-Mode Ultrasound Images. Def. Sci. J. 2013, 63, 478–486. [Google Scholar] [CrossRef]
- Li, S.; Kwok, J.T.; Zhu, H.; Wang, Y. Texture Classification Using the Support Vector Machines. Pattern Recognit. 2003, 36, 2883–2893. [Google Scholar] [CrossRef]
- Hassan, T.M.; Elmogy, M.; Sallam, E.-S. Diagnosis of Focal Liver Diseases Based on Deep Learning Technique for Ultrasound Images. Arab. J. Sci. Eng. 2017, 42, 3127–3140. [Google Scholar] [CrossRef]
- Balasubramanian, D.; Srinivasan, P.; Gurupatham, R. Automatic Classification of Focal Lesions in Ultrasound Liver Images Using Principal Component Analysis and Neural Networks. In Proceedings of the 29th Annual International Conference of the IEEE Engineering in Medicine and Biology Society, Lyon, France, 23–26 August 2007; pp. 2134–2137. [Google Scholar]
- Kalyan, K.; Jakhia, B.; Lele, R.D.; Joshi, M.; Chowdhary, A. Artificial Neural Network Application in the Diagnosis of Disease Conditions with Liver Ultrasound Images. Adv. Bioinform. 2014, 2014, 1–14. [Google Scholar] [CrossRef] [Green Version]
- Xian, G. An Identification Method of Malignant and Benign Liver Tumors from Ultrasonography Based on GLCM Texture Features and Fuzzy SVM. Expert Syst. Appl. 2010, 37, 6737–6741. [Google Scholar] [CrossRef]
- Jeon, J.H.; Choi, J.Y.; Lee, S.; Ro, Y.M. Multiple ROI selection based focal liver lesion classification in ultrasound images. Expert Syst. Appl. 2013, 40, 450–457. [Google Scholar] [CrossRef]
- Virmani, J.; Kumar, V.; Kalra, N.; Khandelwal, N. A Comparative Study of Computer-Aided Classification Systems for Focal Hepatic Lesions from B-Mode Ultrasound. J. Med. Eng. Technol. 2013, 37, 292–306. [Google Scholar] [CrossRef]
- Virmani, J.; Kumar, V.; Kalra, N.; Khandelwal, N. Neural Network Ensemble Based CAD System for Focal Liver Lesions from B-Mode Ultrasound. J. Digit. Imaging 2014, 27, 520–537. [Google Scholar] [CrossRef] [Green Version]
- Hwang, Y.N.; Lee, J.H.; Kim, G.Y.; Jiang, Y.Y.; Kim, S.M. Classification of Focal Liver Lesions on Ultrasound Images by Extracting Hybrid Textural Features and Using an Artificial Neural Network. Bio-Med. Mater. Eng. 2015, 26, S1599–S1611. [Google Scholar] [CrossRef] [PubMed] [Green Version]
- Rahmat, R.O.; Zamrin, D.M. Components and Implementation of a Picture Archiving and Communication System in a Prototype Application. Rep. Med. Imaging 2019, 12, 1–8. [Google Scholar]
- Petrusca, L.; Cattin, P.; De Luca, V.; Preiswerk, F.; Celicanin, Z.; Auboiroux, V.; Viallon, M.; Arnold, P.; Santini, F.; Terraz, S. Hybrid Ultrasound/Magnetic Resonance Simultaneous Acquisition and Image Fusion for Motion Monitoring in the Upper Abdomen. Investig. Radiol. 2013, 48, 333–340. [Google Scholar] [CrossRef] [Green Version]
- De Luca, V.; Tschannen, M.; Szekely, G.; Tanner, C. A Learning-based Approach for Fast and Robust Vessel Tracking in Long Ultrasound Sequences. In Proceedings of the International Conference on Medical Image Computing and Computer-Assisted Intervention, Nagoya, Japan, 22–26 September 2013; pp. 518–525. [Google Scholar]
- Zhao, Z.; Elgammal, A. A Statistically Selected Part-Based Probabilistic Model for Object Recognition. In Proceedings of the International Workshop on Intelligent Computing in Pattern Analysis and Synthesis, Xi’an, China, 26–27 August 2006; pp. 95–104. [Google Scholar]
- Shorten, C.; Khoshgoftaar, T.M. A Survey on Image Data Augmentation for Deep Learning. J. Big Data 2019, 6, 60. [Google Scholar] [CrossRef]
- Scherzer, O. Handbook of Mathematical Methods in Imaging; Springer Science & Business Media: Berlin, Germany, 2010. [Google Scholar]
- Perona, P.; Malik, J. Scale-space and edge detection using anisotropic diffusion. IEEE Trans. Pattern Anal. Mach. Intell. 1990, 12, 629–639. [Google Scholar] [CrossRef] [Green Version]
- Yu, Y.; Acton, S.T. Speckle Reducing Anisotropic Diffusion. IEEE Trans. Image Process. 2002, 11, 1260–1270. [Google Scholar]
- Krissian, K.; Westin, C.-F.; Kikinis, R.; Vosburgh, K.G. Oriented Speckle Reducing Anisotropic Diffusion. IEEE Trans. Image Process. 2007, 16, 1412–1424. [Google Scholar] [CrossRef]
- Ramos-Llordén, G.; Vegas-Sánchez-Ferrero, G.; Martin-Fernandez, M.; Alberola-López, C.; Aja-Fernández, S. Anisotropic Diffusion Filter with Memory Based on Speckle Statistics for Ultrasound Images. IEEE Trans. Image Process. 2014, 24, 345–358. [Google Scholar] [CrossRef] [Green Version]
- Tsai, R. Multiframe Image Restoration and Registration. Adv. Comput. Vis. Image Process. 1984, 1, 317–339. [Google Scholar]
- Irani, M.; Peleg, S. Motion Analysis for Image Enhancement: Resolution, Occlusion, and Transparency. J. Vis. Commun. Image Represent. 1993, 4, 324–335. [Google Scholar] [CrossRef] [Green Version]
- Patti, A.J.; Sezan, M.I.; Tekalp, A.M. Superresolution Video Reconstruction with Arbitrary Sampling Lattices and Nonzero Aperture Time. IEEE Trans. Image Process. 1997, 6, 1064–1076. [Google Scholar] [CrossRef]
- Rasti, P.; Orlova, O.; Tamberg, G.; Ozcinar, C.; Nasrollahi, K.; Moeslund, T.B.; Anbarjafari, G. Improved Interpolation Kernels for Super Resolution Algorithms. In Proceedings of the Sixth International Conference on Image Processing Theory, Tools and Applications (IPTA), Oulu, Finland, 12–15 December 2016; pp. 1–6. [Google Scholar]
- Zhang, L.; Wu, X. An Edge-Guided Image Interpolation Algorithm via Directional Filtering and Data Fusion. IEEE Trans. Image Process. 2006, 15, 2226–2238. [Google Scholar] [CrossRef] [PubMed] [Green Version]
- Freeman, W.T.; Liu, C. Markov Random Fields for Super-Resolution and Texture Synthesis. Adv. Markov Random Fields Vis. Image Process. 2011, 1, 3. [Google Scholar]
- Yang, J.; Wright, J.; Huang, T.S.; Ma, Y. Image Super-Resolution via Sparse Representation. IEEE Trans. Image Process. 2010, 19, 2861–2873. [Google Scholar] [CrossRef]
- Dong, C.; Loy, C.C.; He, K.; Tang, X. Learning a Deep Convolutional Network for Image Super-Resolution. In Proceedings of the European Conference on Computer Vision, Zurich, Switzerland, 6–12 September 2014; pp. 184–199. [Google Scholar]
- Mostafiz, R.; Rahman, M.M.; Uddin, M.S. Gastrointestinal polyp classification through empirical mode decomposition and neural features. SN Appl. Sci. 2020, 2, 1–10. [Google Scholar] [CrossRef]
- Ahmadian, A.; Mostafa, A.; Abolhassani, M.D.; Salimpour, Y. A Texture Classification Method for Diffused Liver Diseases Using Gabor Wavelets. In Proceedings of the 2005 IEEE Engineering in Medicine and Biology 27th Annual Conference, Shanghai, China, 1–4 September 2006; pp. 1567–1570. [Google Scholar]
- Liu, H.; Jiang, H.; Xia, B.; Yi, D. The Research of Feature Extraction Method of Liver Pathological Image Based on Multispatial Mapping and Statistical Properties. Comput. Math. Methods Med. 2016, 2016, 8. [Google Scholar] [CrossRef] [PubMed] [Green Version]
- Simonyan, K.; Zisserman, A. Very Deep Convolutional Networks for Large-Scale Image Recognition. arXiv, 2014; arXiv:1409.1556. [Google Scholar]
- Mostafiz, R.; Hasan, M.; Hossain, I.; Rahman, M.M. An Intelligent System for Gastrointestinal Polyp Detection in Endoscopic Video Using Fusion of Bidimensional Empirical Mode Decomposition and Convolutional Neural Network Features. Int. J. Imaging Syst. Technol. 2020, 30, 224–233. [Google Scholar] [CrossRef]
- Burges, C.J. A Tutorial on Support Vector Machines for Pattern Recognition. Data Min. Knowl. Discov. 1998, 2, 121–167. [Google Scholar] [CrossRef]
- Akter, M.; Rahman, A.; Islam, A.K. An Improved method of Automatic Exudates Detection in Retinal Images. Int. J. Innov. Res. Electr. Electron. Instrum. Control Eng. 2014, 2, 1514–1516. [Google Scholar]
- Mostafiz, R.; Rahman, M.M.; Kumar, P.M.; Islam, M.A. Speckle noise reduction for 3D ultrasound images by optimum threshold parameter estimation of bi-dimensional empirical mode decomposition using Fisher discriminant analysis. Int. J. Signal Imaging Syst. Eng. 2018, 11, 93–101. [Google Scholar] [CrossRef]


| Methods | Evaluation Criteria | ||
|---|---|---|---|
| SNR | EPF | MSE | |
| SRAD [22] | 33.3683 | 0.7318 | 0.6784 |
| OBLMN [23] | 31.2361 | 0.7057 | 0.6850 |
| ADMSS [24] | 32.0854 | 0.7298 | 0.6964 |
| Ours modified anisotropic filtering | 37.1687 | 0.9822 | 0.6391 |
| Super Resolution Techniques | Scale | PSNR | SSIM |
|---|---|---|---|
| Interpolation-based SR [26] | 2 | 32.3676 | 0.8154 |
| 3 | 27.7783 | 0.7564 | |
| 4 | 26.5639 | 0.6893 | |
| Reconstruction-based SR [27] | 2 | 32.4787 | 0.8395 |
| 3 | 29.3244 | 0.8330 | |
| 4 | 27.5691 | 0.7321 | |
| Learning-based SR | 2 | 33.7359 | 0.8674 |
| 3 | 29.9604 | 0.8071 | |
| 4 | 28.5632 | 0.7470 |
| CNN Models | Accuracy | Sensitivity | Specificity | F-Value |
|---|---|---|---|---|
| Scratch Model | 0.8294 | 0.8167 | 0.8421 | 0.8271 |
| Alexnet | 0.9285 | 0.9172 | 0.9397 | 0.9276 |
| VGG16 | 0.9361 | 0.9417 | 0.9305 | 0.9364 |
| ResNet50 | 0.9483 | 0.9469 | 0.9497 | 0.9496 |
| VGG19 | 0.9518 | 0.9409 | 0.9628 | 0.9591 |
| Feature Combination | Accuracy | Sensitivity | Specificity |
|---|---|---|---|
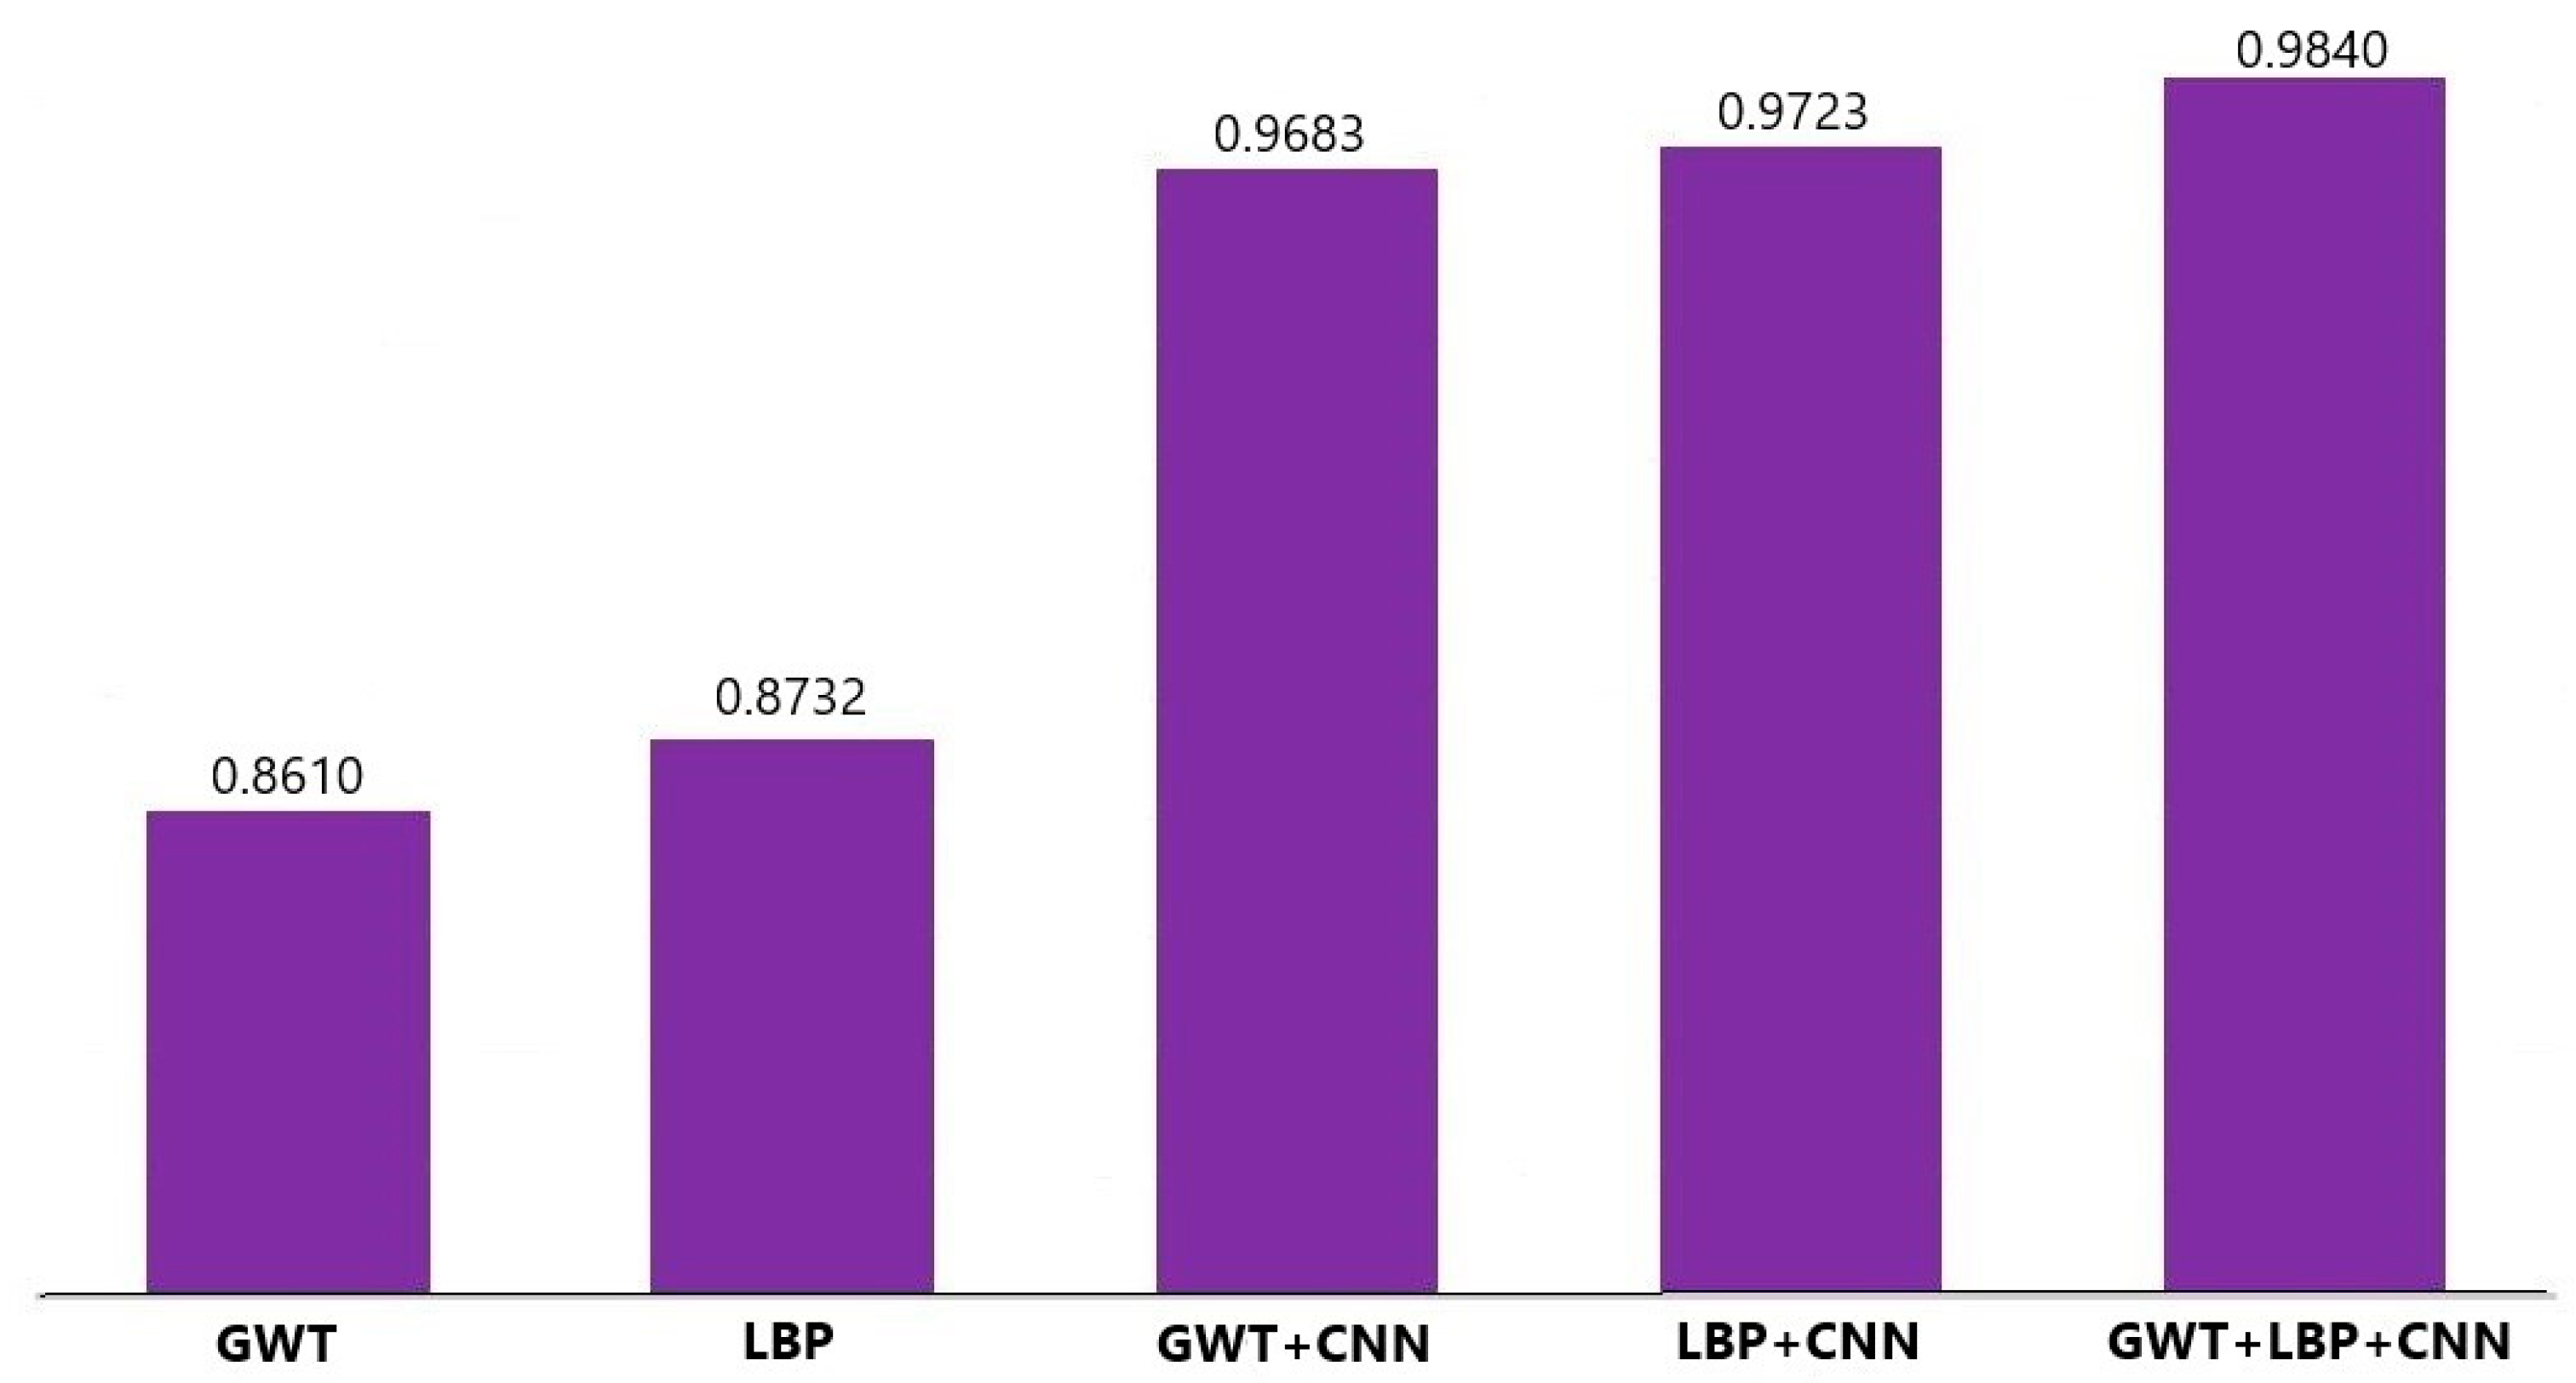
| GWT | 0.8610 | 0.8638 | 0.8581 |
| LBP | 0.8732 | 0.8850 | 0.8613 |
| GWT + CNN | 0.9683 | 0.9708 | 0.9658 |
| LBP + CNN | 0.9723 | 0.9749 | 0.9697 |
| Proposed fusion (GWT + LBP + CNN) | 0.9840 | 0.9867 | 0.9812 |
| Methods | Accuracy | Sensitivity | Specificity | F-Value |
|---|---|---|---|---|
| CNN only | 0.9073 | 0.9152 | 0.8994 | 0.9138 |
| Proposed fusion | 0.9502 | 0.9578 | 0.9426 | 0.9571 |
| Classifier Models | Accuracy | Sensitivity | Specificity | False Positive Rate | False Negative Rate |
|---|---|---|---|---|---|
| DT | 0.8979 | 0.9031 | 0.8726 | 0.0969 | 0.1274 |
| KNN | 0.9203 | 0.9257 | 0.9149 | 0.0851 | 0.0743 |
| RF | 0.9611 | 0.9706 | 0.9521 | 0.0479 | 0.0294 |
| ANN | 0.9618 | 0.9859 | 0.9375 | 0.0625 | 0.0141 |
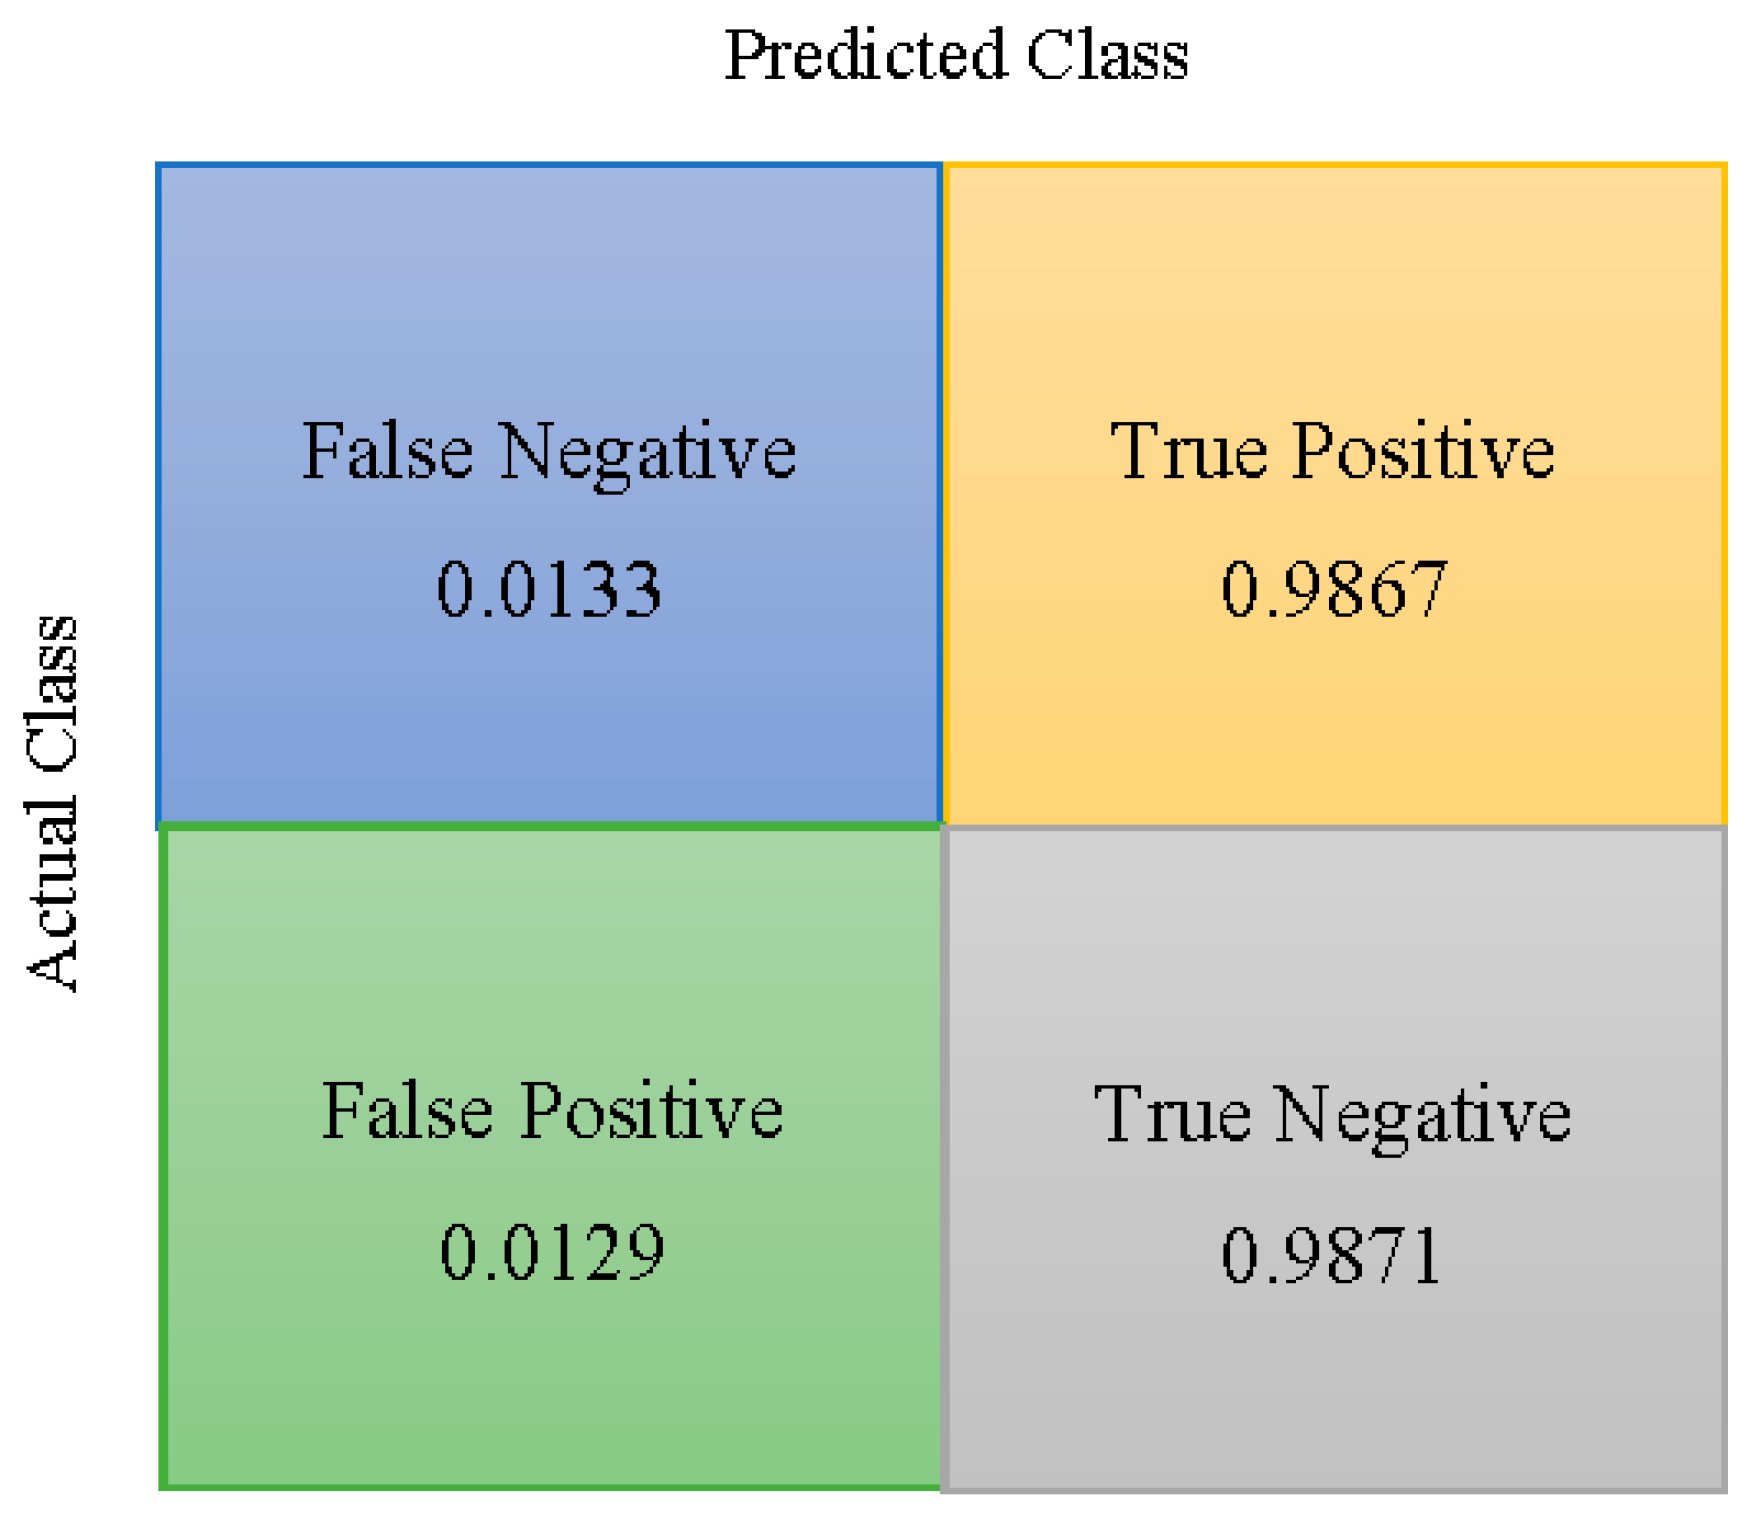
| SVM | 0.9840 | 0.9867 | 0.9812 | 0.0129 | 0.0133 |
| True Label | Predict Label | |
|---|---|---|
| Liver Lesion | Normal Liver | |
| Liver Lesion | (TP) 1824 | (FN) 176 |
| Normal Liver | (FP) 383 | (TN) 3617 |
| Method | Number of Patches | Time (s) |
|---|---|---|
| Informative patch selection | less than 100 | 10.0371 |
| Conventional patch extraction | 700–900 | 120.021 |
| Papers | Dataset | Methods | Results |
|---|---|---|---|
| Virmani [7] | 108 ultrasound | Texture features + PCA + SVM | Accuracy = 87.2% |
| Sakr [8] | 150 ultrasound | HL texture + Histogram + Multi-SVM | Accuracy = 96.11% |
| Hassan [9] | 110 ultrasound | SSAE + Softmax classifier | Accuracy = 97.2% |
| Balasubramanian [10] | 160 ultrasound | Gabor + GLCM + PCA + NPN | Accuracy = 90% |
| Kalyan [11] | 60 ultrasound | GLRLM + ANN | Accuracy = 92.5% |
| Xian [12] | 400 ultrasound | GLCM+FSVM | Accuracy = 97.0% |
| Jeon [13] | 150 ultrasound | Statistical features + SVM | Accuracy 80% |
| Virmani [14] | 108 ultrasound | Texture features + PCA + BPNN | Accuracy = 87.7% |
| Virmani [15] | 108 ultrasound | Texture ratio features + PCA + NN | Accuracy = 95% |
| Hwang [16] | 512 ultrasound | Hybrid textural features + PCA + feed-forward NN | Accuracy = 96% |
| Proposed Method | 298 ultrasound | GWT + LBP + CNN + SVM | Accuracy = 98.40% |
| Methods | Fold 1 | Fold 2 | Fold 3 | Fold 4 | Fold 5 | Mean Accuracy |
|---|---|---|---|---|---|---|
| GWT | 0.8572 | 0.8675 | 0.8521 | 0.8643 | 0.8638 | 0.8610 |
| LBP | 0.8732 | 0.8789 | 0.8741 | 0.8674 | 0.8730 | 0.8732 |
| GWT + CNN | 0.9681 | 0.9749 | 0.9628 | 0.9685 | 0.9673 | 0.9683 |
| LBP + CNN | 0.9751 | 0.9739 | 0.9704 | 0.9709 | 0.9713 | 0.9723 |
| Proposed fusion (GWT + LBP + CNN) | 0.9882 | 0.9847 | 0.9813 | 0.9827 | 0.9833 | 0.9840 |
© 2020 by the authors. Licensee MDPI, Basel, Switzerland. This article is an open access article distributed under the terms and conditions of the Creative Commons Attribution (CC BY) license (http://creativecommons.org/licenses/by/4.0/).
Share and Cite
Mostafiz, R.; Rahman, M.M.; Islam, A.K.M.K.; Belkasim, S. Focal Liver Lesion Detection in Ultrasound Image Using Deep Feature Fusions and Super Resolution. Mach. Learn. Knowl. Extr. 2020, 2, 172-191. https://0-doi-org.brum.beds.ac.uk/10.3390/make2030010
Mostafiz R, Rahman MM, Islam AKMK, Belkasim S. Focal Liver Lesion Detection in Ultrasound Image Using Deep Feature Fusions and Super Resolution. Machine Learning and Knowledge Extraction. 2020; 2(3):172-191. https://0-doi-org.brum.beds.ac.uk/10.3390/make2030010
Chicago/Turabian StyleMostafiz, Rafid, Mohammad Motiur Rahman, A. K. M. Kamrul Islam, and Saeid Belkasim. 2020. "Focal Liver Lesion Detection in Ultrasound Image Using Deep Feature Fusions and Super Resolution" Machine Learning and Knowledge Extraction 2, no. 3: 172-191. https://0-doi-org.brum.beds.ac.uk/10.3390/make2030010