Article

Templated Text Synthesis for Expert-Guided Multi-Label Extraction from Radiology Reports

1
Canon Medical Research Europe, Edinburgh EH6 5NP, UK
2
School of Computer Science, University of St Andrews, St Andrews KY16 9SX, UK
3
Institute of Neuroscience & Psychology, University of Glasgow, Glasgow G12 8QB, UK
4
School of Engineering, University of Edinburgh, Edinburgh EH9 3JL, UK
*
Author to whom correspondence should be addressed.
Mach. Learn. Knowl. Extr. 2021, 3(2), 299-317; https://0-doi-org.brum.beds.ac.uk/10.3390/make3020015
Submission received: 27 February 2021 / Revised: 16 March 2021 / Accepted: 18 March 2021 / Published: 24 March 2021

Abstract

:
Training medical image analysis models traditionally requires large amounts of expertly annotated imaging data which is time-consuming and expensive to obtain. One solution is to automatically extract scan-level labels from radiology reports. Previously, we showed that, by extending BERT with a per-label attention mechanism, we can train a single model to perform automatic extraction of many labels in parallel. However, if we rely on pure data-driven learning, the model sometimes fails to learn critical features or learns the correct answer via simplistic heuristics (e.g., that “likely” indicates positivity), and thus fails to generalise to rarer cases which have not been learned or where the heuristics break down (e.g., “likely represents prominent VR space or lacunar infarct” which indicates uncertainty over two differential diagnoses). In this work, we propose template creation for data synthesis, which enables us to inject expert knowledge about unseen entities from medical ontologies, and to teach the model rules on how to label difficult cases, by producing relevant training examples. Using this technique alongside domain-specific pre-training for our underlying BERT architecture i.e., PubMedBERT, we improve F1 micro from 0.903 to 0.939 and F1 macro from 0.512 to 0.737 on an independent test set for 33 labels in head CT reports for stroke patients. Our methodology offers a practical way to combine domain knowledge with machine learning for text classification tasks.

1. Introduction

Training medical imaging models requires large amounts of expertly annotated data, which is time-consuming and expensive to obtain. Fortunately, medical images are often accompanied by free-text reports written by radiologists describing their main radiographic findings (what the radiologist sees in the image e.g., hyperdensity) and clinical impressions (what the radiologist diagnoses based on the findings e.g., haemorrhage). Recent approaches to creating large imaging datasets have involved mining these reports to automatically obtain scan-level labels [1,2]. Scan-level labels can then be used to train anomaly detection algorithms, as demonstrated in the CheXpert challenge for automated chest X-Ray interpretation [1] and the Radiological Society of North America (RSNA) haemorrhage detection challenge [2]. For the task of extracting labels from head computed tomography (CT) scan reports (see Figure 1 and Figure 2), we have previously shown that we can train a single model to perform automatic extraction of many labels in parallel [3], by extending BERT [4] with a per-label attention mechanism [5]. However, extracting labels from text can be challenging because the language in radiology reports is diverse, domain-specific, and often difficult to interpret. Therefore, the task of reading the radiology report and assigning labels is not trivial and requires a certain degree of medical knowledge on the part of a human annotator [6]. When we rely on pure data-driven learning, we find that the model sometimes fails to learn critical features or learns the correct answer via simple heuristics (e.g., that presence of the word “likely” indicates positivity) rather than valid reasoning, and thus fails to generalise to rarer cases which have not been learned or where the heuristics break down (e.g., “likely represents prominent VR space or lacunar infarct” which indicates uncertainty over two differential diagnoses). McCoy et al. [7] suggested the use of templates to counteract a similar problem in sentiment analysis, for film and product reviews, to prevent syntactic heuristics being learned. We also previously performed simple data synthesis using simple templates, to provide minimal training examples of each class. In this work, we further develop the idea of template creation to do extensive data synthesis.
Our contributions are centred around incorporating medical domain knowledge into a deep learning model for text classification. We propose to use templates to inject expert knowledge of rare classes and class relationships, and to teach the model about labelling rules. Using template data synthesis alongside domain-specific pre-training for our underlying BERT architecture (PubMedBERT [9]), we are able to robustly extract a set of 33 labels related to neurological abnormalities from head CT reports for stroke patients. Our methodology offers a practical way to combine rules with machine learning for text classification. In summary:
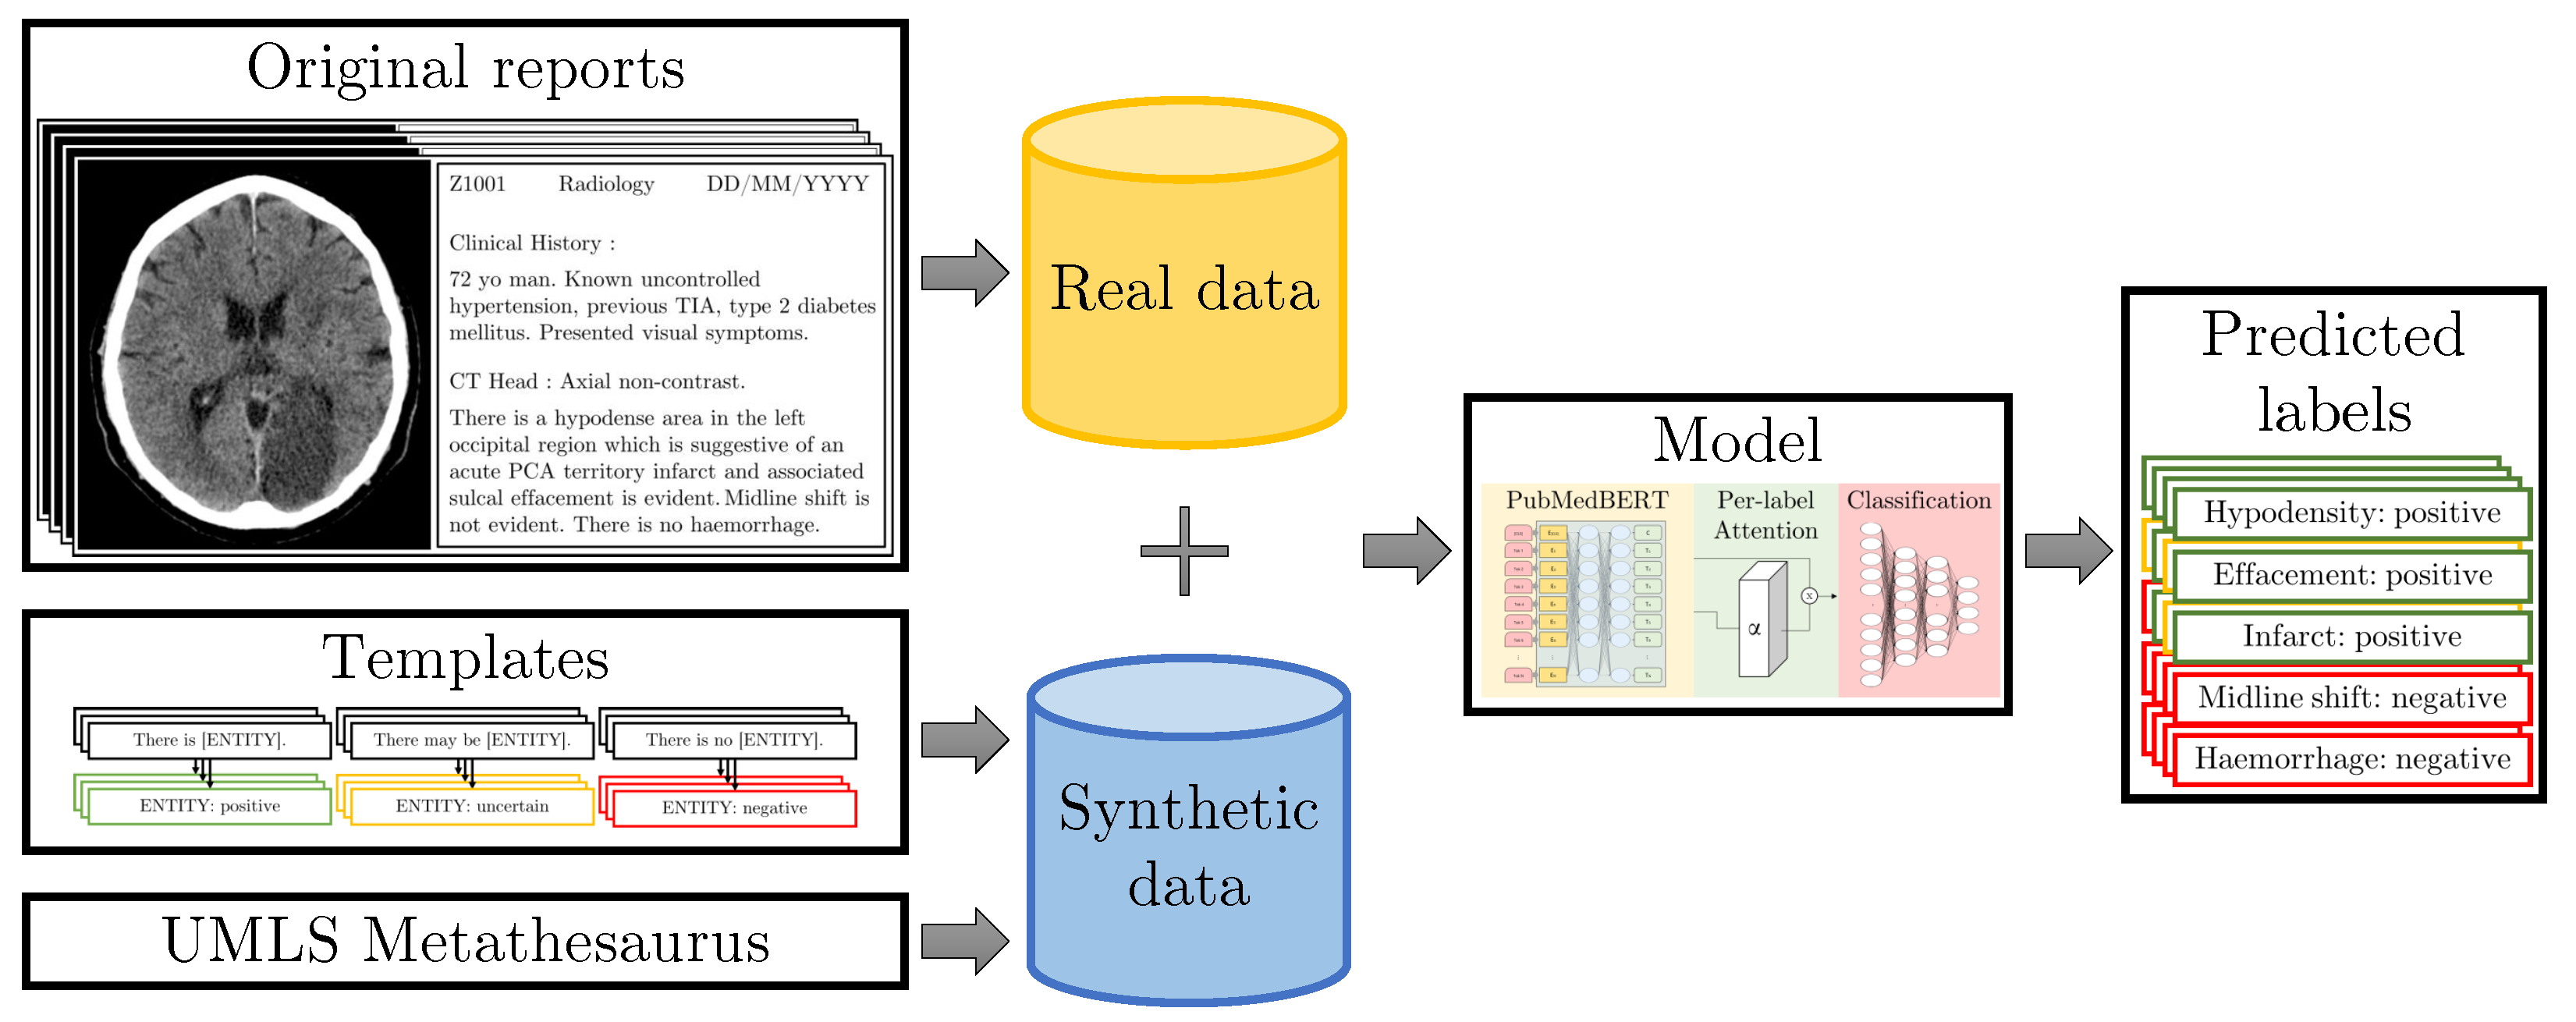
  • Building on our work in [3], we propose to use templates to strategically augment the training dataset with rare cases obtained from a medical knowledge graph and with difficult cases obtained from rules created by human experts during the course of manual annotation, enabling expert-guided learning via text data synthesis.
  • We analyse the impact of the vocabulary arising from domain-specific pre-training of BERT, and show why this improves accuracy.
  • We perform extensive validation of our methods, including a prospective validation on data which was unseen at the point of annotating the training dataset, and show that our methods enable improved generalisation and a convenient mechanism for adaptation.

2. Related Work

2.1. Radiology Report Labelling

Automatic extraction of labels from radiology reports has traditionally been accomplished using expert medical knowledge to engineer a feature extraction and classification pipeline [10]; this was the approach taken by Irvin et al. to label the CheXpert dataset of Chest X-rays [1] and by Grivas et al. in the EdIE-R method for labelling head CT reports [11]. These pipelines separate the individual tasks such as determining whether a label in mentioned or not (named entity recognition) and determining a label as being present (negation detection). An alternative is to design an end-to-end machine learning model that will learn to extract the final labels directly from the text. Simple approaches have been demonstrated using word embeddings or bag of words feature representations followed by logistic regression [12] or decision trees [13]. More complex approaches using a variety of neural networks have been shown to be effective for document classification by many authors [14,15], especially with the addition of attention mechanisms [3,5,16,17,18,19]. State-of-the-art solutions use existing pre-trained models, such as Bidirectional Encoder Representations from Transformers (BERT) [4], that have learnt underlying language patterns, and fine-tune them on small domain-specific datasets.

2.2. Pre-Training for Text Deep Learning Models

Different variants of BERT such as BioBERT [20] (as used by Wood et al. [17]) or PubMedBERT [9] use the same model architecture and pre-training procedures as the original BERT, but use different pre-training datasets, allowing the models to learn the context of domain-specific vocabulary.

2.3. Text Data Synthesis

Various approaches have been proposed for text data augmentation, targeting improved performance on some diverse natural language processing (NLP) applications. Synthetic data can be generated using very simple rule-based transformations including noise injection (inserting random words), random word deletion or number swapping [21,22]. Another approach to creating synthetic text data are to randomly split training documents or sentences into multiple training fragments. This has been shown to improve performance on text classification tasks [23]. Paraphrasing is a more sophisticated approach which is usually achieved by back-translation using neural machine translation models; this was used on the CheXpert dataset by Smit et al. [18]. Back-translation has been used in other tasks and settings too [24,25,26]. These approaches do indiscriminate augmentation based on the whole training corpus. By contrast, McCoy et al. [7] suggested the use of templates to target less common cases, which are underrepresented in the training data and do not obey the simple statistical heuristics that models tend to learn; in particular, they focused on creating a balanced dataset in which syntactic heuristics could not solve the majority of cases.

3. Materials and Methods

In this section, we first describe our dataset and annotation scheme, followed by a description of the method of data synthesis via templates which is the focus of this paper, followed finally by a description of the model architectures that we employ for our experiments.

3.1. NHS GGC Dataset

Our target dataset contains 28,687 radiology reports supplied by the West of Scotland Safe Haven within NHS Greater Glasgow and Clyde (GGC). We have acquired the ethical approval to use this data: iCAIRD project number 104690, University of St Andrews CS14871. A synthetic example report with a similar format to the NHS GGC reports can be seen in Figure 2.
Our dataset is split into five subsets: Table 1 shows the number of patients, reports, and sentences for each subset. We use the same training and validation datasets as previously used in [3]. We further validate on an independent test set consisting of 317 reports, a prospective test set of 200 reports, and an unlabelled test set of 27,940 reports. We made sure to allocate sentences from reports relating to the same patient to the same data subset to avoid data leakage. The annotation process was performed in two phases; Phase 1 on an initial anonymised subset of the data, and Phase 2 on the full pseudonymised dataset that we accessed onsite at the Safe Haven via Canon Medical’s AI training platform.
A list of 33 radiographic findings and clinical impressions found in stroke radiology reports was collated by a clinical researcher (5 years clinical experience and 2 years experience leading on text and image annotation) and reviewed by a neurology consultant; this is the set of labels that we aim to classify. Figure 3 shows a complete list of these labels. During the annotation process, each sentence was initially labelled by one of the two medical students (third and fourth year students with previous annotation experience). After annotating the sentences, difficult cases were discussed with the clinical researcher and a second pass was made to make labels consistent. We include inter-annotator comparisons between annotators and the final reviewed annotations for a subset of our data (1040 sentences) in Table 2. We see that the agreement between annotator 2 and the final reviewed version is higher than that of annotator 1. Annotator 1 and annotator 2 were slightly offset in annotation time, and the annotation protocol was updated before annotator 2 finished the first annotation iteration, enabling annotator 2 to incorporate these updates into their annotations and resulting in higher comparison scores.
Each sentence is labelled for each finding or impression as one of 4 certainty classes: positive, uncertain, negative, not mentioned. These are the same certainty classes as used by Smit et al. [18]. In the training dataset, the most common labels such as Haemorrhage/Haematoma, Infarct/Ischaemia and Hypodensity have between 150–350 mentions (100–200 positive, 0–50 uncertain, 0–150 negative) while the rarest labels such as abscess or cyst only occur once. Full details of the label distribution breakdown can be found in Appendix B.
We denote our set of labels as L, where F is the set of findings and I is the set of impressions; and our set of certainty classes as C, such that the number of labels is defined as n L = | L | = n F + n I = | F | + | I | and the number of certainty classes is defined as n C = | C | . For the NHS GGC dataset, n F = 15 , n I = 18 , n L = 33 and n C = 4 .

3.2. Templates for Text Data Synthesis

In this section, we describe some generic templates based on the labelling scheme, followed by two methods of integrating domain knowledge: “knowledge injection” and “protocol-based templates”.

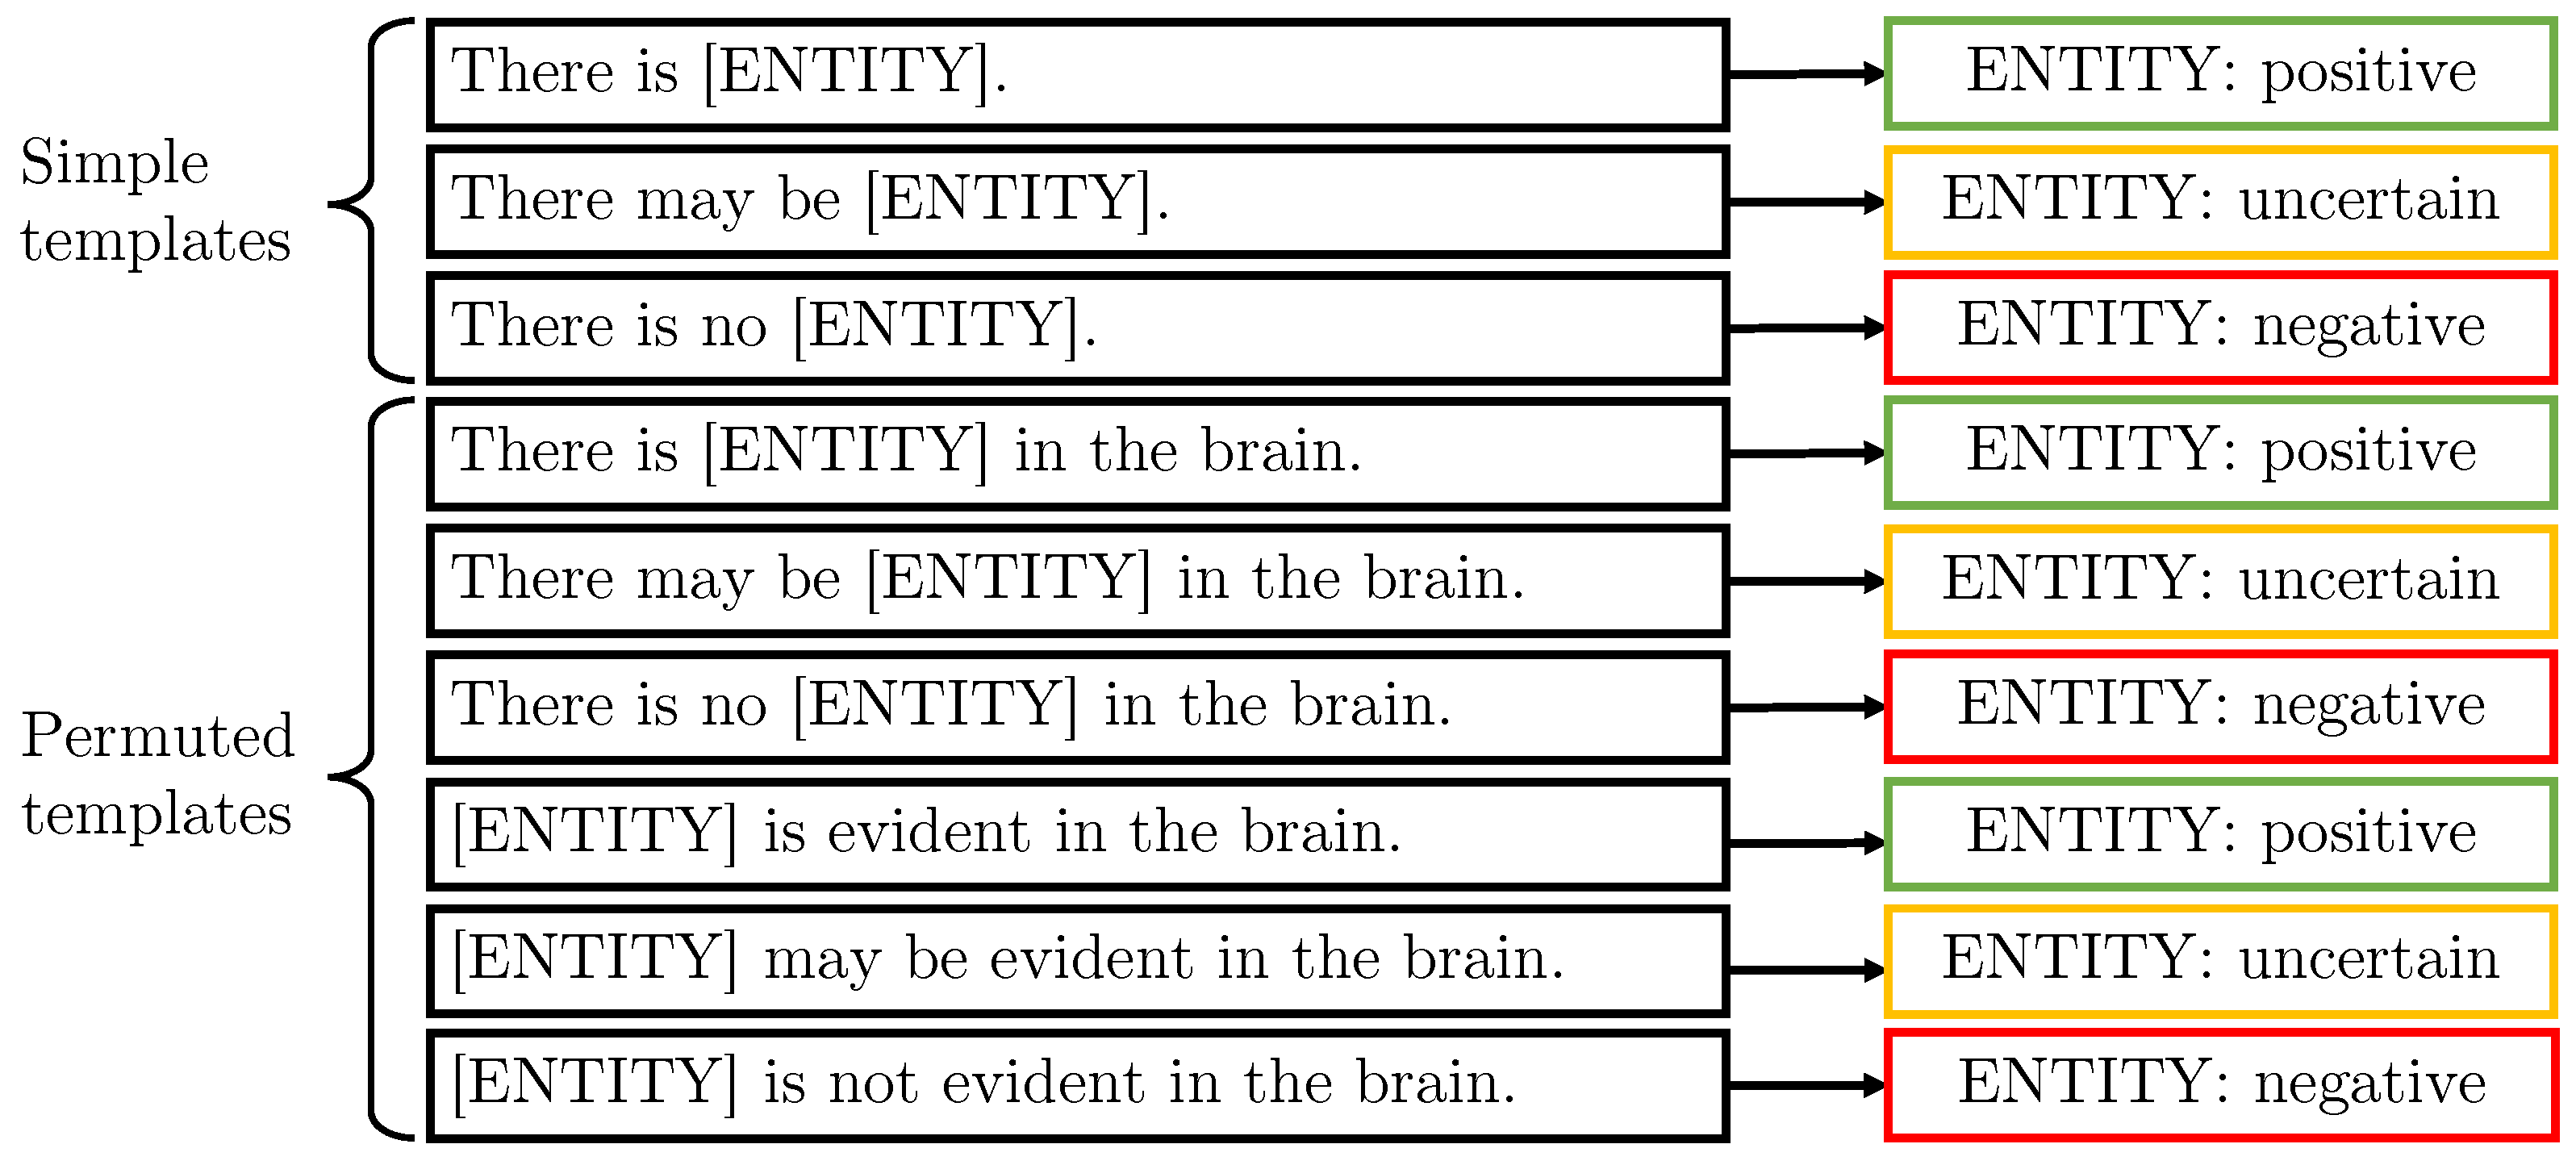
3.2.1. Generic Templates

Our generic templates are shown in Figure 4. Data synthesis involves replacing the ENTITY slot with each of the 33 label names in turn. The set of 3 simple templates allows the model to see every combination of certainty classes and labels (Figure 4). This enables learning of combinations that are not present in the original training data. This works well for labels where there is little variation in the terminology i.e., the label name is effectively always the way that the label is described, such as “lesion”. We also formulate a further 6 permuted templates, in which we change the word ordering and in particular the position of the label within the sentence, to inject diversity into the data.

3.2.2. Combining Templates

We use the meta-template shown in Figure 5 to generate more complex sentences containing entities with different uncertainty modifiers.
An example sentence generated by the above template is “There is hyperdensity in the brain and there is no infarct” which would be labelled as positive hyperdensity and negative infarct. If the random selection results in the same label but with different certainty classes, we use the following precedence rule to label the sentence with a single certainty class for that label: positive >negative>uncertain> not mentioned.

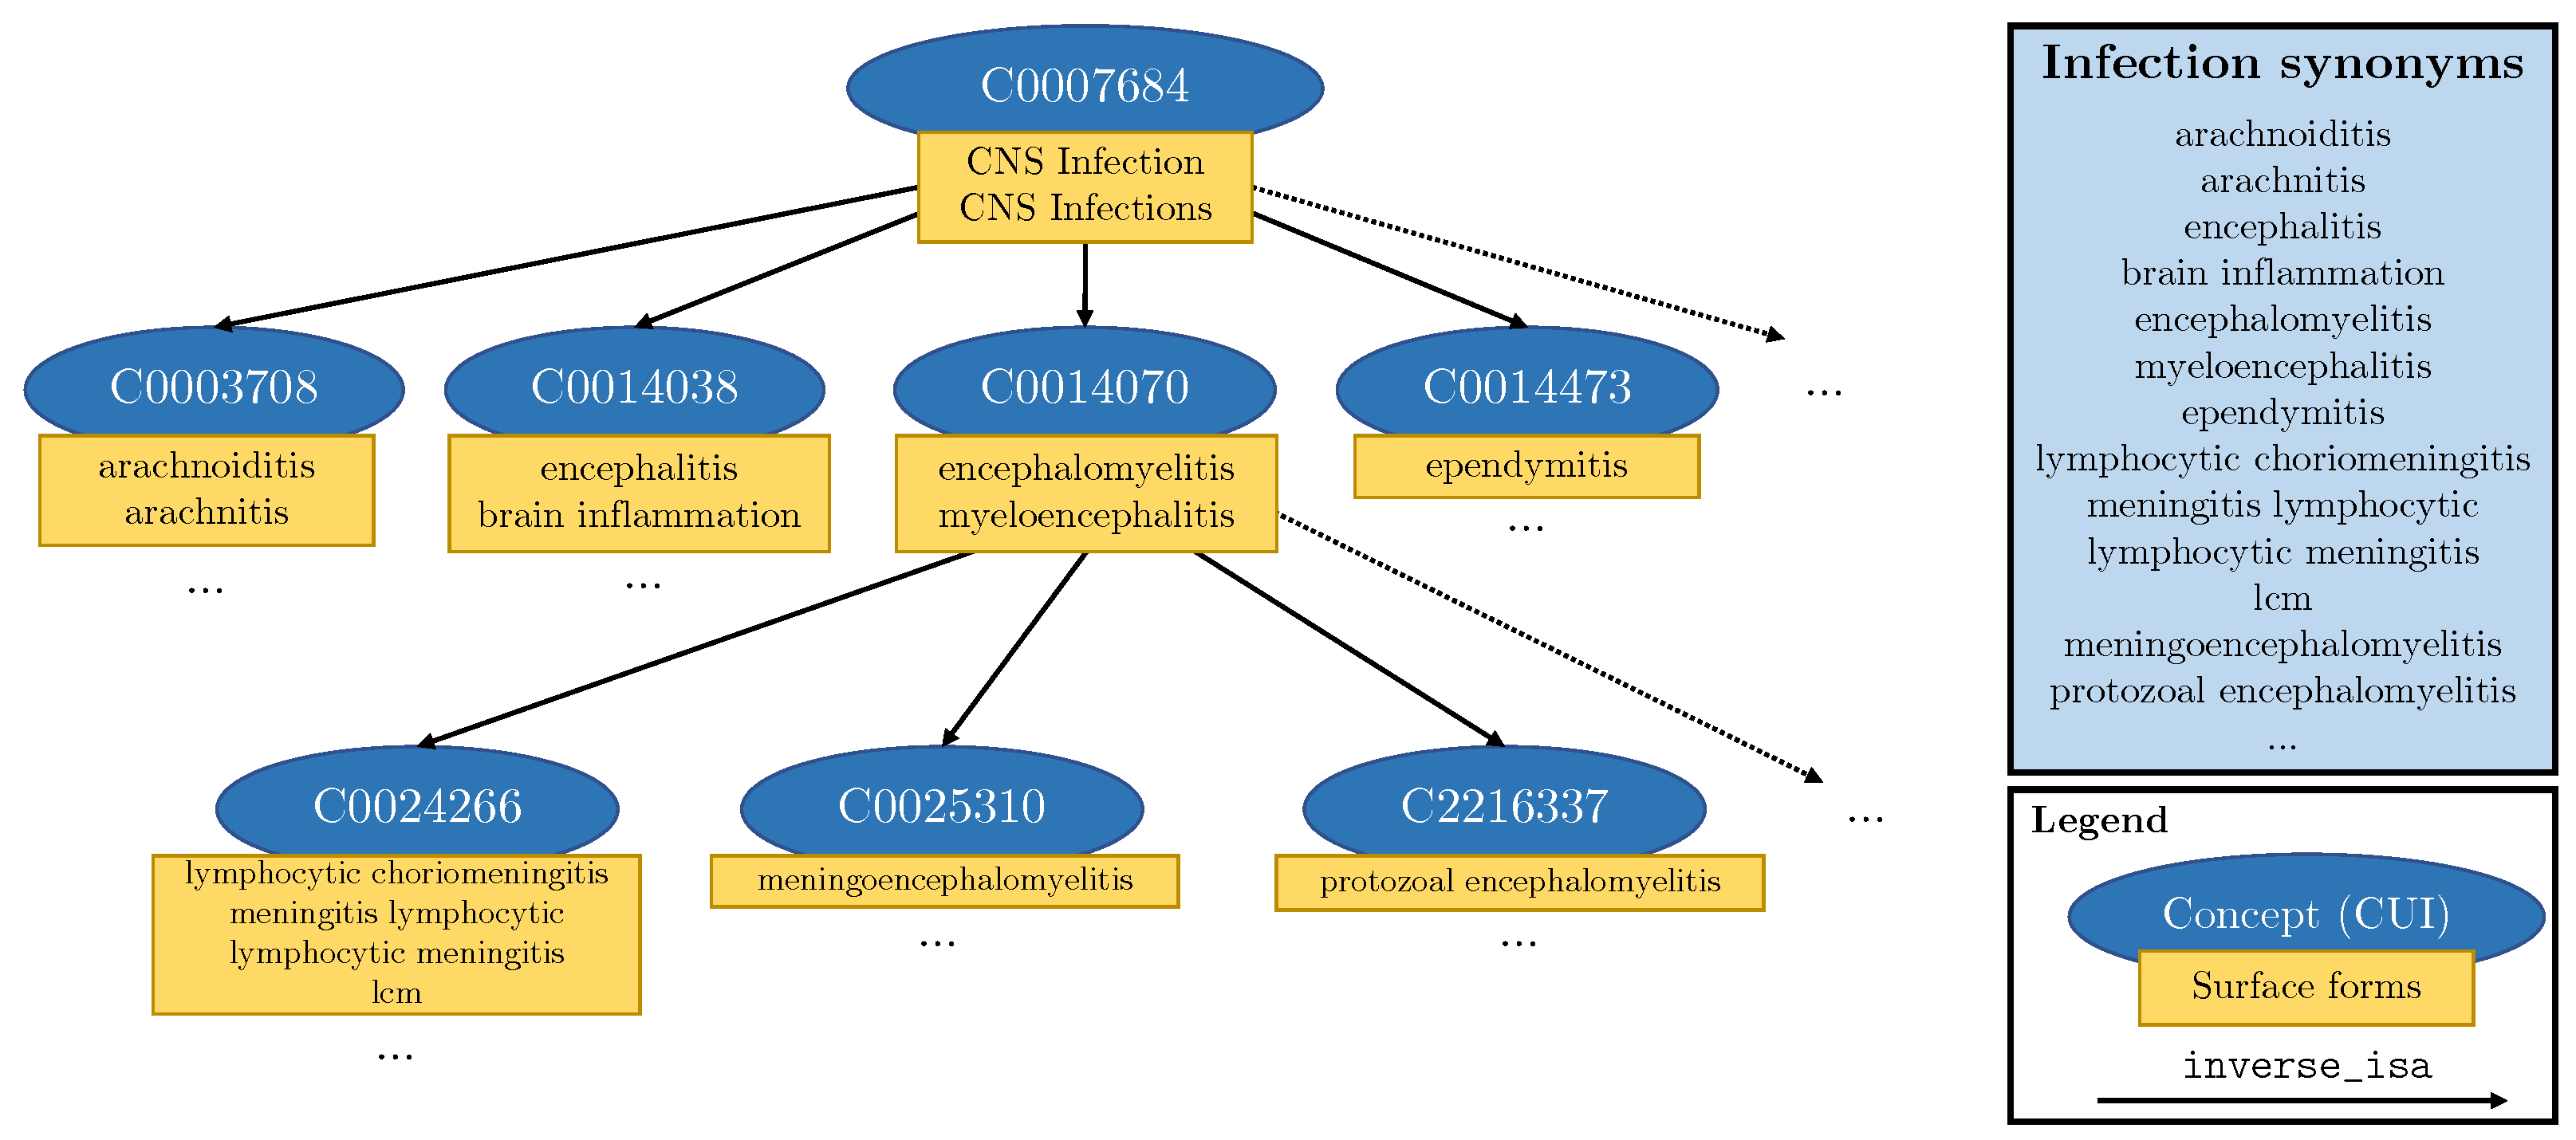
3.2.3. Knowledge Injection into Templates

Some of our labels have many different subtypes which are unlikely to be exhaustively represented in the data, and the label name is only one of many ways of mentioning label entities. In particular, the labels tumour and infection are rare in our dataset of stroke patients, with infection not present in our training data at all, but they have many diversely named subtypes.
We can obtain synonyms of labels from existing medical ontologies and insert these into the templates. In this paper, we use the Unified Medical Language System (UMLS) [8] which is a compendium of biomedical science vocabularies. The UMLS is made up of almost 4 million biomedical concepts, each with its own Concept Unique Identifier (CUI). Each concept in the UMLS knowledge graph has an associated thesaurus of synonyms known as surface forms. Furthermore, UMLS provides relationships between concepts, including hierarchical links (inverse_isa relationships) from general down to more specific concepts. For any given CUI, we can follow the inverse_isa links to identify its child subgraph. In order to obtain synonyms for tumour, we took the intersection of the subgraphs for brain disease (CUI: C0006111) and tumour (CUI: C0027651). In order to obtain synonyms for infection, we took the subgraph of CNS infection (CUI: C0007684)—see Figure 6. This process yielded synonyms such as “intracranial glioma” and “brain meningioma” for the label Tumour, and “cerebritis” and “encephalomyelitis” for the label Infection. In total, we retrieve 38 synonyms for tumour ( S tumour ) and 304 for infection ( S infection ). We inject these synonyms into templates by randomly substituting the label names with UMLS synonyms during training. This substitution technique ensures that labels with many synonyms do not overpower and outnumber labels with less or no synonyms.

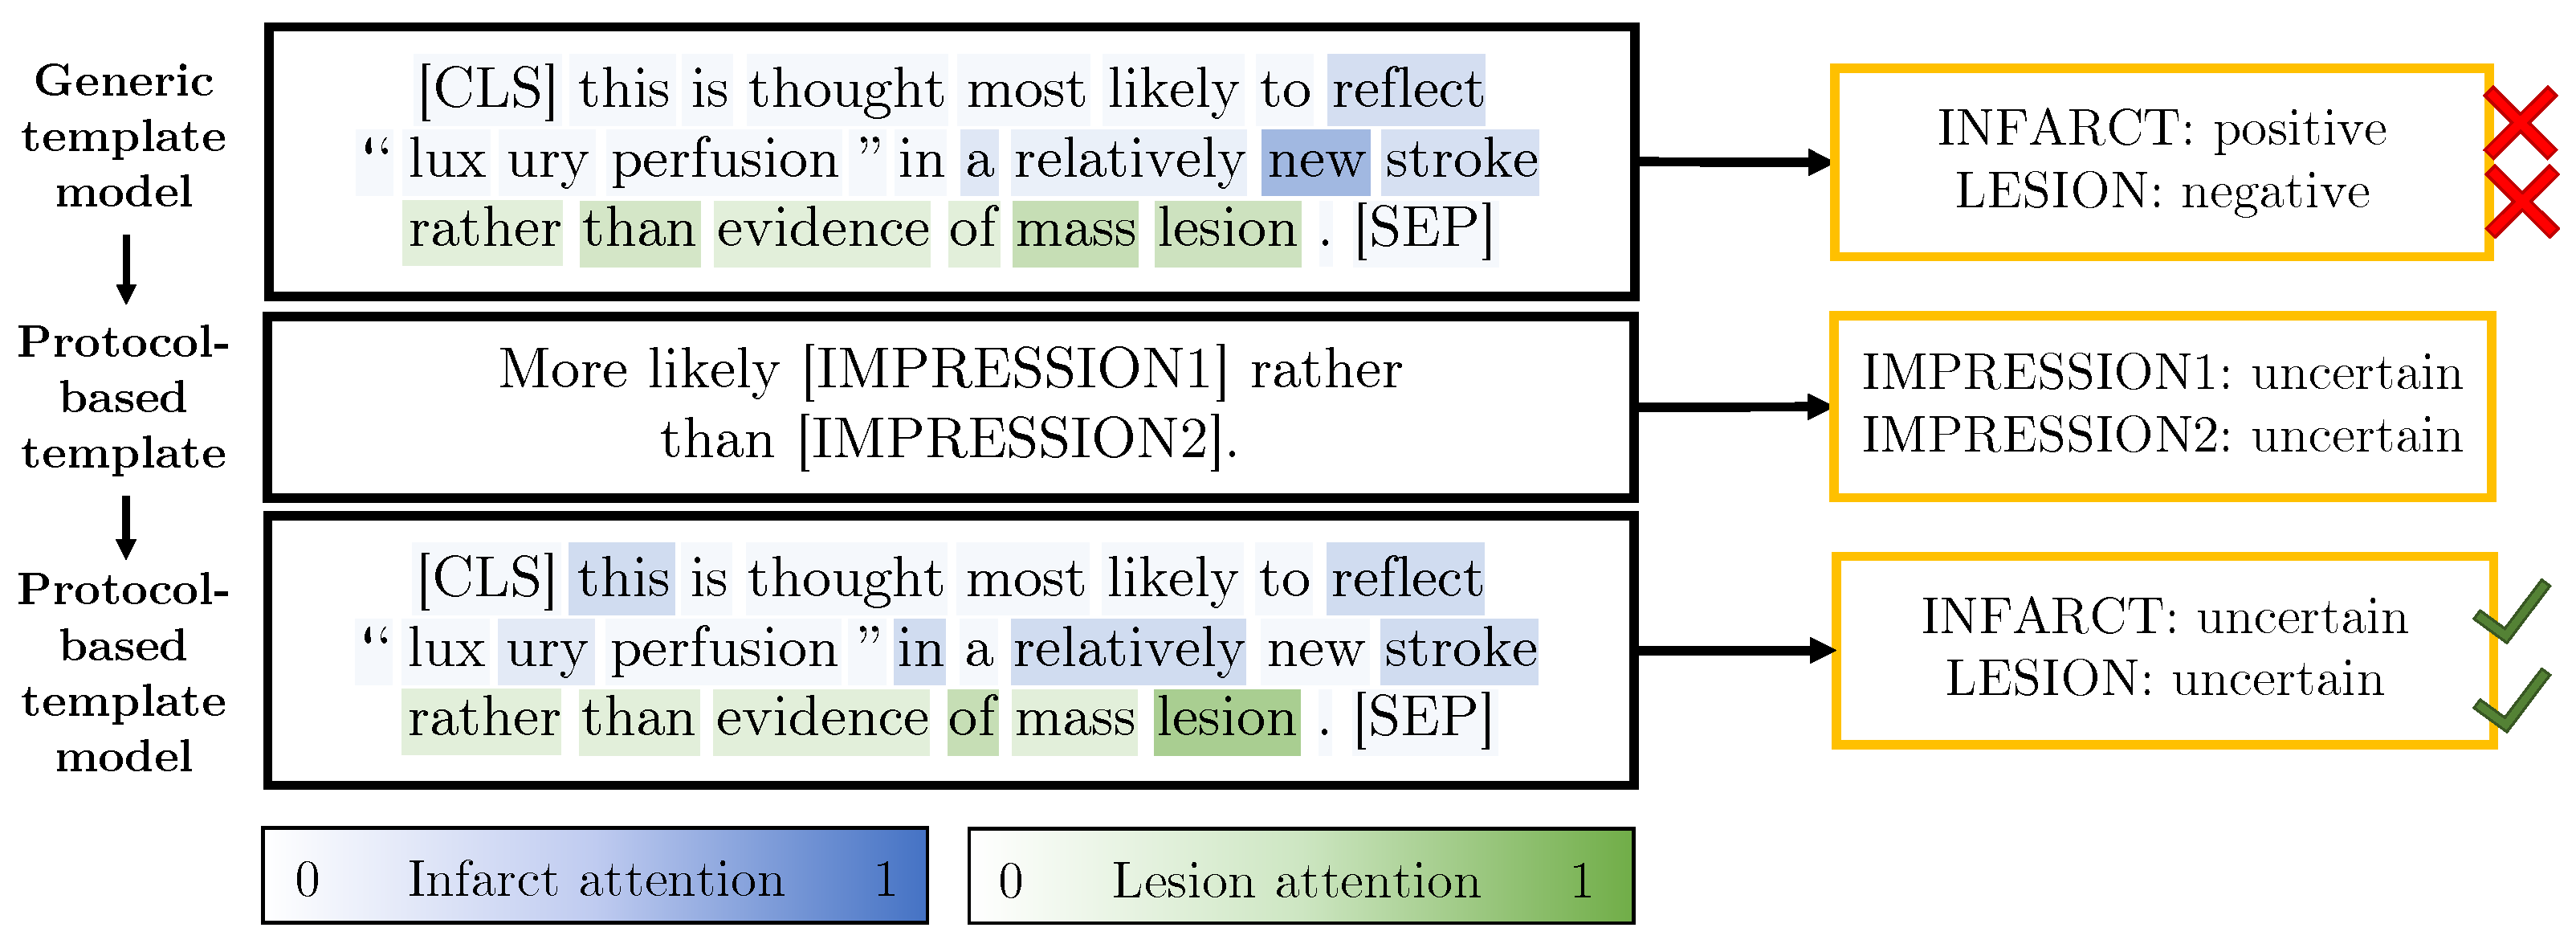
3.2.4. Protocol-Derived Templates

Creating a manual annotation protocol is difficult [6] and the protocol constantly evolves as new data are encountered and labelled. It is therefore useful to be able to encode certain phrases/rules from the protocol in a template so that they can be learned by the model. This is particularly useful for the certainty class modifiers, for instance “suggestive” compared to “suspicious”. The templates shown in Figure 7 have been derived from the protocol developed during Phase 1 annotation, and were chosen following analysis of the Phase 1 test set failure cases to identify which rules were not learned. We insert only the subset of labels that fit each template e.g., for the first two templates, we sample suitable entity pairs of finding and impressions according to the finding to impression links shown in Figure 3.

3.2.5. Synthetic Dataset Summary

Summary statistics for the synthetic datasets are shown in Table 3. It may be seen that, for some templates, we can generate a larger number of synthetic sentences than for others, due to the number of combinations of labels and label synonyms for each template. The total number of synonyms is S = S I + S F , where S F is the number of impression synonyms and S I is the number of finding synonyms. For this paper, S F = n F = 15 and S I = n I + S infection + S tumour = 18 + 38 + 304 . In Table 3, we use these numbers to define upper bounds for the number of sentences we can generate.
The number of unique synthetic sentences is larger than the number of original sentences. When we naively used all of this data, we observed that this has a negative effect on training, so we implement a sampling ratio between real and synthetic sentences to ensure that only 30% of samples in each training batch are from the synthetic dataset. This is applied across all of our synthetic approaches, including baselines. For practical reasons, we pre-select 400 random label combinations for each of the combined and protocol-based approaches although synonyms are randomly inserted at every training iteration. We chose the sampling ratio of 30% empirically based on our Phase 1 validation dataset.
We benchmark against two baseline data synthesis approaches: random deletion and random insertion. In the random deletion approach, we create a synthetic sentence for each original sentence in the training dataset by deleting a single randomly selected word each time. The random insertion approach similarly creates one synthetic sentence for each original sentence in the training dataset; however, here we insert a randomly selected stop word. We use the NLTK library’s list of English stop words [28] - stop words are the most frequent words used in a language such as “a”, “for”, “in” or “the” [29].

3.3. Models

In this section, we describe the models which we employ (implemented in Python). For all methods, data are pre-processed by converting to lower case and padding with zeros to reach a length of n t o k = 50 if the input is shorter. All models finish with n L softmax classifier outputs, each with n C classes, and are trained using a weighted categorical cross entropy loss and Adam optimiser [30]. We weight across the labels but not across certainty classes, as class weighting did not yield improvement. Given a parameter β = 0.9 which controls the size of the label re-weighting, the number of sentences n and the number of not mentioned occurrences of a label o l , we calculate the weights for each label using the training data as follows:
w l , not mentioned = n o l β w l , mentioned = n n o l β
Models are trained for up to 200 epochs with an early stopping patience of 25 epochs on F1 micro; for full details on execution times, see Appendix A. We note that early stopping typically occurs after 60–70 epochs, so models generally converge after 35–45 epochs. Hyperparameter search was performed through manual tuning on the validation set, based on the micro-averaged F1 metric. All models are trained with a constant learning rate of 0.00001 and a batch size of 32.

3.3.1. BERT Pre-Training Variants

All BERT variants use the same model architecture as the standard pre-trained BERT model, “bert-base-uncased” weights are available for download online (https://github.com/google-research/bert, accessed on 1 November 2020)—we use the huggingface [31] implementation. We take the output representation for the CLS token of size 768 × 1 at position 0 and follow with the n L softmax outputs. For BioBERT, we use a Bio-/ClinicalBERT model [20] pre-trained on both PubMed abstracts and the MIMIC-III dataset. We use the same training parameters as for BERT (above). The PubMedBERT model uses a different vocabulary to other BERT variants which is extracted from PubMed texts, and, therefore, it is more suited to medical tasks [9]. We use the pre-trained huggingface model (https://huggingface.co/microsoft/BiomedNLP-PubMedBERT-base-uncased-abstract-fulltext, accessed on 1 November 2020).

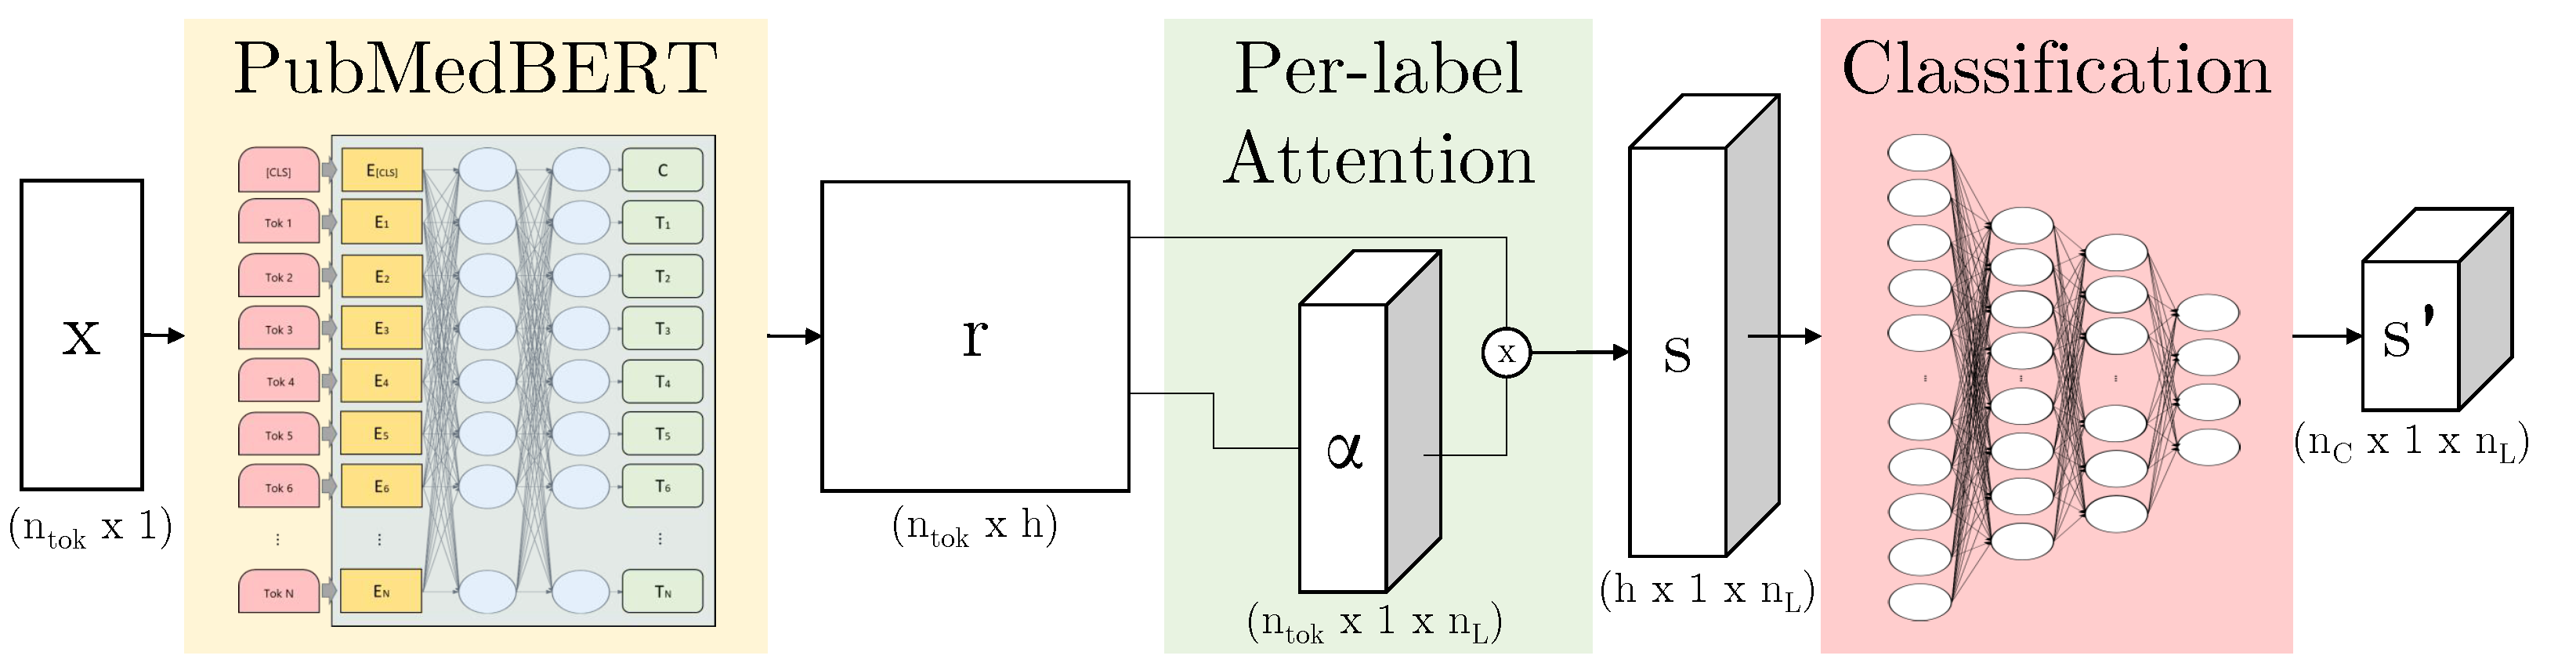
3.3.2. ALARM-Based Models

When training neural networks, we find that accuracy can be reduced where there are many classes. Here, we describe the per-label attention mechanism [32] as seen in Figure 8, an adaptation of the multi-label attention mechanism in the CAML model [5]. We can apply this to the output of any given neural network subarchitecture—here, we use it in combination with BERT variants. We define the output of the subnetwork as r R n t o k × h , where n t o k is the number of tokens and h is the hidden representation size. The parameters we learn are the weights W 0 R h × h and bias b 0 R h . For each label l, we learn an independent v l R h to calculate an attention vector α l R n t o k :
u = tanh ( r W 0 + b 0 )
α l = softmax ( u v l )
s l = α l r
The attended output s l R h is then passed through n L parallel classification layers reducing dimensionality from h to n C to produce s l for each label. During computation, the parallel representations can be concatenated into α , s and s respectively as shown in Figure 8.
Our ALARM + per-label-attention model, inspired by the ALARM [17] model, uses the entire learnt representation of size 768 × n t o k instead of using a single output vector of size 768 × 1 . We employ n L per-label attention mechanisms instead of a single shared attention mechanism before passing through three fully connected layers per label, and follow with the n L softmax outputs. Similar to the simple BERT model, we can substitute BioBERT or PubMedBERT for the underlying BERT model in this architecture.

4. Results

In this section, we firstly investigate the impact of the pre-training dataset and vocabulary on the task accuracy. Secondly, we investigate the effect of our data synthesis templates by validating on our Phase 1 data before going on to show how this model can be used on the prospective Phase 2 dataset. Finally, we compare our model to EdIE-R, a state-of-the-art rules-based approach for label extraction from Head CT radiology reports.
In terms of metrics, we report both micro- and macro-averaged F1 score: the micro score is calculated across all labels and gives an idea of the overall performance whilst the macro score is averaged across labels with equal weighting for each label (we do not weight equally across certainty classes). We note that, although we use micro F1 as our early stopping criterion, we do not observe an obvious difference in the scores if macro F1 is used for early stopping. We exclude the not mentioned class from our metrics, similar to the approach used by Smit et al. [18]. All results are reported as the mean and standard deviation of 10 runs with different random seeds.

4.1. What Impact Does the Pre-Training Dataset Have on Task Accuracy?

In this section, we investigate the impact of the BERT pre-training dataset on our model’s accuracy for label extraction. Table 4 shows the results for all models on our Phase 1 independent test set.
The results show that, regardless of the model architecture variant, the PubMedBERT pre-trained weights produce a positive effect on the results for both micro and macro F1. The main differences between the BERT variants are the pre-training datasets and the vocabulary that the models use, so we investigate this in more detail.
The BERT, BioBERT and PubMedBERT vocabularies contain 30,522; 28,996; and 30,522 words, respectively. BioBERT should have the same vocabulary as the original BERT model as it is initialised with that model’s weights; however, we find that the pre-trained implementations we are using have slightly differing vocabularies (a few words have been removed from the BioBERT vocabulary). We have 1827 unique words across the training, validation, and independent test datasets. Of those words, we find that 710 words are not in the vocabulary of the BERT model and similarly 784 words are not in the BioBERT vocabulary; we note that all 710 words that are unknown to BERT are also unknown to BioBERT. In comparison, only 496 words are not in the PubMedBERT vocabulary—461 of those words overlap with the BERT and BioBERT out of vocabulary (OOV) words. Table 5 shows the breakdown for our training, validation, and independent test datasets.
Table 6 highlights some different tokenisation outputs for five of our 33 labels. We see that words such as haemorrhage or hydrocephalus are known to the PubMedBERT model but are tokenised into five separate word pieces by the original BERT tokeniser. Thus, the model can learn to attend to one token rather than requiring to learn a sequence of five tokens.

4.2. What Impact Does Data Synthesis Have on Task Accuracy?

In this section, we report results on our independent test set that we introduced in Section 3.2. The results are shown in Table 7 for our best model, ALARM (PubMedBERT) + per-label attention. In addition to the F1 scores for all labels, we highlight performance on the Tumour label.
Table 7 shows that the baseline results for random deletion and insertion do not yield any improvements on our dataset. The sentences in our dataset are quite short, with most words carrying meaning, so deleting words actually harms our model. Comparing results for our subsets of synthetic data created by different types of templates, we can see that the injection of UMLS synonyms for the Tumour label makes a significant difference, giving a significant boost to the F1 macro score.
When training our model only on the template synthetic data (see ablations in Table 7), we see that the numbers are significantly lower than when combined with the original real data. This shows that the synthetic data do not contain the variety of language that was present in the real data, especially around expressing uncertainty. Furthermore, when adding UMLS synonyms, we targeted labels that were rare and poorly detected. If we wished to rely more heavily on data synthesis, we would also need to provide synonyms for the common labels.

4.3. What Impact Does Data Synthesis Have on Task Accuracy for Prospective Data?

During analysis of model performance on the independent test set, we notice recurring patterns in which our model trained with the generic template data repeatedly misclassifies positive and uncertain mentions. This is often due to very specific labelling rules that have been added to the protocol, e.g., “suggestive of” is always labelled as positive compared to “suspicious of” which is always labelled as uncertain. After evaluation of our independent test set, we extracted rules for the most common mistakes into templates as shown previously in Figure 7. We use the prospective test data to evaluate this new set of templates because the protocol was influenced by all three of our training, validation and independent test datasets (see results in Table 8).
To highlight the fast-changing human annotator protocol and the adaptability of our template system, we note that, when labelling the prospective test set, our annotators encountered various mentions of infections which did not fit into the set of labels at the time. The medical experts decided to add the Infection label to our labelling system (see Figure 3). Even though we have no training examples for this label, using our template system, we could easily generate additional training data for this label, including the injection of synonyms from UMLS.
Table 8 shows that the protocol-based templates provide small improvements for both micro and macro F1 performance. To further evaluate the addition of the protocol-based templates, we manually extract sentences from the unlabelled dataset which contain the phrases “suggestive”, “suspicious” and “rather than”. This search results in 510 sentences of which we randomly select a subset of 100 of these sentences for evaluation. The generic and protocol-based model predictions for these 100 sentences are compared. The protocol-based template model outperforms the previous model with an F1 micro score of 0.952 compared to 0.902. Figure 9 shows an example sentence for which the generic template model made the incorrect predictions and the protocol templates helped the protocol-based model make the correct predictions.

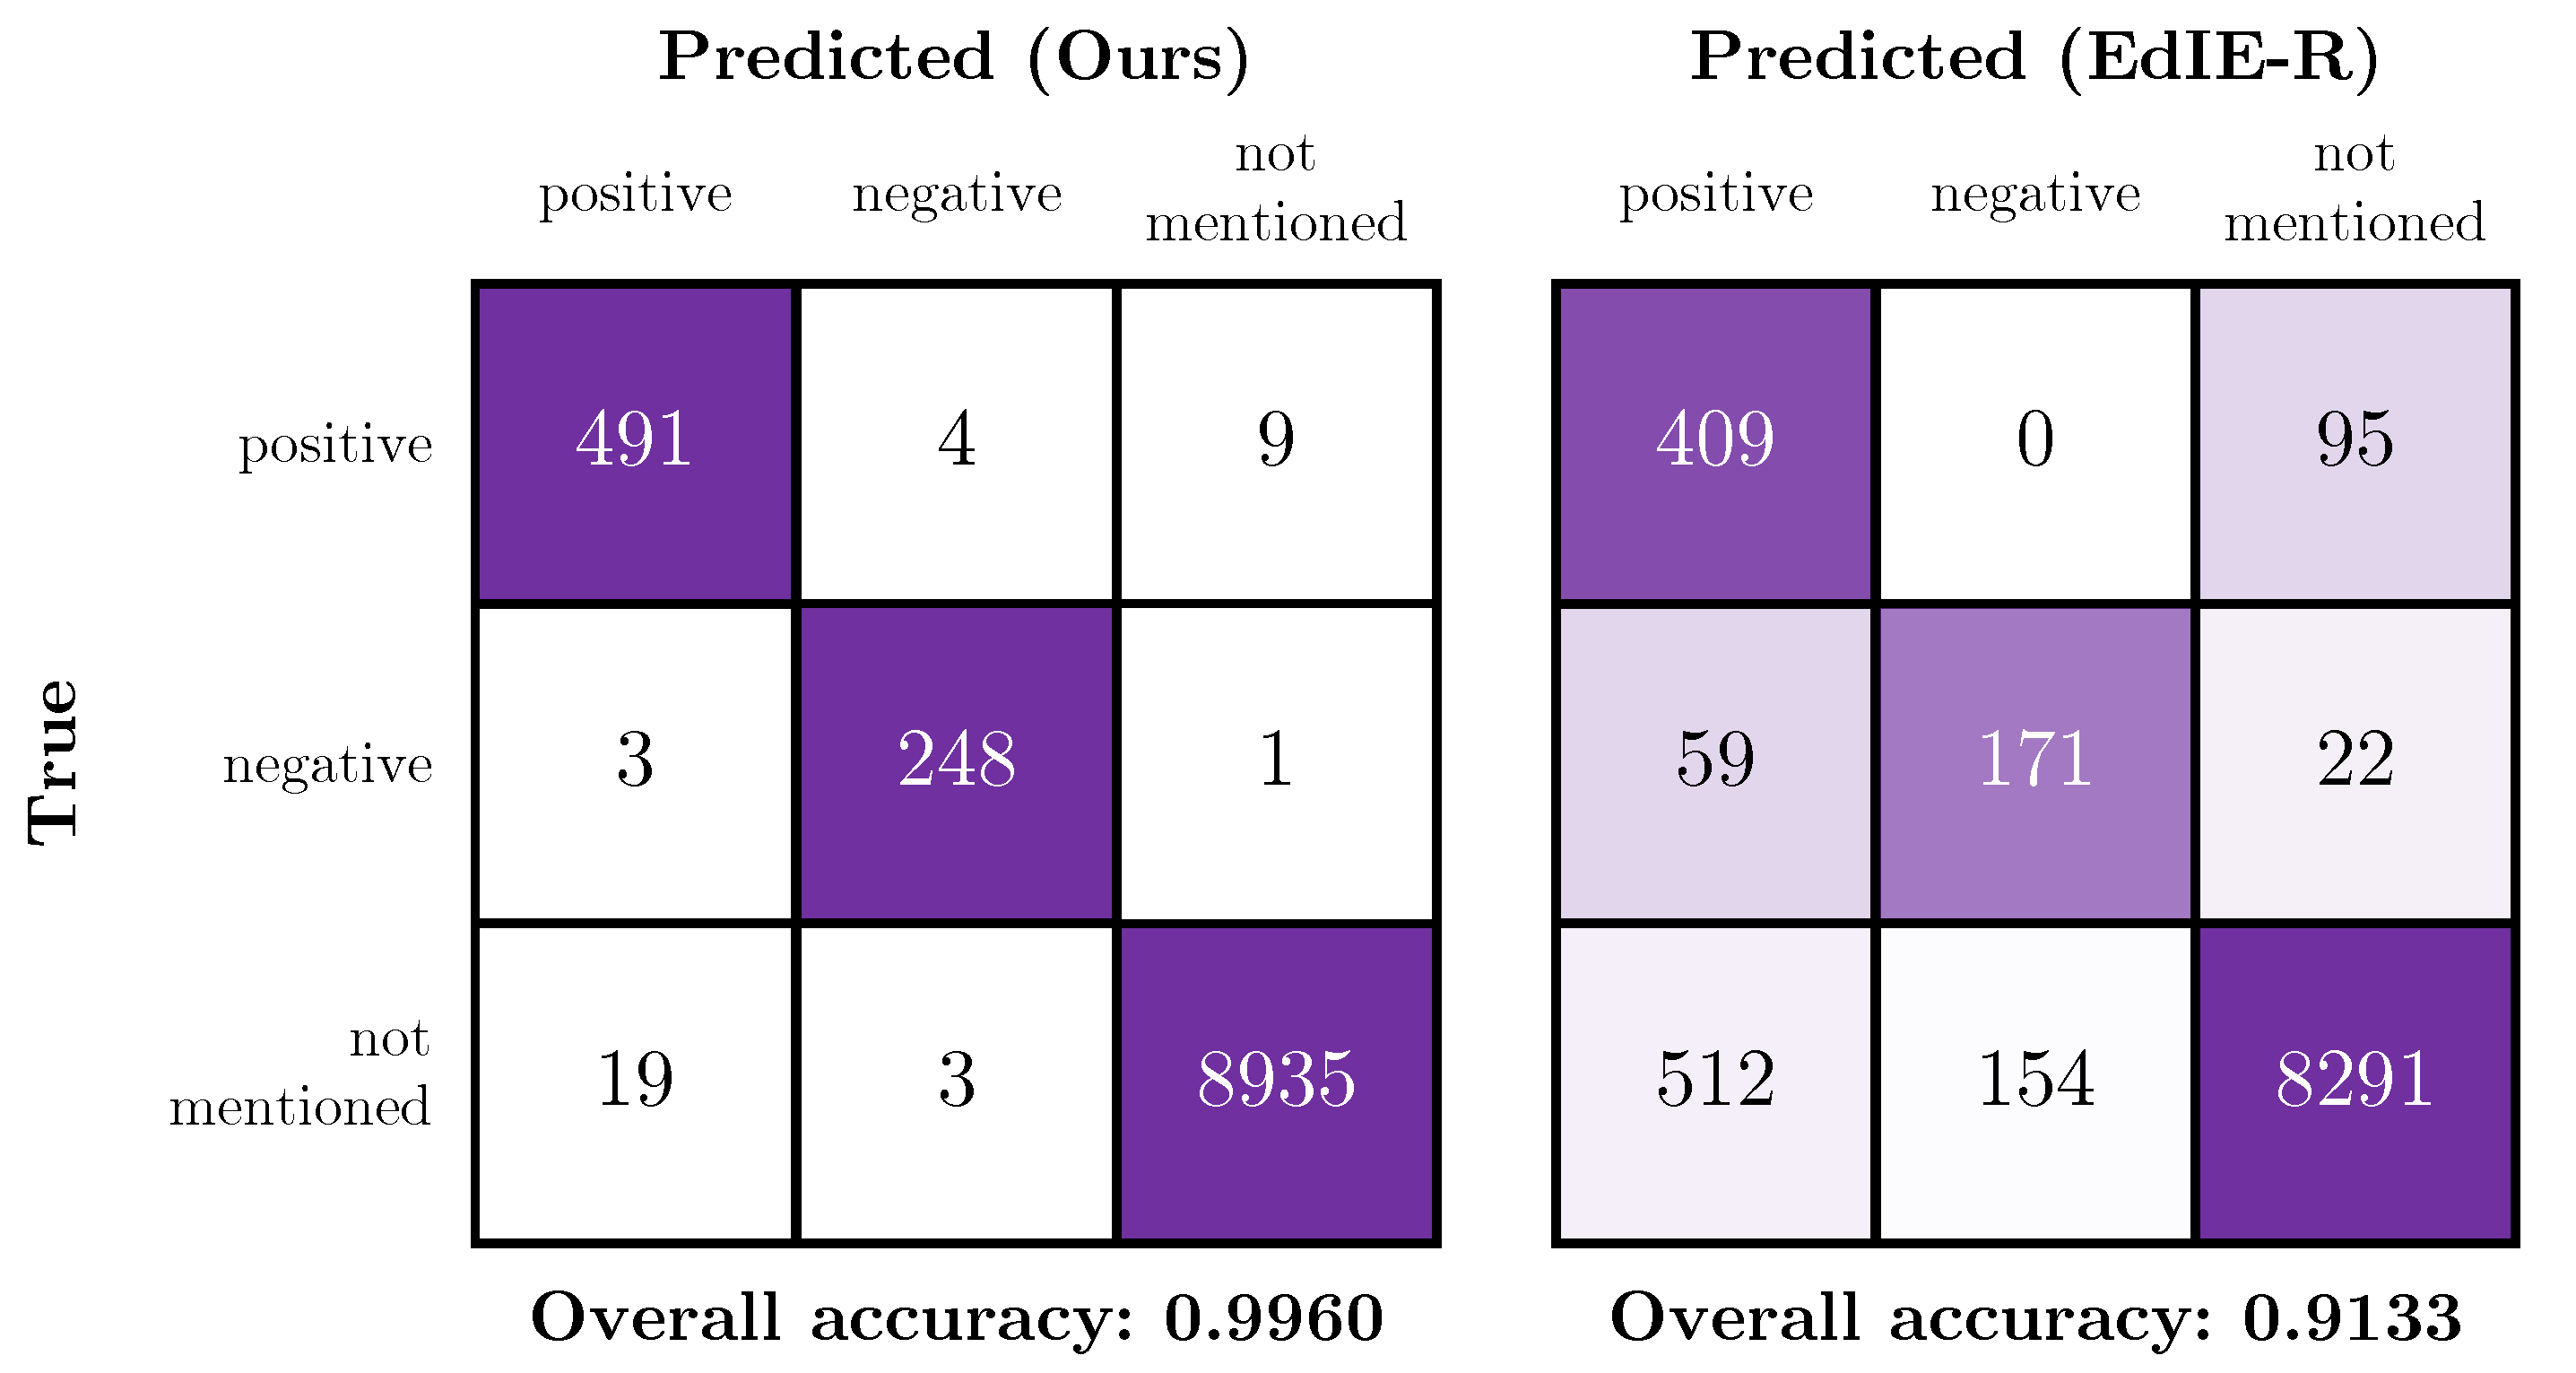
4.4. Comparison of the Proposed Method with a Rules-Based System

EdIE-R [11] is a rule-based system which has also been designed to label radiology reports for head CT scans from stroke patients [33]. However, the labels that the rules were created for are slightly different so, in order to compare this model with ours, we have mapped the EdIE-R labels to a subset of our labels as follows: Ischaemic stroke to Infarct/Ischaemia; Haemorrhagic stroke and Haemorrhagic transformation to Haemorrhage/Haematoma; Cerebral small vessel disease, Tumour and Atrophy to our identical labels. Since EdIE-R dichotomises labels into negative and positive mentions and does not explicitly model uncertain mentions, we have ignored uncertain mentions in our metric calculations. Therefore, the results in Table 9 are not directly comparable to those in other sections. We use the EdIE-R implementation provided by the authors (https://github.com/Edinburgh-LTG/edieviz, accessed on 1 November 2020).
Figure 10 shows confusion matrices of the certainty classes for our best model and the EdIE-R model, respectively; these figures contain results for the subset of labels that the models have in common. From these matrices and Table 9, it is clear that our model has a higher overall accuracy than the rules-based approach when evaluated on the independent test set. The “overall accuracy” metric shown in the figures is the simple accuracy metric over the three certainty classes positive, negative and not mentioned. Due to the differences in label definitions, the EdIE-R approach over-predicts positive mentions of the tumour label. On inspection, we observe that the EdIE-R system labels any mentions of “mass” as a tumour, while, in our system, a mass is only labelled as a tumour if there is a specific mention of “tumour” or subtype of tumour (e.g., “meningioma”); otherwise, we label as a (non-specific) Lesion. It is therefore likely that Tumour label is defined differently between our annotation protocol and the protocol used by Alex et al. [33].

5. Discussion

Our results show that we can successfully augment our training data with synthetic data generated from templates. These synthetic data guide our model to learn provided rules by example, creating a model which can benefit from both rules-based and deep learning approaches. As we have shown in Section 4.3, our approach is adaptable to new labels as the templates can be used to generate new training examples. However, our results also open some questions which we discuss in this section.

5.1. Difference in Accuracy between Phase 1 and Phase 2 Test Data

Phase 1 performance is close to the inter-annotator agreement F1 performance shown in Table 2, especially for F1 micro. We can expect that humans are better at picking out rare labels, so the gap between human and model F1 macro performance is slightly larger, although we have successfully narrowed the gap with the addition of templates. We observe that there is a drop in performance between the Phase 1 test data and the prospective Phase 2 test data of approximately 0.06 in both F1 micro and macro. This drop is consistent across all metrics and classes. On review of the data, we observe that there was not only a difference in the label distributions (e.g., with the new labels of Infection and Pneumocephalus appearing, see Appendix B) but also the number of sentences without labels is higher in the Phase 2 dataset; 44% of sentences in the Phase 2 dataset were not assigned any labels by the annotators, resulting in many more potentially confounding sentences than in the Phase 1 dataset in which 23% were not assigned any labels.
We posit two reasons for this increase in label-free examples. The Phase 2 dataset did not exclusively contain scans for suspected stroke events but also contained studies for other reasons e.g., sinus abnormalities. This arose because we had access to head CT radiology reports within an 18-month period either side of the stroke event. We further changed the method by which we extracted sentences between the two phases. In Phase 1, sentences were manually extracted from the body of the reports by human annotators, whereas, in Phase 2, we implemented an automatic pipeline to extract and segment a report into sentences. As a result, any human bias in sentence selection (effectively curation) was not reproduced in the automatic pipeline, and we observed that many more irrelevant sentences were extracted for annotation, for instance describing results from other types of scans (e.g., CTA) or other non-imaging patient details.
In summary, the Phase 2 dataset gave a good insight into performance “in the wild,” and we are satisfied that the performance drop was not excessive.

5.2. Limitations of the Comparison with EdIE-R

In this paper, we have shown that our approach performs more accurately than a pure rules-based approach such as EdIE-R. However, we did not have access to the dataset and labels on which EdIE-R was trained and validated, making the comparison an unequal one, especially since there are likely to be differences in the labelling rules.
The fact that the EdIE-R approach [11] is rules-based means it cannot simply be retrained on our dataset. Instead, it would be necessary to rewrite some of the rules in the system. Whilst this makes a fair comparison difficult, it also highlights the benefit of an approach such as ours which can be adapted to a change in the labelling system; the model can either be retrained on a different labelled dataset or suitable new data can be synthesised using templates. In the case of the definition of Tumour, in order to validate on a dataset labelled with the EdIE-R protocol, we could include “mass” (and any other synonyms of “mass” that UMLS provides) as a synonym for Tumour.

5.3. Synthetic Data Distribution

We have been careful to retain a valid data distribution when generating synthetic data. For the protocol-based templates, we selected only valid pairs of findings and impressions according to the scheme shown in Figure 3 and used only impression labels for the templates relating to clinical impressions. We performed ablation by creating synthetic data by selecting from all labels at random (results not shown in the paper) and did not notice a significant difference in accuracy, which suggests that the model is not heavily leveraging inter-label relationships.

5.4. Utilising Templates in an Online Learning Setting

A possible application of template data synthesis could be in an online learning setting. In this scenario, a human could actively spot misclassifications and edit/add new templates or synonyms to the database, which triggers the model to be retrained using the new templates. This would allow medical experts to continually update the model and fine-tune it for the datasets they are using. We could go further in the automation process and train a machine learning algorithm to propose templates for misclassifications to the human. The expert would then simply have to accept the template for the model to be retrained.

6. Conclusions

We have proposed the use of templates to inject expert knowledge of rare classes and to teach the model about labelling rules via synthetic data generated from templates. We have shown that, using this mechanism alongside domain-specific pre-training, we are able to robustly extract multiple labels from head CT reports for stroke patients. Our mechanism both gives better generalisation to the existing system and provides the ability to adapt to new classes or examples which are observed in the test population without requiring extensive further data annotation efforts.

Author Contributions

Conceptualization, P.S., H.W., D.H.-B. and A.Q.O.; methodology, P.S., H.W., E.P., M.P., H.M., K.W.M., D.H.-B. and A.Q.O.; software, P.S., M.P. and H.M.; validation, P.S. and A.Q.O.; formal analysis, P.S.; investigation, P.S.; resources, K.W.M.; data curation, H.W., E.P. and K.W.M.; writing—original draft preparation, P.S.; writing—review and editing, H.W., E.P., M.P., H.M., K.W.M., D.H.-B. and A.Q.O.; visualization, P.S.; supervision, D.H.-B. and A.Q.O.; project administration, D.H.-B. and A.Q.O.; funding acquisition, K.W.M., D.H.-B. and A.Q.O. All authors have read and agreed to the published version of the manuscript.

Funding

This work is part of the Industrial Centre for AI Research in digital Diagnostics (iCAIRD), which is funded by Innovate UK on behalf of UK Research and Innovation (UKRI) project number 104690. The Data Lab has also provided support and funding.

Institutional Review Board Statement

This work was conducted with NHS Greater Glasgow and Clyde Caldicott Guardian approval and additional oversight via the delegated research ethics of the West of Scotland Safe Haven Local Privacy and Advisory Committee (project GS/19/NE/004, approved on 6 June 2019). This work was also conducted with approval by the Ethics Committee of the University of St Andrews (CS14871, approved on 14 May 2020).

Informed Consent Statement

The use of unconsented patient data in this research was supported by West of Scotland Safe Haven within NHS Greater Glasgow and Clyde under the guidelines described in “A Charter for Safe Havens in Scotland—Handling Unconsented Data from National Health Service Patient Records to Support Research and Statistics” (Version November 2015, Scottish Government) and was conducted under the agreed principles and standards to support research when it is not practicable to obtain individual patient consent while protecting patient identity and privacy.

Data Availability Statement

Restrictions apply to the availability of this data. Data was obtained from the NHS Greater Glasgow and Clyde (GGC) Safe Haven and is available upon request from the iCAIRD programme via https://icaird.com/ (accessed on 1 November 2020).

Acknowledgments

We would like to thank the West of Scotland Safe Haven within NHS Greater Glasgow and Clyde for assistance in creating and providing this dataset. We would also like to thank Pia Rissom for contributing to data annotation; Grzegorz Jacenków and Murray Cutforth for paper review; and Vismantas Dilys for guidance on deep learning infrastructure setup.

Conflicts of Interest

The authors declare no conflict of interest.

Abbreviations

The following abbreviations are used in this manuscript:
ALARMautomated labelling using an attention model for radiology reports of MRI scans
BERTbidirectional encoder representations from transformers
BioBERTbidirectional encoder representations from transformers for biomedical text mining
CAMLconvolutional attention for multi-label classification
CNScentral nervous system
CPUcentral processing unit
CSVDcerebral small vessel disease
CTcomputed tomography
CUIconcept unique identifier
EdiE-REdinburgh information extraction for radiology reports
GGCGreater Glasgow and Clyde
GHzgiga hertz
GPUgraphics processing unit
iCAIRDIndustrial Centre for AI Research in digital Diagnostics
MIMICmedical information mart for intensive care
NHSnational health service
NLInatural language inference
NLPnatural language processing
NLTKnatural language toolkit
OOVout of vocabulary
PubMedBERTbidirectional encoder representations from transformers pre-trained using PubMed
RSNARadiological Society of North America
UKRIUnited Kingdom Research and Innovation
UMLSunified medical language system
VRAMvideo random access memory

Appendix A. Training and Inference Times

For all experiments, we use a machine with NVIDIA Tesla V100 SXM2 GPU (32 GB of VRAM), Intel Xeon CPU E5-2698 v4 (80 physical cores, maximum clock frequency of 3.6 GHz) and 528 GB of RAM. For details of all run times, see Table A1.
Table A1. Number of parameters, training time (over 838 samples) and inference time (per sample) for all models. All timings are given as mean standard deviation of 10 runs with different random seeds.
TrainingInference Time
Model ArchitecturePre-Trained Weights# ParametersTime [s][s/sample]
BERTBERT [4]109,586,824 580 1 0 . 017 0.000
BERTBioBERT [20]108,414,856 584 1 0 . 017 0.000
BERTPubMedBERT [9]109,586,824 588 1 0 . 017 0.000
ALARM + per-label attentionBERT127,985,800 696 160 0 . 027 0.001
ALARM + per-label attentionBioBERT126,813,832 710 108 0 . 025 0.001
ALARM + per-label attentionPubMedBERT127,985,800 767 143 0 . 026 0.003

Appendix B. Label Details

Table A2. Counts for our radiographic findings in each of our data subsets: training, validation, independent test and prospective test. “+” represents a positive mention, “?” represents an uncertain mention and “−” represents a negative mention. In the table body, a “-” represents 0 occurrences.
TrainValidationInd. TestProsp. Test
Finding+?+?+?+?
Hypodensity164--91--3589-1434-
Hyperdensity35352311859114555
Dilatation338-13214816-32-1
Collection13-2641141424311131
Mass effect24-11121136013935-20
Midline shift21-138-1052-3919-21
Effacement281111--52-421--
Herniation16-42-323-161124
Loss of differentiation14-671-411413-3
Compression11--7-116-25-2
Oedema10--12--35341134
Artefact6--2--162-181-
Swelling2--1--7--7--
Malacic changes2-----15--18--
Gliosis2-----14-15--
Table A3. Counts for our clinical impression labels in each of our data subsets: training, validation, independent test and prospective test. “+” represents a positive mention, “?” represents an uncertain mention and “−” represents a negative mention. In the table body, a “-” represents 0 occurrences.
TrainValidationInd. TestProsp. Test
Impression+?+?+?+?
Haemorrhage/Haematoma160713697774338202891168151
Infarct/Ischaemia1502457931937386601451902069
Cerebral small vessel disease602137-21495297-1
Lesion11-4711358-12713272
Involution/Atrophy541-5023129116911
Hydrocephalus1331352112133313-22
Calcification181-41-241-162-
Vessel occlusion67173-1613-671
Fracture1-10--6-12114-19
Evidence of surgery/intervention10--31-5--26--
Aneurysm61--2-31-31-
Tumour2-3-2-741341
Cavernoma-2----21----
Congenital abnormality-1-22-42-11-
Cyst-1-1--31-41-
Abscess-1----------
Infection---------65-
Pneumocephalus---------9-3

References

  1. Irvin, J.; Rajpurkar, P.; Ko, M.; Yu, Y.; Ciurea-Ilcus, S.; Chute, C.; Marklund, H.; Haghgoo, B.; Ball, R.; Shpanskaya, K.; et al. Chexpert: A large chest radiograph dataset with uncertainty labels and expert comparison. In Proceedings of the AAAI Conference on Artificial Intelligence, Honolulu, HI, USA, 27 January–1 February 2019; Volume 33, pp. 590–597. [Google Scholar]
  2. Radiological Society of North America. RSNA Intracranial Hemorrhage Detection (Kaggle Challenge). Available online: https://www.kaggle.com/c/rsna-intracranial-hemorrhage-detection/overview (accessed on 1 November 2020).
  3. Schrempf, P.; Watson, H.; Mikhael, S.; Pajak, M.; Falis, M.; Lisowska, A.; Muir, K.W.; Harris-Birtill, D.; O’Neil, A.Q. Paying Per-Label Attention for Multi-label Extraction from Radiology Reports. In Interpretable and Annotation-Efficient Learning for Medical Image Computing; Cardoso, J., Van Nguyen, H., Heller, N., Henriques Abreu, P., Isgum, I., Silva, W., Cruz, R., Pereira Amorim, J., Patel, V., Roysam, B., et al., Eds.; Springer International Publishing: Cham, Switzerland, 2020; pp. 277–289. [Google Scholar]
  4. Devlin, J.; Chang, M.W.; Lee, K.; Toutanova, K. BERT: Pre-training of Deep Bidirectional Transformers for Language Understanding. In Proceedings of the 2019 Conference of the North American Chapter of the Association for Computational Linguistics: Human Language Technologies, Volume 1 (Long and Short Papers), Minneapolis, MN, USA, 3–5 June 2019; Association for Computational Linguistics: Minneapolis, MN, USA, 2019; pp. 4171–4186. [Google Scholar] [CrossRef]
  5. Mullenbach, J.; Wiegreffe, S.; Duke, J.; Sun, J.; Eisenstein, J. Explainable Prediction of Medical Codes from Clinical Text. In Proceedings of the 2018 Conference of the North American Chapter of the Association for Computational Linguistics: Human Language Technologies, New Orleans, LA, USA, 2–4 June 2018; Association for Computational Linguistics: New Orleans, LA, USA, 2018; Volume 1, pp. 1101–1111. [Google Scholar] [CrossRef] [Green Version]
  6. Wood, D.A.; Kafiabadi, S.; Al Busaidi, A.; Guilhem, E.; Lynch, J.; Townend, M.; Montvila, A.; Siddiqui, J.; Gadapa, N.; Benger, M.; et al. Labelling Imaging Datasets on the Basis of Neuroradiology Reports: A Validation Study. In Interpretable and Annotation-Efficient Learning for Medical Image Computing; Cardoso, J., Van Nguyen, H., Heller, N., Henriques Abreu, P., Isgum, I., Silva, W., Cruz, R., Pereira Amorim, J., Patel, V., Roysam, B., et al., Eds.; Springer International Publishing: Cham, Switzerland, 2020; pp. 254–265. [Google Scholar]
  7. McCoy, T.; Pavlick, E.; Linzen, T. Right for the Wrong Reasons: Diagnosing Syntactic Heuristics in Natural Language Inference. In Proceedings of the 57th Annual Meeting of the Association for Computational Linguistics, Florence, Italy, 28 July–2 August 2019; Association for Computational Linguistics: Florence, Italy, 2019; pp. 3428–3448. [Google Scholar] [CrossRef]
  8. Bodenreider, O. The Unified Medical Language System (UMLS): Integrating biomedical terminology. Nucleic Acids Res. 2004, 32, 267D–270D. [Google Scholar] [CrossRef] [Green Version]
  9. Gu, Y.; Tinn, R.; Cheng, H.; Lucas, M.; Usuyama, N.; Liu, X.; Naumann, T.; Gao, J.; Poon, H. Domain-specific language model pretraining for biomedical natural language processing. arXiv 2020, arXiv:2007.15779. [Google Scholar]
  10. Yetisgen-Yildiz, M.; Gunn, M.L.; Xia, F.; Payne, T.H. A text processing pipeline to extract recommendations from radiology reports. J. Biomed. Inform. 2013, 46, 354–362. [Google Scholar] [CrossRef] [Green Version]
  11. Grivas, A.; Alex, B.; Grover, C.; Tobin, R.; Whiteley, W. Not a cute stroke: Analysis of Rule- and Neural Network-based Information Extraction Systems for Brain Radiology Reports. In Proceedings of the 11th International Workshop on Health Text Mining and Information Analysis, 2020 Conference on Empirical Methods in Natural Language Processing (EMNLP), Online, 16–20 November 2020; Association for Computational Linguistics: Monroe County, PA, USA, 2020; pp. 24–37. [Google Scholar] [CrossRef]
  12. Zech, J.; Pain, M.; Titano, J.; Badgeley, M.; Schefflein, J.; Su, A.; Costa, A.; Bederson, J.; Lehar, J.; Oermann, E.K. Natural language–based machine learning models for the annotation of clinical radiology reports. Radiology 2018, 287, 570–580. [Google Scholar] [CrossRef]
  13. Yadav, K.; Sarioglu, E.; Choi, H.; Cartwright IV, W.B.; Hinds, P.S.; Chamberlain, J.M. Automated Outcome Classification of Computed Tomography Imaging Reports for Pediatric Traumatic Brain Injury. Acad. Emerg. Med. 2016, 23, 171–178. [Google Scholar] [CrossRef] [PubMed]
  14. Yang, Z.; Yang, D.; Dyer, C.; He, X.; Smola, A.; Hovy, E. Hierarchical attention networks for document classification. In Proceedings of the 2016 Conference of the North American Chapter of the Association for Computational Linguistics: Human Language Technologies, San Diego, CA, USA, 12–17 June 2016; pp. 1480–1489. [Google Scholar]
  15. Banerjee, S.; Akkaya, C.; Perez-Sorrosal, F.; Tsioutsiouliklis, K. Hierarchical Transfer Learning for Multi-label Text Classification. In Proceedings of the 57th Annual Meeting of the Association for Computational Linguistics, Florence, Italy, 28 July–2 August 2019; pp. 6295–6300. [Google Scholar]
  16. Drozdov, I.; Forbes, D.; Szubert, B.; Hall, M.; Carlin, C.; Lowe, D.J. Supervised and unsupervised language modelling in Chest X-ray radiological reports. PLoS ONE 2020, 15, e0229963. [Google Scholar] [CrossRef] [PubMed]
  17. Wood, D.; Guilhem, E.; Montvila, A.; Varsavsky, T.; Kiik, M.; Siddiqui, J.; Kafiabadi, S.; Gadapa, N.; Busaidi, A.A.; Townend, M.; et al. Automated Labelling using an Attention model for Radiology reports of MRI scans (ALARM). In Proceedings of the Third Conference on Medical Imaging with Deep Learning; Montréal, QC, Canada, 6–9 July 2020; Proceedings of Machine Learning Research, Montréal, QC, Canada, 2020; pp. 811–826.
  18. Smit, A.; Jain, S.; Rajpurkar, P.; Pareek, A.; Ng, A.Y.; Lungren, M.P. CheXbert: Combining Automatic Labelers and Expert Annotations for Accurate Radiology Report Labeling Using BERT. In Proceedings of the 2020 Conference on Empirical Methods in Natural Language Processing (EMNLP), Online, 16–20 November 2020; Association for Computational Linguistics: Monroe County, PA, USA, 2020; pp. 1500–1519. [Google Scholar] [CrossRef]
  19. Falis, M.; Pajak, M.; Lisowska, A.; Schrempf, P.; Deckers, L.; Mikhael, S.; Tsaftaris, S.; O’Neil, A. Ontological attention ensembles for capturing semantic concepts in ICD code prediction from clinical text. In Proceedings of the Tenth International Workshop on Health Text Mining and Information Analysis (LOUHI 2019), Hong Kong, China, 3 November 2019; Association for Computational Linguistics: Hong Kong, China, 2019; pp. 168–177. [Google Scholar] [CrossRef]
  20. Alsentzer, E.; Murphy, J.; Boag, W.; Weng, W.H.; Jindi, D.; Naumann, T.; McDermott, M. Publicly Available Clinical BERT Embeddings. In Proceedings of the 2nd Clinical Natural Language Processing Workshop, 2019 Annual Conference of the North American Chapter of the Association for Computational Linguistics, Minneapolis, MN, USA, 6–7 June; Association for Computational Linguistics: Minneapolis, MN, USA, 2019; pp. 72–78. [Google Scholar] [CrossRef] [Green Version]
  21. Wei, J.; Zou, K. EDA: Easy Data Augmentation Techniques for Boosting Performance on Text Classification Tasks. In Proceedings of the 2019 Conference on Empirical Methods in Natural Language Processing and the 9th International Joint Conference on Natural Language Processing (EMNLP-IJCNLP), Hong Kong, China, 3–7 November 2019; Association for Computational Linguistics: Hong Kong, China, 2019; pp. 6382–6388. [Google Scholar] [CrossRef]
  22. Kryscinski, W.; McCann, B.; Xiong, C.; Socher, R. Evaluating the Factual Consistency of Abstractive Text Summarization. In Proceedings of the 2020 Conference on Empirical Methods in Natural Language Processing (EMNLP); Online, 16–20 November 2020; Association for Computational Linguistics: Monroe County, PA, USA, 2020; pp. 9332–9346. [Google Scholar] [CrossRef]
  23. Mercadier, Y.; Azé, J.; Bringay, S. Divide to Better Classify. In Artificial Intelligence in Medicine; Michalowski, M., Moskovitch, R., Eds.; Springer International Publishing: Cham, Switzerland, 2020; pp. 89–99. [Google Scholar]
  24. Mallinson, J.; Sennrich, R.; Lapata, M. Paraphrasing Revisited with Neural Machine Translation. In Proceedings of the 15th Conference of the European Chapter of the Association for Computational Linguistics, Valencia, Spain, 3–7 April 2017; Association for Computational Linguistics: Valencia, Spain, 2017; Volume 1, pp. 881–893. [Google Scholar]
  25. Iyyer, M.; Wieting, J.; Gimpel, K.; Zettlemoyer, L. Adversarial Example Generation with Syntactically Controlled Paraphrase Networks. In Proceedings of the 2018 Conference of the North American Chapter of the Association for Computational Linguistics: Human Language Technologies, New Orleans, LA, USA, 1–6 June 2018; Association for Computational Linguistics: New Orleans, LA, USA, 2018; Volume 1, pp. 1875–1885. [Google Scholar] [CrossRef]
  26. Appelgren, M.; Schrempf, P.; Falis, M.; Ikeda, S.; O’Neil, A.Q. Language Transfer for Early Warning of Epidemics from Social Media. arXiv 2019, arXiv:1910.04519. [Google Scholar]
  27. IST-3 Collaborative Group. Association between brain imaging signs, early and late outcomes, and response to intravenous alteplase after acute ischaemic stroke in the third International Stroke Trial (IST-3): Secondary analysis of a randomised controlled trial. Lancet Neurol. 2015, 14, 485–496. [Google Scholar] [CrossRef] [Green Version]
  28. Loper, E.; Bird, S. NLTK: The Natural Language Toolkit. In Proceedings of the ACL Workshop on Effective Tools and Methodologies for Teaching Natural Language Processing and Computational Linguistics. In Proceedings of the 2002 Conference on Empirical Methods in Natural Language Processing (EMNLP 2002), Philadelphia, PA, USA, 6–7 July 2002; Association for Computational Linguistics: Philadelphia, PA, USA, 2002. [Google Scholar]
  29. Manning, C.D.; Raghavan, P.; Schütze, H. Introduction to Information Retrieval; Cambridge University Press: Cambridge, MA, USA, 2008. [Google Scholar]
  30. Kingma, D.P.; Ba, J. Adam: A Method for Stochastic Optimization. In Proceedings of the 3rd International Conference on Learning Representations, ICLR, Conference Track Proceedings, San Diego, CA, USA, 7–9 May 2015. [Google Scholar]
  31. Wolf, T.; Debut, L.; Sanh, V.; Chaumond, J.; Delangue, C.; Moi, A.; Cistac, P.; Rault, T.; Louf, R.; Funtowicz, M.; et al. HuggingFace’s Transformers: State-of-the-art Natural Language Processing. arXiv 2019, arXiv:1910.03771. [Google Scholar]
  32. Bahdanau, D.; Cho, K.; Bengio, Y. Neural Machine Translation by Jointly Learning to Align and Translate. In Proceedings of the 3rd International Conference on Learning Representations, ICLR, Conference Track Proceedings, San Diego, CA, USA, 7–9 May 2015. [Google Scholar]
  33. Alex, B.; Grover, C.; Tobin, R.; Sudlow, C.; Mair, G.; Whiteley, W. Text mining brain imaging reports. J. Biomed. Semant. 2019, 10, 1–11. [Google Scholar] [CrossRef] [PubMed]
Figure 1. Our original set of radiology reports is annotated by three medical annotators (clinical researcher and medical students) at sentence-level. The training dataset is augmented with synthetic data generated from templates. We inject knowledge from the UMLS [8] meta-thesaurus and medical experts into the templates to teach the model about rare synonyms and annotation protocol rules. Our model then predicts labels for the given sentences.
Make 03 00015 g001
Figure 2. Example radiology report. The image (left) shows a slice from an example CT scan (Case courtesy of David Cuete, Radiopaedia.org, rID: 30225); there is a visible darker patch indicating an infarct. The synthetic radiology report (middle left) has a similar format to the NHS GGC data. We manually filter relevant sentences (middle right). The boxes (right) indicate which labels are annotated for each of the three sentences.
Make 03 00015 g002
Figure 3. Label schema: 13 radiographic findings, 16 clinical impressions and 4 crossover labels which are indicated with a single asterisk. Finding→impression links are shown schematically. * These labels fit both the finding and impression categories. ** Haematoma can indicate other pathology e.g., trauma. *** Where labels refer to chronic (rather than acute) phenomena, they indicate brain frailty [27].
Make 03 00015 g003
Figure 4. These are the “generic” templates which aim to provide an example for every entity class (simple templates) with entities at different positions in the sentence (permuted templates).
Make 03 00015 g004
Figure 5. Meta-template which specifies that two templates can be concatenated with the word “and”.
Make 03 00015 g005
Figure 6. Schematic representation of a part of the subgraph of the UMLS meta-thesaurus used to extract synonyms for infection. Blue ovals represent individual concepts (CUIs), while the attached yellow rectangles contain the different surface forms of that concept. Each arrow represents an inverse_isa relationship.
Make 03 00015 g006
Figure 7. Protocol-derived templates which generate examples of protocol-specific rules in action.
Make 03 00015 g007
Figure 8. Our model architecture: PubMedBERT [9] maps from input x to a hidden representation r (this subarchitecture indicated in yellow can be replaced by another BERT variant); per-label attention maps to s which contains a separate representation for each label; the attention vector α can be visualised by overlaying this on the original text, again per-label; finally, the representation is passed through three classification layers to produce a per-label per-class prediction s .
Make 03 00015 g008
Figure 9. An example sentence from the unlabelled dataset with predictions made by our generic (top) and protocol-based (bottom) template models. The attention for the infarct and lesion labels is overlaid on the sentences. The protocol-based template shown in the middle row of the figure enables the model to correctly classify these sentences. To simplify the visualisation, the higher-weight attention (either for infarct or lesion) has been overlaid on each word.
Make 03 00015 g009
Figure 10. Confusion matrices showing the performance of our model (left) and the EdIE-R (right) on the independent test data across the certainty class subset of positive, negative and not mentioned.
Make 03 00015 g010
Table 1. Summary statistics for the NHS GGC datasets used in this work. The validation set is used for hyperparameter and best model selection.
Dataset# Patients# Reports# Sentences
Phase 1 (Initial)Training138138839
Validation9292515
Test—Independent3173171950
Phase 2 (Prospective)Test—Prospective1972001411
Test—Unlabelled10,11227,940228,170
Table 2. Comparisons between the two medical student annotators (“Annotator 1” and “Annotator 2”) and the final reviewed data (“Reviewed”). We report Cohen’s kappa, F1 micro and F1 macro for 1044 sentences from 138 reports that were annotated by both annotators.
ComparisonCohen’s KappaF1 MicroF1 Macro
Annotator 1 vs. Annotator 20.9000.9450.897
Annotator 1 vs. Reviewed0.9180.9530.865
Annotator 2 vs. Reviewed0.9700.9830.939
Table 3. Summary statistics for the synthetic datasets used in this work. For the templates, the number of generated sentences depends on the total number of synonyms S, the number of finding synonyms S F and the number of impression synonyms S I . For the compound templates (combined, protocol-based), the number of generated sentences further depends on the template [label] combinations that are samples; here, we indicate the upper bound (UB).
# Generated# Generated
Data Synthesis Method# TemplatesTemplate [Label]Sentences
BaselinesRandom insertion--840
Random deletion--840
Templated data
synthesis
Simple templates399 3 * S
Permuted templates6198 6 * S
Combined templates1400 S 2 (UB)
Protocol-derived templates4400 2 * S F * S I + 2 * S I 2 (UB)
Table 4. Micro- and macro-averaged F1 results as mean standard deviation of 10 runs with different random seeds. Bold indicates the best model for each metric.
Model ArchitecturePre-Trained WeightsF1 MicroF1 Macro
BERTBERT [4] 0.855 0.006 0.418 0.010
BERTBioBERT [20] 0.869 0.004 0.457 0.013
BERTPubMedBERT [9] 0.891 0.004 0.467 0.013
ALARM + per-label attentionBERT 0.869 0.006 0.447 0.018
ALARM + per-label attentionBioBERT 0.877 0.004 0.489 0.008
ALARM + per-label attentionPubMedBERT 0.903 0.007 0.512 0.010
Table 5. Comparison of BERT, BioBERT and PubMedBERT unknown vocabulary in our dataset.
# Words Not in Vocabulary (% of Total)
ModelTrainValidationTestAll
BERT356 (34%)236 (30%)539 (37%)710 (39%)
BioBERT400 (38%)268 (34%)594 (41%)784 (43%)
PubMedBERT211 (20%)148 (19%)370 (26%)496 (27%)
Table 6. Comparison of tokeniser output for original BERT and PubMedBERT. We show the number of tokens in brackets, followed by the tokens separated by the conventional ## symbol.
Input WordBERT Tokeniser OutputPubMedBERT Tokeniser Output
haemorrhage(5)ha## em## or## r## hage(1)haemorrhage
hydrocephalus(5)h## ydro## ce## pha## lus(1)hydrocephalus
haematoma(4)ha## ema## tom## a (2)haemat## oma
hyperdensity(4)h## yper## den## sity (4)hyper## den## si## ty
hypodensity(5)h## y## po## den## sity(4)hypo## den## si##  ty
Table 7. Micro- and macro-averaged F1 results on our independent test set as mean standard deviation of 10 runs with different random seeds. Bold indicates the best model for each metric.
All LabelsTumour
Data Synthesis MethodF1 MicroF1 MacroF1 Micro
Real data only 0.903 0.008 0.512 0.007 0.074 0.016
BaselinesRandom word deletion 0.901 0.008 0.512 0.011 0.000 0.000
Random stop word insertion 0.908 0.009 0.519 0.017 0.000 0.000
Templated data
synthesis
  [Label names] Simple templates 0.927 0.004 0.681 0.014 0.149 0.080
+[Label names] Permuted templates 0.928 0.004 0.698 0.026 0.197 0.104
+[Label names] Combined templates 0.935 0.008 0.714 0.035 0.250 0.102
+[UMLS synonyms] Simple & Permuted 0.939 0.005 0.737 0.030 0.618 0.110
AblationsTemplate synthesis only, label names 0.579 0.072 0.415 0.086 0.000 0.000
Template synthesis only, inc. UMLS synonyms 0.566 0.062 0.432 0.087 0.427 0.100
Table 8. Micro- and macro-averaged F1 results on our prospective test set as mean standard deviation of 10 runs with different random seeds. Bold indicates the best model for each metric.
All LabelsInfection
Data Synthesis MethodF1 MicroF1 MacroF1 Micro
Real data only 0.823 0.013 0.441 0.016 0.000 0.000
Generic templates 0.868 0.017 0.680 0.059 0.352 0.133
Protocol-derived templates 0.870 0.013 0.686 0.066 0.434 0.137
Table 9. We compare EdIE-R to our best model across five labels that overlap between the two annotation systems. We report the performance of EdIE-R against mean standard deviation of 10 runs with different random seeds for our approach. Results are for our independent test set. Bold indicates the best model for each metric. CSVD = cerebral small vessel disease.
HaemorrhageIschaemiaCSVDAtrophyTumour
ModelF1 MacroF1 MicroF1 MicroF1 MicroF1 MicroF1 Micro
EdIE-R [11] 0.677 0.790 0.755 0.903 0.927 0.009
Our model, real data only 0.702 0.013 0.874 0.015 0.699 0.052 0.939 0.012 0.924 0.014 0.074 0.016
Our model 0.874 0.024 0.957 0.008 0.845 0.021 0.983 0.008 0.970 0.008 0.618 0.110
Publisher’s Note: MDPI stays neutral with regard to jurisdictional claims in published maps and institutional affiliations.

