Article

Artificial Neural Network Analysis of Gene Expression Data Predicted Non-Hodgkin Lymphoma Subtypes with High Accuracy

1
Department of Pathology, Faculty of Medicine, Tokai University School of Medicine, 143 Shimokasuya, Isehara 259-1193, Kanagawa, Japan
2
Department of Clinical Sciences, College of Medicine, University of Sharjah, Sharjah P.O. Box 27272, United Arab Emirates
3
Division of Surgery and Interventional Science, University College London, Gower Street, London WC1E 6BT, UK
*
Author to whom correspondence should be addressed.
Mach. Learn. Knowl. Extr. 2021, 3(3), 720-739; https://0-doi-org.brum.beds.ac.uk/10.3390/make3030036
Submission received: 21 August 2021 / Revised: 2 September 2021 / Accepted: 7 September 2021 / Published: 10 September 2021
(This article belongs to the Section Network)

Abstract

:
Predictive analytics using artificial intelligence is a useful tool in cancer research. A multilayer perceptron neural network used gene expression data to predict the lymphoma subtypes of 290 cases of non-Hodgkin lymphoma (GSE132929). The input layer included both the whole array of 20,863 genes and a cancer transcriptome panel of 1769 genes. The output layer was lymphoma subtypes, including follicular lymphoma, mantle cell lymphoma, diffuse large B-cell lymphoma, Burkitt lymphoma, and marginal zone lymphoma. The neural networks successfully classified the cases consistent with the lymphoma subtypes, with an area under the curve (AUC) that ranged from 0.87 to 0.99. The most relevant predictive genes were LCE2B, KNG1, IGHV7_81, TG, C6, FGB, ZNF750, CTSV, INGX, and COL4A6 for the whole set; and ARG1, MAGEA3, AKT2, IL1B, S100A7A, CLEC5A, WIF1, TREM1, DEFB1, and GAGE1 for the cancer panel. The characteristic predictive genes for each lymphoma subtypes were also identified with high accuracy (AUC = 0.95, incorrect predictions = 6.2%). Finally, the topmost relevant 30 genes of the whole set, which belonged to apoptosis, cell proliferation, metabolism, and antigen presentation pathways, not only predicted the lymphoma subtypes but also the overall survival of diffuse large B-cell lymphoma (series GSE10846, n = 414 cases), and most relevant cancer subtypes of The Cancer Genome Atlas (TCGA) consortium including carcinomas of breast, colorectal, lung, prostate, and gastric, melanoma, etc. (7441 cases). In conclusion, neural networks predicted the non-Hodgkin lymphoma subtypes with high accuracy, and the highlighted genes also predicted the survival of a pan-cancer series.

1. Introduction

Non-Hodgkin lymphomas (NHL) are a group of hematological neoplasia that originate from B-lymphocytes, T-lymphocytes, or natural killer (NK) cells, either from progenitors or mature cells [1,2]. The 2016 World Health Organization (WHO) classification of tumors of hematopoietic and lymphoid tissues integrates morphologic, immunophenotypic, genetic, and clinical features to define and classify the distinct NHL subtypes [3]. The lymphoid neoplasms are derived from cells that differentiate into T-lymphocytes or B-lymphocytes. The T-lymphocytes include subtypes of CD8-positive cytotoxic T-lymphocytes, CD4-positive T helper lymphocytes, and FOXP3-positive regulatory T-lymphocytes (Tregs). The B-lymphocytes category includes B-lymphocytes (naïve, centrocytes, and centroblasts) and plasma cells. The lymphoid neoplasms were initially classified according to the clinical behavior as indolent, aggressive, and highly aggressive [1,2,4]. Nevertheless, due to the heterogeneous evolution, the current classification focuses more on the postulated cell of origin (Figure 1). This research focused on specific diagnostic entities derived from mature B-lymphocytes, including follicular lymphoma (FL), mantle cell lymphoma (MCL), diffuse large B-cell lymphoma (DLBCL), Burkitt lymphoma (BL), and marginal zone lymphoma (MZL). FL is a frequent indolent lymphoma derived from germinal center B-lymphocytes; MCL is an infrequent lymphoma mainly derived from naïve B-lymphocytes with an aggressive clinical evolution; DLBCL is the most frequent NHL subtype, it is derived from large B-lymphocytes of the germinal center or from the postgerminal center, and has an aggressive evolution; BL is an aggressive subtype derived from germinal center B-lymphocytes (endemic, sporadic, and immunodeficiency-associated); and MZL is an indolent subtype derived from postgerminal center B-lymphocytes of the marginal zones (extranodal, splenic, and nodal) [1,2,3,4].
Neural networks are the preferred analytical tool for many predictive data mining applications because they are convenient, flexible, and powerful [5,6,7]. Predictive neural networks are particularly useful in applications where the underlying process is complex, such as biological systems [8,9,10,11,12,13,14]. The multilayer perceptron (MLP) procedure produces a predictive model for one or more dependent (target) variables based on the values of the predictor variables [5,6]. This research used publicly available data to predict some of the NHL subtypes based on the expression of 20,863 genes and a cancer transcriptome panel of 1769 target genes. Additionally, the most relevant genes of the MLP were tested for prediction of the overall survival of one of the most frequent NHL subtypes, DLBCL, and other types of neoplasia.

2. Materials and Methods

2.1. Gene Expression Data Set

The gene expression array GSE132929 was downloaded from the National Center for Biotechnology Information (NCBI), gene expression omnibus public database (https://0-www-ncbi-nlm-nih-gov.brum.beds.ac.uk/geo/, last accessed on 15 August 2021). This series is publicly available (contact person: Michael R Green, MD Anderson Cancer Center, Houston, TX, USA) and contains the gene expression of 290 biopsy cases of B-cell non-Hodgkin lymphoma [15]. Based on histological, immunophenotypical, molecular, and clinical features, the cases had been diagnosed as follicular lymphoma (n = 65, 22.4%), mantle cell lymphoma (n = 43, 14.8%), diffuse large B-cell lymphoma (n = 100, 34.5%), Burkitt lymphoma (n = 59, 20.3%), and marginal zone lymphoma (n = 23, 7.9%).
The RNA had been extracted from fresh/frozen tumor specimens using trizol or Qiagen RNA extraction kit. The biotin labeling, hybridization, and scanning protocols had been performed according to the conventional Affymetrix protocols. The microarray that was used was the Affymetrix U133 plus 2.0 (GPL570, Affymetrix, Santa Clara, CA, USA; https://www.thermofisher.com/order/catalog/product/900466#/900466, last accessed on 15 August 2021). The ExpressionFileCreator software RMA-normalized the raw cel files (GenePattern31, available at https://www.genepattern.org/, last accessed on 15 August 2021), and the quality check for batch effects was performed by unsupervised clustering of the 3000 most variably expressed genes across the data set.
Pan-cancer data sets were obtained from TCGA (https://tcga-data.nci.nih.gov/, last accessed on 15 August 2021) and UCSC Xena (http://xena.ucsc.edu/, last accessed on 15 August 2021). The clinical data were available in the corresponding repositories. The data sets were quantile-normalized and log2 transformed if necessary. The risk score (also known as the prognostic index) was used to create risk groups. The risk score was calculated by multiplying the beta coefficients of the Cox model by the gene expressions (Risk score = β1x1 + β2x2 + … + βpxp where xi is the expression value and βI is the beta value of the Cox table). In the Cox, all the genes are included in a unique model [16,17].

2.2. Software

Different software was used following the manufacturer’s instructions for data preparation, processing, analysis, and confirmation of results: EditPad Lite (version 8.2.4 x64, Just Great Software co. Ltd., Rawai Phuket, Thailand), Microsoft Excel 2016 (version 16.0.5173.1000, 64-bit, Microsoft Corporation, Redmond, WA, USA), GSEA (version 4.1.0, Broad Institute, Inc. (Cambridge, MA, USA), Massachusetts Institute of Technology, and Regents of the University of California, USA) [18], JMP statistical discovery from SAS (JMP Pro 14.0.0, SAS Institute Inc., Heidelberg, Germany), IBM SPSS and modeler (versions 26 and 18, IBM Corporation, Armonk, NY, USA), R (version 3.6.3 (https://www.r-project.org/ (accessed on 15 August 2021))), and R Studio (version 1.3.959; https://www.rstudio.com/products/rstudio/#rstudio-desktop (accessed on 15 August 2021)). Data manipulation was mainly performed using EditPad Lite and Excel. The GSEA software was mainly used for collapsing multiple probes sets to one gene. There are several options, including max probe, median, mean, and sum of probes. In this research, the max probe was chosen. GSEA allowed determining whether a priori set of genes showed an association toward two biological states (e.g., lymphoma subtype). Nevertheless, this information was excluded from the manuscript because of length constraints. Survival analysis using R can be checked on the following web page: https://cran.r-project.org/web/views/Survival.html (accessed on 15 August 2021). Random forest for gene expression can be calculated in the following web pages http://genesrf.iib.uam.es/and https://www.ligarto.org/rdiaz/software/software#varSelRF (based on R, accessed on 15 August 2021). IBM modeler includes several machine learning techniques.

2.3. Multilayer Perceptron Analysis

The multilayer perceptron neural network analyses predicted the lymphoma subtype based on the genes expression values. The analysis was performed to predict all subtypes simultaneously and then each subtype against the others. The multilayer perceptron was performed as we have recently described [17,19,20,21,22,23].
In summary, the gene probes were collapsed using the GSEA software to the maximum expression, and the values were rescaled using the standardized method to improve network training [(x − mean)/std)]. Of note, other available rescaling methods were normalized [(x − min)/(max − min)], adjusted normalized [[2 ∗ (x − min)/(max − min)] − 1] or none. Random assignation of the cases based on the relative number of cases (training 70%, testing 30%, and holdout 0%) partitioned the data set into training, testing, and holdout samples [5,6,17,19,20,21,22,23].
This type of feed-forward neural network consisted of three types of layers (Figure 2). In our procedure, the “best” architecture was searched. The input layer received the gene expression values for each gene to be processed. The output layer performed the prediction and classification. The hidden layers acted as the computational engine. The dependent variable was nominal because its values represented categories with no intrinsic ranking (the lymphoma subtypes). The predictor variables (covariates are scale) were the genes, the 20,863 genes of the array, and a cancer transcriptome panel of 1790 genes. The hidden layers ranged from one or two, with hyperbolic tangent or sigmoid activation function, and with automatically computed (ranging from 1 to 50) or custom number of units. The hyperbolic tangent function has the form: γ(c) = tanh(c) = (ec − e−c)/(ec + e−c). It takes real-valued arguments and transforms them to the range (–1, 1). This sigmoid function has the form: γ(c) = 1/(1 + e−c). It takes real-valued arguments and transforms them to the range (0, 1). The output layer used the identity, softmax, hyperbolic tangent, or sigmoid activation functions. This identity function has the form: γ(c) = c. It takes real-valued arguments and returns them unchanged. This softmax function has the form: γ(ck) = exp(c k)/Σjexp(cj). It takes a vector of real-valued arguments and transforms it to a vector whose elements fall in the range (0, 1) and sum to 1. Softmax is available only if all dependent variables are categorical. The activation function chosen for the output layer determined the rescaling method. The dependent variables rescaling was standardized, normalized, adjusted normalized, or none. The training was batch, online, or mini-batch. Batch training updates the synaptic weights only after passing all training data records; that is, batch training uses information from all records in the training data set. It is most useful for “smaller” data sets. Online training updates the synaptic weights after every single training data record; that is, online training uses information from one record at a time. Online training is superior to batch for “larger” data sets with associated predictors. Mini-batch training divides the training data records into groups of approximately equal size, then updates the synaptic weights after passing one group; that is, mini-batch training uses information from a group of records. Then the process recycles the data group if necessary. Mini-batch training offers a compromise between batch and online training, and it may be best for “medium-size” data sets. The optimization algorithm was the scaled conjugate gradient or gradient descent. The options of the training set, initial lambda (0.0000005), initial sigma (0.00005), interval center (0), and interval offset (±0.5) [5,6,17,19,20,21,22,23].
The output included the diagram and the synaptic weights that were exported to an xml file. Synaptic weights display the coefficient estimates that show the relationship between the units in a given layer to the units in the following layer. Synaptic weights are based on the training sample even if the active data set is partitioned into training, testing, and holdout data. The network performance was assessed with the model summary, classification results, receiver operating characteristic (ROC) curve, cumulative gains chart, lift chart, predicted by the observed chart, and residual by the predicted chart. The independent variable importance analysis was performed. Independent variable importance analysis performs a sensitivity analysis, which computes the importance of each predictor in determining the neural network. The analysis is based on the combined training and testing samples or only on the training sample if there is no testing sample. This creates a table and a chart displaying importance and normalized importance for each predictor. The predicted value or category for each dependent variable was saved. The predicted pseudoprobability for each dependent variable was also kept. As for stopping rules, the maximum step without a decrease in error as set to 1, the maximum training time to 15 min, the minimum relative change in training error to 0.0001, and the minimum relative change in the training error ratio to 0.001. Missing values were excluded, if present [5,6,17,19,20,21,22,23].

2.4. Hardware

The analysis was performed in a desktop workstation equipped with an AMD Ryzen 7 3700X (8-Core processor at 3.59 GHz), 16 GB of RAM, and NVIDIA GeForce GTX 1650 GPU.

2.5. Ethical Compliance

This study used gene expression data involving humans. Ethical approval had been previously obtained from the corresponding institutions. This research complies with the World Medical Association (WMA), Declaration of Helsinki statement of ethical principles for medical research involving human subjects. The Tokai University School of Medicine Review Board had approved research in artificial intelligence (IRB-156).

3. Results

3.1. Multilayer Perceptron Analysis (MLP) for Predicting All NHL Subtypes

The MLP analysis was performed using all the genes and the cancer transcription panel. The neural network architecture and performance are shown in Table 1 and Figure 3. The performance was higher in the cancer transcriptome panel rather than when using the whole set of 20,863 genes. The genes were ranked according to their normalized importance for predicting NHL subtypes. In Table 2, the top 20 genes are shown for all genes set, including the normalized importance (NI), their function, and the keyword. The most relevant genes for predicting NHL subtypes were LCE2B, KNG1, IGHV7_81, TG, and C6. In Table 3, the top 20 genes of the cancer transcriptome panel are shown, and the neural network architecture is shown in Figure 4. The most relevant genes were ARG1, MAGEA3, AKT2, IL1B, and S100A7A.

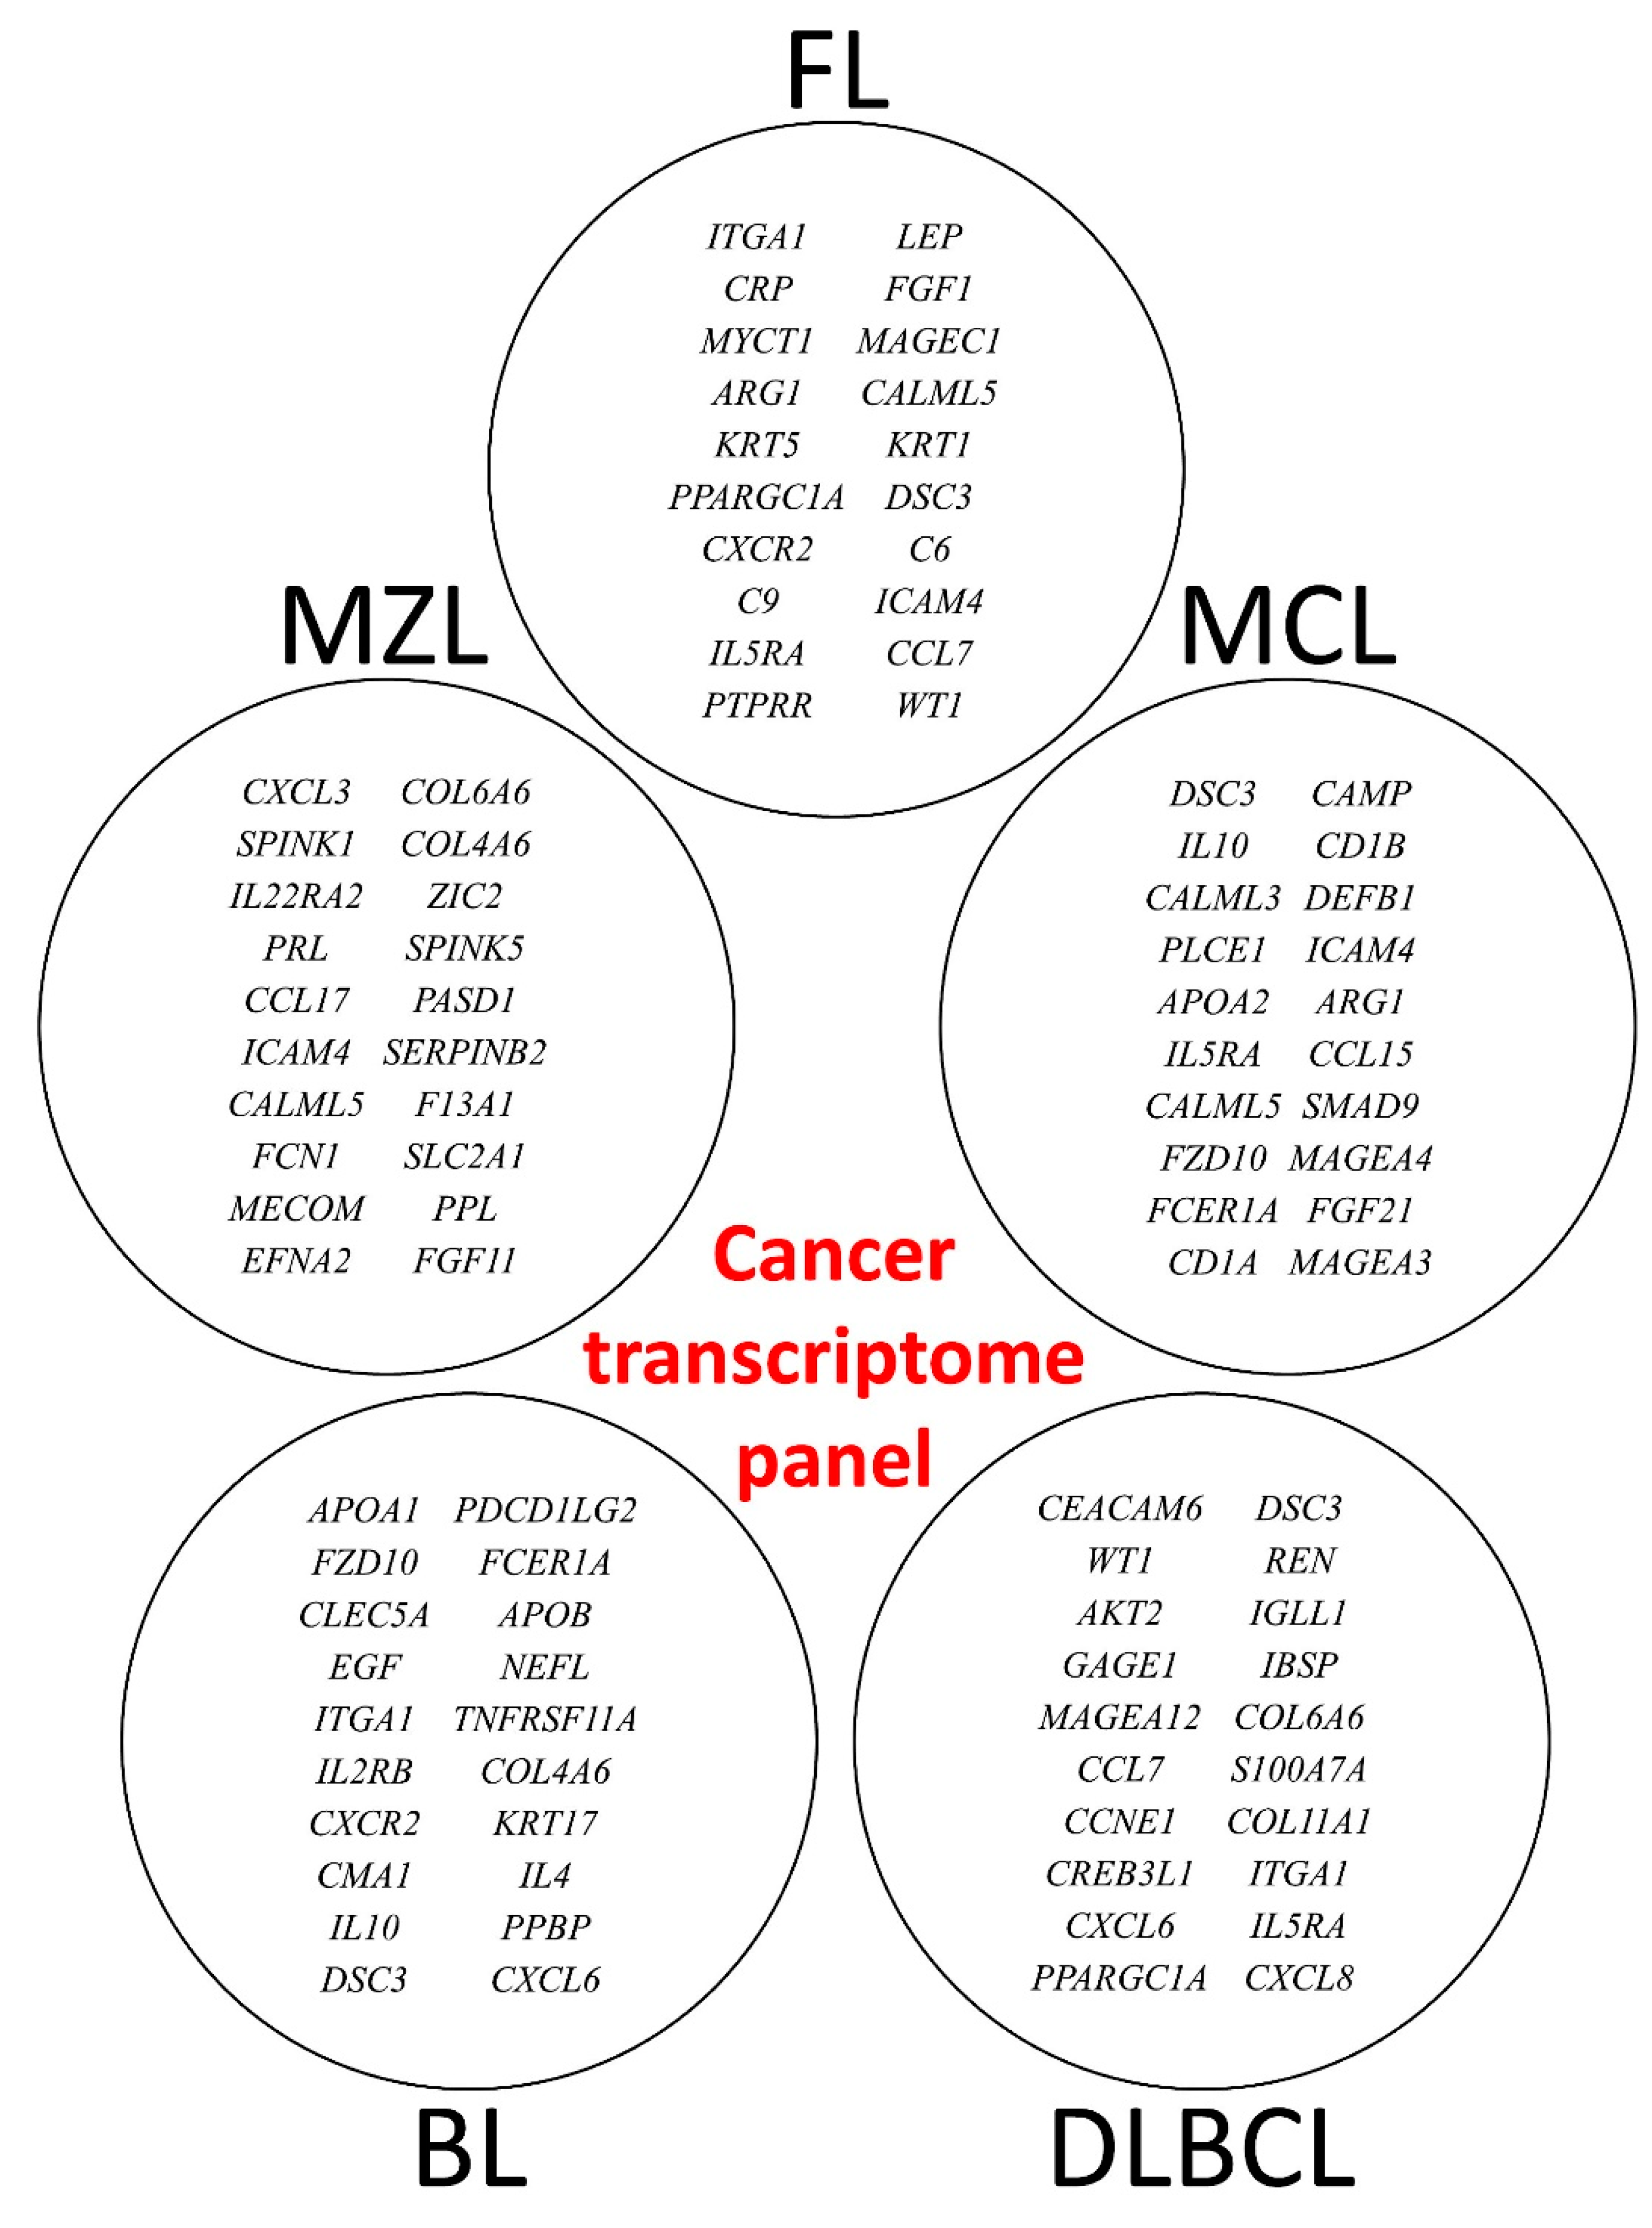
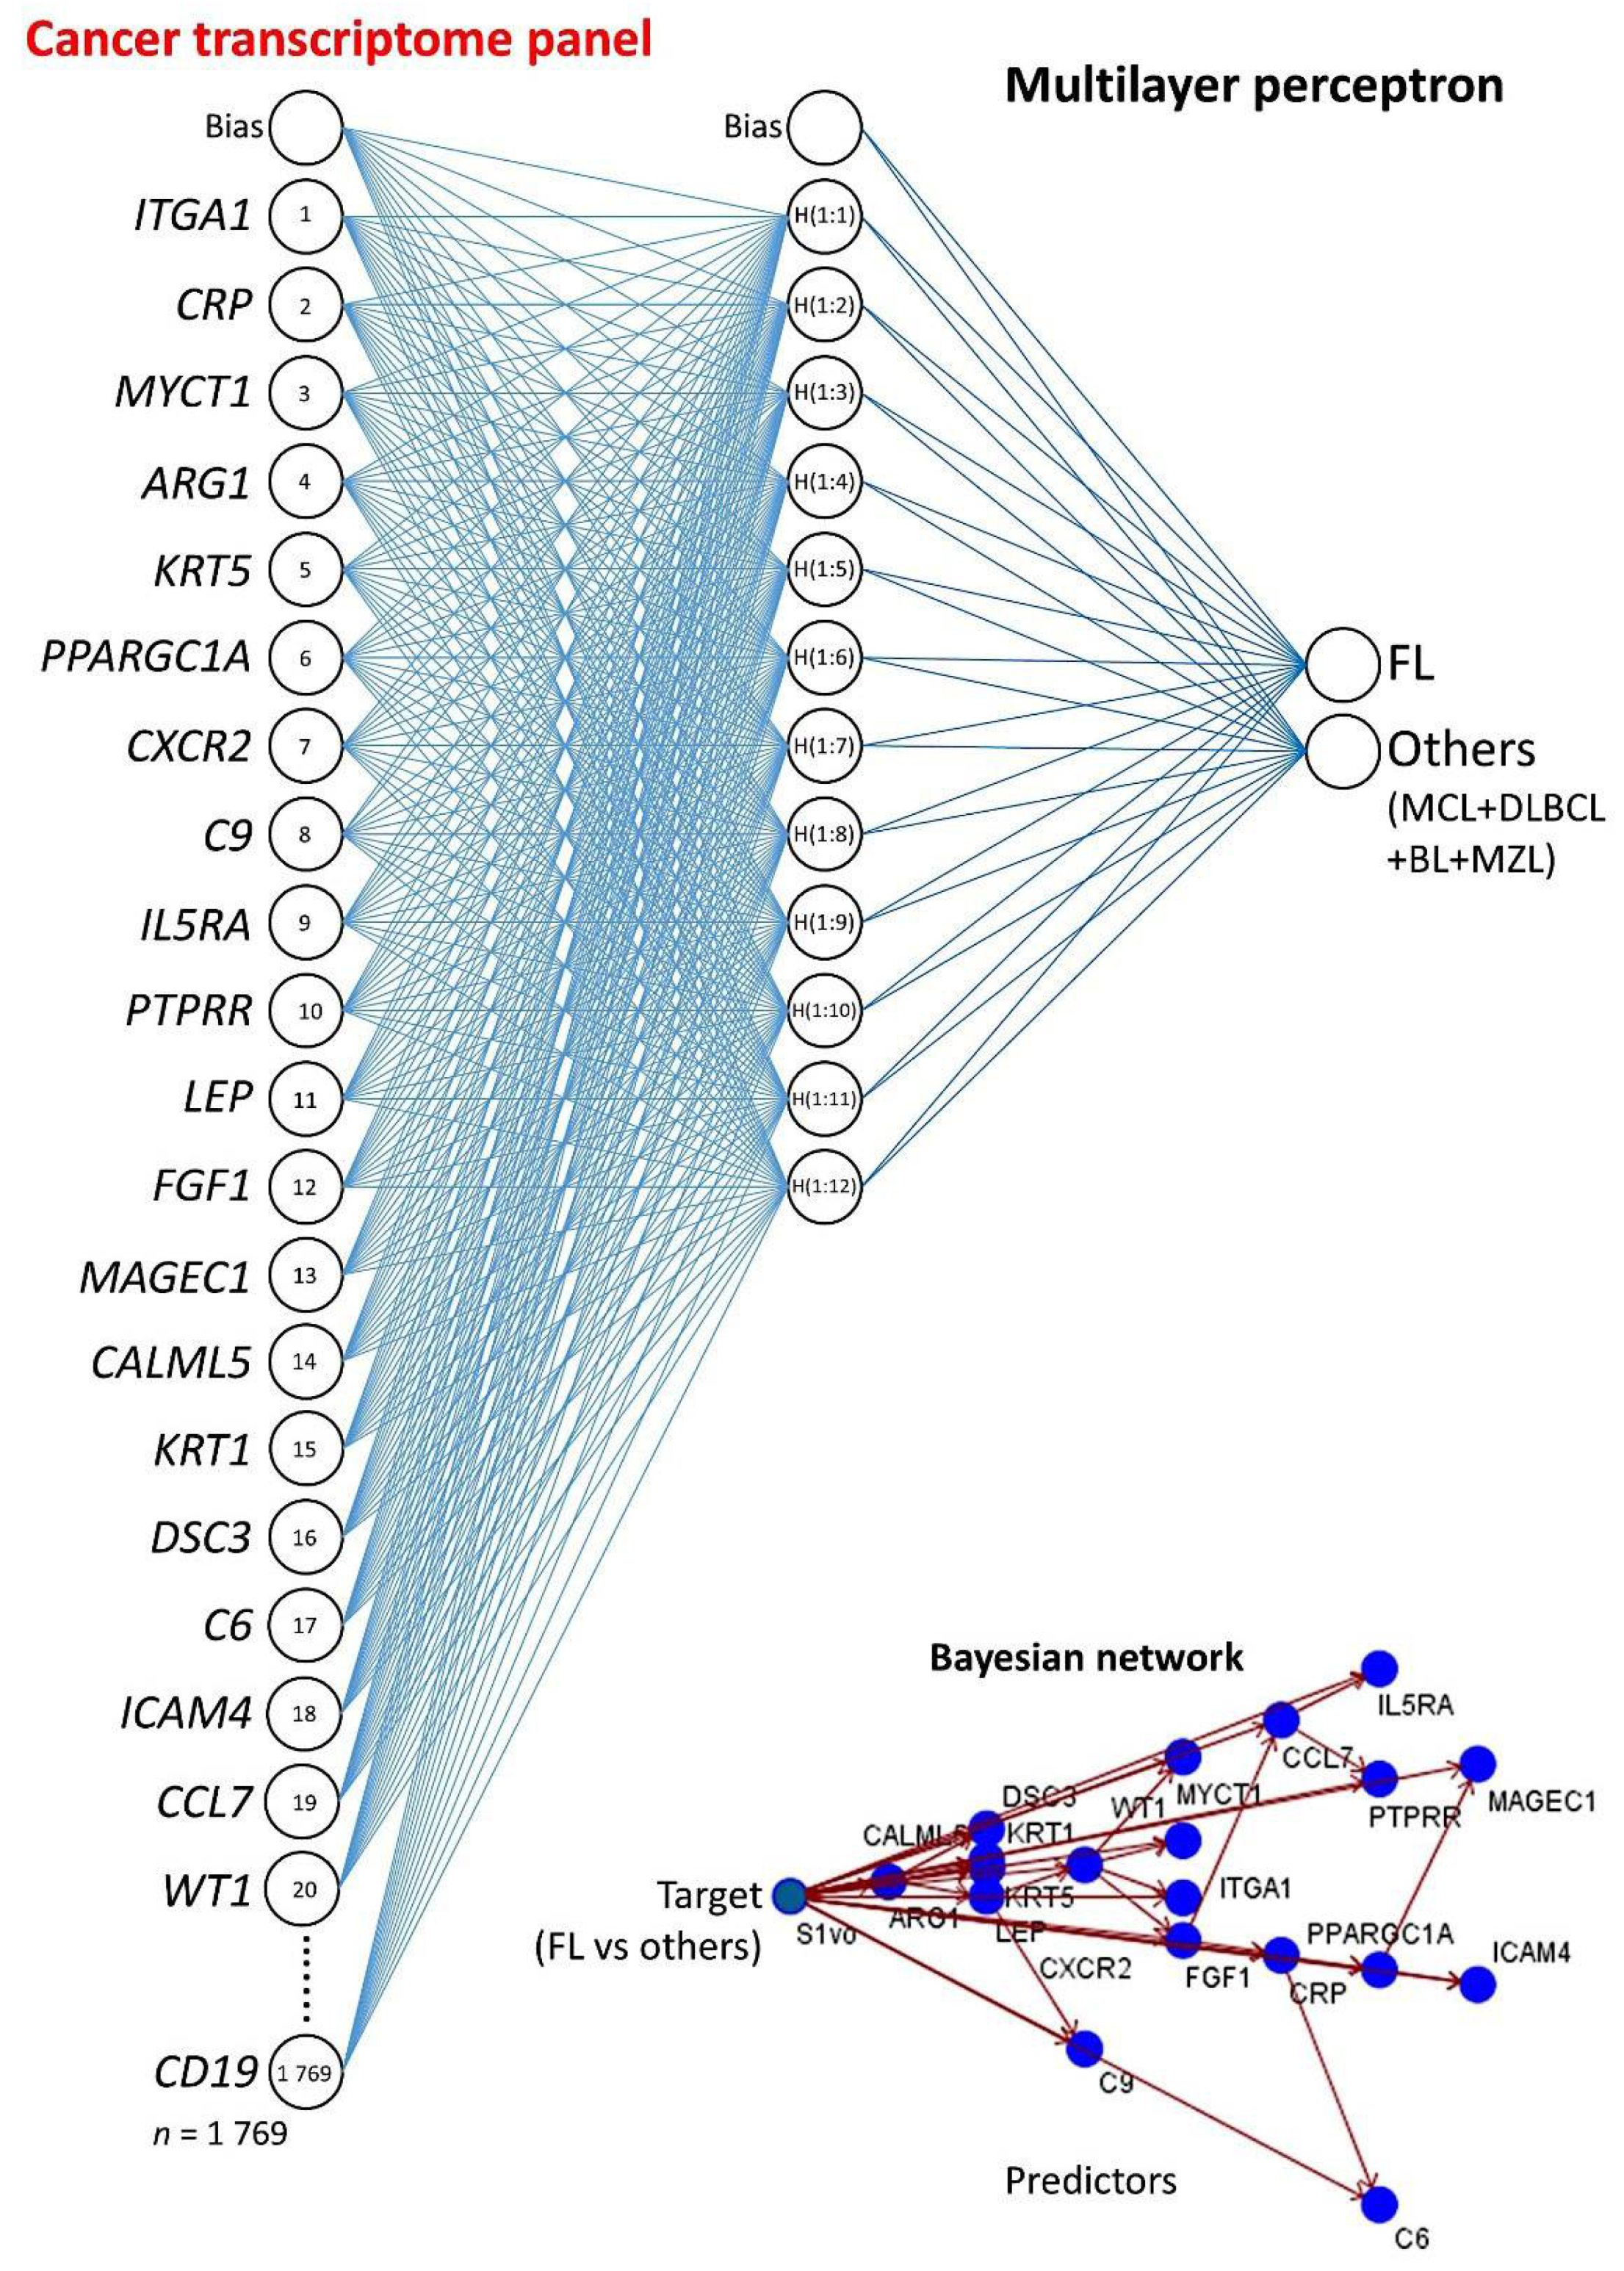
3.2. Multilayer Perceptron Analysis (MLP) for Predicting Each NHL Subtype against the Other Subtypes

The MLP analysis was repeated for predicting each individual NHL subtype against the other subtypes. For example, the neural network architecture for FL prediction had two outputs: FL vs. other NHL subtypes (i.e., MCL + DLBCL + BL + MZL).
Table 4 shows the architecture characteristics and performance of each MLP using all the genes of the array. The performance was suitable, with high accuracy of the classification and low percentages of incorrect predictions (averaged incorrect predictions = 7.2%). In this series, the NHL subtype with less accuracy was DLBCL. Nevertheless, the areas under the curves were above 0.90 in all cases. Figure 5 shows the top 20 predictive genes for each NHL subtype.
The results of the MLPs using the cancer transcriptome panel are shown in Table 5 and Figure 6. The neural network performances were higher than all genes set (n = 20,863), and in all cases above the area under the curve were above 0.95 with averaged incorrect predictions of 6.2%. The network architecture for predicting FL against the other NHL subtypes is shown in Figure 7.

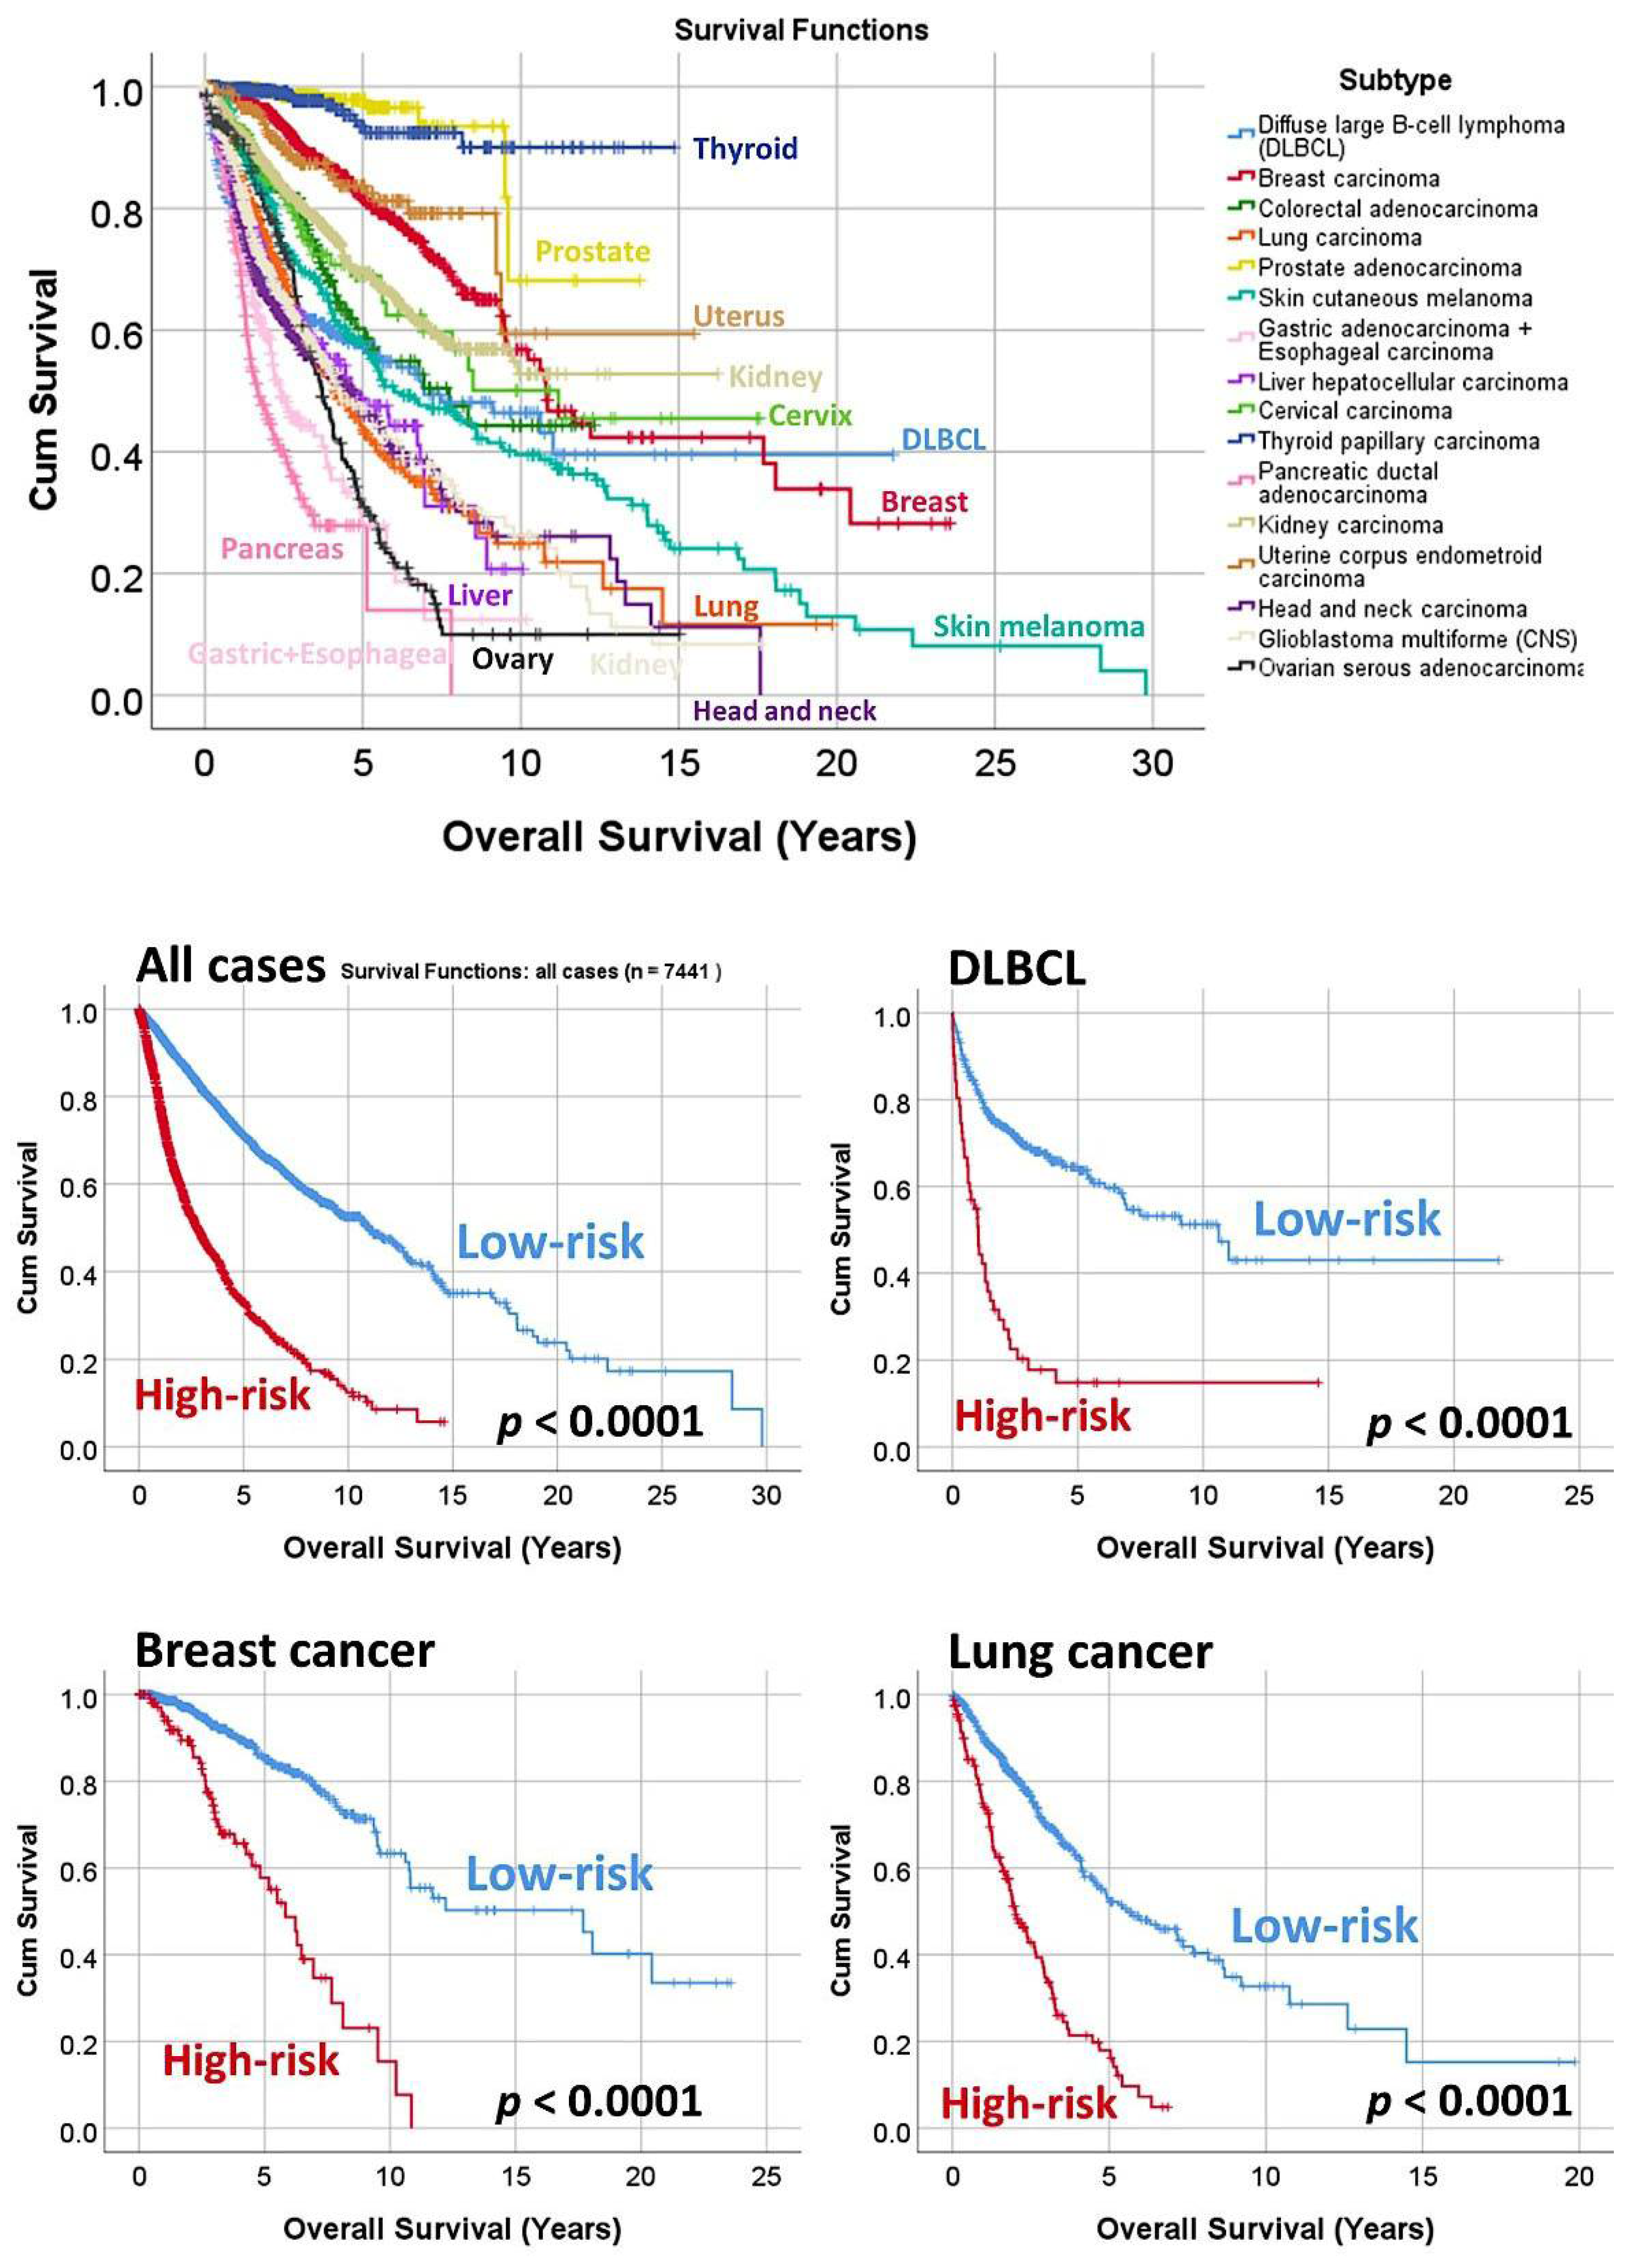
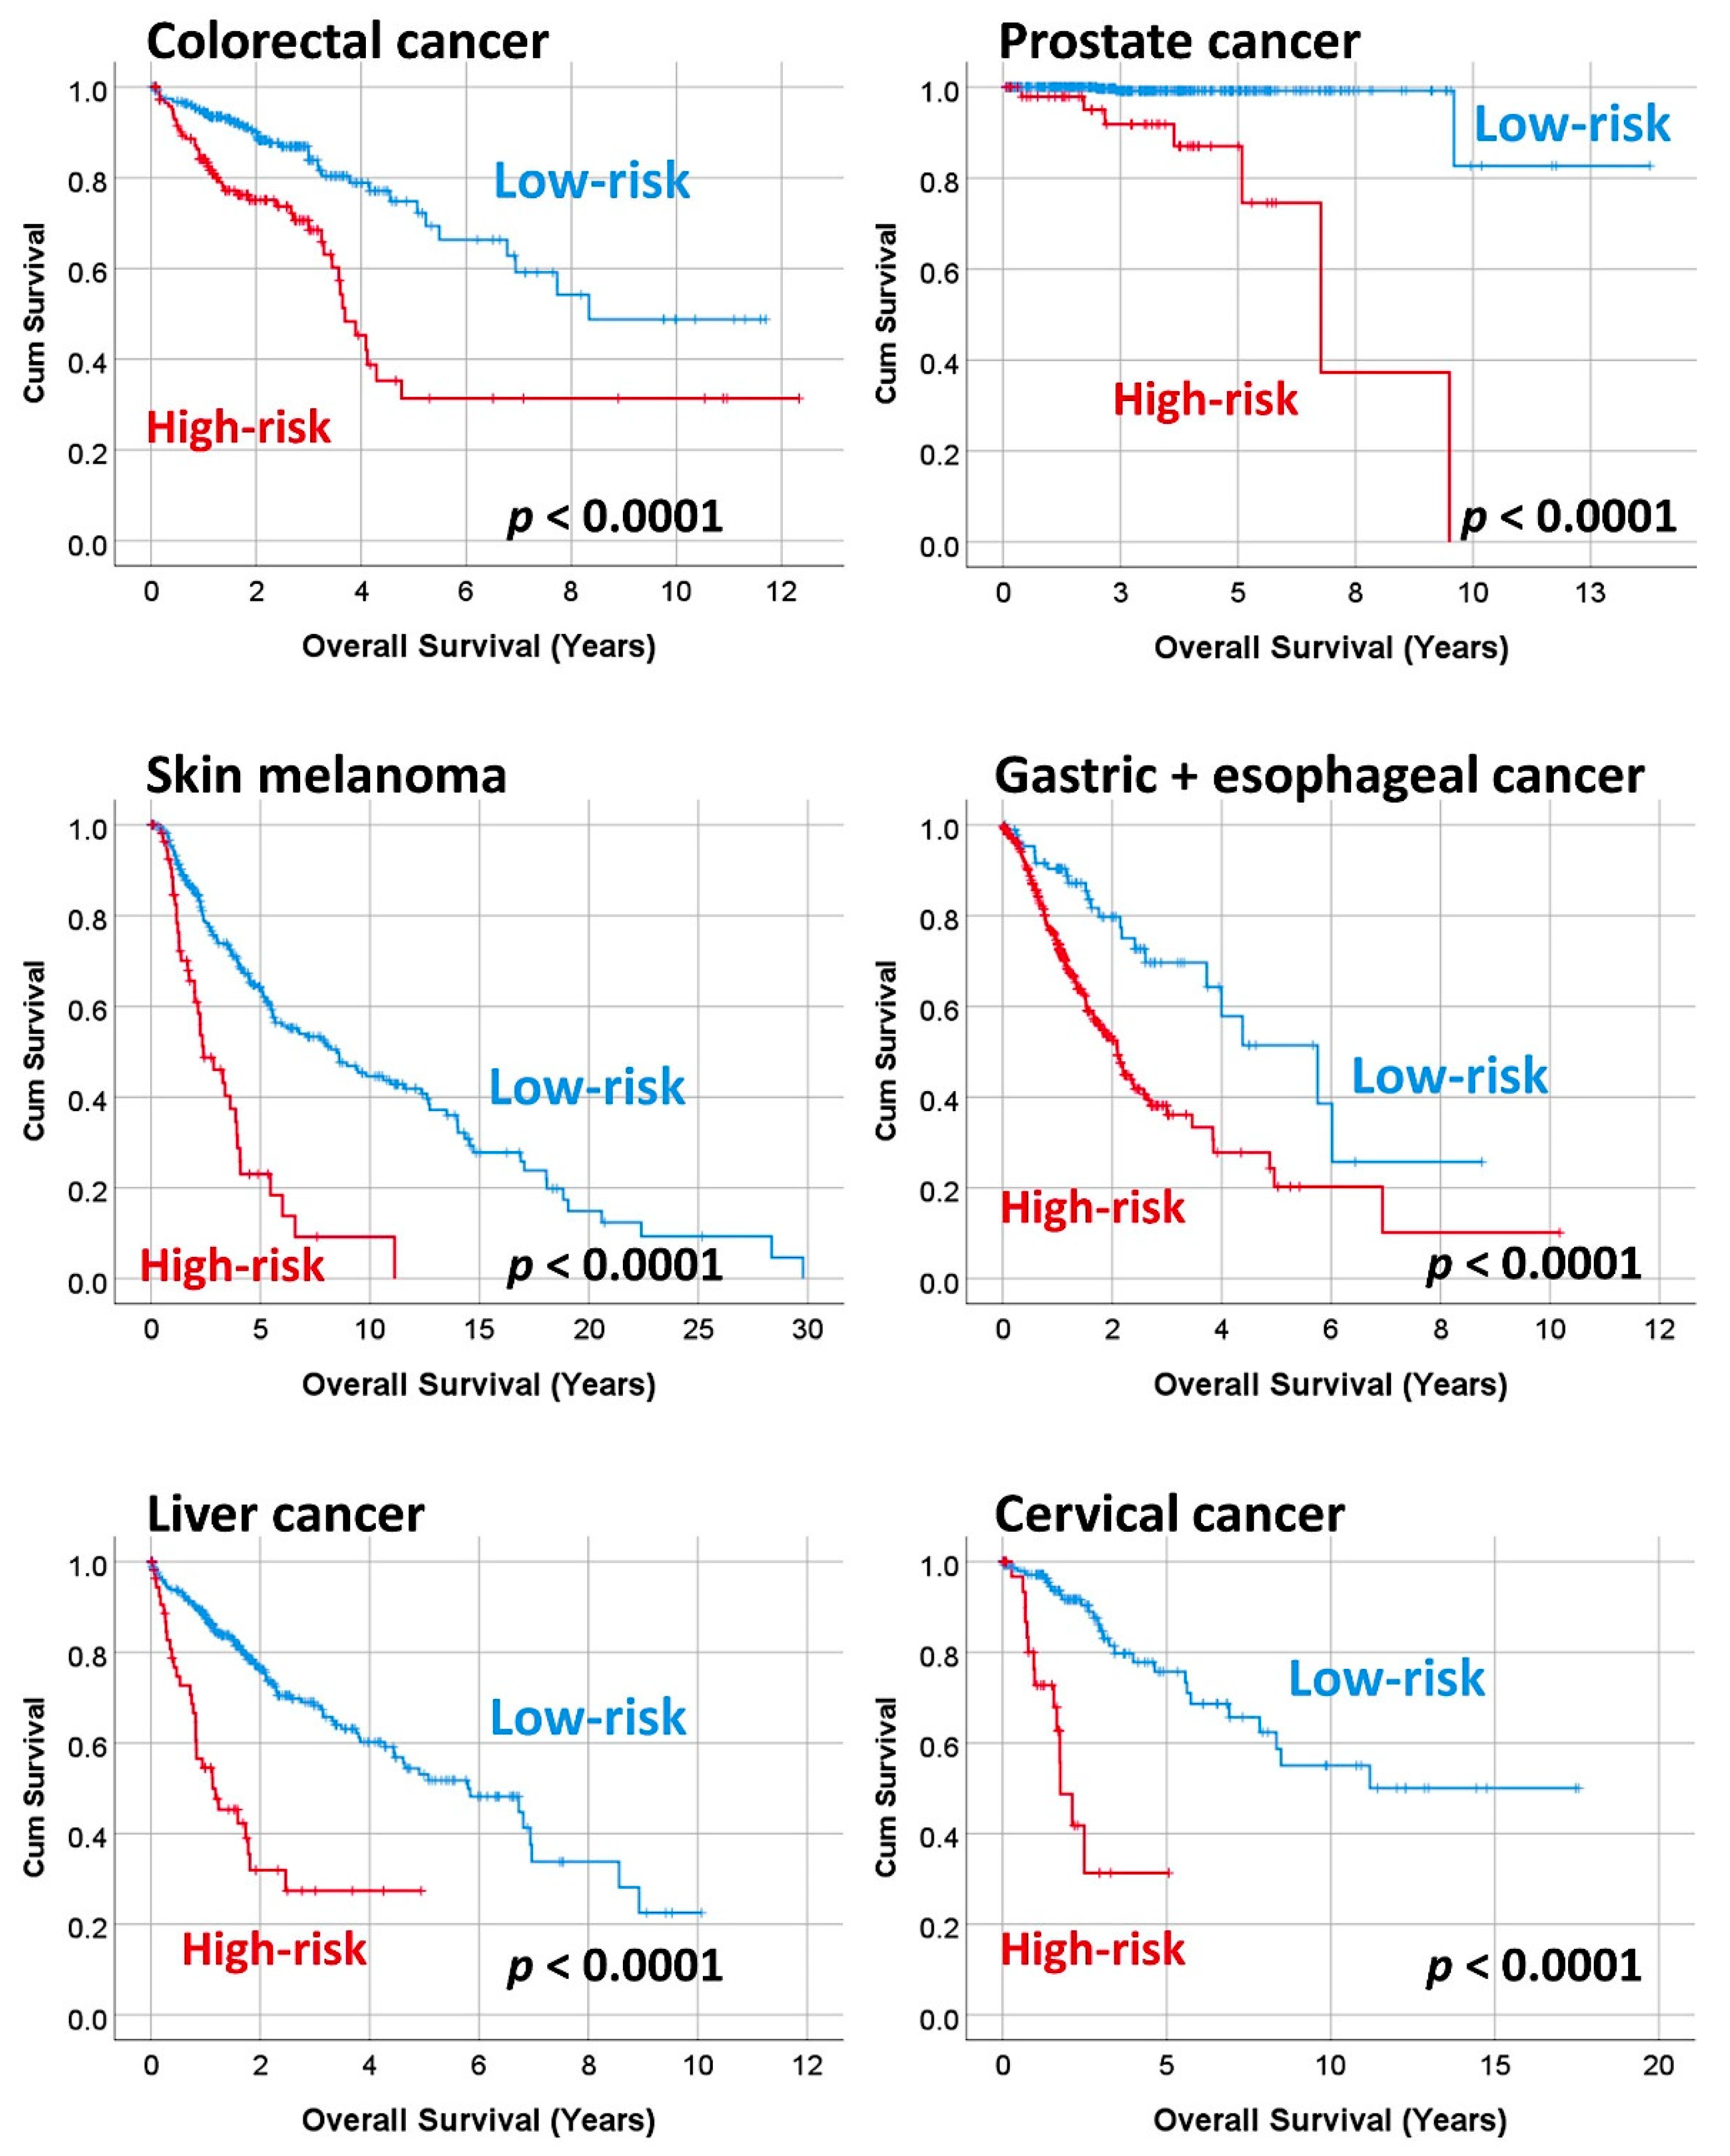
3.3. Prediction of the Overall Survival of DLBCL and Other Types of Cancer

The MLP analysis predicted the NHL subtypes using all the 20,863 genes of the array. The characteristics of the neural network architecture, performance, and accuracy are shown in Table 1 and Figure 3. Table 2 lists the top 20 genes with the highest normalized importance for predicting the NHL subtypes. The top 30 genes were the following: LCE2B, KNG1, IGHV7_81, TG, C6, FGB, ZNF750, CTSV, INGX, COL4A6, ZG16B, SERPINB13, TKTL1, TPPP3, PRL, MYOM2, EGF, VAT1L, HTN1, RBM20, KRT2, DYRK1B, NRG4, KLK11, SPRR2G, DEFB107A, ZNF565, LECT2, DHRS2, and UGT2A3.
The predictive value for overall survival of the top 30 genes was explored for the most frequent lymphoma subtype, the DLBCL, using an independent series of 414 cases (GSE10846). Additionally, the prognostic value was also tested in the most frequent and relevant cancer subtypes of the TCGA database. Using a risk-score formula, the cases of each series were stratified into high and low-risk groups. The risk scores were calculated by multiplying the beta values of the Cox regression per gene expression values for each gene, as previously described [8,9,10,11,12,13]. The overall survival was calculated using the Kaplan–Meier and log-rank test and Cox regression analyses. In total, 7441 neoplastic samples were included in the analysis. The analysis showed that using the top 30 genes, it was possible to predict the prognosis of DLBCL and the rest of the cancer subtypes (Table 6 and Figure 8 and Figure 9).

4. Discussion

Neural networks are one of the preferred analytical tools in data mining because they can easily adapt to complex processes such as biological systems. Neural networks are different from the traditional statistical methods.
Despite that a linear regression model can be considered a special case of certain neural networks, linear regression is characterized by a rigid model structure and a set of assumptions that are imposed before learning from the data [5,6]. However, the neural network makes minimal demands on the model structure and assumptions, and the relationships between the predictors and predicted variables do not need to be hypothesized in advance. In a neural network, the type of relationship is determined during the learning process. If a linear relationship is appropriate, the results of the neural network will be close to those of the linear regression, but in other circumstances, the appropriate relationship will be nonlinear [5,6]. In exchange for this flexibility, the synaptic weights of a neural network are not easily interpretable. Therefore, the results of the neural network cannot be easily understood by humans (“black box”).
For instance, Figure 5 showed the network diagram of the multilayer perceptron analysis for predicting follicular lymphoma against the other non-Hodgkin lymphoma subtypes based on a cancer transcriptome panel. In the analysis, all the 1769 genes were ranked according to their normalized importance for prediction. The top 20 genes were the following: ITGA1, CRP, MYCT1, ARG1, KRT5, PPARGC1A, CXCR2, C9, IL5RA, PTPRR, LEP, FGF1, MAGEC1, CALML5, KRT1, DSC3, C6, ICAM4, CCL7, and WT1. The most relevant gene in this model was integrin subunit alpha 1 (ITGA1), with a normalized importance of 1, followed by C-reactive protein (CRP, 0.95), MYC target 1 (MYCT1, 0.78), arginase-1 (ARG1, 0.85), and keratin 5 (KRT5, 0.84). The relationship between these genes and the diagnosis of follicular lymphoma was analyzed using a binary linear regression (backward stepwise, conditional), and at the last step the most relevant genes were MYCT1 (odds ratio = 1.1, p < 0.001), KRT5 (odds ratio = 0.9, p < 0.001), DSC3 (odds ratio = 1.4, p < 0.001), and WT1 (odds ratio = 0.83, p < 0.001). Therefore, ITGA1 did not follow a statistically significant linear relationship. However, follicular lymphoma was characterized by an increase in MYCT1 and DSC3 and a decrease in KRT5 and WT1. Figure 5 also showed a nonlinear prediction of FL vs. others using a Bayesian network; this graphical model displays variables (nodes) in a data set and the probabilistic, or conditional, independencies between them. Causal relationships between nodes (genes) can be represented by a Bayesian network; however, the links in the network (arcs) do not necessarily represent direct cause and effect [5,6,17,21,23]. In the Bayesian network, ITGA1 is located more centrally, with a connection to CXCR2 that connects to FGF1, PPARGC1A, MAGEC1, and ICAM4. ITGA1 is an integrin upregulated by the B-lymphocytes of follicular lymphoma when cultured with follicular dendritic cells (FDCs); it is an important molecule necessary for the cell-matrix adhesion and the pathogenesis of follicular lymphoma [26]. Elevated CRP is associated with poor prognosis in follicular lymphoma [27]. ARG1 expression defines immunosuppressive subsets of tumor-associated macrophages [28], and macrophages contribute to follicular lymphoma pathogenesis [29]. Interestingly, CD19 was the least important gene, which makes pathological sense as CD19 is a pan B-cell marker common to all the non-Hodgkin lymphoma (NHL) subtypes. The relationship of these markers with follicular lymphoma pathogenesis helps explain why the prediction of the neural network was accurate.
This research predicted several subtypes of non-Hodgkin lymphoma (NHL) using multilayer perceptron neural network analysis. The predictors were the whole set of 20,863 genes of the array and a cancer transcriptome panel of 1769. The prediction accuracy and network performances were suitable, as shown in the model summary, classification results, ROC curve, cumulative gains chart, lift chart, predicted by the observed chart, and residual by the predicted chart. The prediction accuracy was higher in the case of the cancer transcriptome panel, which was expected because it is a panel for the neoplasia research. Table 2 showed the top 20 genes with predictive values to differentiate NHL subtypes. Most of these genes were related to apoptosis, cell growth, metabolism, and immune response [24,25]. These pathways were also highlighted when using the cancer transcriptome panel (Table 3). A complete analysis of the relevance of each gene is beyond the scope of this manuscript because the main aim was to confirm whether the artificial neural network could identify the NHL subtypes. However, there is information regarding the most relevant genes. For example, LCE2B has been related to laryngeal squamous cell carcinoma [30]; and macrophages express ARG1 [28], which affect the follicular lymphoma pathogenesis [29], and other lymphomas such as Hodgkin lymphoma [31]. The multilayer perceptron analysis also predicted each subtype individually, with even higher accuracy, and the predictive genes were highlighted. For example, IL10 was predictive of mantle cell lymphoma; and mantle cell lymphoma proliferates upon IL-10 in the CD40 system [32]. In diffuse large B-cell lymphoma, AKT2 is an oncogenic molecule that can be targeted by drugs [33]. In Burkitt lymphoma, TNF-alpha induces CXCR2 receptors [34]. In relation to mantle cell lymphoma, CXCL13 is associated with the migration of malignant B-lymphocytes [35].
Finally, due to the potential importance of the highlighted genes for the pathogenesis of neoplasia in general, we used the top 30 genes of the multilayer perceptron analysis to predict the overall survival of several subtypes of neoplasia (Section 3.3). We confirmed that those genes were not only capable of differentiating the different subtypes of NHL but also managed to predict the overall survival of the most relevant human cancers. Therefore, these genes are potentially relevant in the pathogenesis of human neoplasia.

5. Conclusions

In conclusion, using multilayer perceptron artificial neural networks, it is possible to predict the subtypes of non-Hodgkin lymphoma; and we identified a gene set that could predict the overall survival of several subtypes of cancer.

Supplementary Materials

The following are available online at https://0-www-mdpi-com.brum.beds.ac.uk/article/10.3390/make3030036/s1, Table S1: Annotations of each gene based on the transcriptome panel.

Author Contributions

Conceptualization, methodology, software, analysis, resources, writing, and funding acquisition, J.C. Revision, and resources, R.H. All authors have read and agreed to the published version of the manuscript.

Funding

Joaquim Carreras was funded by THE MINISTRY OF EDUCATION, CULTURE, SPORTS, SCIENCE AND TECHNOLOGY (MEXT) and THE JAPAN SOCIETY FOR THE PROMOTION OF SCIENCE, grants KAKEN 15K19061 and 18K15100, and TOKAI UNIVERSITY SCHOOL OF MEDICINE, RESEARCH INCENTIVE ASSISTANT PLAN 2021-B04. Rifat Hamoudi was funded by AL-JALILA FOUNDATION (grant number AJF201741), THE SHARJAH RESEARCH ACADEMY (grant number MED001), and UNIVERSITY OF SHARJAH (grant number 1901090258).

Institutional Review Board Statement

The study was conducted according to the guidelines of the Declaration of Helsinki and approved by the Institutional Review Boards and the Ethics Committees of the Institutions who generated the publicly available databases. Artificial Intelligence research at Tokai University, School of Medicine, is under protocol code IRB-156.

Informed Consent Statement

Informed consent was obtained from all subjects involved in the study.

Data Availability Statement

The gene expression data (GEO data sets) were obtained from the publicly available database of the NCBI resources webpage, located at https://0-www-ncbi-nlm-nih-gov.brum.beds.ac.uk/gds (accessed on 15 August 2021).

Acknowledgments

I want to thank the teams that generated the datasets GSE132929, GSE10846 (Elias Campo), and the Cancer Genome Atlas (TCGA) consortium pan-cancer series.

Conflicts of Interest

The authors declare no conflict of interest.

References

  1. Freedman, A.S.; Friedberg, J.W.; Aster, J.C. Classification of the hematopoietic neoplasms. In UpToDate; Lister, A., Rosmarin, A.G., Eds.; UpToDate: Waltham, MA, USA, 2020. [Google Scholar]
  2. Freedman, A.S.; Friedberg, J.W.; Aster, J.C. Clinical presentation and initial evaluation of non-Hodgkin lymphoma. In UpToDate; Lister, A., Rosmarin, A.G., Eds.; UpToDate: Waltham, MA, USA, 2021. [Google Scholar]
  3. Swerdlow, S.H.; Campo, E.; Pileri, S.A.; Harris, N.L.; Stein, H.; Siebert, R.; Advani, R.; Ghielmini, M.; Salles, G.A.; Zelenetz, A.D.; et al. The 2016 revision of the World Health Organization classification of lymphoid neoplasms. Blood 2016, 127, 2375–2390. [Google Scholar] [CrossRef] [Green Version]
  4. Freedman, A.S.; Aster, J.C. Prognosis of diffuse large B cell lymphoma. In UpToDate; Lister, A., Rosmarin, A.G., Eds.; UpToDate: Waltham, MA, USA, 2021. [Google Scholar]
  5. IBM Corporation. IBM SPSS Neural Networks. New Tools for Building Predictive Models; IBM Corporation: Armonk, NY, USA; New York, NY, USA, 2011. [Google Scholar]
  6. IBM Corporation. IBM SPSS Neural Networks 26. IBM SPSS Statistics 26 Documentation. Document Number 874712. Modified Date: 26 May 2021. Available online: https://www.ibm.com/support/pages/node/874712 (accessed on 9 September 2021).
  7. Ullah, I.; Manzo, M.; Shah, M.; Madden, M. Graph Convolutional Networks: Analysis, improvements and results. arXiv 2019, arXiv:1912.09592. [Google Scholar]
  8. Breen, K.H.; James, S.C.; White, J.D.; Allen, P.M.; Arnold, J.G. A Hybrid Artificial Neural Network to Estimate Soil Moisture Using SWAT+ and SMAP Data. Mach. Learn. Knowl. Extr. 2020, 2, 283–306. [Google Scholar] [CrossRef]
  9. Lin, H.; Zheng, W.; Peng, X. Orientation-Encoding CNN for Point Cloud Classification and Segmentation. Mach. Learn. Knowl. Extr. 2021, 3, 601–614. [Google Scholar] [CrossRef]
  10. Mayr, F.; Yovine, S.; Visca, R. Property Checking with Interpretable Error Characterization for Recurrent Neural Networks. Mach. Learn. Knowl. Extr. 2021, 3, 205–227. [Google Scholar] [CrossRef]
  11. Pickens, A.; Sengupta, S. Benchmarking Studies Aimed at Clustering and Classification Tasks Using K-Means, Fuzzy C-Means and Evolutionary Neural Networks. Mach. Learn. Knowl. Extr. 2021, 3, 695–719. [Google Scholar] [CrossRef]
  12. Shah, S.A.A.; Manzoor, M.A.; Bais, A. Canopy Height Estimation at Landsat Resolution Using Convolutional Neural Networks. Mach. Learn. Knowl. Extr. 2020, 2, 23–36. [Google Scholar] [CrossRef] [Green Version]
  13. Silva Araújo, V.J.; Guimarães, A.J.; de Campos Souza, P.V.; Rezende, T.S.; Araújo, V.S. Using Resistin, Glucose, Age and BMI and Pruning Fuzzy Neural Network for the Construction of Expert Systems in the Prediction of Breast Cancer. Mach. Learn. Knowl. Extr. 2019, 1, 466–482. [Google Scholar] [CrossRef] [Green Version]
  14. Škrlj, B.; Kralj, J.; Lavrač, N.; Pollak, S. Towards Robust Text Classification with Semantics-Aware Recurrent Neural Architecture. Mach. Learn. Knowl. Extr. 2019, 1, 575–589. [Google Scholar] [CrossRef] [Green Version]
  15. Ma, M.C.J.; Tadros, S.; Bouska, A.; Heavican, T.; Yang, H.; Deng, Q.; Moore, D.; Akhter, A.; Hartert, K.; Jain, N.; et al. Subtype-specific and co-occurring genetic alterations in B-cell non-Hodgkin lymphoma. Haematologica 2021. [Google Scholar] [CrossRef]
  16. Aguirre-Gamboa, R.; Gomez-Rueda, H.; Martinez-Ledesma, E.; Martinez-Torteya, A.; Chacolla-Huaringa, R.; Rodriguez-Barrientos, A.; Tamez-Pena, J.G.; Trevino, V. SurvExpress: An online biomarker validation tool and database for cancer gene expression data using survival analysis. PLoS ONE 2013, 8, e74250. [Google Scholar] [CrossRef] [Green Version]
  17. Carreras, J.; Kikuti, Y.Y.; Miyaoka, M.; Hiraiwa, S.; Tomita, S.; Ikoma, H.; Kondo, Y.; Ito, A.; Shiraiwa, S.; Hamoudi, R.; et al. A Single Gene Expression Set Derived from Artificial Intelligence Predicted the Prognosis of Several Lymphoma Subtypes; and High Immunohistochemical Expression of TNFAIP8 Associated with Poor Prognosis in Diffuse Large B-Cell Lymphoma. AI 2020, 1, 342–360. [Google Scholar] [CrossRef]
  18. Subramanian, A.; Tamayo, P.; Mootha, V.K.; Mukherjee, S.; Ebert, B.L.; Gillette, M.A.; Paulovich, A.; Pomeroy, S.L.; Golub, T.R.; Lander, E.S.; et al. Gene set enrichment analysis: A knowledge-based approach for interpreting genome-wide expression profiles. Proc. Natl. Acad. Sci. USA 2005, 102, 15545–15550. [Google Scholar] [CrossRef] [PubMed] [Green Version]
  19. Carreras, J.; Hamoudi, R.; Nakamura, N. Artificial Intelligence Analysis of Gene Expression Data Predicted the Prognosis of Patients with Diffuse Large B-Cell Lymphoma. Tokai J. Exp. Clin. Med. 2020, 45, 37–48. Available online: http://mj-med-u-tokai.com/pdf/450107.pdf (accessed on 9 September 2021). [PubMed]
  20. Carreras, J.; Kikuti, Y.Y.; Miyaoka, M.; Hiraiwa, S.; Tomita, S.; Ikoma, H.; Kondo, Y.; Ito, A.; Nakamura, N.; Hamoudi, R. Artificial Intelligence Analysis of the Gene Expression of Follicular Lymphoma Predicted the Overall Survival and Correlated with the Immune Microenvironment Response Signatures. Mach. Learn. Knowl. Extr. 2020, 2, 647–671. [Google Scholar] [CrossRef]
  21. Carreras, J.; Kikuti, Y.Y.; Miyaoka, M.; Hiraiwa, S.; Tomita, S.; Ikoma, H.; Kondo, Y.; Ito, A.; Nakamura, N.; Hamoudi, R. A Combination of Multilayer Perceptron, Radial Basis Function Artificial Neural Networks and Machine Learning Image Segmentation for the Dimension Reduction and the Prognosis Assessment of Diffuse Large B-Cell Lymphoma. AI 2021, 2, 106–134. [Google Scholar] [CrossRef]
  22. Carreras, J.; Kikuti, Y.Y.; Miyaoka, M.; Roncador, G.; Garcia, J.F.; Hiraiwa, S.; Tomita, S.; Ikoma, H.; Kondo, Y.; Ito, A.; et al. Integrative Statistics, Machine Learning and Artificial Intelligence Neural Network Analysis Correlated CSF1R with the Prognosis of Diffuse Large B-Cell Lymphoma. Hemato 2021, 2, 182–206. [Google Scholar] [CrossRef]
  23. Carreras, J.; Kikuti, Y.Y.; Roncador, G.; Miyaoka, M.; Hiraiwa, S.; Tomita, S.; Ikoma, H.; Kondo, Y.; Ito, A.; Shiraiwa, S.; et al. High Expression of Caspase-8 Associated with Improved Survival in Diffuse Large B-Cell Lymphoma: Machine Learning and Artificial Neural Networks Analyses. BioMedInformatics 2021, 1, 18–46. [Google Scholar] [CrossRef]
  24. UniProt, C. UniProt: The universal protein knowledgebase in 2021. Nucleic Acids Res. 2021, 49, D480–D489. [Google Scholar] [CrossRef]
  25. Stelzer, G.; Rosen, N.; Plaschkes, I.; Zimmerman, S.; Twik, M.; Fishilevich, S.; Stein, T.I.; Nudel, R.; Lieder, I.; Mazor, Y.; et al. The GeneCards Suite: From Gene Data Mining to Disease Genome Sequence Analyses. Curr. Protoc. Bioinform. 2016, 54, 1.30.1–1.30.33. [Google Scholar] [CrossRef]
  26. Matas-Cespedes, A.; Rodriguez, V.; Kalko, S.G.; Vidal-Crespo, A.; Rosich, L.; Casserras, T.; Balsas, P.; Villamor, N.; Gine, E.; Campo, E.; et al. Disruption of follicular dendritic cells-follicular lymphoma cross-talk by the pan-PI3K inhibitor BKM120 (Buparlisib). Clin. Cancer Res. 2014, 20, 3458–3471. [Google Scholar] [CrossRef] [PubMed] [Green Version]
  27. Kawaguchi, Y.; Saito, B.; Nakata, A.; Matsui, T.; Sasaki, Y.; Shimada, S.; Abe, M.; Watanuki, M.; Baba, Y.; Murai, S.; et al. Elevated C-reactive protein level is associated with poor prognosis in follicular lymphoma patients undergoing rituximab-containing chemotherapy. Int. J. Hematol. 2020, 112, 341–348. [Google Scholar] [CrossRef] [PubMed]
  28. Arlauckas, S.P.; Garren, S.B.; Garris, C.S.; Kohler, R.H.; Oh, J.; Pittet, M.J.; Weissleder, R. Arg1 expression defines immunosuppressive subsets of tumor-associated macrophages. Theranostics 2018, 8, 5842–5854. [Google Scholar] [CrossRef] [PubMed]
  29. Valero, J.G.; Matas-Cespedes, A.; Arenas, F.; Rodriguez, V.; Carreras, J.; Serrat, N.; Guerrero-Hernandez, M.; Yahiaoui, A.; Balague, O.; Martin, S.; et al. The receptor of the colony-stimulating factor-1 (CSF-1R) is a novel prognostic factor and therapeutic target in follicular lymphoma. Leukemia 2021. [Google Scholar] [CrossRef] [PubMed]
  30. Metzger, K.; Moratin, J.; Freier, K.; Hoffmann, J.; Zaoui, K.; Plath, M.; Stogbauer, F.; Freudlsperger, C.; Hess, J.; Horn, D. A six-gene expression signature related to angiolymphatic invasion is associated with poor survival in laryngeal squamous cell carcinoma. Eur. Arch. Otorhinolaryngol. 2021, 278, 1199–1207. [Google Scholar] [CrossRef]
  31. Romano, A.; Parrinello, N.L.; Chiarenza, A.; Motta, G.; Tibullo, D.; Giallongo, C.; La Cava, P.; Camiolo, G.; Puglisi, F.; Palumbo, G.A.; et al. Immune off-target effects of Brentuximab Vedotin in relapsed/refractory Hodgkin Lymphoma. Br. J. Haematol. 2019, 185, 468–479. [Google Scholar] [CrossRef]
  32. Visser, H.P.; Tewis, M.; Willemze, R.; Kluin-Nelemans, J.C. Mantle cell lymphoma proliferates upon IL-10 in the CD40 system. Leukemia 2000, 14, 1483–1489. [Google Scholar] [CrossRef] [Green Version]
  33. Takimoto-Shimomura, T.; Tsukamoto, T.; Maegawa, S.; Fujibayashi, Y.; Matsumura-Kimoto, Y.; Mizuno, Y.; Chinen, Y.; Shimura, Y.; Mizutani, S.; Horiike, S.; et al. Dual targeting of bromodomain-containing 4 by AZD5153 and BCL2 by AZD4320 against B-cell lymphomas concomitantly overexpressing c-MYC and BCL2. Investig. New Drugs 2019, 37, 210–222. [Google Scholar] [CrossRef]
  34. Shaw, K.T.; Greig, N.H. Chemokine receptor mRNA expression at the in vitro blood-brain barrier during HIV infection. Neuroreport 1999, 10, 53–56. [Google Scholar] [CrossRef] [PubMed] [Green Version]
  35. Trentin, L.; Cabrelle, A.; Facco, M.; Carollo, D.; Miorin, M.; Tosoni, A.; Pizzo, P.; Binotto, G.; Nicolardi, L.; Zambello, R.; et al. Homeostatic chemokines drive migration of malignant B cells in patients with non-Hodgkin lymphomas. Blood 2004, 104, 502–508. [Google Scholar] [CrossRef] [PubMed] [Green Version]
Figure 1. Normal B-cell differentiation and its relationship with the non-Hodgkin lymphoma subtypes of this research. According to the WHO Classification of Tumors of Haematopoietic and Lymphoid Tissues, revised 4th edition 2017, B-cell neoplasms correspond to various stages of B-cell differentiation [3]. Mantle cell lymphoma develops from or has a stage of differentiation of the pre-germinal center B-lymphocytes (CD5-positive naïve B-lymphocytes); follicular lymphoma, diffuse large B-cell lymphoma, and Burkitt lymphoma derived from B-lymphocytes of the germinal center (centroblasts, and centrocytes); and marginal zone B-cell lymphoma derives from pot-germinal center B-lymphocytes.
Make 03 00036 g001
Figure 2. Basic multilayer perceptron architecture.
Make 03 00036 g002
Figure 3. MLP analysis for predicting NHL subtypes based on all genes and cancer transcriptome panel. This figure shows the network performance of the MLP analyses. First, all the genes of the array were used as input. Second, the input data were the genes of the cancer transcriptome panel. In both cases, the output was the 5 NHL subtypes. As shown by the ROC curve, the performance was higher for the cancer transcriptome panel.
Make 03 00036 g003
Figure 4. Network diagram of the MLP for predicting NHL subtypes based on a cancer transcriptome panel. This figure shows the architecture of the neural network used to input the gene expression of the cancer transcriptome panel (n = 1769) and to output the 5 NHL subtypes. The top 20 genes are shown in order of importance according to their normalized importance for prediction.
Make 03 00036 g004
Figure 5. Prediction of each NHL subtype by all genes of the array (n = 20,863) using MLP analysis. This figure shows the top 20 genes of the MLP analysis according to their normalized importance for predicting an NHL subtype against the other subtypes. For example, CA6 was the most important gene for predicting FL vs. the other NHL subtypes (i.e., FL vs. MCL + DLBCL + BL + MZL).
Make 03 00036 g005
Figure 6. Prediction of each NHL subtype by the cancer transcriptome panel (n = 1769) using MLP analysis. This figure shows the top 20 genes of the MLP analysis according to their normalized importance for predicting an NHL subtype against the other subtypes, using the cancer transcriptome panel. For example, ITGA1 was the most important gene for predicting FL vs. the other NHL subtypes (i.e., FL vs. MCL + DLBCL + BL + MZL).
Make 03 00036 g006
Figure 7. Network diagram of the MLP for predicting FL vs. the other NHL subtypes, based on a cancer transcriptome panel (n = 1769). This figure shows the architecture of the neural network used to input the gene expression of the cancer transcriptome panel and to output the FL vs. other NHL subtypes (MCL + DLBCL + BL + MZL). The top 20 genes are shown in order of importance according to their normalized importance for prediction. Interestingly, CD19 was the least important gene, which makes pathological sense as CD19 is a pan B-cell marker. A Bayesian network analysis for predicting FL vs. others by the top 20 genes is shown at the bottom of the figure.
Make 03 00036 g007
Figure 8. Predictive value for the overall survival of the top 30 genes of the MLP. Using the gene expression of 30 genes, previously identified by the MLP analysis, and a risk-score formula, the overall survival of diffuse large B-cell lymphoma and the most relevant subtypes of cancers were calculated. All cases, Log-rank (Mantel–Cox) p-value = 5.1 × 10−202; DLBCL, p = 5.7 × 10⁻¹⁵; breast cancer, p = 1.4 × 10⁻¹⁶; lung cancer, p = 4.5 × 10⁻²⁰.
Make 03 00036 g008
Figure 9. Predictive value for the overall survival of the top 30 genes of the MLP. Using the gene expression of 30 genes, previously identified by the MLP analysis and a risk-score formula, the overall survival of the most relevant subtypes of cancers was calculated. These prognostic genes belong to the apoptosis, cell proliferation, metabolism, and antigen presentation pathways. Colorectal cancer, Log-rank (Mantel–Cox) p-value = 2 × 10⁻⁶; prostate cancer, p = 1.6 × 10⁻¹¹; skin melanoma, p = 2.5 × 10⁻¹⁰; gastric + esophageal cancer, p = 3.3 × 10⁻⁶; liver cancer, p = 1.4 × 10⁻¹⁰; cervical cancer, p = 3.7 × 10⁻⁹.
Make 03 00036 g009
Table 1. Prediction of the NHL subtypes by all genes of the array and the cancer transcriptome panel using multilayer perceptron analysis.
MLPAll Genes Set
(n = 20,863)
Cancer Transcriptome Panel 1
(n = 1769)
Case processing summary
Training199 (68.6%)199 (68.6%)
Testing91 (31.4%)91 (31.4%)
Valid290 (100%)290 (100%)
Network information
Input layer
Covariates20,8631769
Units20,8631769
RescalingStandardizedStandardized
Hidden layer
Number11
Units1216
Activation functionHyperbolic tangentHyperbolic tangent
Output layer
Dependent variable1, Subtype1, Subtype
Units55
Activation functionSoftmaxSoftmax
Error functionCross-entropyCross-entropy
Model summary
Training
Cross-entropy error147.20134.967
Incorrect predictions28.1%5.5%
Stopping rule1 consecutive step with no decrease in error1 consecutive step with no decrease in error
Time0:02:04.010:00:08.77
Testing
Cross-entropy error78.30556.043
Incorrect predictions35.2%24.2%
Classification 2
Training71.9%94.5%
Testing64.8%75.8%
Area under the curve
FL0.9110.991
MCL0.9270.987
DLBCL0.8990.977
BL0.9470.990
MZL0.8720.989
1Figure 4 shows the architecture of this artificial neural network. 2 Classification for each NHL subtype using all the genes was the following: (1) training set, FL (67.4%), MCL (75.0%), DLBCL (77.5%), BL (82.5%), MZL (21.4%), overall (71.9%); testing set, FL (84.2%), MCL (53.3%), DLBCL (69.0%), BL (73.7%), MZL (11.1%), overall (64.8%). The classification using the cancer transcriptome panel was the following: training set, FL (95.7%), MCL (96.4%), DLBCL (93.0%), BL (95.0%), MZL (92.9%), overall (94.5%); testing set, FL (89.5%), MCL (86.7%), DLBCL (79.3%), BL (68.4%), MZL (33.3%), overall (75.8%).
Table 2. Top 20 genes for predicting NHL subtypes (based on all genes set, n = 20,863).
GeneNIKeywordFunction 1
LCE2B11q21Late cornified envelope protein 2B, belongs to the LCE cluster on 1q21
KNG10.909ApoptosisKininogen-1, negative regulation of cell adhesion, positive regulation of apoptotic process
IGHV7_810.863B-cell receptorProbable nonfunctional immunoglobulin heavy variable 7-81, B-cell receptor signaling pathway, phagocytosis
TG0.842HormoneThyroglobulin, hormone activity
C60.837Membrane attack complexComplement component C6, constituent of membrane attack complex (MAC), adaptive immune response by forming process
FGB0.834ApoptosisFibrinogen beta chain, blood coagulation, adaptive immune response, positive regulation ERK1/ERK2 cascade, negative regulation of extrinsic apoptotic signaling pathway
ZNF7500.828RNA pol.Zinc finger protein 750, regulation of RNA polymerase II
CTSV0.819MHC IICathepsin L2, cysteine protease, antigen processing and presentation of exogenous peptide antigen via MHC class II
INGX0.818Tumor suppressor geneInhibitor of growth family, X-linked (Pseudogene), ING1-like tumor suppressor protein
COL4A60.816Extracellular matrixCollagen alpha-6 (IV) chain, extracellular structural constituent
ZG16B0.816CarbohydrateZymogen granule protein 16 homolog B, carbohydrate binding
SERPINB130.811ApoptosisSerpin B13, negative regulation of endopeptidase activity and apoptotic process
TKTL10.809MetabolismTransketolase-like protein 1, glucose metabolism
TPPP30.808MicrotubuleTubulin polymerization-promoting protein family member 3, microtubule-binding activity
PRL0.797ApoptosisProlactin, growth regulator, suppression of apoptosis
MYOM20.795ActinMyomesin-2, actin filament binding, muscle contraction
EGF0.795Cell growthEpidermal growth factor, plays an important role in the growth, proliferation, and differentiation of numerous cell types
VAT1L0.782ZincSynaptic vesicle membrane protein VAT-1 homolog-like, oxidoreductase activity, zinc ion binding
HTN10.775Humoral responseHistatin-1, antimicrobial humoral response
RBM200.770RNA splicingRNA-binding protein 20, positive regulation of RNA splicing
NI, normalized importance. 1 Based on UniProt [24] and Genecards [25].
Table 3. Top 20 genes for predicting NHL subtypes (based on the cancer transcriptome panel, n = 1769).
GeneNIFunction 1
ARG11Arginase-1, critical regulator of innate and adaptive immune responses, T-cell and NK-cells suppression
MAGEA30.996Melanoma-associated antigen 3, tumor progression, negative regulation of endoplasmic reticulum stress-induced intrinsic apoptosis
AKT20.956RAC-beta serine/threonine-protein kinase, ATP binding, cell cycle, cell migration, apoptosis, B-cell signaling, glucose metabolism
IL1B0.935Interleukin-1 beta, potent proinflammatory cytokine
S100A7A0.925Protein S100A7A, calcium-dependent protein binding
CLEC5A0.898C-type lectin domain family 5 member A, recruitment of macrophages and neutrophils, proinflammatory cytokine release
WIF10.894Wnt inhibitory factor 1, negative regulation of Wnt signaling pathway
TREM10.884Triggering receptor expressed on myeloid cells 1, regulation of innate and humoral immune responses, amplification of immune response
DEFB10.874Beta-defensin 1, innate immune response
GAGE10.865G antigen 1, antigen recognized by autologous cytolytic T-lymphocytes (melanoma)
CALML30.862Calmodulin-like protein 3, calcium ion binding
CXCL80.856Interleukin-8, chemotaxis (neutrophils, basophils, T-cells)
CRP0.849C-reactive protein, host defense, acute-phase response, inflammatory response
APOA20.848Apolipoprotein A-II, cholesterol metabolic process, the negative regulation of cytokine production involved in immune response
FCER1A0.845High-affinity immunoglobulin epsilon receptor subunit alpha, binding to the FC region of IG epsilon, initiation of allergic responses
LCN20.843Neutrophil gelatinase-associated lipocalin, apoptosis, and innate immunity
PGF0.834Prostaglandin F2-alpha receptor, response to estradiol, inflammatory response, positive regulation of apoptotic process, positive regulation of gene expression
HOXA90.827Homeobox protein Hox-A9, endothelial cell activation during inflammation
FLT30.817Receptor-type tyrosine-protein kinase FLT3, MAPK cascade, regulation of apoptosis, lymphocyte activation
IL13RA20.816Interleukin-13 receptor subunit alpha-2, cytokine-mediated signaling pathway, negative regulation of immunoglobulin production
1 Based on UniProt [24] and Genecards [25]. The annotations of each gene based on the transcriptome panel are shown in Supplementary Table S1.
Table 4. Prediction of each NHL subtype by all genes of the array (n = 20,863) using MLP analysis.
MLPFL vs. OthersMCL vs. OthersDLBCL vs. OthersBL vs. OthersMZL vs. Others
Case processing summary
Training212 (73.1%)200 (69%)198 (68.3%)199 (68.6%)206 (71%)
Testing78 (26.9%)90 (31%)92 (31.7%)91 (31.4%)84 (29%)
Valid290 (100%)290 (100%)290 (100%)290 (100%)290 (100%)
Network information
Input layer
Covariates20,86320,86320,86320,86320,863
Units20,86320,86320,86320,86320,863
RescalingStandardizedStandardizedStandardizedStandardizedStandardized
Hidden layer
Number11111
Units131115712
Activation functionHyperbolic tangentHyperbolic tangentHyperbolic tangentHyperbolic tangentHyperbolic tangent
Output layer
Dependent variable1, Subtype1, Subtype1, Subtype1, Subtype1, Subtype
Units22222
Activation functionSoftmaxSoftmaxSoftmaxSoftmaxSoftmax
Error functionCross-entropyCross-entropyCross-entropyCross-entropyCross-entropy
Model summary
Training
Cross-entropy error49.72038.99659.03129.72010.144
Incorrect predictions7.5%6.5%13.1%6.0%1.5%
Stopping rule1 consecutive step with no decrease in error1 consecutive step with no decrease in error1 consecutive step with no decrease in error1 consecutive step with no decrease in error1 consecutive step with no decrease in error
Time0:02:17.430:01:58.260:02:07.450:02:09.940:02:14.59
Testing
Cross-entropy error12.74312.63533.48916.74410.506
Incorrect predictions3.8%5.6%17.4%4.4%6.0%
Classification 1
Training92.5%93.5%86.9%94.0%98.5%
Testing96.2%94.4%82.6%95.6%94%
Area under the curve
FL0.9550.9410.9270.9760.990
Others0.9550.9410.9270.9760.990
Table 5. Prediction of each NHL subtype by the cancer transcriptome panel (n = 1769) using MLP analysis.
MLPFL vs. Others 1MCL vs. OthersDLBCL vs. OthersBL vs. OthersMZL vs. Others
Case processing summary
Training212 (73.1%)200 (69.0%)198 (68.3%)199 (68.6%)206 (71.0%)
Testing78 (26.9%)90 (31.0%)92 (31.7%)91 (31.4%)84 (29.0%)
Valid290 (100%)290 (100%)290 (100%)290 (100%)290 (100%)
Network information
Input layer
Covariates17691769176917691769
Units17691769176917691769
RescalingStandardizedStandardizedStandardizedStandardizedStandardized
Hidden layer
Number11111
Units1212131014
Activation functionHyperbolic tangentHyperbolic tangentHyperbolic tangentHyperbolic tangentHyperbolic tangent
Output layer
Dependent variable1, Subtype1, Subtype1, Subtype1, Subtype1, Subtype
Units22222
Activation functionSoftmaxSoftmaxSoftmaxSoftmaxSoftmax
Error functionCross-entropyCross-entropyCross-entropyCross-entropyCross-entropy
Model summary
Training
Cross-entropy error40.50934.65547.81416.8556.660
Incorrect predictions7.1%5.0%9.1%3.5%1.0%
Stopping rule1 consecutive step with no decrease in error1 consecutive step with no decrease in error1 consecutive step with no decrease in error1 consecutive step with no decrease in error1 consecutive step with no decrease in error
Time0:00:08.020:00:09.000:00:07.920:00:08.690:00:08.56
Testing
Cross-entropy error16.9236.95021.49215.32011.794
Incorrect predictions9.0%3.3%7.6%8.8%7.1%
Classification 1
Training92.9%95.0%90.0%96.5%99.0%
Testing91.0%96.7%92.4%91.2%92.9%
Area under the curve
FL0.9640.9700.9640.9900.993
Others0.9640.9700.9640.9900.993
1 Figure 7 shows the architecture of this artificial neural network.
Table 6. Overall survivals according to the top 30 genes.
SubtypeNum.p-ValueHazard Risk95% CI
Diffuse large B-cell lymphoma (DLBCL)414<0.00013.82.65.4
Breast carcinoma962<0.00014.22.96.1
Colorectal carcinoma466<0.00012.61.73.8
Lung carcinoma650<0.00013.22.44.1
Prostate adenocarcinoma497<0.000131.96.5154.5
Skin cutaneous melanoma335<0.00013.22.24.7
Gastric adenocarcinoma + esophageal carcinoma440<0.00012.51.63.9
Liver hepatocellular carcinoma361<0.00013.62.45.4
Cervical carcinoma191<0.00016.73.313.8
Thyroid papillary carcinoma489<0.000120.96.962.6
Pancreatic ductal adenocarcinoma189<0.00013.42.25.2
Kidney carcinoma792<0.00012.92.23.9
Uterine corpus endometrioid carcinoma247<0.00018.73.918.9
Head and neck carcinoma502<0.00012.31.73.0
Central nervous system glioblastoma multiforme659<0.00013.82.75.3
Ovarian serous carcinoma247<0.00013.62.35.7
All cases7441<0.00013.63.33.9
Publisher’s Note: MDPI stays neutral with regard to jurisdictional claims in published maps and institutional affiliations.

