
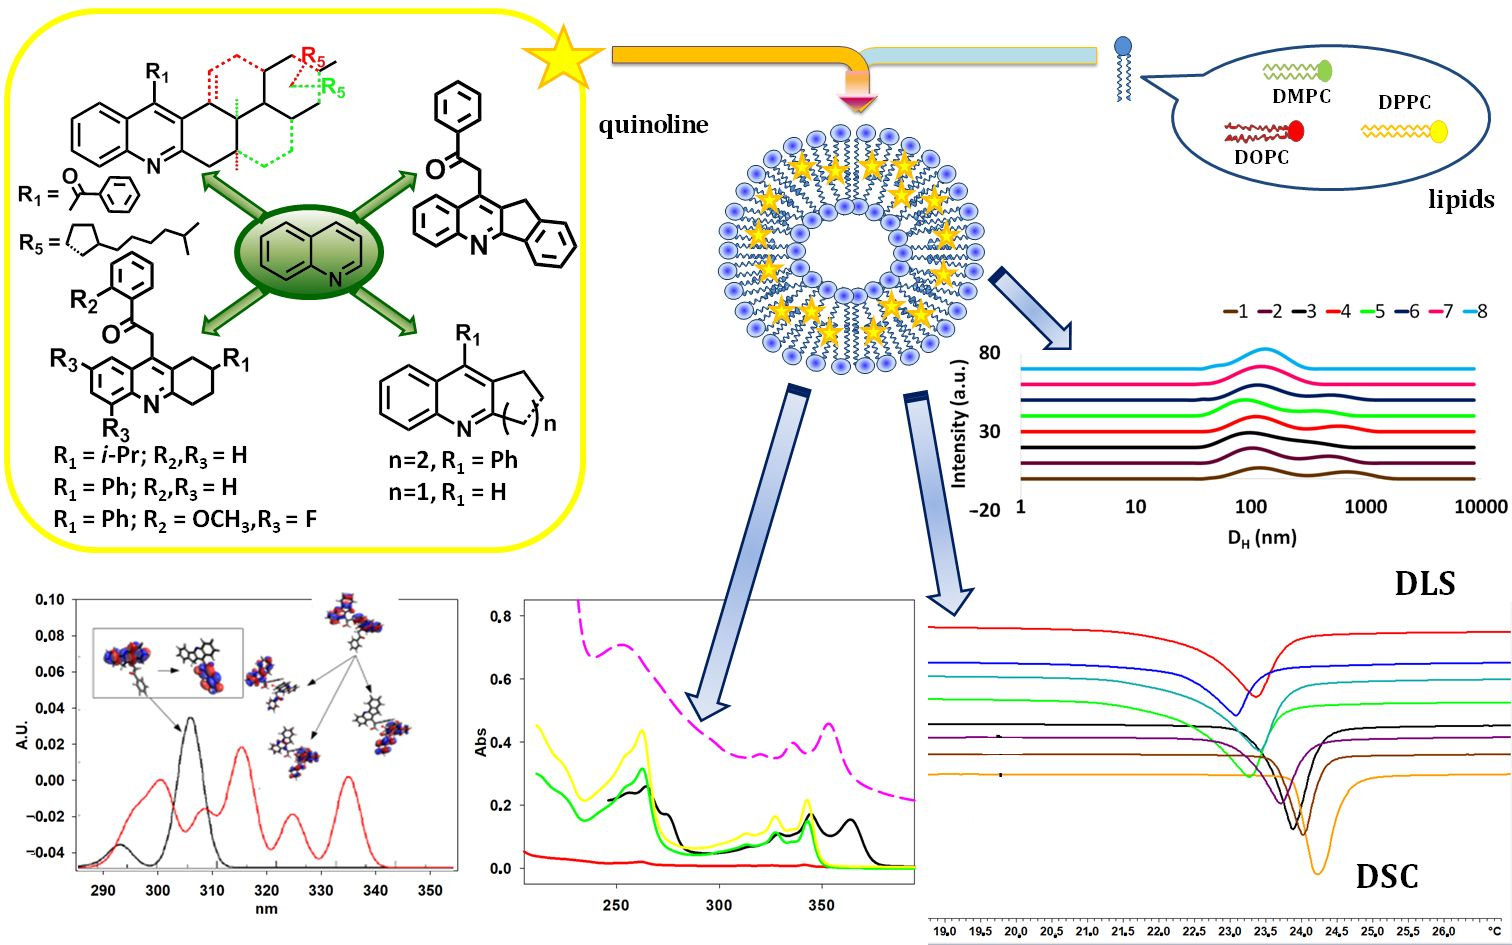
UV Properties and Loading into Liposomes of Quinoline Derivatives

 , , ,
, , ,
Abstract
:
1. Introduction
2. Materials and Methods
2.1. Instrumentation
2.2. Materials
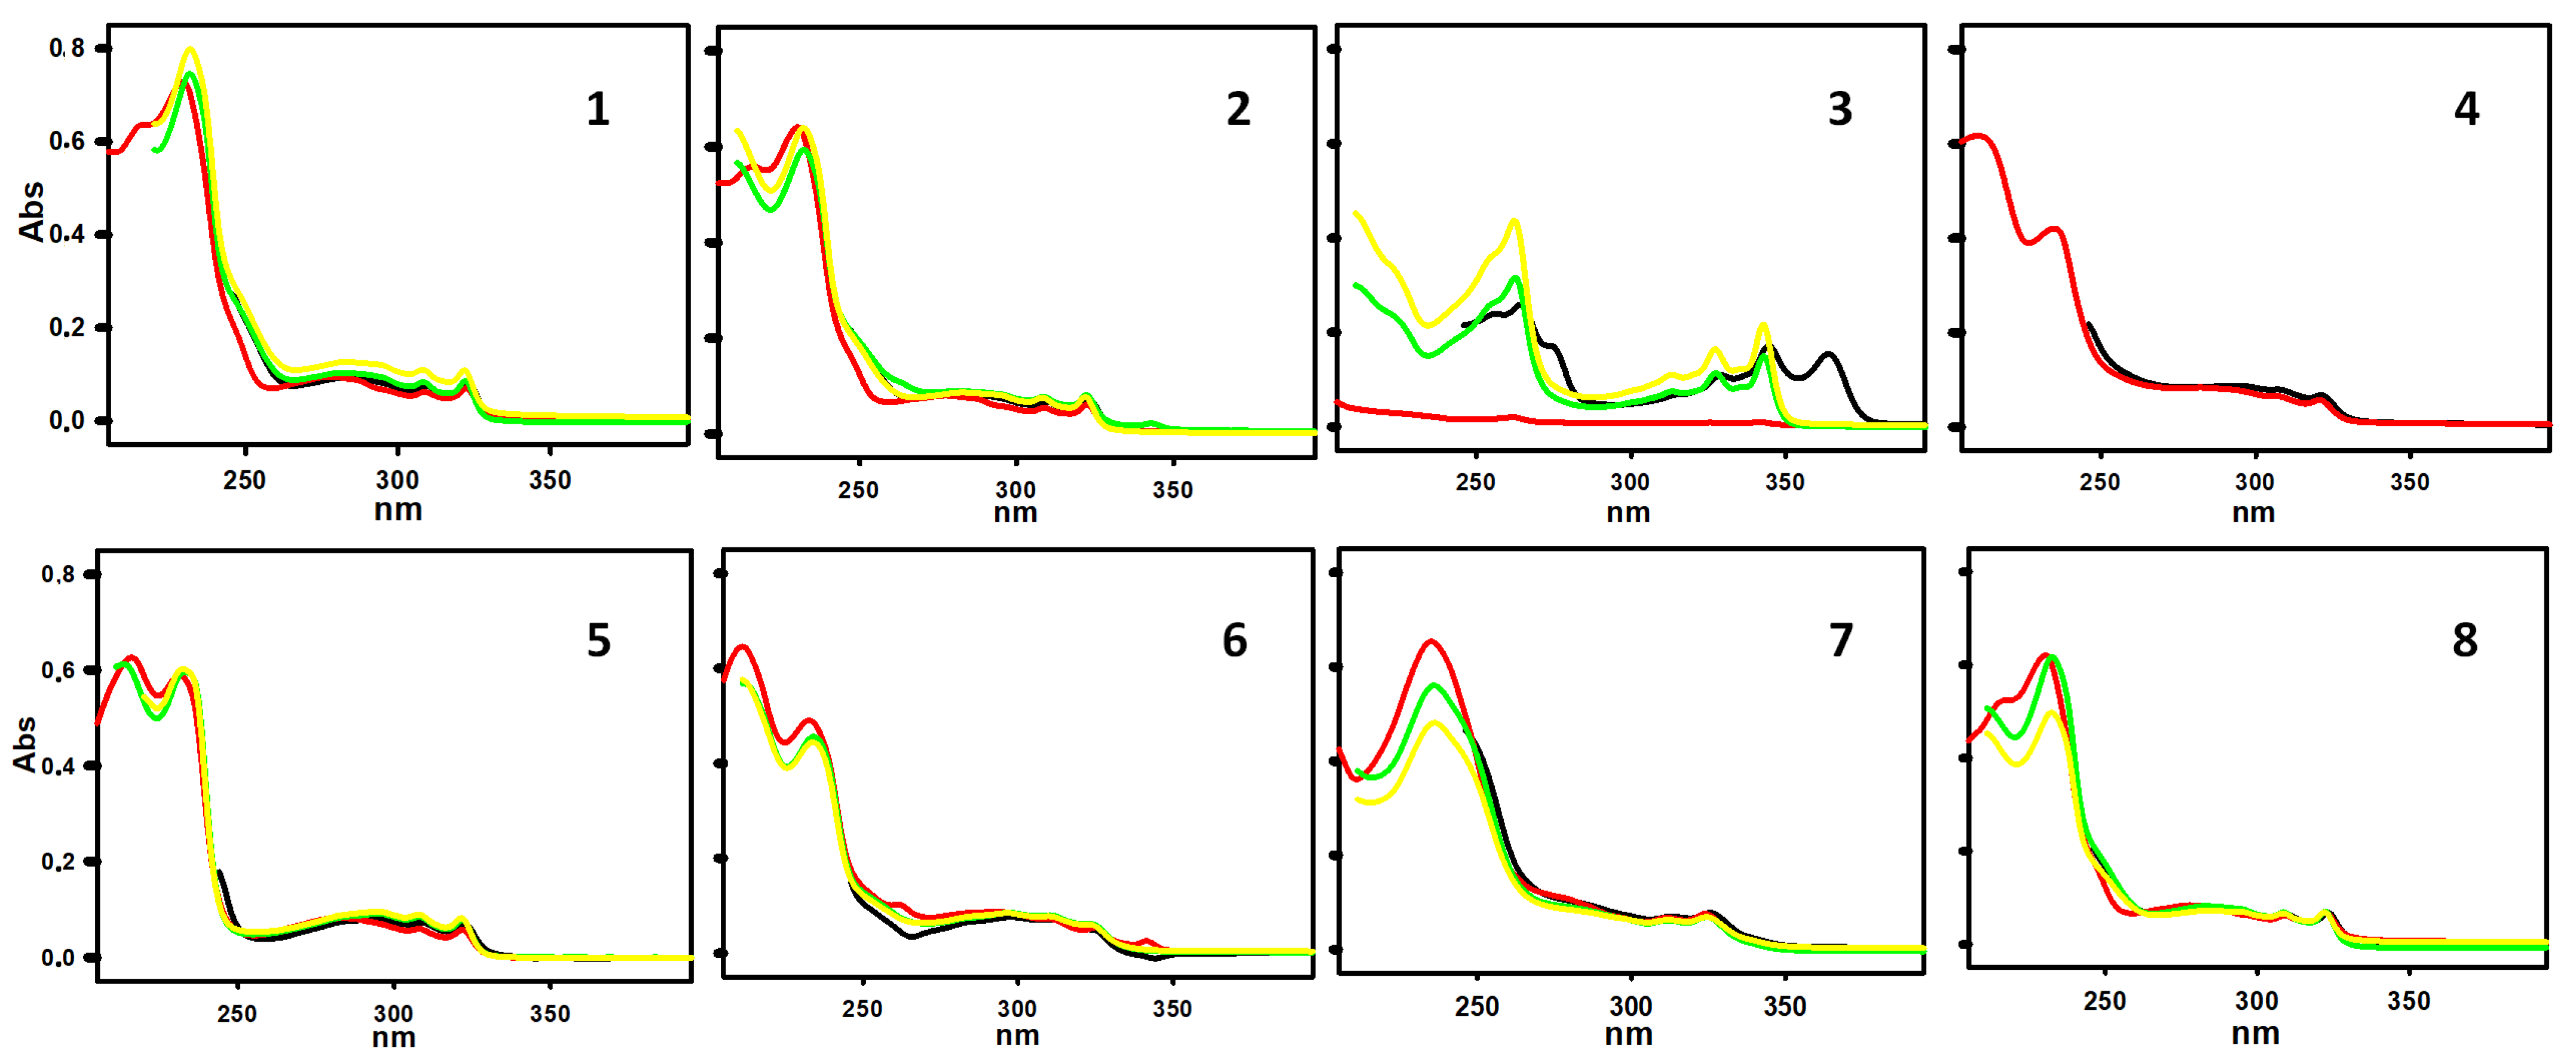
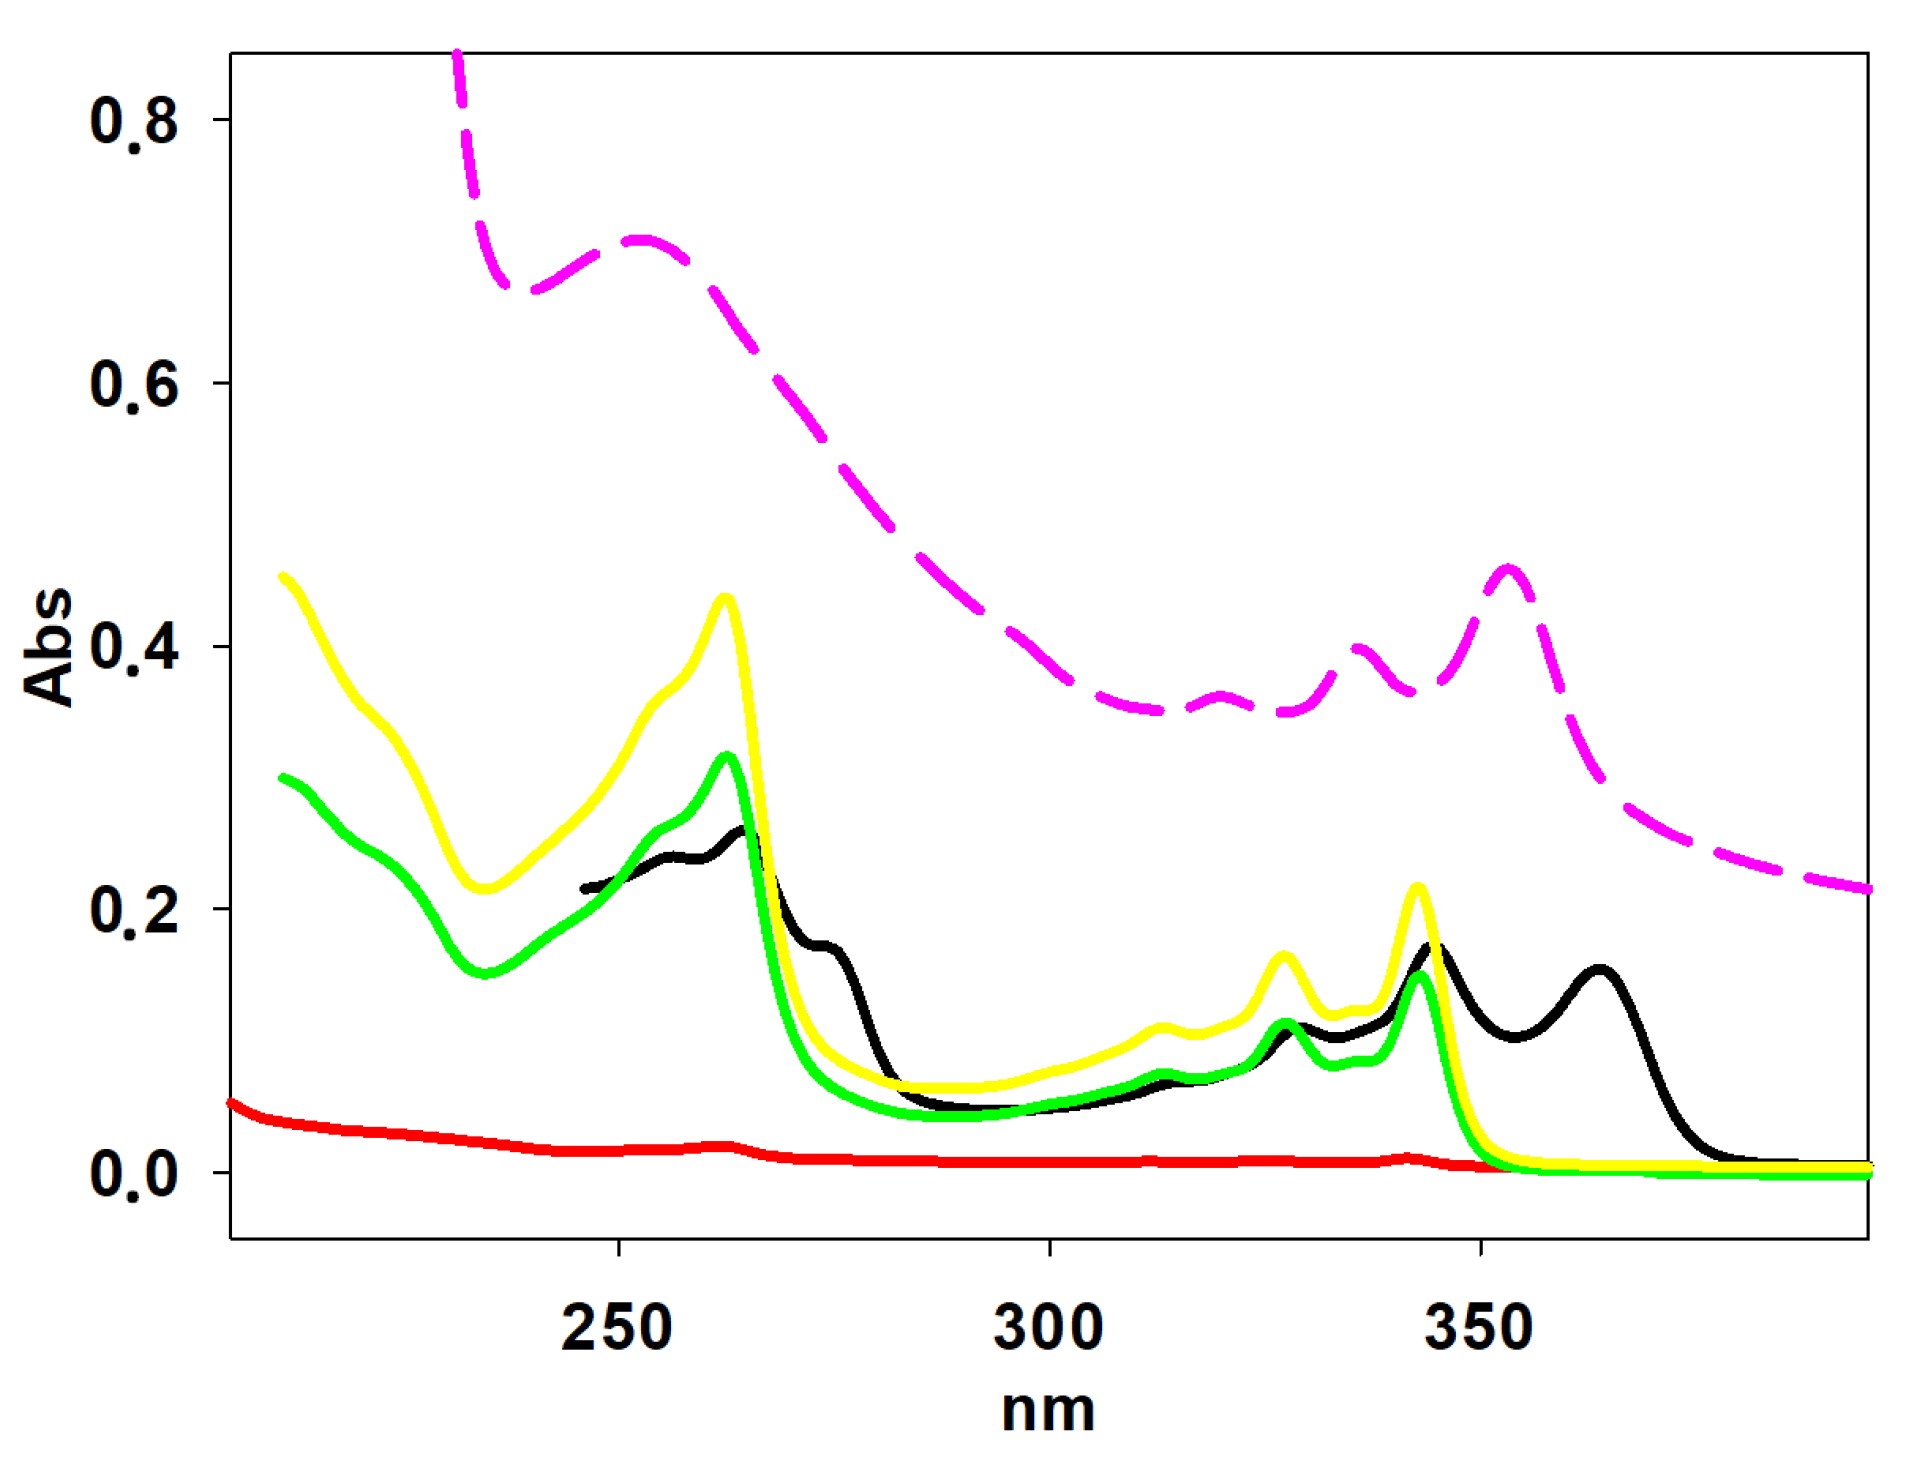
2.3. UV Characterization of Quinolines
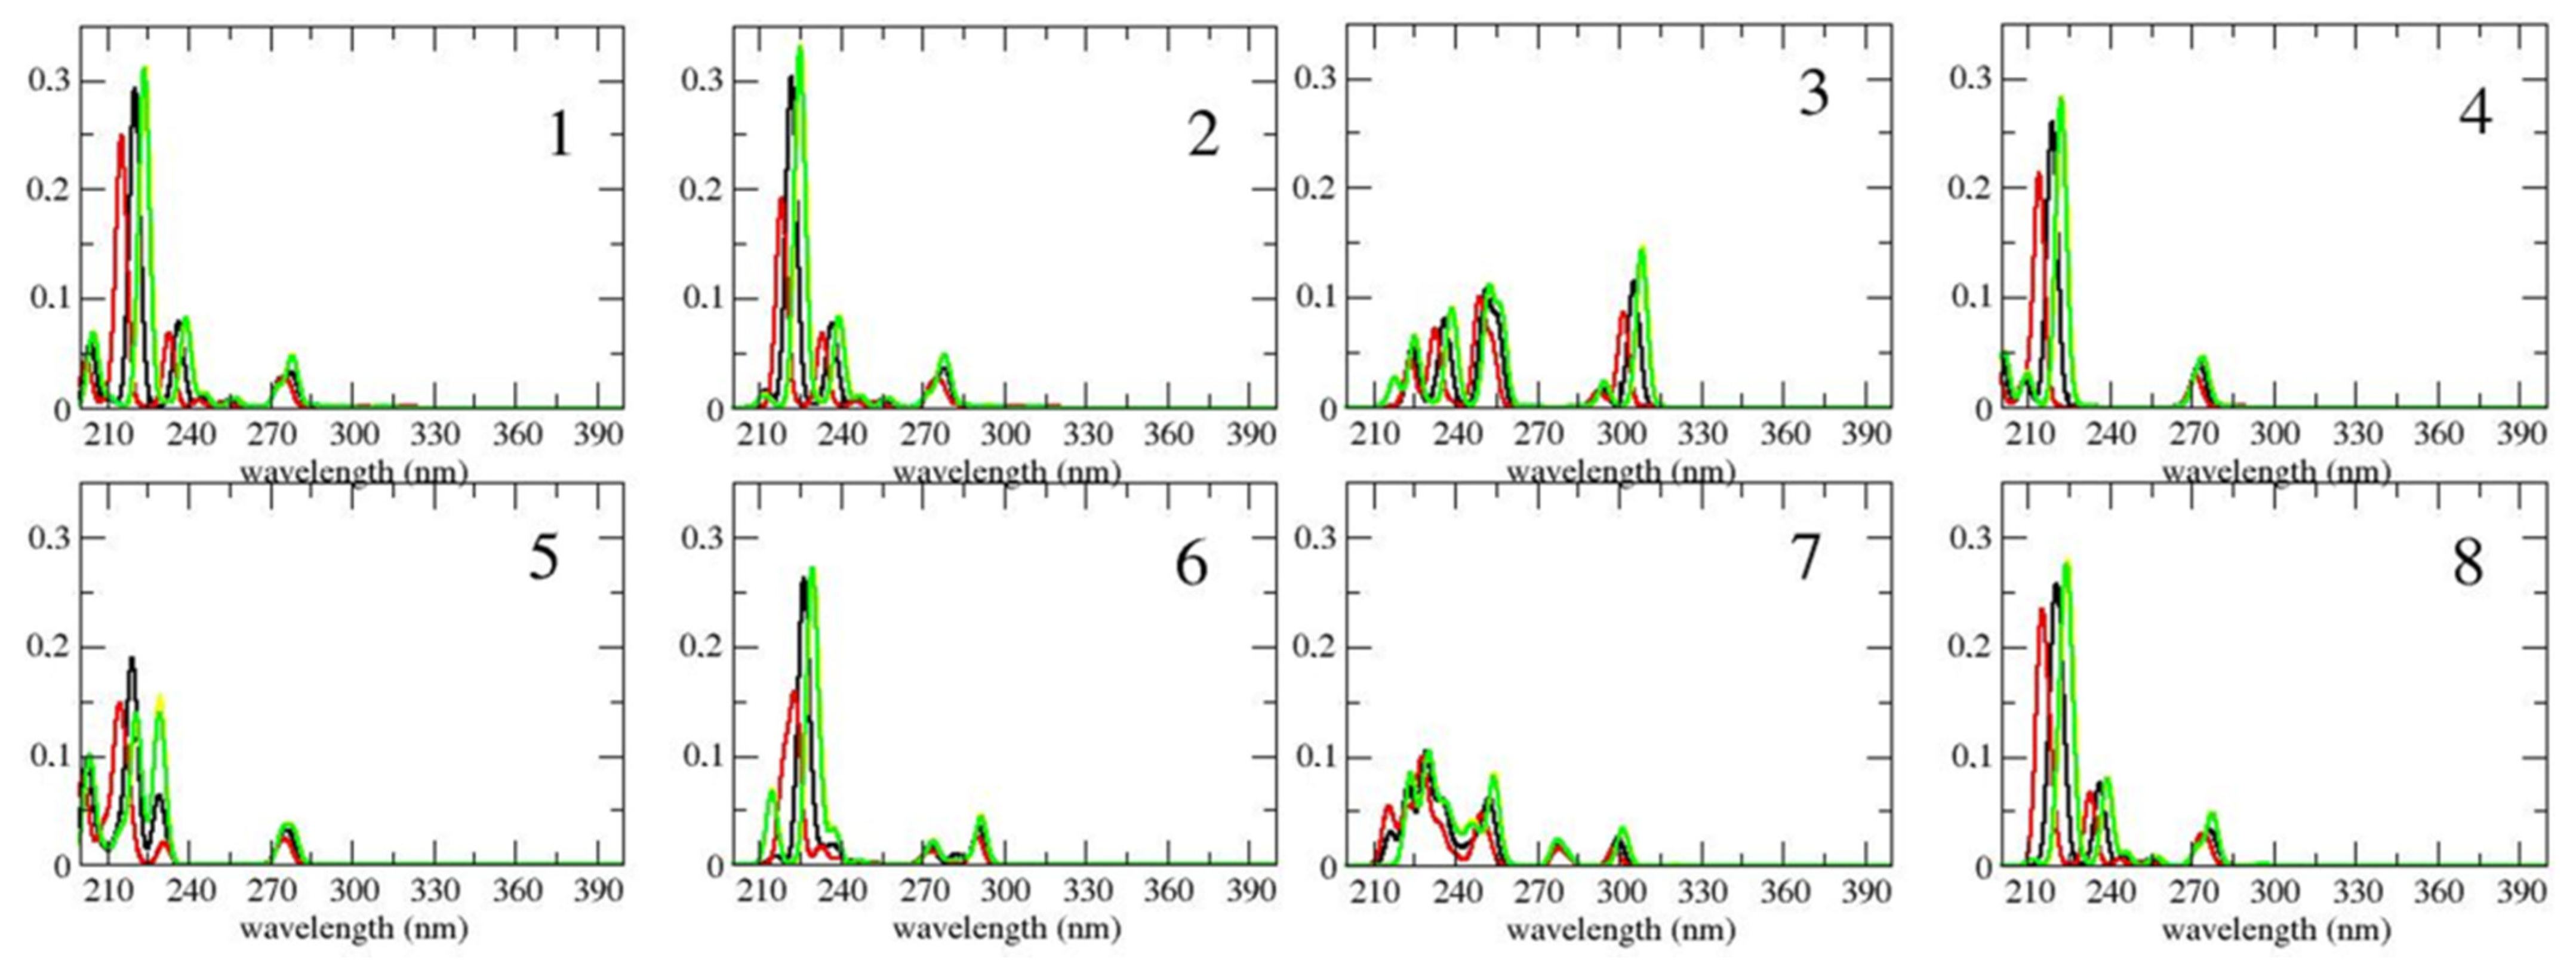
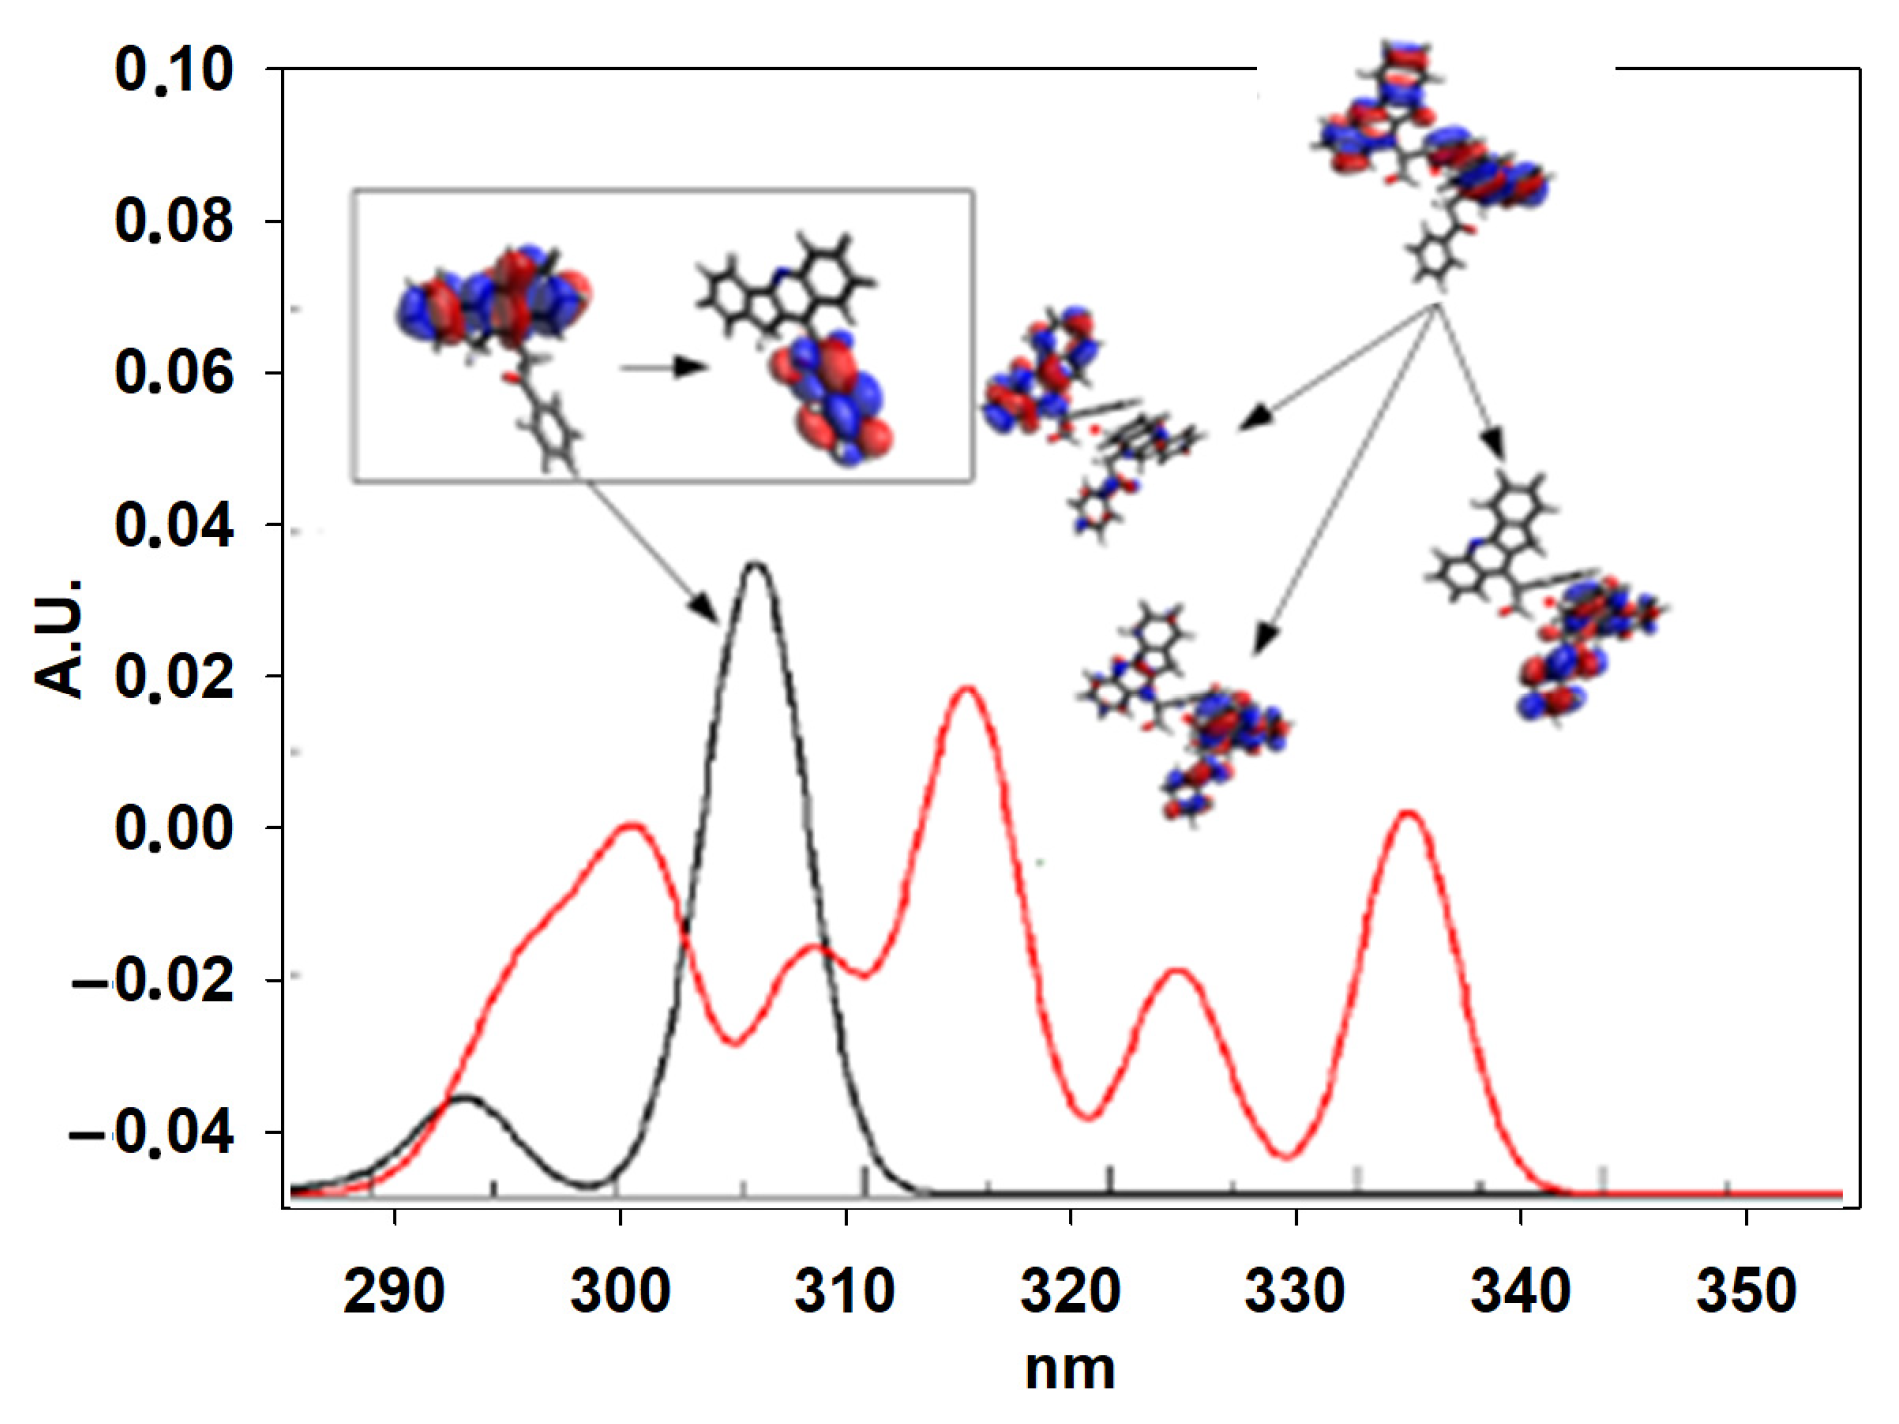
2.4. Computational Details
2.5. Liposomes Preparation and Quinolines Inclusion
2.6. Evaluation of Entrapment Efficiency
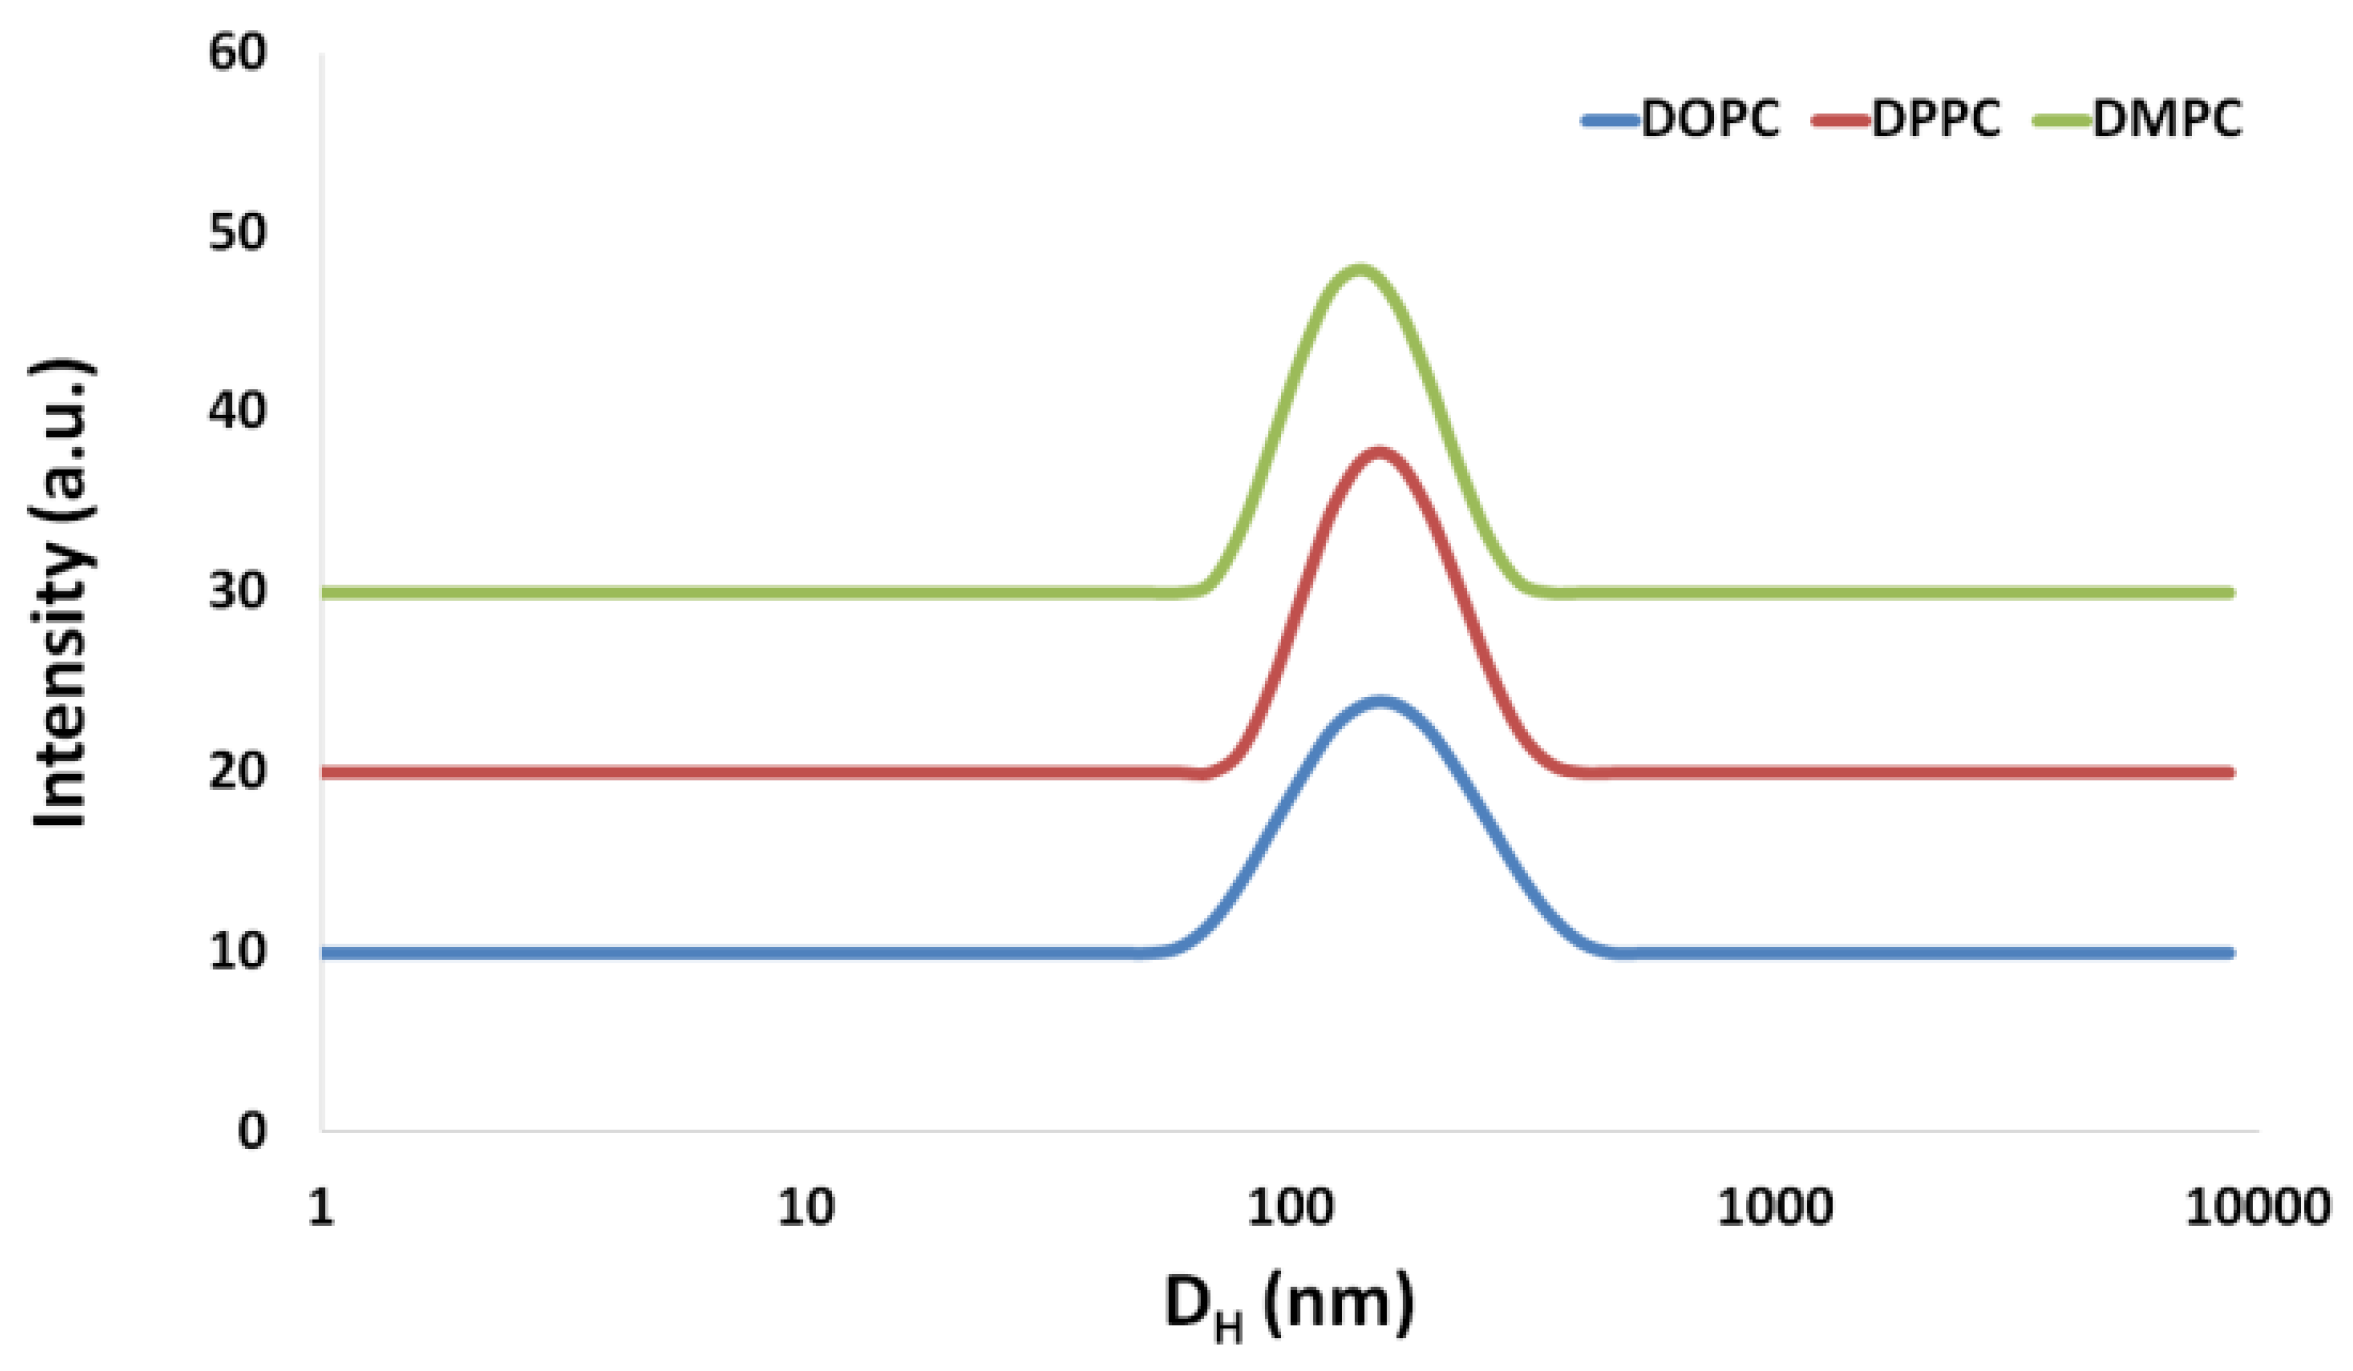
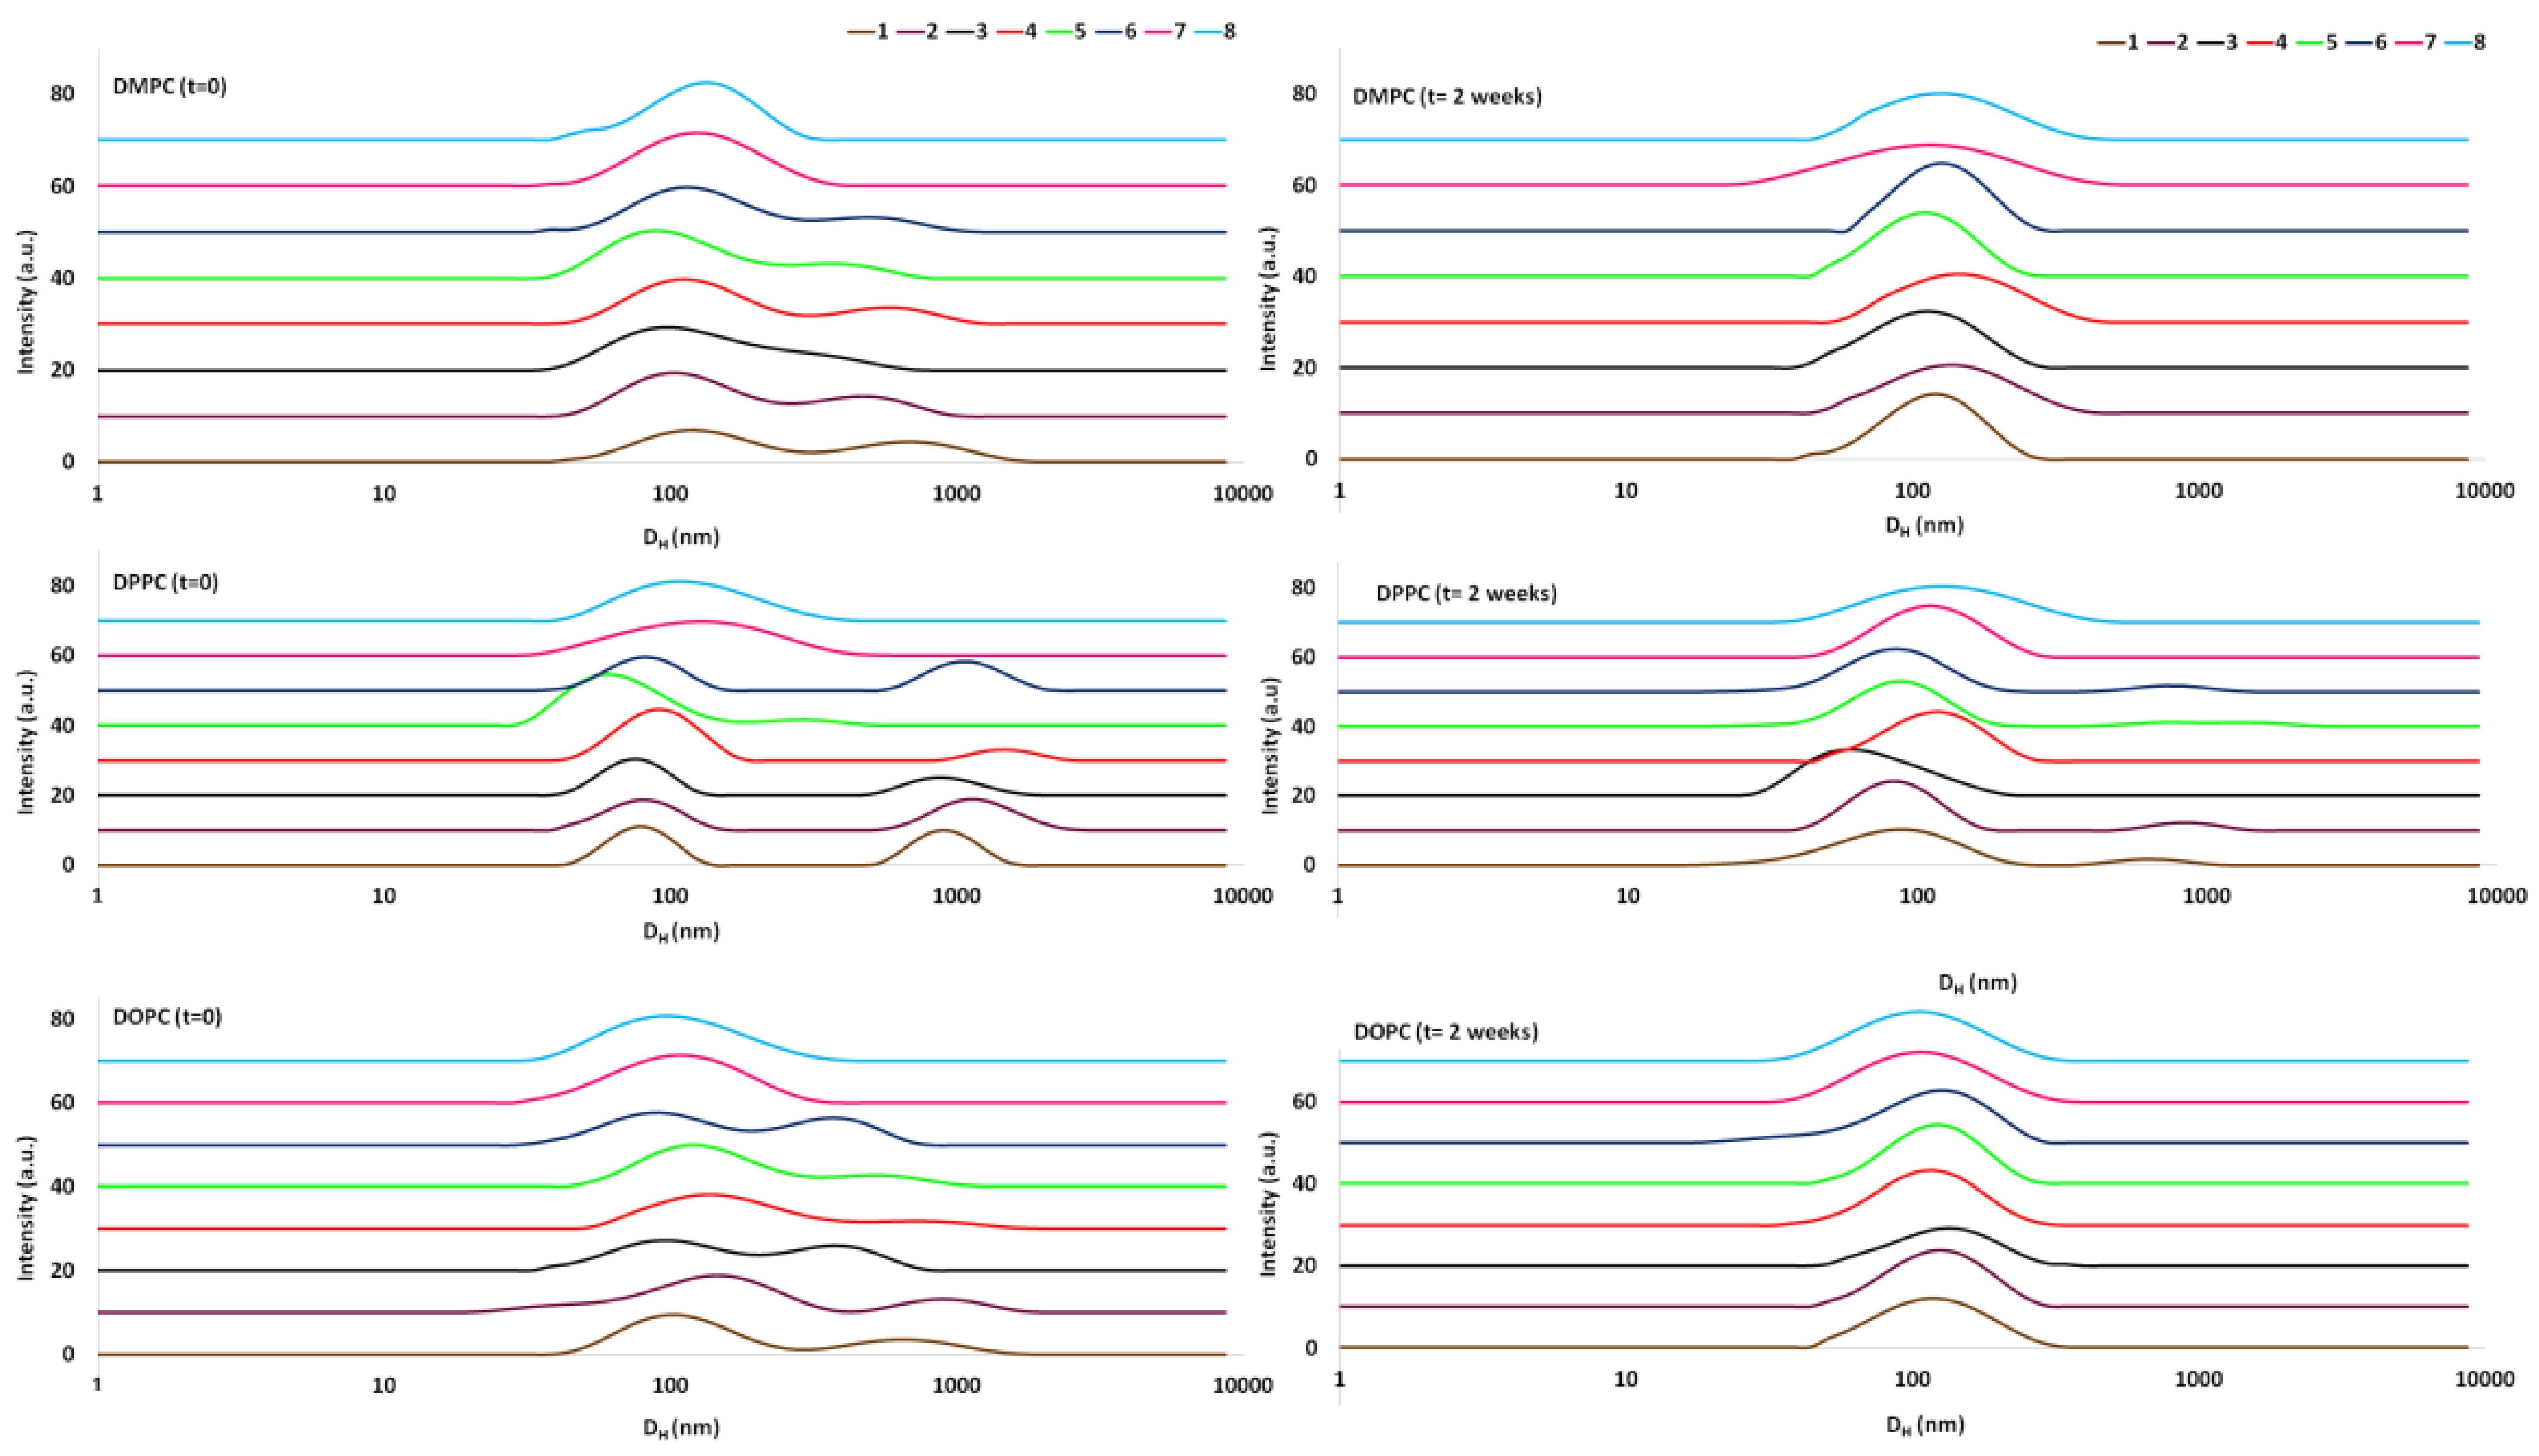
2.7. DLS Measurements
2.8. Differential Scanning Calorimetry
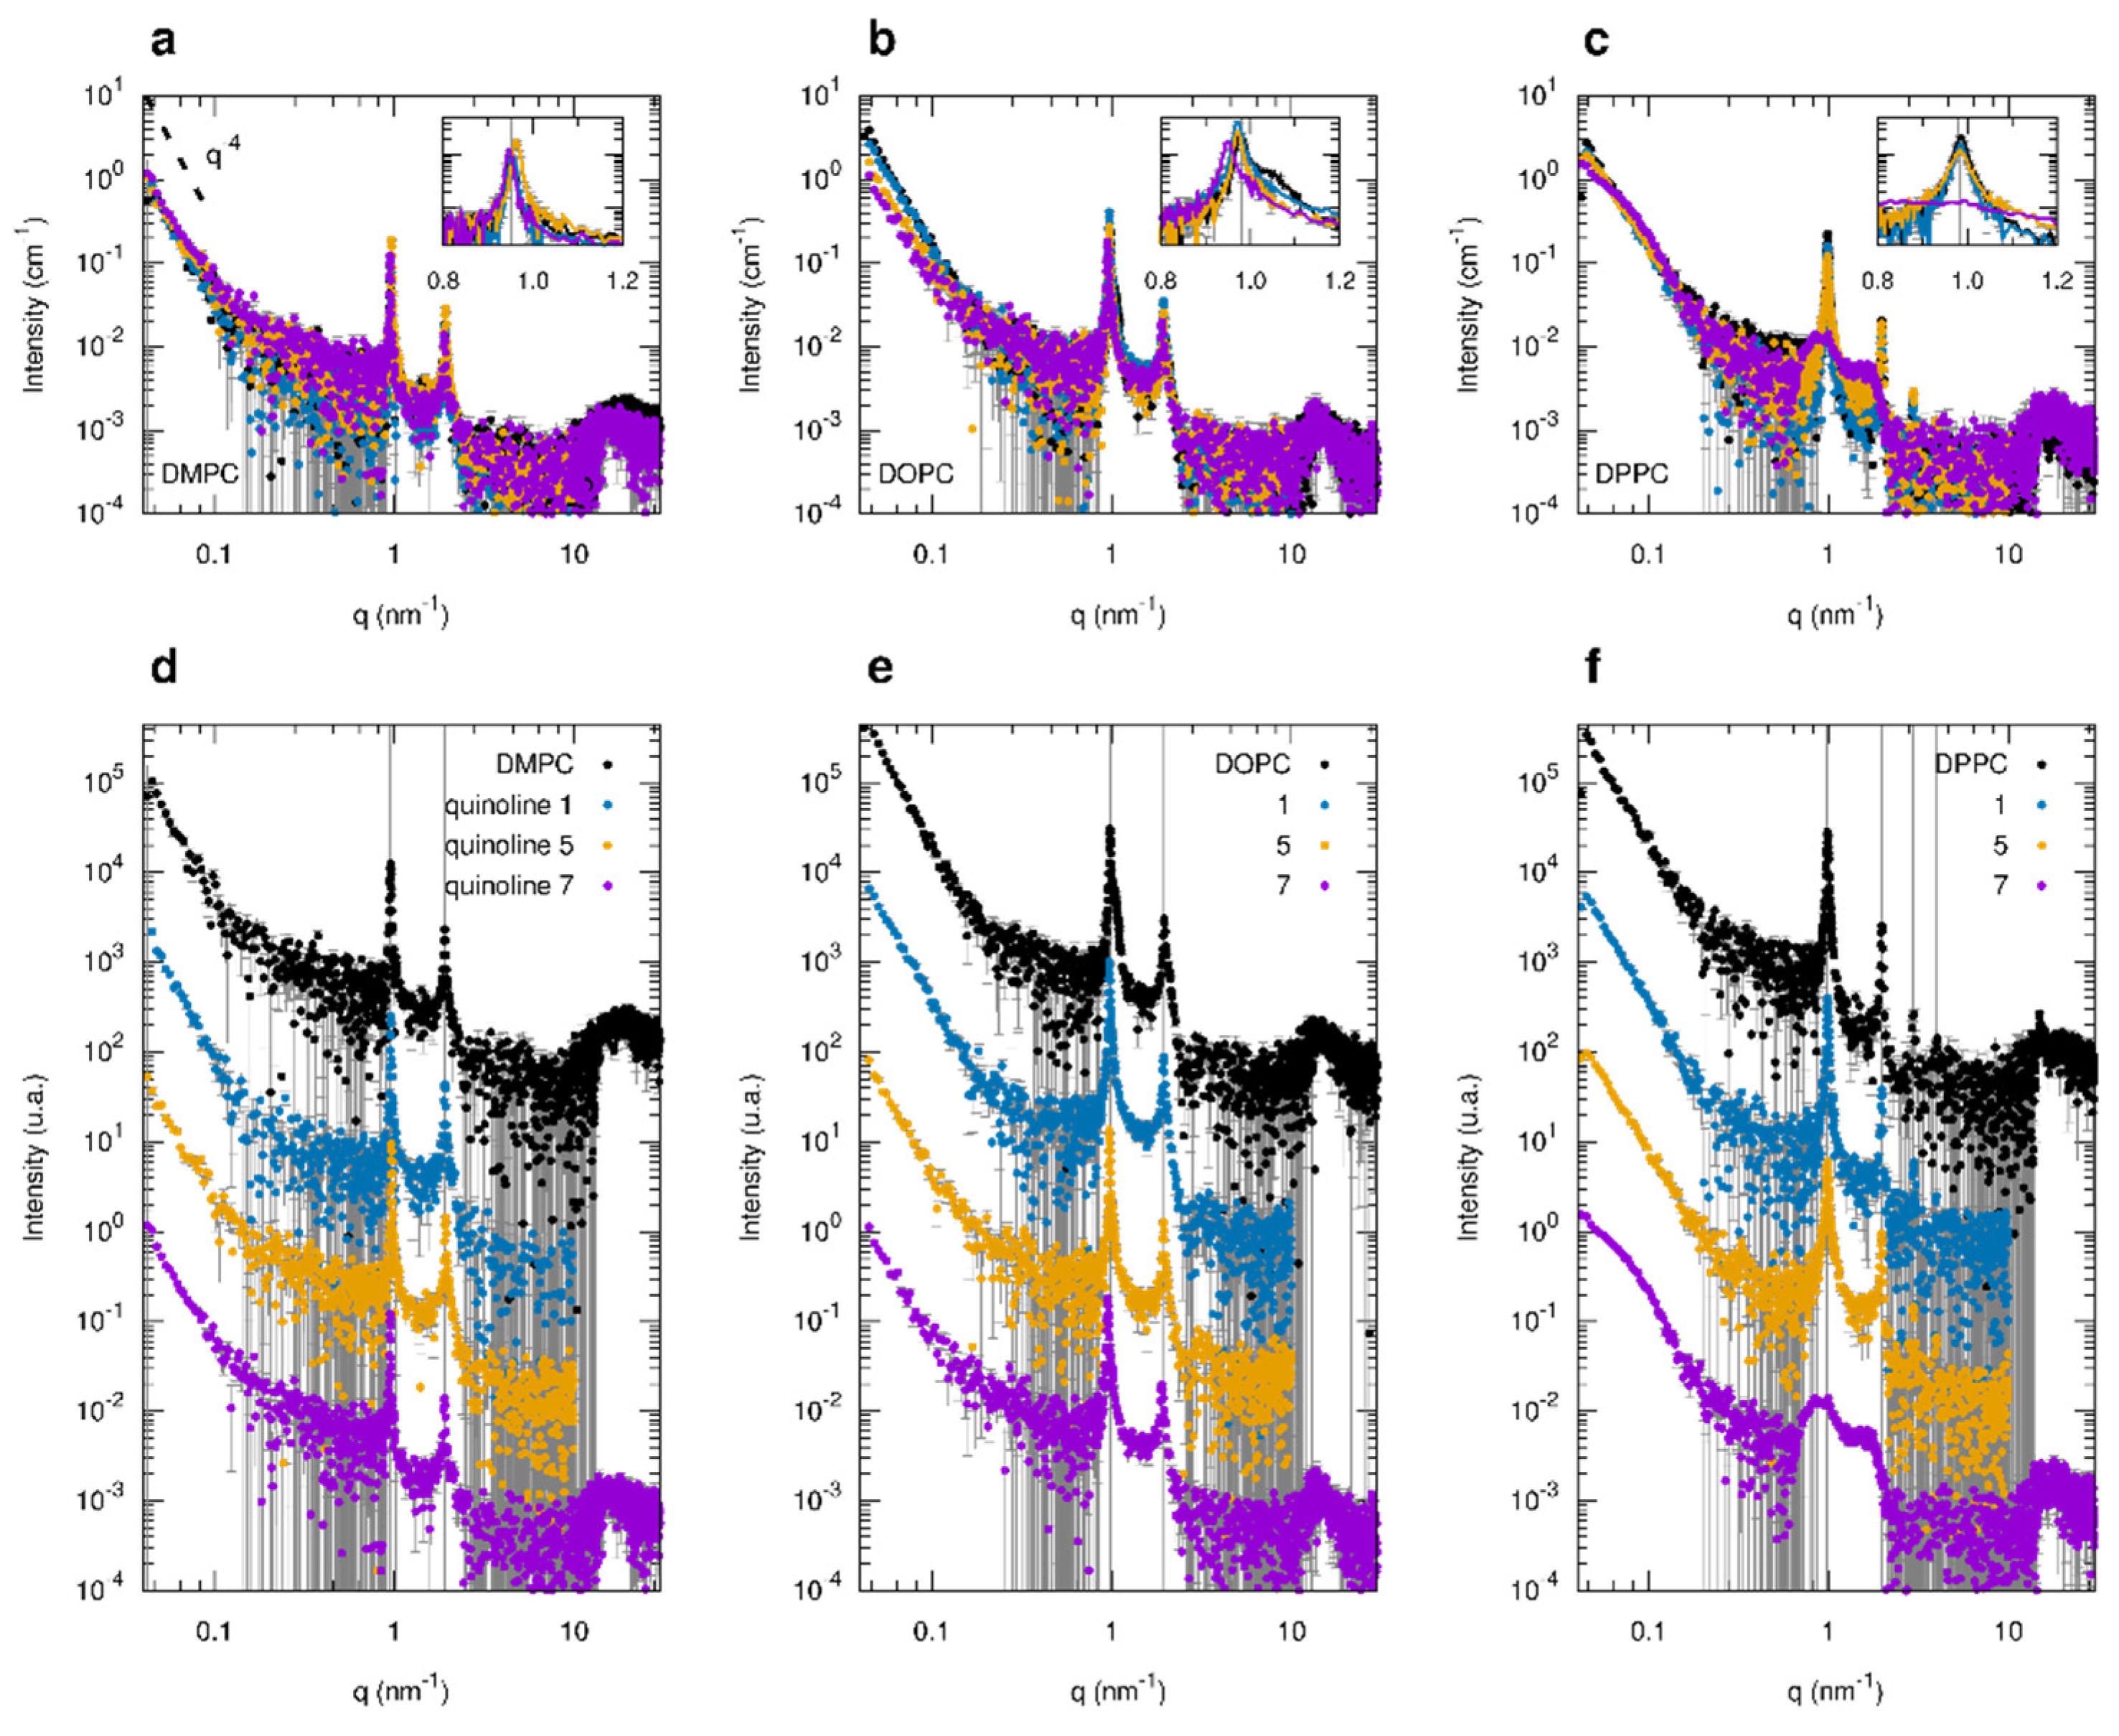
2.9. SAXS Analysis
3. Results and Discussion
3.1. Quinolines Characterization
3.2. Liposomes Properties
4. Conclusions
Supplementary Materials
Author Contributions
Funding
Data Availability Statement
Acknowledgments
Conflicts of Interest
References
- Marella, A.; Tanwar, O.P.; Saha, R.; Ali, M.R.; Srivastava, S.; Akhter, M.; Shaquiquzzaman, M.; Alam, M.M. Quinoline: A versatile heterocyclic. Saudi Pharm. J. 2013, 21, 1–12. [Google Scholar] [CrossRef] [Green Version]
- Rehan, M.; Hazra, G.; Ghorai, P. Synthesis of Polysubstituted Quinolines via Transition-Metal-Free Oxidative Cycloisomerization of o-Cinnamylanilines. Org. Lett. 2015, 17, 1668–1671. [Google Scholar] [CrossRef]
- Hall, D.G. Amines: Synthesis, Properties and Applications by Stephen, A. Lawrence (Mimas Ltd.). J. Am. Chem. Soc. 2005, 127, 9655–9658. [Google Scholar] [CrossRef]
- Höglund, I.P.J.; Silver, S.; Engström, M.T.; Salo, H.; Tauber, A.; Kyyrönen, H.-K.; Saarenketo, P.; Hoffrén, A.-M.; Kokko, K.; Pohjanoksa, K.; et al. Structure−Activity Relationship of Quinoline Derivatives as Potent and Selective α2C-Adrenoceptor Antagonists. J. Med. Chem. 2006, 49, 6351–6363. [Google Scholar] [CrossRef] [PubMed]
- Klingenstein, R.; Melnyk, P.; Leliveld, R.; Ryckebusch, A.; Korth, C. Similar Structure−Activity Relationships of Quinoline Derivatives for Antiprion and Antimalarial Effects. J. Med. Chem. 2006, 49, 5300–5308. [Google Scholar] [CrossRef]
- Ma, X.; Zhou, W.; Brun, R. Synthesis, in vitro antitrypanosomal and antibacterial activity of phenoxy, phenylthio or benzyloxy substituted quinolones. Bioorg. Med. Chem. Lett. 2009, 19, 986–989. [Google Scholar] [CrossRef] [PubMed]
- Kumar, S.; Bawa, S.; Drabu, S.; Panda, B.P. Design and synthesis of 2-chloroquinoline derivatives as non-azoles antimycotic agents. Med. Chem. Res. 2011, 20, 1340–1348. [Google Scholar] [CrossRef]
- Raynes, K.; Foley, M.; Tilley, L.; Deady, L.W. Novel bisquinoline antimalarials: Synthesis, antimalarial activity and inhibition of haem polymerisation. Biochem. Pharmacol. 1996, 52, 551–559. [Google Scholar] [CrossRef]
- Gomtsyan, A.; Bayburt, E.K.; Schmidt, R.G.; Zheng, G.Z.; Perner, P.J.; Didomenico, S.; Koenig, J.R.; Turner, S.; Jinkerson, T.; Drizin, I.; et al. Noveltransient receptor potential vanilloid 1 receptor antagonists for the treatment of pain: Structure–activity relationships for ureas with quinoline, isoquinoline, quinazoline, phthalazine, quinoxaline, and cinnoline moieties. J. Med. Chem. 2005, 48, 744–752. [Google Scholar] [CrossRef] [PubMed]
- Ghosh, J.; Swarup, V.; Saxena, A.; Das, S.; Hazra, A.; Paira, P.; Banerjee, S.; Mondal, N.B.; Basu, A. Therapeutic effect of a novel anilidoquinoline derivative, 2-(2-methyl-quinoline-4ylamino)-N-(2-chlorophenyl)-acetamide, in Japanese encephalitis: Correlation with in vitro neuroprotection. Int. J. Antimicrob. Agents 2008, 32, 349–354. [Google Scholar] [CrossRef] [PubMed]
- Scott, D.A.; Balliet, C.L.; Cook, D.J.; Davies, A.M.; Gero, T.W.; Omer, C.A.; Poondru, S.; Theoclitou, M.E.; Tyurin, B.; Zinda, M.J. Identification of 3-amido-4-anilinoquinolines as potent and selective inhibitors of CSF-1R kinase. Bioorg. Med. Chem. Lett. 2009, 19, 697–700. [Google Scholar] [CrossRef] [PubMed]
- Baba, A.; Kawamura, N.; Makino, H.; Ohta, Y.; Taketomi, S.; Sohda, T. Studies on Disease-Modifying Antirheumatic Drugs: Synthesis of Novel Quinoline and Quinazoline Derivatives and Their Anti-inflammatory Effect1. J. Med. Chem. 1996, 39, 5176–5182. [Google Scholar] [CrossRef] [PubMed]
- Smith, P.W.; Wyman, P.A.; Lovell, P.; Goodacre, C.; Serafinowska, H.T.; Vong, A.; Harrington, F.; Flynn, S.; Bradley, D.M.; Porter, R.; et al. New quinoline NK3 receptor antagonists with CNS activity. Bioorg. Med. Chem. Lett. 2009, 19, 837–840. [Google Scholar] [CrossRef]
- Yan, R.; Liu, X.; Pan, C.; Zhou, X.; Li, X.; Kang, X.; Huang, G. Aerobic Synthesis of Substituted Quinoline from Aldehyde and Aniline: Copper-Catalyzed Intermolecular C-H Active and C-C Formative Cyclization. Org. Lett. 2013, 15, 4876–4879. [Google Scholar] [CrossRef]
- Chung, P.Y.; Bian, Z.X.; Pun, H.Y.; Chan, D.; Chan, A.S.C.; Chui, C.H.; Tang, J.C.; Lam, K.H. Recent advances in research of natural and synthetic bioactive quinolines. Futur. Med. Chem. 2015, 7, 947–967. [Google Scholar] [CrossRef] [PubMed]
- Zhang, J.; Yang, P.L.; Gray, N.S. Targeting cancer with small molecule kinase inhibitors. Nat. Rev. Cancer 2009, 9, 28–39. [Google Scholar] [CrossRef] [PubMed]
- Dhanapal, R.; Perumal, P.T.; Damodiran, M.; Ramprasath, C. Synthesis of Quinoline Derivatives for Fluorescent Imaging Certain Bacteria. Bioorg. Med. Chem. Lett. 2012, 22, 6494–6497. [Google Scholar] [CrossRef] [PubMed]
- Alam, R.; Mistri, T.; Katarkar, A.; Chaudhuri, K.; Kumar Mandal, S.; Khuda-Bukhsh, A.R.; Das, K.K.; Ali, M. A novel chromo- and fluorogenic dual sensor for Mg2+ and Zn2+ with cell imaging possibilities and DFT studies. Analyst 2014, 139, 4022–4030. [Google Scholar] [CrossRef] [PubMed]
- Qin, J.C.; Yang, Z.Y.; Fan, L.; Wang, B.D. β-Hydroxy-α-naphthaldehyde [2-(quinolin-8′-yloxy) acetyl] hydrazone as an efficient fluorescent chemosensor for Mg2+. Spectrochim. Acta A Mol. Biomol. Spectrosc. 2015, 140, 21–26. [Google Scholar] [CrossRef]
- Bordunov, A.V.; Bradshaw, J.S.; Zhang, X.X.; Dalley, N.K.; Kou, X.; Reed, M.I. Synthesis and Properties of 5-Chloro-8-hydroxyquinoline-Substituted Azacrown Ethers: A New Family of Highly Metal Ion-Selective Lariat Ethers. Inorg. Chem. 1996, 35, 7229–7240. [Google Scholar] [CrossRef] [PubMed]
- Farruggia, G.; Iotti, S.; Prodi, L.; Montalti, M.; Zaccheroni, N.; Savage, P.B.; Trapani, V.; Sale, P.; Wolf, F.I. 8-Hydroxyquinoline Derivatives as Fluorescent Sensors for Magnesium in Living Cells. J. Am. Chem. Soc. 2006, 128, 344–350. [Google Scholar] [CrossRef]
- Katritzky, A.R.; Rees, C.W.; Scriven, E.F.V. Comprehensive Heterocyclic Chemistry II, 1st ed.; Pergamon Press: Oxford, UK, 1996; pp. 245–300. [Google Scholar]
- Jaromin, A.; Kozubek, A.; Suchoszek-Lukaniuk, K.; Malicka-Blaszkiewicz, M.; Peczynska-Czoch, W.; Kaczmarek, L. Liposomal Formulation of DIMIQ, Potential Antitumor Indolo[2,3-b]Quinoline Agent and Its Cytotoxicity on Hepatoma Morris 5123 Cells. Drug Deliv. 2008, 15, 49–56. [Google Scholar] [CrossRef] [PubMed]
- “Quinoline”, Encyclopædia Britannica, 11th ed.; Cambridge University Press: Cambridge, UK, 1922; p. 759.
- Koning, G.A.; Storm, G. Targeted drug delivery systems for the intracellular delivery of macromolecular drugs. Drug Discov. Today 2003, 8, 482–483. [Google Scholar] [CrossRef]
- Metselaar, J.M.; Storm, G. Liposomes in the treatment of inflammatory disorders. Expert Opin. Drug Deliv. 2005, 2, 465–476. [Google Scholar] [CrossRef] [PubMed]
- Ding, B.S.; Dziubla, T.; Shuvaev, V.V.; Muro, S.; Muzykantov, V.R. Advanced drug delivery systems that target the vascular endothelium. Mol. Interv. 2006, 6, 98–112. [Google Scholar] [CrossRef] [Green Version]
- Hua, S.; Wu, S.Y. The use of lipid-based nanocarriers for targeted pain therapies. Front. Pharmacol. 2013, 4, 143. [Google Scholar] [CrossRef] [Green Version]
- Akbarzadeh, A.; Rezaei-Sadabady, R.; Davaran, S.; Joo, S.W.; Zarghami, N.; Hanifehpour, Y.; Samiei, M.; Kouhi, M.; Nejati-Koshki, K. Liposome: Classification, preparation, and applications. Nanoscale Res. Lett. 2013, 8, 102. [Google Scholar] [CrossRef] [PubMed] [Green Version]
- Sharma, A.; Mayhew, E.; Straubinger, R.M. Antitumor effect of taxol-containing liposomes in taxol resistant murine tumor model. Cancer Res. 1993, 53, 5877–5881. [Google Scholar]
- Sharma, A.; Straubinger, R.M. Novel Taxol Formulations: Preparation and Characterization of Taxol-Containing Liposomes. Pharm. Res. 1994, 11, 889–896. [Google Scholar] [CrossRef]
- Crosasso, P.; Ceruti, M.; Brusa, P.; Arpicco, S.; Cattel, L. Preparation, characterization and properties of sterically stabilized paclitaxel-containing liposomes. J. Control. Release 2000, 63, 19–30. [Google Scholar] [CrossRef]
- Gogoi, S.; Shekarrao, K.; Duarah, A.; Bora, T.C.; Gogoi, S.; Boruah, R.C. A microwave promoted solvent-free approach to steroidal quinolines and their in vitro evaluation for antimicrobial activities. Steroids 2012, 77, 1438–1445. [Google Scholar] [CrossRef]
- Yang, Y.T.; Du, S.; Wang, S.; Jia, X.; Wang, X.; Zhang, X. Synthesis of new steroidal quinolines with antitumor properties. Steroids 2019, 151, 108465. [Google Scholar] [CrossRef] [PubMed]
- Shiro, T.; Fukaya, T.; Tobe, M. The chemistry and biological activity of heterocycle-fused quinolinone derivatives: A review. Eur. J. Med. Chem. 2015, 97, 397–408. [Google Scholar] [CrossRef] [PubMed]
- Battista, S.; Campitelli, P.; Galantini, L.; Köber, M.; Vargas-Nadal, G.; Ventosa, N.; Giansanti, L. Use of N-oxide and Cationic Surfactants to Enhance Antioxidant Properties of (+)-Usnic Acid Loaded Liposomes. Colloids Surfaces A 2019, 585, 124154. [Google Scholar] [CrossRef]
- Battista, S.; Maggi, M.A.; Bellio, P.; Galantini, L.; D’Archivio, A.A.; Celenza, G.; Colaiezzi, R.; Giansanti, L. Curcuminoids-loaded Liposomes: Influence of Lipid Composition on Their Physicochemical Properties and Efficacy as Delivery Systems. Colloids Surfaces A 2020, 597, 124759. [Google Scholar] [CrossRef]
- Battista, S.; Bellio, P.; Celenza, G.; Galantini, L.; Franceschini, I.; Mancini, G.; Giansanti, L. Correlation of Physicochemical and Antimicrobial Properties of Liposomes Loaded with (+)-Usnic Acid. ChemPlusChem 2020, 85, 1014–1021. [Google Scholar] [CrossRef]
- Marsicano, V.; Chiarini, M.; Marinelli, F.; Arcadi, A. Synthesis of Polycyclic Quinolines by Means of Brønsted Acid Mediated Reaction of β-(2-Aminophenyl)-α,β-Ynones with Ketones. Adv. Synth. Catal. 2019, 361, 2365–2370. [Google Scholar] [CrossRef]
- Arcadi, A.; Chiarini, M.; Di Giuseppe, S.; Marinelli, F. A New Green Approach to the Friedländer Synthesis of Quinolines. Synlett 2003, 2, 203–206. [Google Scholar] [CrossRef]
- Becke, A.D. A new mixing of Hartree–Fock and local density-functional theories. J. Chem. Phys. 1993, 98, 5648–5652. [Google Scholar] [CrossRef] [Green Version]
- Lee, C.; Yang, W.; Parr, R.G. Development of the Colle-Salvetti correlation-energy formula into a functional of the electron density. Phys. Rev. B 1988, 37, 785–789. [Google Scholar] [CrossRef] [PubMed] [Green Version]
- Runge, E.; Gross, E.K.U. Density-Functional Theory for Time-Dependent Systems. Phys. Rev. Lett. 1984, 52, 997–1000. [Google Scholar] [CrossRef]
- Tomasi, J.; Mennucci, B.; Cammi, R. Quantum Mechanical Continuum Solvation Models. Chem. Rev. 2005, 105, 2999–3094. [Google Scholar] [CrossRef] [PubMed]
- Frisch, M.J.; Trucks, G.W.; Schlegel, H.B.; Scuseria, G.E.; Robb, M.A.; Cheeseman, J.R.; Scalmani, G.; Barone, V.; Petersson, G.A.; Nakatsuji, H.; et al. Gaussian 09, Revision A.02; Gaussian, Inc.: Wallingford, UK, 2016. [Google Scholar]
- Sztucki, M.; Narayanan, T. Development of an ultra-small-angle X-ray scattering instrument for probing the microstructure and the dynamics of soft matter. J. Appl. Crystallogr. 2007, 40, s459–s462. [Google Scholar] [CrossRef] [Green Version]
- Pounraj, P.; Mohankumar, V.; Senthil Pandian, M.; Ramasamy, P. Donor functionalized quinoline based organic sensitizers for dyesensitized solar cell (DSSC) applications: DFT and TD-DFT investigation. J. Mol. Model. 2018, 24, 343–366. [Google Scholar] [CrossRef]
- Fazal, E.; Jasinski, J.P.; Anderson, B.J.; Kaur, M.; Nagarajan, S.; Sudha, B.S. Synthesis, Crystal and Molecular Structure Studies and DFT Calculations of Phenyl Quinoline-2-Carboxylate and 2-Methoxyphenyl Quinoline-2-Carboxylate: Two New Quinoline-2 Carboxylic Derivatives. Crystals 2015, 5, 100–115. [Google Scholar] [CrossRef] [Green Version]
- Hathout, R.M.; Mansour, S.; Mortada, N.D.; Guinedi, A.S. Liposomes as an Ocular Delivery System for Acetazolamide: In Vitro and In Vivo Studies. AAPS PharmSciTech 2007, 8, E1–E12. [Google Scholar] [CrossRef]
- Ma, Q.H.; Hao, X.Z.; Zhou, H.F.; Gu, N. Effect of Surfactants on Preparation and Skin Penetration of Tea Polyphenols Liposomes. In Proceedings of the IEEE/ICME International Conference on Complex Medical Engineering, Beijing, China, 23–27 May 2007; pp. 209–212. [Google Scholar]
- Santo, I.E.; Campardelli, R.; Albuquerque, E.C.; de Melo, S.V.; Della Porta, G.; Reverchon, E. Liposomes preparation using a supercritical fluid assisted continuous process. Chem. Eng. J. 2014, 249, 153–159. [Google Scholar] [CrossRef]
- Otake, K.; Shimomura, T.; Goto, T.; Imura, T.; Furuya, T.; Yoda, S.; Takebayashi, Y.; Sakai, H.; Abe, M. Preparation of Liposomes Using an Improved Supercritical Reverse Phase Evaporation Method. Langmuir 2006, 22, 2543–2550. [Google Scholar] [CrossRef]
- Drazenovic, J.; Wang, H.; Roth, K.; Zhang, J.; Ahmed, S.; Chen, Y.; Bothun, G.; Wunder, S.L. Effect of lamellarity and size on calorimetric phase transitions in single component phosphatidylcholine vesicles. Biochim. Biophys. Acta 2015, 1848, 532–543. [Google Scholar] [CrossRef] [Green Version]
- Sturtevant, J.M. A scanning calorimetric study of small molecule-lipid bilayer mixtures. Prot. Natl. Acad. Sci. USA 1982, 79, 3963–3967. [Google Scholar] [CrossRef] [Green Version]
- Castile, J.D.; Taylor, K.M.G.; Buckton, G. A high sensitivity differential scanning calorimetry study of the interaction between poloxamers and dimyristoylphosphatidylcholine and dipalmitoylphosphatidylcholine liposomes. Int. J. Pharm. 1999, 182, 101–110. [Google Scholar] [CrossRef]
- Bakonyi, M.; Berko’, S.; Budai-Szücs, M.; Kovács, A.; Csányi, E. DSC for evaluating the encapsulation efficiency of lidocaine loaded liposomes compared to the ultracentrifugation method. J. Therm. Anal. Calorim. 2017, 130, 1619–1625. [Google Scholar] [CrossRef]
- Ali, S.; Minchey, S.; Janoff, A.; Mayhew, E. A Differential Scanning Calorimetry Study of Phosphocholines Mixed with Paclitaxel and Its Bromoacylated Taxanes. Biophys. J. 2000, 78, 246–256. [Google Scholar] [CrossRef] [Green Version]
- Di Foggia, M.; Bonora, S.; Tinti, A.; Tugnoli, V. DSC and Raman study of DMPC liposomes in presence of Ibuprofen at different pH. J. Therm. Anal. Calorim. 2017, 127, 1407–1417. [Google Scholar] [CrossRef]
- Biltonen, R.L.; Lichtenberg, D. The use of differential scanning calorimetry as a tool to characterize liposome preparations. Chem. Phys. Lipids 1993, 64, 129–142. [Google Scholar] [CrossRef]
- Sklar, L.A.; Miljanich, G.P.; Dratz, E.A. Phospholipid Lateral Phase Separation and the Partition of Cis-Parinaric Acid and Trans-Parinaric Acid Among Aqueous, Solid Lipid, and Fluid Lipid Phases. Biochemistry 1979, 18, 1707–1716. [Google Scholar] [CrossRef] [PubMed]
- Jain, S.; Jain, V.; Mahajan, S.C. Lipid Based Vesicular Drug Delivery Systems. Adv. Pharm. 2014. [Google Scholar] [CrossRef] [Green Version]


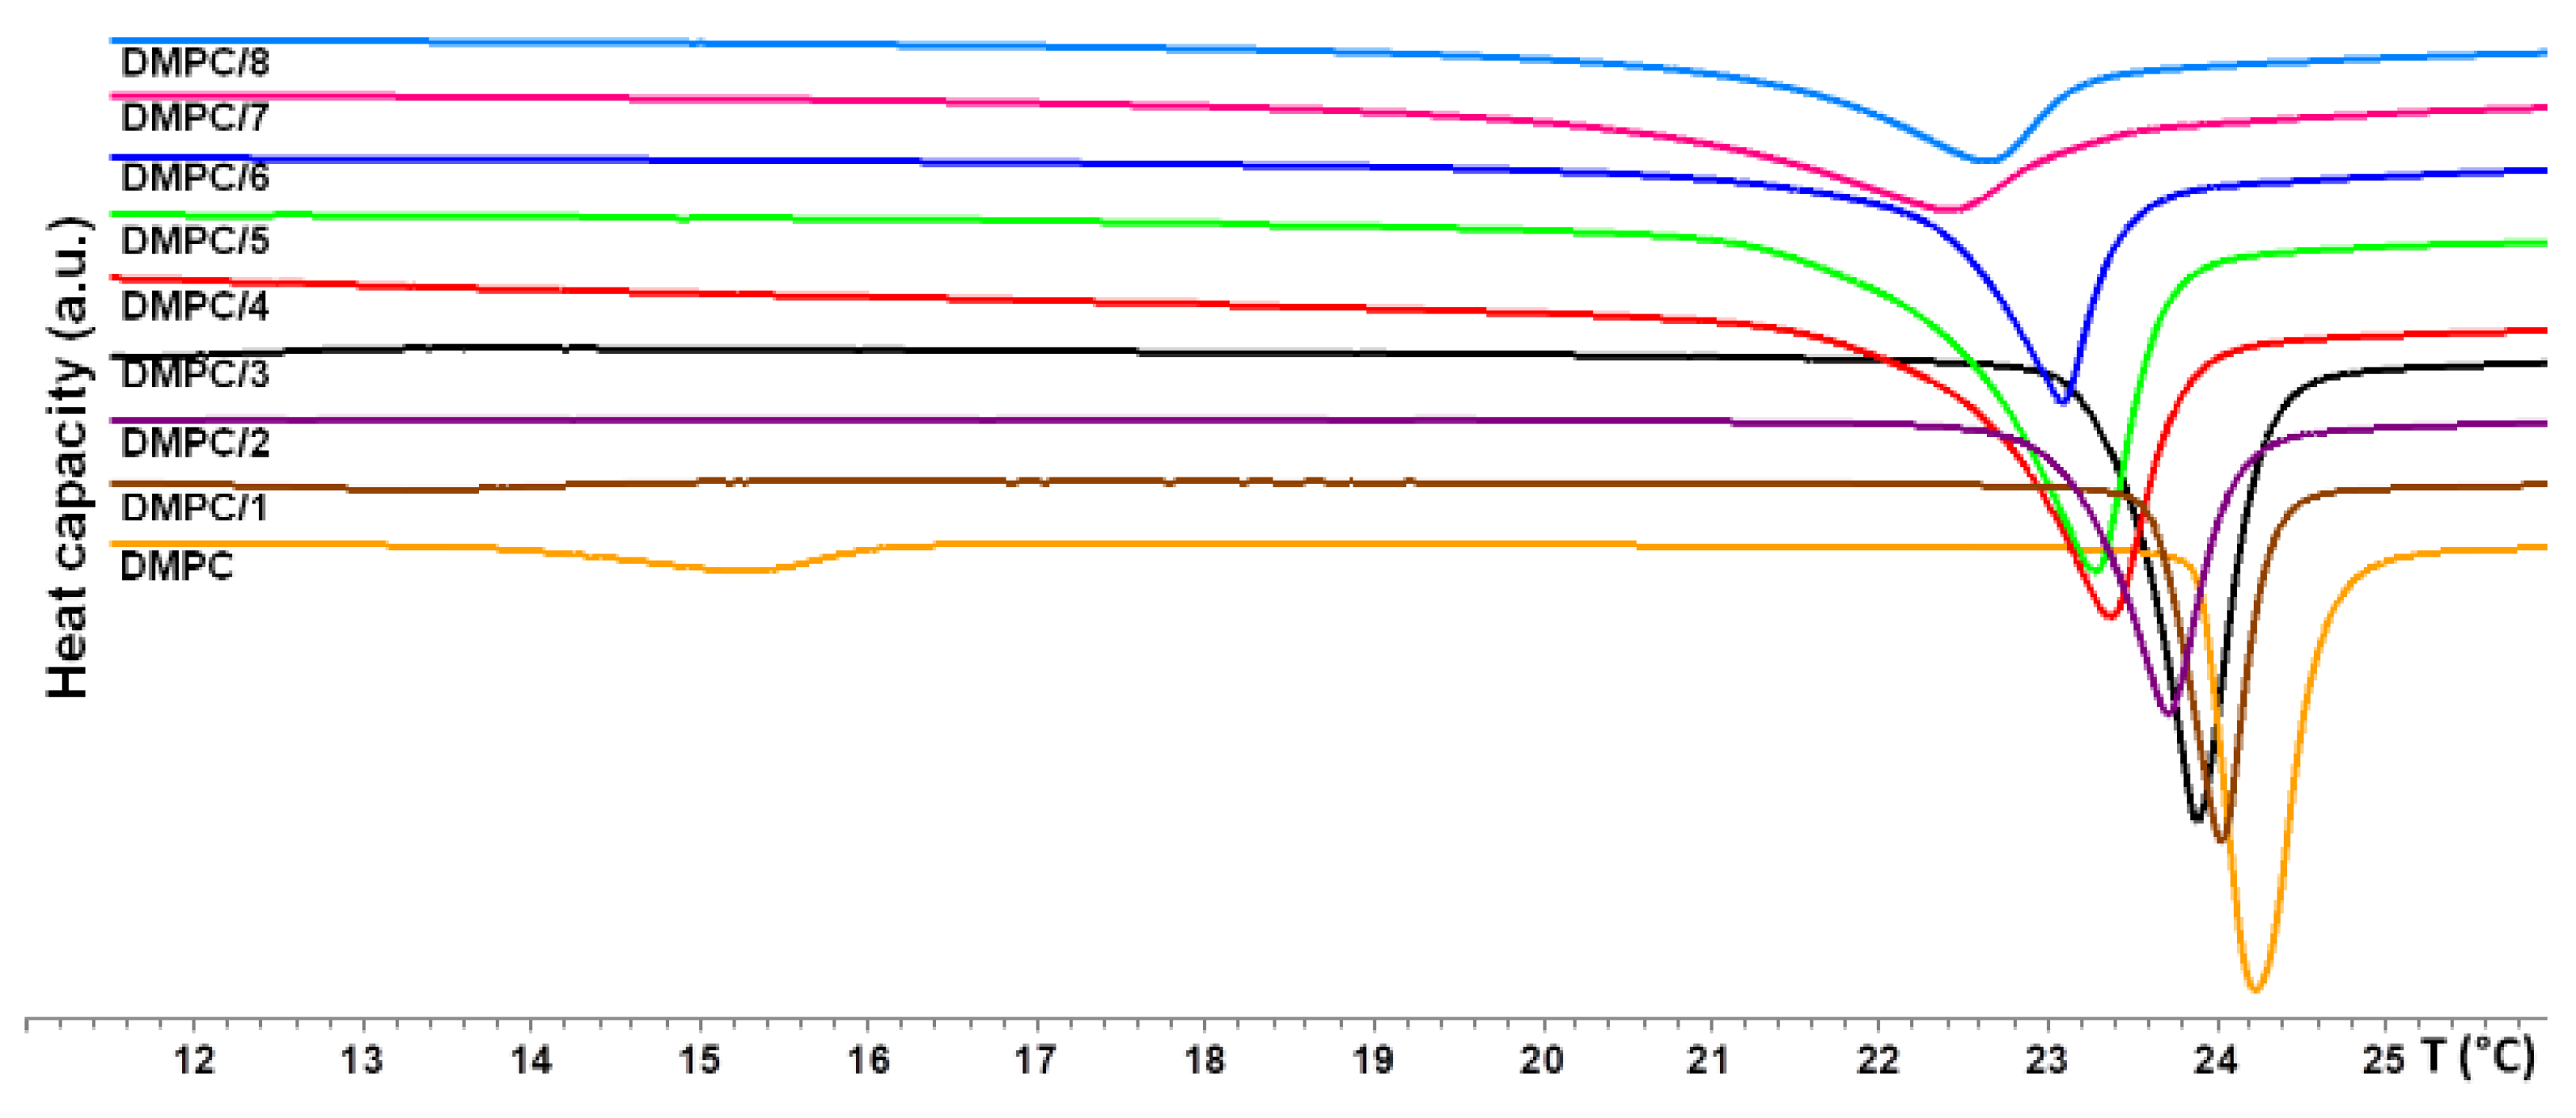
| Formulation | Tm (°C) | ΔHm (kJ/mol) | CU |
|---|---|---|---|
| DMPC | 24.1 | 19.3 | 82 |
| DMPC + 1 | 24.0 | 18.6 | 81 |
| DMPC + 2 | 23.7 | 17.7 | 75 |
| DMPC + 3 | 23.9 | 16.9 | 77 |
| DMPC + 4 | 23.4 | 24.4 | 36 |
| DMPC + 5 | 23.3 | 28.0 | 45 |
| DMPC + 6 | 23.1 | 17.0 | 56 |
| DMPC + 7 | 22.4 | 17.0 | 22 |
| DMPC + 8 | 22.6 | 12.0 | 29 |
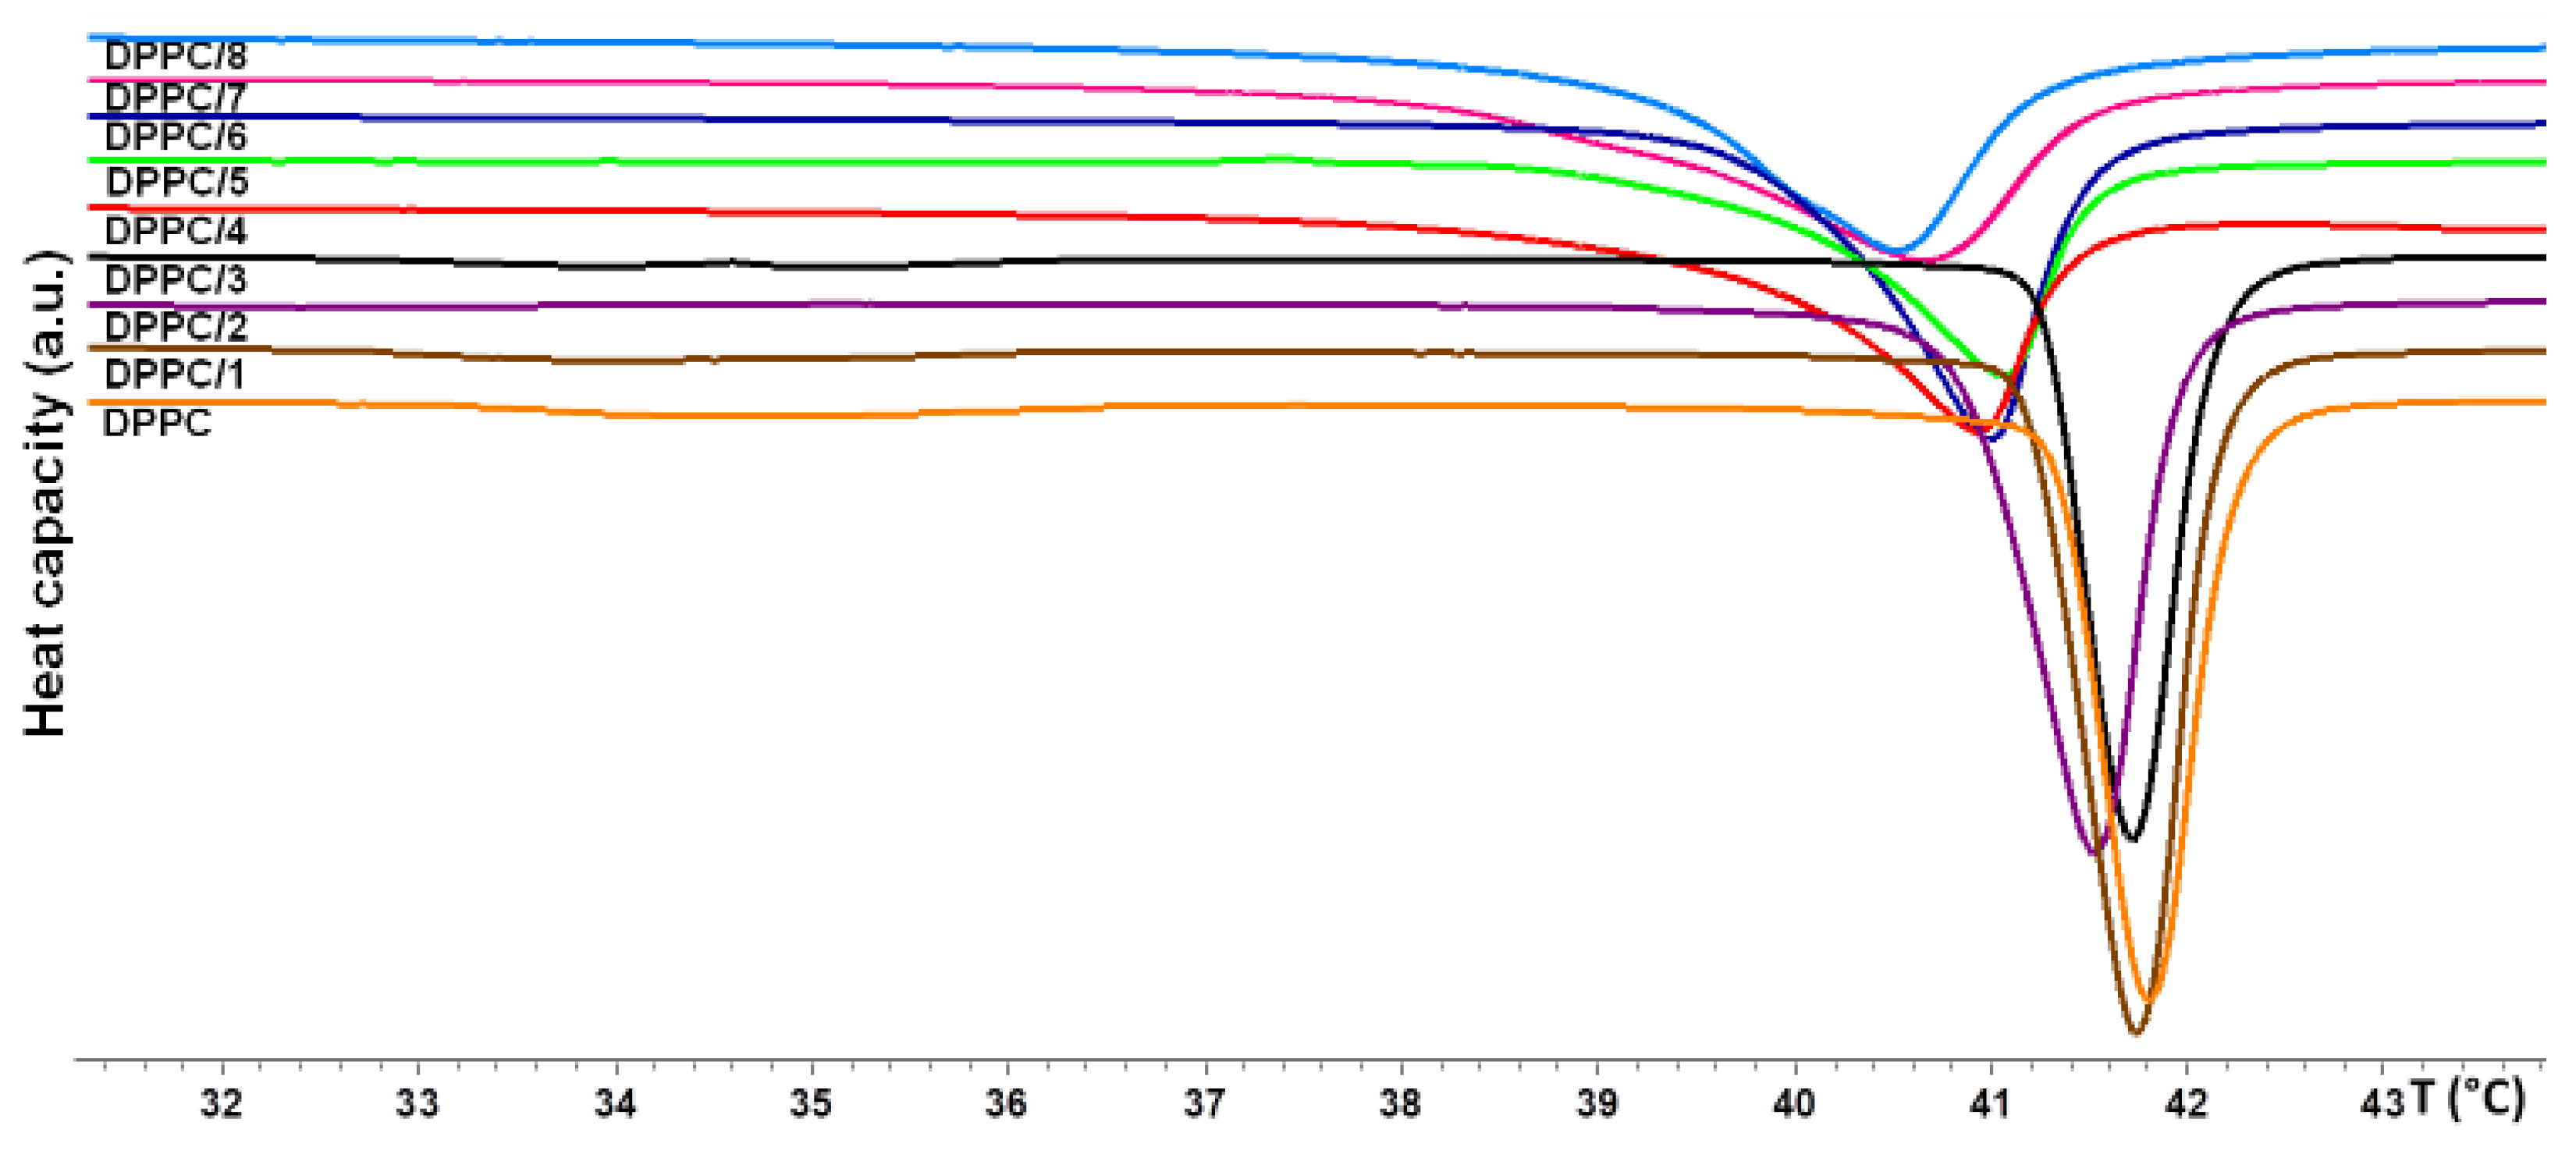
| Formulation | Tm (°C) | ΔHm (kJ/mol) | CU |
|---|---|---|---|
| DPPC | 41.7 | 30.5 | 88 |
| DPPC + 1 | 41.6 | 36.2 | 74 |
| DPPC + 2 | 41.4 | 34.4 | 76 |
| DPPC + 3 | 41.6 | 35.6 | 78 |
| DPPC + 4 | 40.8 | 17.5 | 86 |
| DPPC + 5 | 41.0 | 18.6 | 80 |
| DPPC + 6 | 40.9 | 26.5 | 61 |
| DPPC + 7 | 40.6 | 22.4 | 44 |
| DPPC + 8 | 40.5 | 22.0 | 52 |
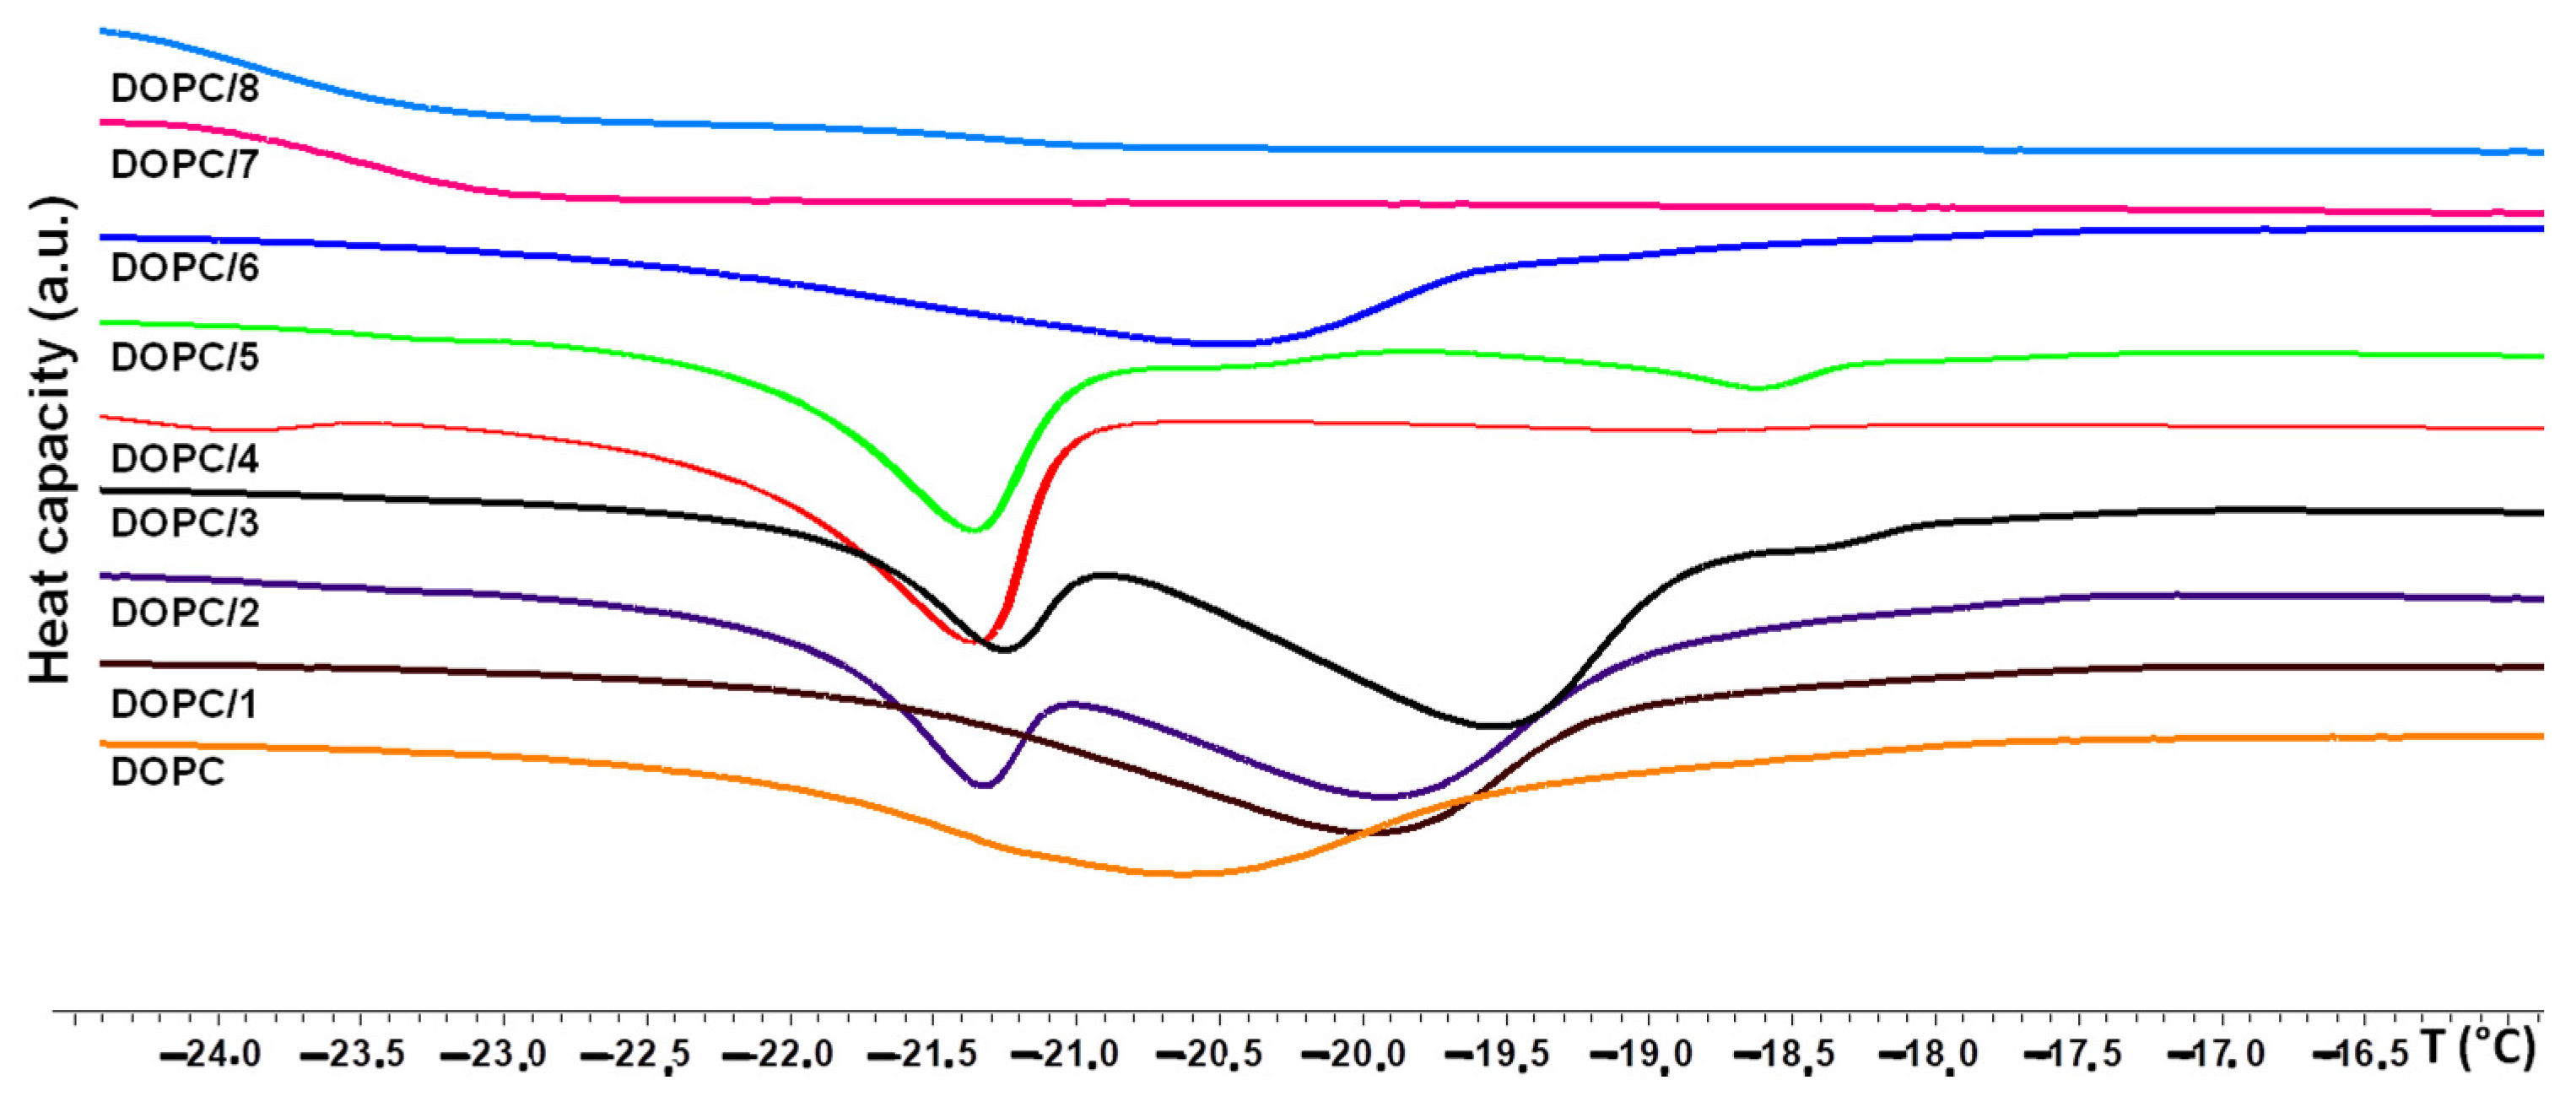
| Formulation | Tm (°C) | ΔHm (kJ/mol) | CU |
|---|---|---|---|
| DOPC | −20.6 | 17.2 | 20 |
| DOPC + 1 | −19.8 | 21.8 | 13 |
| DOPC + 2 | −19.8 * | 21.5 | - |
| DOPC + 3 | −19.6 * | 19.0 | - |
| DOPC + 4 | −21.2 | 26.7 | 30 |
| DOPC + 5 | −21.2 | 23.8 | 29 |
| DOPC + 6 | −20.5 | 16.0 | 13 |
| DOPC + 7 | −22.8 | 7.6 | - |
| DOPC + 8 | −23.0 | 7.9 | - |
Publisher’s Note: MDPI stays neutral with regard to jurisdictional claims in published maps and institutional affiliations. |
© 2021 by the authors. Licensee MDPI, Basel, Switzerland. This article is an open access article distributed under the terms and conditions of the Creative Commons Attribution (CC BY) license (https://creativecommons.org/licenses/by/4.0/).
Share and Cite
Battista, S.; Marsicano, V.; Arcadi, A.; Galantini, L.; Aschi, M.; Allegritti, E.; Del Giudice, A.; Giansanti, L. UV Properties and Loading into Liposomes of Quinoline Derivatives. Colloids Interfaces 2021, 5, 28. https://0-doi-org.brum.beds.ac.uk/10.3390/colloids5020028
Battista S, Marsicano V, Arcadi A, Galantini L, Aschi M, Allegritti E, Del Giudice A, Giansanti L. UV Properties and Loading into Liposomes of Quinoline Derivatives. Colloids and Interfaces. 2021; 5(2):28. https://0-doi-org.brum.beds.ac.uk/10.3390/colloids5020028
Chicago/Turabian StyleBattista, Sara, Vincenzo Marsicano, Antonio Arcadi, Luciano Galantini, Massimiliano Aschi, Elena Allegritti, Alessandra Del Giudice, and Luisa Giansanti. 2021. "UV Properties and Loading into Liposomes of Quinoline Derivatives" Colloids and Interfaces 5, no. 2: 28. https://0-doi-org.brum.beds.ac.uk/10.3390/colloids5020028